Initiation and Structure of MJO Disturbances in ...
12
Initiation and Structure of MJO Disturbances in Observations and a Superparameterized GCM Simulation Doctoral Preliminary Examination Research Prospectus James J. Benedict Department of Atmospheric Science Colorado State University Advisor David A. Randall Doctoral Committee Wayne H. Schubert David W. J. Thompson Jorge A. Ramirez (Civil Engineering) April 2006
Transcript of Initiation and Structure of MJO Disturbances in ...

Initiation and Structure of MJO Disturbances in Observations and a Superparameterized GCM Simulation
Doctoral Preliminary Examination Research Prospectus
James J. BenedictDepartment of Atmospheric Science
Colorado State University
AdvisorDavid A. Randall
Doctoral CommitteeWayne H. Schubert
David W. J. Thompson
Jorge A. Ramirez (Civil Engineering)
April 2006
0
1. Background and Motivation
The Tropics act as an engine that drives global atmospheric circulation patterns. Greater
than one-third of Earth’s precipitation falls within 15° of the Equator, and three-fourths of the
total energy fueling planetary-scale atmospheric circulations is derived from tropical latent heat
release as clouds and precipitation form (Simpson et al. 1988, Kummerow et al. 2000). Cloud
systems are ubiquitous in the Tropics and are a critical component in the local and global energy
budgets. Clouds are not only involved in latent heat release, they also alter the three-dimensional
(3D) distribution of radiation absorption and emission. A firm understanding of tropical
atmospheric variability and its structure is therefore necessary for a wide range of weather and
climate studies.
Tropical precipitating systems are organized into several wave types with characteristic
space and time scales (Matsuno 1966, Wheeler and Kiladis 1999). One such atmospheric
disturbance is the Madden-Julian Oscillation (MJO; Madden and Julian 1994). The MJO is
characterized by a slow (5 m/s) eastward propagation of anomalous deep convection and its
associated Kelvin-Rossby wave response in the Indian and West Pacific Ocean areas. Although
the disturbance tends to weaken near the dateline as deep convection decouples from the wave
dynamics, its signal often continues eastward as a fast-moving (15-50 m/s) dry Kelvin wave (Lin
et al. 2005). The MJO dominates atmospheric variability within the equatorial regions on
intraseasonal (20-100 day) timescales (Wheeler and Kiladis 1999) and involves numerous
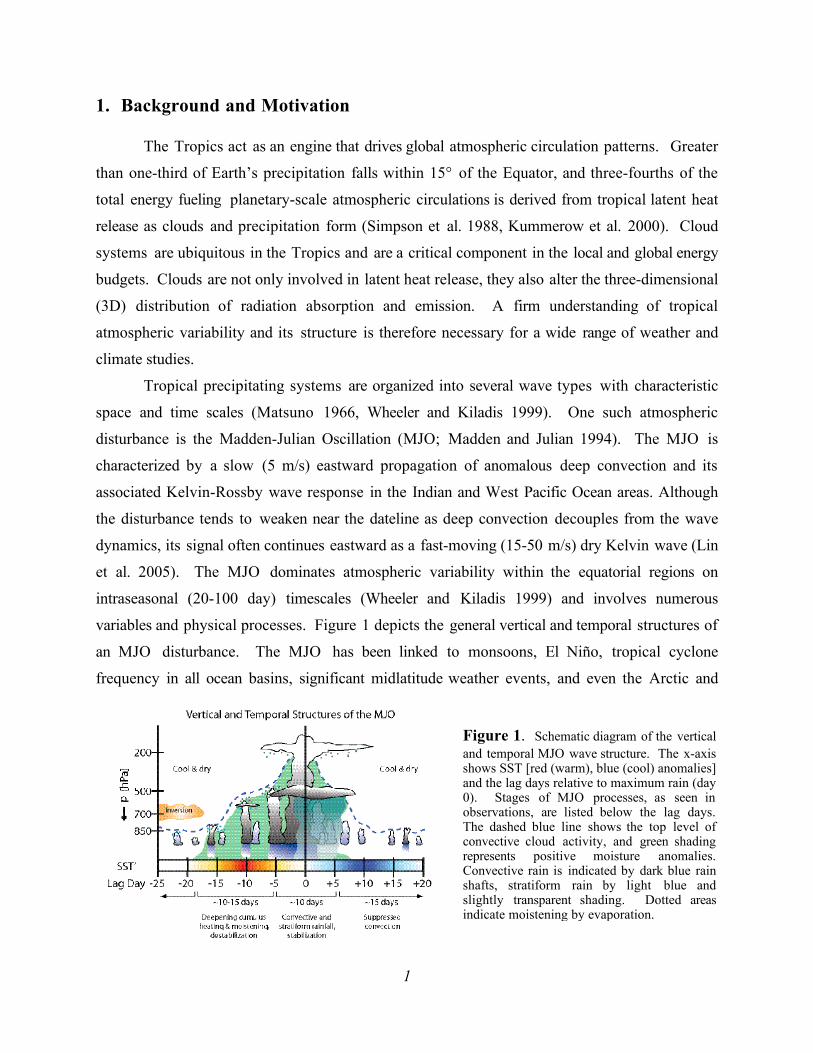
variables and physical processes. Figure 1 depicts the general vertical and temporal structures of
an MJO disturbance. The MJO has been linked to monsoons, El Niño, tropical cyclone
frequency in all ocean basins, significant midlatitude weather events, and even the Arctic and
Anta
1
Figure 1. Schematic diagram of the vertical and temporal MJO wave structure. The x-axis shows SST [red (warm), blue (cool) anomalies] and the lag days relative to maximum rain (day 0). Stages of MJO processes, as seen in observations, are listed below the lag days. The dashed blue line shows the top level of convective cloud activity, and green shading represents positive moisture anomalies. Convective rain is indicated by dark blue rain shafts, stratiform rain by light blue and slightly transparent shading. Dotted areas indicate moistening by evaporation.

Antarctic Oscillations (see review in Lin et al. 2005). Clearly, regional fluctuations within the
tropical atmosphere, especially those on intraseasonal timescales, can have widespread dynamic
and thermodynamic impacts.
Unfortunately, and despite recent improvements in current general circulation models
(GCMs), realistic simulations of tropical intraseasonal variability remain elusive. A recent model
intercomparison report by Lin et al. (2005) concluded that, compared to observations, most of
the 14 model simulations examined had spectral peaks associated with the MJO that were either
grossly underestimated or indistinguishable from the spectral power in other frequency bands.
The study pointed out, however, that even a reasonable MJO spectral signature does not
guarantee that the disturbance's physical structure is realistic. Additionally, the choice of
parameterization scheme—semiempirical statistical theories governing how subgrid-scale
processes manifest themselves on the resolved grid—might produce more desirable results for
one attribute (e.g., MJO signal) but unwanted results for others (e.g., annual rainfall).
The combination of a poor representation of intraseasonal variability in most GCMs and
a lack of comprehensive understanding of several of its mechanisms highlights the need for
continued research of the MJO. This study aims to address both of these issues through an
analysis of (a) the wave structure of the MJO as seen in a simulation from a GCM with a
realistic MJO spectral signal, (b) the atmospheric behavior preceding the development of
intraseasonal convective events using parcel trajectory and statistical methods, and (c) the vertical
and temporal structure of the departing MJO deep convective phase using observational data
obtained during the Tropical Warm Pool International Cloud Experiment (TWP-ICE; May et al.
2006). These objectives are expected to advance our knowledge of the MJO and contribute
uniquely to improved simulations of tropical intraseasonal variability.
2. Primary Scientific ObjectivesDetails of the proposed research endeavors are as follows:
Objective AAs part of the first objective we will examine 16 years of simulated daily data from a
realistic, full-physics global circulation model (GCM) with an embedded cloud-resolving model
(CRM) (Khairoutdinov et al. 2005). The GCM employed here is the National Center for
Atmospheric Research (NCAR) Community Atmosphere Model (CAM), with a 312 km
horizontal resolution, 26 vertical levels, a 30-60 minute time step, and a semi-Lagrangian
2
dynamical core. Positioned within each CAM grid cell is a CRM with 64 grid columns oriented
west-east (4 km resolution), 24 vertical levels, periodic lateral boundaries, and a 20-second time
step. Unlike traditional GCMs that parameterize many small-scale physical features, inclusion
of the embedded CRM allows the explicit simulation of fine-scale cloud and boundary-layer
processes in a set-up termed “superparameterization” (SP-CAM; Khairoutdinov et al. 2005).
As mentioned in Section 1, previous model intercomparison studies have focused only on
basic statistical results, such as spectral power in zonal wavenumber-frequency space and
variances calculated from filtered atmospheric variables over a few years (Slingo et al. 1996, Lin
et al. 2005). Using spectral characteristics to grade and compare GCMs conveniently
summarizes intraseasonal variability, but examining space-time wave structures as proposed here
is equally important. A comparison of intraseasonal variability and structure between the SP-
CAM and observations will highlight deficiencies in the model. Knowledge of these deficiencies
and the physical processes related to them will enhance our understanding of the MJO and will
ultimately lead to more accurate simulations of weather and climate.
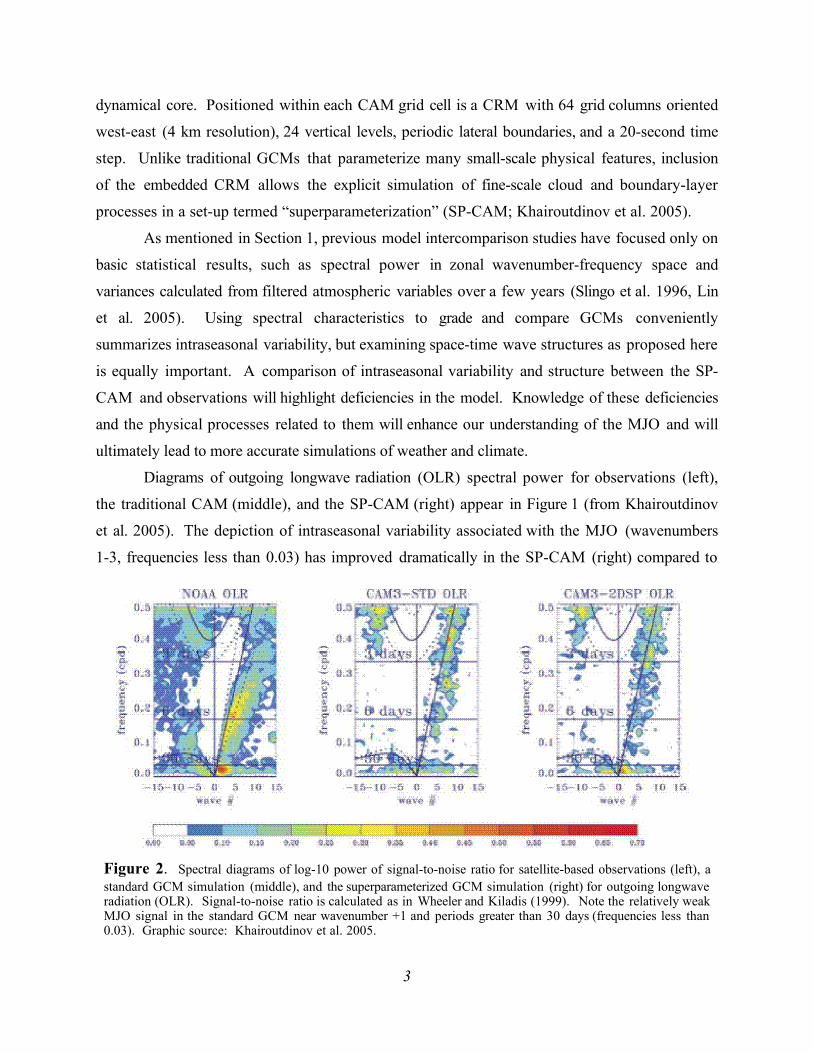
Diagrams of outgoing longwave radiation (OLR) spectral power for observations (left),
the traditional CAM (middle), and the SP-CAM (right) appear in Figure 1 (from Khairoutdinov
et al. 2005). The depiction of intraseasonal variability associated with the MJO (wavenumbers
1-3, frequencies less than 0.03) has improved dramatically in the SP-CAM (right) compared to
the
3
Figure 2. Spectral diagrams of log-10 power of signal-to-noise ratio for satellite-based observations (left), a standard GCM simulation (middle), and the superparameterized GCM simulation (right) for outgoing longwave radiation (OLR). Signal-to-noise ratio is calculated as in Wheeler and Kiladis (1999). Note the relatively weak MJO signal in the standard GCM near wavenumber +1 and periods greater than 30 days (frequencies less than 0.03). Graphic source: Khairoutdinov et al. 2005.

the standard CAM (middle) in light of the observations. This raises several related questions:
i. What does the physical wave structure as seen in various simulated atmospheric fields
look like?
ii. Does an improved spectral signature of the MJO in the SP-CAM correspond to a
realistic depiction of the dynamic and thermodynamic wave structure as compared to
observations?
iii. Aside from the fundamental spectral features displayed in Fig. 1, do the simulated
MJO events resemble observations in terms of distinct wave structures based on
season, geographic location, and relative intensity? Significant structural differences
of this type are noted in the observations (Kiladis et al. 2005).
iv. Is the simulated data realistic enough to extend the analysis and investigate MJO
triggering mechanisms based on parcel trajectory and other statistical methods?
The answers to these questions will aid in assessing the reliability and accuracy of the SP-CAM
and perhaps the SP theory in general. Deficiencies in the resulting SP-CAM intraseasonal wave
structure will provide some insight into the appropriateness and effectiveness of the model set-
up (specific parameterizations used, orientation and other details of the CRM, etc.).
Objective BWe will investigate the initiation of intraseasonal convective events using parcel trajectory
and other statistical analyses as part of the second scientific objective. Analysis of this type as
applied to the MJO has not been undertaken in previous studies. The initiation of MJO-related
deep convection and its irregular periodicity remain a challenging, wide-debated yet unresolved
issue within the atmospheric and oceanic sciences. Proposed theories are differentiated based on
the origin of the forcing that initiates the MJO-like disturbance and the state of the tropical
environment in which the forcing acts. The four leading theories of wave triggering, depicted
schematically in Figure 3, are:
1. Extratropical forcing from wave trains impinging on the Tropics (e.g., Matthews and
Kiladis 1999)
2. Forcing from an upper tropospheric Kelvin wave circumnavigating the globe (e.g.,
Knutson and Weickmann 1987)
3. Time-dependent localized destabilization, the “discharge-recharge” theory (e.g., Bladé
4

and Hartmann 1993)
4. Local stochastic forcing (e.g., Yu and Neelin 1994)
Whether one, several, or all of these mechanisms participate in the initiation of an intraseasonal
oscillation remains unclear.
Examination of parcel trajectories in the days leading up to the formation of an MJO
convective event will show the parcel origins as well as the general flow pattern. Questions to be
addressed include:
i. For parcels located in the immediate vicinity of a developing MJO disturbance, what
were their (3D) spatial locations several days before?
ii. How do atmospheric variables change along the parcels’ paths leading toward the
developing convection? How quickly was the parcel moistened? How does its
vertical velocity change? Such information could support or refute certain MJO
triggering theories outlined above.
iii. Do the parcels preferentially enter the area of deepening convection from the west or
east, Northern or Southern Hemisphere? Are there preferential synoptic circulation
patterns associated with the development, and do these vary with season or relative
event intensity?
5
Figure 3. Schematic diagram of the four proposed physical mechanisms that might be involved in initiating an MJO-like disturbance. The diagram depicts the character of the atmosphere in the west-central Indian Ocean about 45 days after an MJO disturbance has developed and propagated away to the east (deep convective feature approaching date line). Forcings that might contribute toward the development of a new MJO convective event include: (1) wave trains impinging from the subtropics, (2) upper tropospheric Kelvin wave circumnavigating the globe, (3) time-dependent localized destabilization (“discharge-recharge”), or (4) local stochastic forcing. It is possible that all processes partake in the MJO development. Green shading represents the ECMWF land-sea mask.
Utilizing additional statistical analyses, additional questions arise:
iv. What is the behavior and intensity of high-frequency (synoptic-scale) signals in the
vicinity of a developing MJO? This might help to explain the importance of
extratropical forcing.
v. Is there a fundamental interaction between the intensity of the forcing and the
readiness of the atmosphere (i.e., is there a preferred balance between the intensity of
the forcing and the instability, or is it more common to have strong forcing interact
with an “unprepared” atmosphere?).
vi. Similar to the accepted SST requirements for hurricane formation (e.g., Gray 1968), is
there a particular state the atmosphere must typically be in before an MJO event can
form (e.g., minimum value of boundary layer moist static energy)?
Resolution of these stated issues will provide information on how the proposed triggering
mechanisms interact or cooperate and the relative importance of each.
Objective CThe sounding array data collected at the month-long TWP-ICE field study provide a
multitude of high-resolution observations from Darwin, Australia during a time of intense MJO
activity. As part of Objective C, we will characterize the transition from intense convection (wet
phase) to suppressed convection (dry phase) in the context of synoptic and mesoscale patterns
of circulation, temperature, and humidity. We anticipate some collaboration with Dr. John
McBride from the Australian Bureau of Meteorology Research Centre. A key area of interest is
the structure of atmospheric drying during the transition phase. Such analysis would add to the
author’s Masters project (Benedict 2005) in which atmospheric drying following intense MJO-
related convection appeared to be accomplished initially by horizontal advection and later by
deep-layer subsidence. Points to be considered include:
i. What is the vertical structure of winds, temperature, humidity, and moist static energy
during the intense convection, the transition phase, and the suppressed phase? How
do these high-resolution measurements compare to those from reanalysis datasets?
ii. How is the drying accomplished during the transition phase: horizontal advection,
subsidence, or a combination of the two?
Financial expense and logistical considerations limit the frequency of atmospheric science field
6

campaigns, so TWP-ICE is a welcome opportunity. We expect the proposed analyses to shed
light on the dynamic and thermodynamic behavior of a departing MJO convective event.
3. MethodologyAs part of Objective A, we propose to review intraseasonal wave structures seen in the
SP-CAM using composite analysis. This technique involves first locating individual MJO
convective events based on specified criteria. Event identification algorithms are applied to a
filtered atmospheric variable (e.g., rainfall, OLR, or zonal wind) and involve parameters such as
the longitudinal span of the disturbance, its time duration, and its maximum magnitude/intensity.
These thresholds are adapted from Rui and Wang (1990) and are further developed in Benedict
and Randall (2006, submitted). Once individual events are identified, we will composite them
based on the date and location of maximum rainfall because latent heating associated with
precipitation formation helps to drive multiscale tropical circulation systems. These
composites—time-height cross-sections of any chosen variable (or simply a timeseries for 1D
variables such as OLR)—are derived from the SP-CAM simulated dataset and will be compared
to the same composite cross-sections found in observations (Benedict and Randall 2006,
submitted). We expect to have a sufficiently large sample of MJO events (>18) and thus
statistically significant results given the extensive 16-year dataset.
Following the basic compositing methods, we will scrutinize the SP-CAM’s ability to
produce MJO-like dynamic and thermodynamic structures in space and time. This review
process will focus on the key physical mechanisms noted in observations, including a gradual
destabilization, low-level moistening, and deepening cumulus clouds prior to intense rainfall; a
stratiform temperature profile during maximum rainfall; and lingering upper-level moisture and
increasing low-level west winds following the event (see Fig. 1). We also propose to examine
additional statistics such as spatial patterns of variability, rainfall persistence in the Tropics
[overestimated in many current GCMs (Lin et al. 2005)], and structural differences based on
season, geography, and relative event intensity.
The initial stages of an MJO event will be reviewed as part of Objective B. Using
observation-based (ECMWF 40-year reanalysis) and model-based (SP-CAM) datasets, we
propose to track 3D parcel trajectories and characteristics (temperature, moisture,
height/pressure, moist static energy, etc.) leading up to the initial development of deep
7
convection associated with the MJO. We envision approaching the trajectory analysis as
follows: first, an individual MJO convective event will be located. We will then back-track the
event to its earliest recognizable stages, based on some minimum threshold, and flag that
geographic location as the formation zone and that day as the formation day. We could also flag
the location and day of most intense rainfall as another option. Back-tracking several days before
the formation day, we would then position inert, neutrally-buoyant “balloons” (parcels) at
regularly-spaced 3D increments throughout the global domain and allow the parcels to be
advected by the 3D wind. We will call the time at which the parcels are first released the release
day. Weighted interpolation will be used to calculate all variables at the exact parcel location.
The parcel will be advected by the time-interpolated mean wind and will take on the
characteristics of the surrounding air (temperature, moisture, etc.).
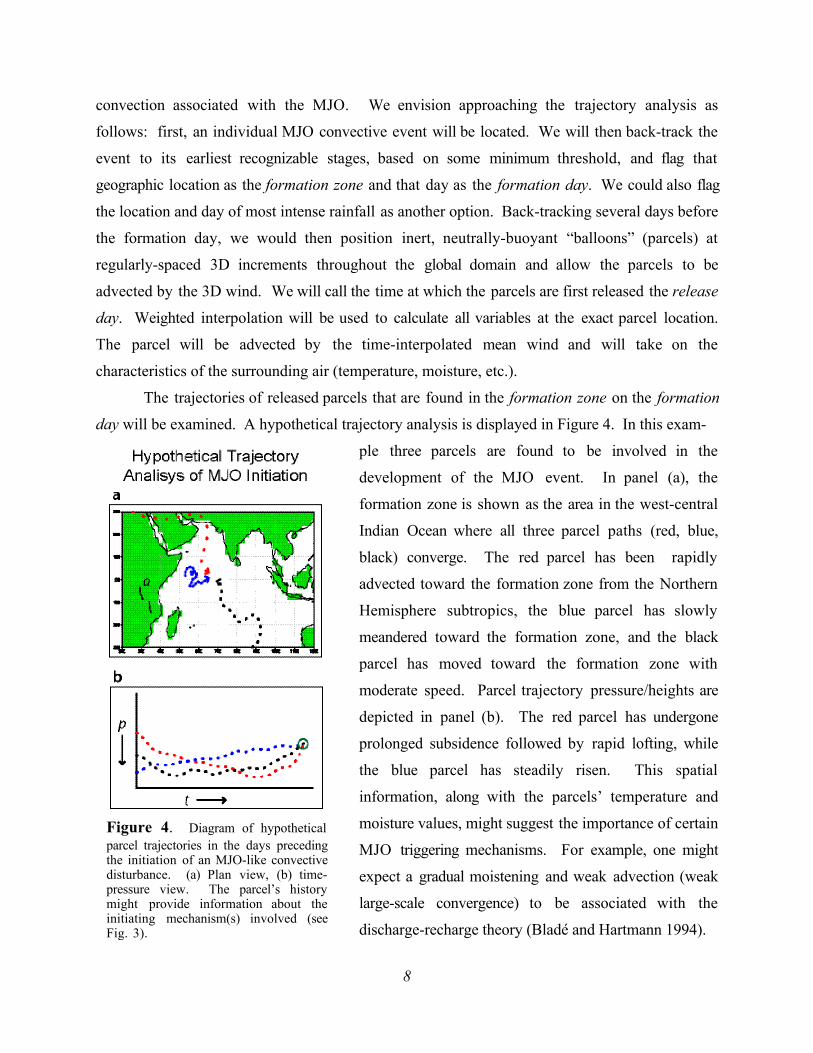
The trajectories of released parcels that are found in the formation zone on the formation
day will be examined. A hypothetical trajectory analysis is displayed in Figure 4. In this exam-
ple three parcels are found to be involved in the
development of the MJO event. In panel (a), the
formation zone is shown as the area in the west-central
Indian Ocean where all three parcel paths (red, blue,
black) converge. The red parcel has been rapidly
advected toward the formation zone from the Northern
Hemisphere subtropics, the blue parcel has slowly
meandered toward the formation zone, and the black
parcel has moved toward the formation zone with
moderate speed. Parcel trajectory pressure/heights are
depicted in panel (b). The red parcel has undergone
prolonged subsidence followed by rapid lofting, while
the blue parcel has steadily risen. This spatial
information, along with the parcels’ temperature and
moisture values, might suggest the importance of certain
MJO triggering mechanisms. For example, one might
expect a gradual moistening and weak advection (weak
large-scale convergence) to be associated with the
discharge-recharge theory (Bladé and Hartmann 1994).
8
Figure 4. Diagram of hypothetical parcel trajectories in the days preceding the initiation of an MJO-like convective disturbance. (a) Plan view, (b) time-pressure view. The parcel’s history might provide information about the initiating mechanism(s) involved (see Fig. 3).

Additional statistical analyses will aid in understanding the origins of the disturbance.
Possible statistical avenues include time-filtering the data to investigate the intensity of high-
frequency signals (<10 day periods) emanating from the subtropics and impinging on the
formation zone.
For Objective C, data from the TWP-ICE sounding array will be utilized to highlight the
basic differences in the vertical atmospheric structure between the MJO wet and dry phases.
Vertical velocities within the sounding array domain will be derived from the horizontal wind
velocities and mass conservation. Other quantities such as precipitable water, equivalent
potential temperature, and convective available potential energy (CAPE) will also examined.
Time-height cross-sections of these variables will then be compared to the wave structure in
Benedict and Randall (2006, submitted).
4. Comments on ResultsThe goals of this proposal are constructed so that the questions posed are open-ended.
We believe the scope of this project encompasses many aspects of the MJO and allows different
avenues of exploration should they appear to be of interest. The project does not appear to have
any potentially insurmountable obstacles, as might be expected if building and testing a model
was involved. However, mild difficulties are certainly plausible. For example, we may need to
reassess the trajectory analysis if initial results fail to provide clear results. This could be
accomplished by adjusting the number of released parcels, extending the release date to an earlier
time, etc. No foreseeable problems exist concerning the examination of the SP-CAM output or
the TWP-ICE data.
Each research objective outlined above will contribute uniquely to the atmospheric science
community. Examination of the wave structure of intraseasonal variability seen in the
superparameterized, realistic GCM simulation has not been undertaken owing to the relatively
recent formulation of this novel modeling approach (Grabowski 2001, Khairoutdinov and Randall
2001, Khairoutdinov et al. 2005). In the past, studies on the performance of models in capturing
realistic intraseasonal wave structure utilized traditional GCMs that did not have a well-defined
MJO spectral signal (e.g., Hayashi and Golder 1993). Other modeling studies have focused on
intraseasonal wave structure using very coarse horizontal and vertical resolutions (Wang and
Schlesinger 1999) or an atmosphere-only GCM (Inness and Slingo 2003). The parcel trajectory
9

and other statistical analyses of Objective B (see Section 3) offer a unique and insightful
perspective into the flow patterns and wave activity observed during MJO formation.
Trajectory analysis has not been used extensively, if at all, to study the MJO. The recently
organized TWP-ICE dataset to be utilized in Objective C contains atmospheric vertical profiles
of unprecedented temporal resolution and duration (May et al. 2006). This dataset captures in
detail the departure of anomalous deep convection associated with a highly-amplified MJO
event, and Objective C will undoubtedly contribute toward an understanding of the dynamics
involved in this transition phase.
4. ReferencesBenedict, J. J., 2005: The Birth and Death of the MJO: An Observational Study. MS thesis,
Department of Atmospheric Science, Colorado State University. 131 pp.
Benedict, J. J., and D. A. Randall, 2006: An Analysis of the MJO Guided by TRMM Rainfall
Data. J. Atmos. Sci., submitted.
Bladé, I., and D. L. Hartmann, 1993: Tropical Intraseasonal Oscillations in a Simple Nonlinear
Model. J. Atmos. Sci., 50, 2922-2939.
Grabowski, W. W., 2001: Coupling Cloud Processes with the Large-Scale Dynamics Using the
Cloud-Resolving Convection Parameterization (CRCP). J. Atmos. Sci., 58, 978-997.
Gray, W. M., 1968: Global View of the Origin of Tropical Disturbances and Storms. Mon. Wea.
Rev., 96, 669-700.
Hayashi, Y., and D. G. Golder, 1993: Tropical 40-50- and 25-30-day Oscillations Appearing in
Realistic and Idealized GFDL Climate Models and the ECMWF Dataset. J. Atmos. Sci., 50,
464-494.
Inness, P. M., and J. M. Slingo, 2003: Simulation of the Madden-Julian Oscillation in a Coupled
General Circulation Model. Part I: Comparison with Observations and an Atmosphere-only
GCM. J. Climate, 16, 345-364.
Khairoutdinov, M. F., and D. A. Randall, 2001: A Cloud Resolving Model as a Cloud
Parameterization in the NCAR Community Climate System Model: Preliminary Results.
Geophys. Res. Lett., 28, 3617-3620.
——, D. A. Randall, and C. DeMott, 2005: Simulations of the Atmospheric General Circulation
Using a Cloud-Resolving Model as a Superparameterization of Physical Processes. J. Atmos.
Sci., 62, 2136-2154.
10

Kiladis, G. N., K. H. Straub, and P. T. Haertel, 2005: Zonal and Vertical Structure of the
Madden-Julian Oscillation. J. Atmos. Sci., 62, 2790-2809.
Knutson, T. R., and K. M. Weickmann, 1987: 30-60 Day Atmospheric Oscillations: Composite
Life Cycles of Convection and Circulation Anomalies. Mon. Wea. Rev., 115, 1407-1436.
Kummerow, C., and Coauthors, 2000: The Status of the Tropical Rainfall Measuring Mission
(TRMM) after Two Years in Orbit. J. Appl. Meteor., 39, 1965-1982.
Lin, J.-L., and Coauthors, 2005: Tropical Intraseasonal Variability in 14 IPCC AR4 Climate
Models Part I: Convective Signals. J. Climate, in press.
Madden, R. A., and P. R. Julian, 1994: Observations of the 40-50-Day Tropical Oscillation-A
Review. Mon. Wea. Rev., 122, 814-837.
Matsuno, T., 1966: Quasi-geostrophic Motions in the Equatorial Area. J. Meteor. Soc. Japan,
44, 25-43.
Matthews, A. J., and G. N. Kiladis, 1999: The Tropical-Extratropical Interaction between High-
Frequency Transients and the Madden-Julian Oscillation. Mon. Wea. Rev., 127, 661-677.
May, P. T., and C. Jakob, and J. H. Mather, 2006: Tropical Warm Pool International Cloud
Experiment (TWP-ICE): Cloud and Rain Characteristics in the Australian Monsoon. TWP-
ICE Science Plan, available at http://science.arm.gov/~mather/darwiniop/
Rui, H., and B. Wang, 1990: Development Characteristics and Dynamic Structure of Tropical
Intraseasonal Convection Anomalies. J. Atmos. Sci., 47, 357-379.
Simpson, J., R. F. Adler, and G. R. North, 1988: A Proposed Tropical Rainfall Measuring
Mission (TRMM) Satellite. Bull. Amer. Meteor. Soc., 69, 278-295.
Slingo, J. M., and Coauthors, 1996: Intraseasonal Oscillations in 15 Atmospheric General
Circulation Models: Results from an AMIP Diagnostic Subproject. Climate Dyn., 12, 325-
357.
Wang, W., and M. E. Schlesinger, 1999: The Dependence on Convection Parameterization of the
Tropical Intraseasonal Oscillation Simulated by the UIUC 11-layer Atmospheric GCM. J.
Climate, 12, 1423-1457.
Wheeler, M., and G. N. Kiladis, 1999: Convectively Coupled Equatorial Waves: Analysis of
Clouds and Temperature in the Wavenumber-Frequency Domain. J. Atmos. Sci., 56,
374-399.
Yu, J.-Y., and J. D. Neelin, 1994: Modes of Tropical Variability under Convective Adjustment
of the Madden-Julian Oscillation. Part II: Numerical Results. J. Atmos. Sci., 51, 1895-1914.
11
![SCISCITATOR 2015 · [1]. Riverine communities experience two main types of disturbances: natural disturbances and anthropogenic disturbances. Natural disturbances in riverine ecosystems](https://static.fdocuments.us/doc/165x107/5f27dd3959f0c41da22eeec5/sciscitator-1-riverine-communities-experience-two-main-types-of-disturbances.jpg)