Initial Hydrogen-Bonding Dynamics of Photoexcited … Electronic Supplementary Information (ESI)...
7
S1 Electronic Supplementary Information (ESI) for: Initial Hydrogen-Bonding Dynamics of Photoexcited Coumarin in Solution with Femtosecond Stimulated Raman Spectroscopy Fangyuan Han,† a,b Weimin Liu,† a Liangdong Zhu, a,c Yanli Wang a and Chong Fang* a,c a Department of Chemistry, Oregon State University, Corvallis, Oregon 97331, USA b Current address: Guangxi Power Grid Electric Power Research Institute, Nanning, Guangxi 530023, China c Department of Physics, Oregon State University, Corvallis, Oregon 97331, USA † These authors contribute equally to this work. * To whom correspondence should be addressed: [email protected] . Electronic Supplementary Material (ESI) for Journal of Materials Chemistry C. This journal is © The Royal Society of Chemistry 2015
Transcript of Initial Hydrogen-Bonding Dynamics of Photoexcited … Electronic Supplementary Information (ESI)...

! S1!
Electronic Supplementary Information (ESI) for:!
Initial Hydrogen-Bonding Dynamics of
Photoexcited Coumarin in Solution with
Femtosecond Stimulated Raman Spectroscopy
Fangyuan Han,†a,b Weimin Liu,†a Liangdong Zhu,a,c Yanli Wanga and Chong Fang*a,c
a Department of Chemistry, Oregon State University, Corvallis, Oregon 97331, USA
b Current address: Guangxi Power Grid Electric Power Research Institute, Nanning,
Guangxi 530023, China
c Department of Physics, Oregon State University, Corvallis, Oregon 97331, USA
† These authors contribute equally to this work.
* To whom correspondence should be addressed: [email protected].
!
Electronic Supplementary Material (ESI) for Journal of Materials Chemistry C.This journal is © The Royal Society of Chemistry 2015
! S2!
TOC Page number
ESI Figures
Figure S1 Schematic of the wavelength-tunable FSRS setup...........................................S3
Figure S2 Electronic absorption and emission spectra of C102* in various solvents.......S4
Figure S3 Transient absorption spectra of C102 in ethanol..............................................S5
Figure S4 Time-resolved 400/400 nm pump-probe spectrum of C102 in ethanol............S6
Additional discussion follows each figure caption
*C102: Coumarin 102 (dye molecule)
ESI References......................................................................................................................................S7

! S3!
!
ESI Figures
!
!
Fig. S1. Schematic of the tunable FSRS setup that enables the detection of excited-state vibrational marker bands of C102 in ethanol. BUMA, broadband up-converted multicolor array.1,2 SCWL, supercontinuum white light. SHG, second harmonic generation. SHBC, second-harmonic bandwidth compressor.3,4 NOPA, noncollinear optical parametric amplifier. CCD, charge-coupled device. BS, beamsplitter. VNDF, variable neutral density filter. CM, concave mirror. SP, sapphire plate. PM, parabolic mirror. All the optical compartments are integrated and constructed on an air-float laser table (Newport RS4000) under ambient temperature (22 ºC) and pressure (1 atm).5,6

! S4!
!
Fig. S2. Steady-state electronic absorption and emission spectra of 0.5 mM C102 dissolved in various solvents. (a) UV/Vis absorption spectrum of 0.5 mM C102 in methanol (green), ethanol (dark red), and tetrachloroethylene (C2Cl4, dark blue). The sample cuvette pathlength is 1 mm. Based on the Beer-Lambert law,7 the extinction coefficient of C102 in ethanol (C2Cl4) at 400 nm is ca. 19,300 (3,500) M-1!cm-1. This result indicates that the photoexcitation wavelength at 400 nm (vertical dashed line) is effective to initiate photochemistry of C102 in ethanol for our excited-state FSRS measurement as described in the main text. (b) Normalized electronic absorption (blue, left vertical axis) and fluorescence (red, right vertical axis) spectra of C102 in C2Cl4 (solid trace) and in ethanol (dotted trace), respectively.
The H-bonding interaction between solute and solvent in the C102-EtOH system is responsible for the notable redshift of both absorption and emission spectra in comparison to those in the non-H-bonding solvent C2Cl4. The absorption maximum is 369 and 390 nm for C102 in C2Cl4 and EtOH while the fluorescence was collected with 380 and 400 nm excitation, displaying their emission maximum at 428 and 465 nm, respectively.8 Both absorption and emission bands are noticeably broader in EtOH due to formation of H-bonds and the increased inhomogeneity of the C102 population in the ground state versus free C102 in C2Cl4. Moreover, the fluorescence spectrum of C102 in EtOH shows no significant difference upon 320 or 400 nm excitation. Given that free C102 barely absorbs at 400 nm but absorbs more at 320 nm, this result indicates that free C102 constitutes a small portion of S0 population in the H-donating solvents.9
! S5!
!
!
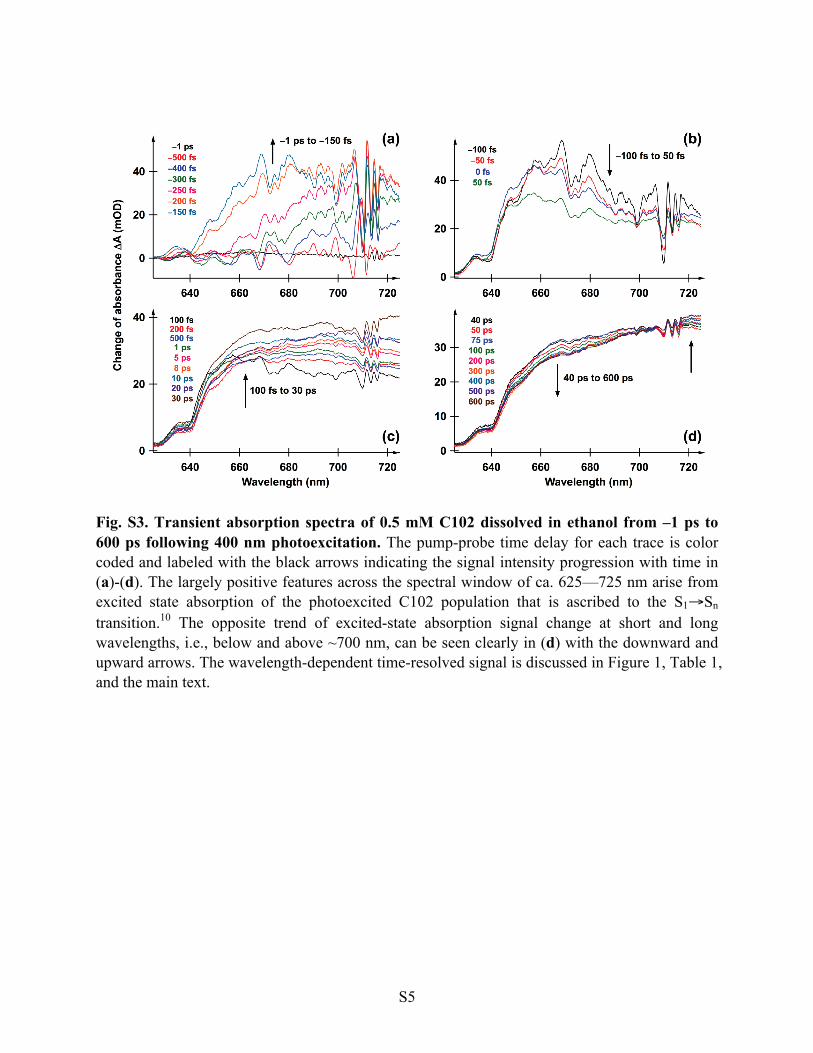
Fig. S3. Transient absorption spectra of 0.5 mM C102 dissolved in ethanol from –1 ps to 600 ps following 400 nm photoexcitation. The pump-probe time delay for each trace is color coded and labeled with the black arrows indicating the signal intensity progression with time in (a)-(d). The largely positive features across the spectral window of ca. 625—725 nm arise from excited state absorption of the photoexcited C102 population that is ascribed to the S1!Sn transition.10 The opposite trend of excited-state absorption signal change at short and long wavelengths, i.e., below and above ~700 nm, can be seen clearly in (d) with the downward and upward arrows. The wavelength-dependent time-resolved signal is discussed in Figure 1, Table 1, and the main text.

! S6!
!
!
Fig. S4. Time-resolved 400/400 nm pump-probe signal of 0.5 M C102 in ethanol solution. The data points up to 10 ps time delay (circles) are overlaid with the least-squares multi-exponential fit (solid line). The pump power is 4 mW. The negative feature (attributed to ground state bleaching) recovery time toward zero "OD (dotted line) is fitted to contain three time constants of ~150 fs (59% amplitude weight), 1.5 ps (27% weight), and 23 ps (14% weight). The bleaching signal recovers ~80% in the first 3 ps and >95% in the first 200 ps after photoexcitation. The overall signal dynamics across the 200 ps detection time window is shown in the insert, with the signal largely flattened out after ~50 ps.
The high fluorescence quantum yield of C102 indicates that the majority of excited-state C102 deactivates via fluorescence on a nanosecond timescale.8 These time constants retrieved here are unlikely to report on the recovery of ground state population. Rather, they can be signatures of excited-state molecular events.11 The ~150 fs ultrafast rise may report on the ultrafast H-bond cleavage in addition to some coherent effect close to photoexcitation time zero,12,13 and the 1.5 ps rise may be associated with vibrational relaxation in the electronic excited state (e.g., vibrational cooling, see Fig. 4 process II’). The 23 ps time constant matches reasonably well with the short decay time constant deduced from FSRS data (~37 ps in Fig. 3 insert) and transient absorption data at short probe wavelengths (e.g., ~19 ps at 630 nm, 26 ps at 660 nm in Table 1), and can be ascribed to excited-state H-bond reformation. TDDFT calculations by Su and Tian showed that the first excited state of C102-ethanol complex is lower in equilibrium energy than that of free C102 by ~32 kJ/mol,14 making the H-bond reformation an overall “favored” dynamic path in terms of energy. The pertinent dynamic timescales are now made clear experimentally with the wavelength-dependent femtosecond transient absorption and time-resolved excited-state FSRS data as described throughout the main text.
! S7!
ESI References
1 W. Liu, L. Zhu, L. Wang and C. Fang, Opt. Lett., 2013, 38, 1772-1774. 2 L. Zhu, W. Liu and C. Fang, Appl. Phys. Lett., 2013, 103, 061110. 3 L. Zhu, W. Liu and C. Fang, Appl. Phys. Lett., 2014, 105, 041106. 4 L. Zhu, W. Liu, Y. Wang and C. Fang, Appl. Sci, 2015, 5, 48-61. 5 W. Liu, F. Han, C. Smith and C. Fang, J. Phys. Chem. B, 2012, 116, 10535-10550. 6 W. Wang, W. Liu, I.-Y. Chang, L. A. Wills, L. N. Zakharov, S. W. Boettcher, P. H.-Y.
Cheong, C. Fang and D. A. Keszler, Proc. Natl. Acad. Sci. U.S.A., 2013, 110, 18397-18401.
7 J. L. McHale, Molecular Spectroscopy, Prentice-Hall, Upper Saddle River, NJ, 1999. 8 G. Jones, W. R. Jackson, C. Y. Choi and W. R. Bergmark, J. Phys. Chem., 1985, 89, 294-
300. 9 F. Han, Ph.D. Thesis, Department of Chemistry, Oregon State University, 2014. 10 F. Morlet-Savary, C. Ley, P. Jacques and J. P. Fouassier, J. Phys. Chem. A, 2001, 105,
11026-11033. 11 F. Tschirschwitz and E. T. J. Nibbering, Chem. Phys. Lett., 1999, 312, 169-177. 12 L. Zhu, J. T. Sage and P. M. Champion, Science, 1994, 266, 629-632. 13 L. Tang, W. Liu, Y. Wang, Y. Zhao, B. G. Oscar, R. E. Campbell and C. Fang, Chem.
Eur. J., 2015, 21, 6481-6490. 14 J. Su and D. Tian, New J. Chem., 2014, 38, 568-573.
!