INITIAL FEASIBILITY STUDY PURPOSES ONLY … Feasibility - Mixed Use...18 19 20 21 22 23 24 25 26 27...
21
INITIAL FEASIBILITY STUDY PURPOSES ONLY 1 2 3 4 5 6 7 8 9 10 11 12 13 14 15 16 17 18 19 20 21 22 23 24 25 26 27 28 A B C D E F G H I J K L M N Worst Case = Level 3 HEADINGS >>> TOTAL A B C D wc Budget = Level 5 TOTAL PARK AGED OFFICES Best Case = level 7 COMMON RESID COMM SITE PURCHASE DETAILS FREEZE CELL Proof TOTAL LOT 3 - WESTERN BLOCK LOT 4 - CENTRAL BLOCK LOT 5 - EASTERN BLOCK Function TYPE A TYPE B TYPE A TYPE B TYPE A Title Ref CT xxxx/xx CT xxxx/xx CT xxxx/xx Main Lot Dimensions Frontage 89.00 m 60.00 m 59.00 m Depth 35.00 m 76.00 m 74.00 m Area M² 7,481m² 4,560m² OK 12,041m² 3,115m² 4,560m² 4,366m² % Mix - Main Lot Area 26% 38% 36% Easement Dimensions Frontage 11.00 m 10.00 m Depth 83.00 m 65.00 m Area M² 1,563m² OK 1,563m² 913m² 650m² % Mix - Easement Area 58% 42% Other Frontage Depth Area M² % Mix - Other Area Difference (M2) -1m² -3m² 4m² Lot Total on Plan (M2) 4,029m² 4,563m² 5,012m² OK 13,604m² 4,029m² 4,563m² 5,012m² Site Area - Hectares 0.90hec 0.46hec OK 1.36hec 0.40hec 0.46hec 0.50hec % Mix - Total Area 30% 34% 37% % Mix Main Lot Area 22.9% 33.5% 32.1% Easement Area 6.7% 4.8% DEVELOPMENT & OPERATIONAL FEASIBILITY ANALYSIS SCENARIO Choice Say WC, B or BC FUNCTIONAL SUMMARY 29 30 31 32 33 34 35 36 37 38 39 40 41 42 43 44 45 46 47 48 49 50 51 52 53 Other Area Difference (M2) Total Area 100.0% 29.6% 33.5% 36.8% Agent's Price Per M2 Main Lot Area 208 $ 208 $ 208 $ 208 $ Easement Area 1 $ 1 $ 1 $ 1 $ Other Area Budget Price Main Lot Area 647,920 $ 948,480 $ 908,128 $ - $ Easement Area 913 $ - $ 650 $ - $ Other Area Total Budget Price by Title 2,506,091 $ 648,833 $ 948,480 $ 908,778 $ - $ Average Price M2 184.22 $ SITE DESIGN DETAILS TOTAL A B C D Proof Diff TOTAL PARK AGED OFFICES Function COMMON RESID COMM UNALLOC COMMON RESID COMM Lot Total on Plan (M2) 4,029m² 4,563m² 5,012m² OK 13,604m² 4,029m² 4,563m² 5,012m² Proof - c/f Titled Area 13,604m² Diff Proof OK Site Area - Hectares 0.40hec 0.46hec 0.50hec OK 1.36hec 0.40hec 0.46hec 0.50hec Agent's Price Per M2 $184.22 $184.22 $184.22 Total Budget Price by Design Component 742,222 $ 840,596 $ 923,311 $ - $ OK 2,506,129 $ 742,222 $ 840,596 $ 923,311 $ - $ KEY DESIGN ASSUMPTIONS FUNCTIONAL SUMMARY File: Feasibility - Mixed Use Template - Aug 2011 FINAL.xlsx (22/08/2012 8:54 AM) Prepared by: Bill Wright GENESIS MANAGEMENT SERVICES PTY LTD P O Box 260 Crafers SA 5152 Phone: 0414 267 196 Page 1 of 21
Transcript of INITIAL FEASIBILITY STUDY PURPOSES ONLY … Feasibility - Mixed Use...18 19 20 21 22 23 24 25 26 27...

INITIAL FEASIBILITY STUDY PURPOSES ONLY
1
2
3
4
5
6
7
8
9
10
11
12
13
14
15
16
17
18
19
20
21
22
23
24
25
26
27
28
A B C D E F G H I J K L M N
Worst Case = Level 3 HEADINGS >>> TOTAL A B C D
wc Budget = Level 5 TOTAL PARK AGED OFFICES
Best Case = level 7 COMMON RESID COMM
SITE PURCHASE DETAILSFREEZE CELL Proof TOTAL
LOT 3 -
WESTERN
BLOCK
LOT 4 -
CENTRAL
BLOCK
LOT 5 -
EASTERN
BLOCK
Function TYPE A TYPE B TYPE A TYPE B TYPE A
Title Ref CT xxxx/xx CT xxxx/xx CT xxxx/xx
Main Lot Dimensions
Frontage 89.00 m 60.00 m 59.00 m
Depth 35.00 m 76.00 m 74.00 m
Area M² 7,481m² 4,560m² OK 12,041m² 3,115m² 4,560m² 4,366m²
% Mix - Main Lot Area 26% 38% 36%
Easement Dimensions
Frontage 11.00 m 10.00 m
Depth 83.00 m 65.00 m
Area M² 1,563m² OK 1,563m² 913m² 650m²
% Mix - Easement Area 58% 42%
Other
Frontage
Depth
Area M²
% Mix - Other Area
Difference (M2) -1m² -3m² 4m²
Lot Total on Plan (M2) 4,029m² 4,563m² 5,012m² OK 13,604m² 4,029m² 4,563m² 5,012m²
Site Area - Hectares 0.90hec 0.46hec OK 1.36hec 0.40hec 0.46hec 0.50hec
% Mix - Total Area 30% 34% 37%
% Mix
Main Lot Area 22.9% 33.5% 32.1%
Easement Area 6.7% 4.8%
DEVELOPMENT & OPERATIONAL
FEASIBILITY ANALYSIS
SCENARIO Choice
Say WC, B or BC
FUNCTIONAL SUMMARY
28
29
30
31
32
33
34
35
36
37
38
39
40
41
42
43
44
45
46
47
48
49
50
51
52
53
Easement Area 6.7% 4.8%
Other Area
Difference (M2)
Total Area 100.0% 29.6% 33.5% 36.8%
Agent's Price Per M2
Main Lot Area 208$ 208$ 208$ 208$
Easement Area 1$ 1$ 1$ 1$
Other Area
Budget Price
Main Lot Area 647,920$ 948,480$ 908,128$ -$
Easement Area 913$ -$ 650$ -$
Other Area
Total Budget Price by Title 2,506,091$ 648,833$ 948,480$ 908,778$ -$
Average Price M2 184.22$
SITE DESIGN DETAILS TOTAL A B C D
Proof Diff TOTAL PARK AGED OFFICES
Function COMMON RESID COMM UNALLOC COMMON RESID COMM
Lot Total on Plan (M2) 4,029m² 4,563m² 5,012m² OK 13,604m² 4,029m² 4,563m² 5,012m²
Proof - c/f Titled Area 13,604m²
Diff
Proof OK
Site Area - Hectares 0.40hec 0.46hec 0.50hec OK 1.36hec 0.40hec 0.46hec 0.50hec
Agent's Price Per M2 $184.22 $184.22 $184.22
Total Budget Price by Design Component 742,222$ 840,596$ 923,311$ -$ OK 2,506,129$ 742,222$ 840,596$ 923,311$ -$
KEY DESIGN ASSUMPTIONS
FUNCTIONAL SUMMARY
File: Feasibility - Mixed Use Template - Aug 2011 FINAL.xlsx
(22/08/2012 8:54 AM)
Prepared by: Bill Wright
GENESIS MANAGEMENT SERVICES PTY LTD
P O Box 260 Crafers SA 5152 Phone: 0414 267 196 Page 1 of 21
INITIAL FEASIBILITY STUDY PURPOSES ONLY
54
55
56
57
58
59
60
61
62
63
64
65
66
67
68
69
70
71
72
73
74
75
76
77
78
79
80
81
82
83
A B C D E F G H I J K L M N
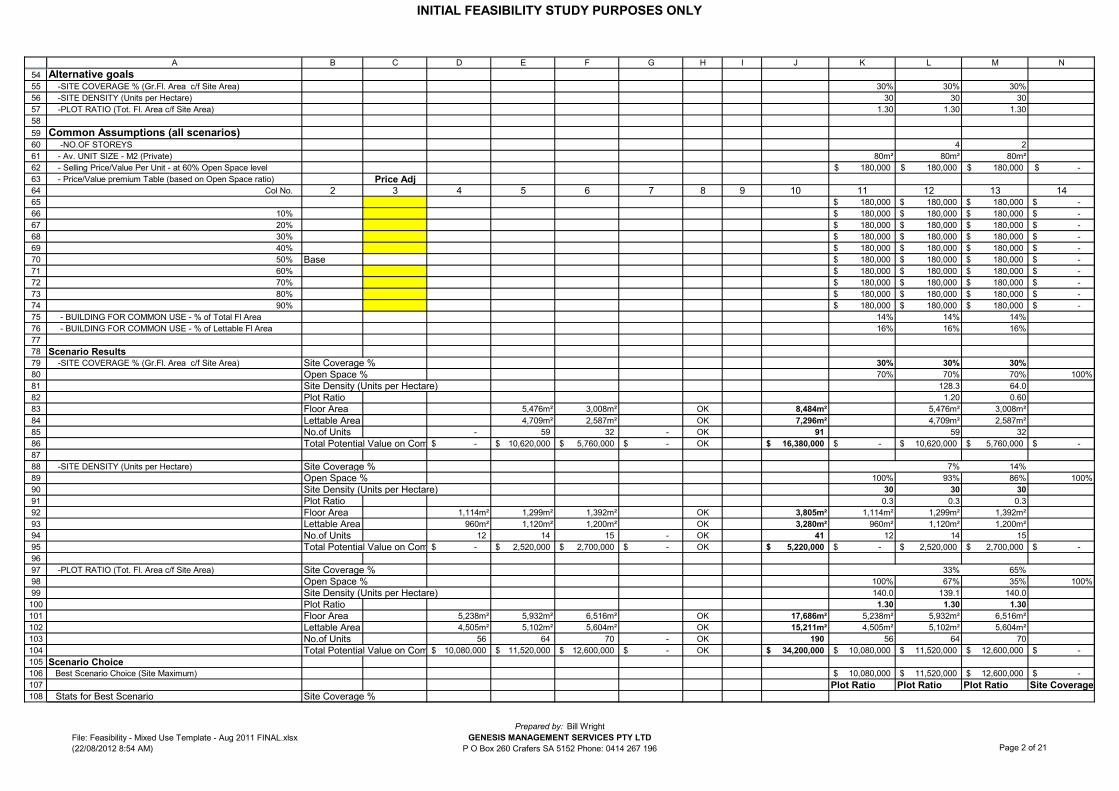
Alternative goals -SITE COVERAGE % (Gr.Fl. Area c/f Site Area) 30% 30% 30%
-SITE DENSITY (Units per Hectare) 30 30 30
-PLOT RATIO (Tot. Fl. Area c/f Site Area) 1.30 1.30 1.30
Common Assumptions (all scenarios) -NO.OF STOREYS 4 2
- Av. UNIT SIZE - M2 (Private) 80m² 80m² 80m²
- Selling Price/Value Per Unit - at 60% Open Space level 180,000$ 180,000$ 180,000$ -$
- Price/Value premium Table (based on Open Space ratio) Price AdjCol No. 2 3 4 5 6 7 8 9 10 11 12 13 14
180,000$ 180,000$ 180,000$ -$
10% 180,000$ 180,000$ 180,000$ -$
20% 180,000$ 180,000$ 180,000$ -$
30% 180,000$ 180,000$ 180,000$ -$
40% 180,000$ 180,000$ 180,000$ -$
50% Base 180,000$ 180,000$ 180,000$ -$
60% 180,000$ 180,000$ 180,000$ -$
70% 180,000$ 180,000$ 180,000$ -$
80% 180,000$ 180,000$ 180,000$ -$
90% 180,000$ 180,000$ 180,000$ -$
- BUILDING FOR COMMON USE - % of Total Fl Area 14% 14% 14%
- BUILDING FOR COMMON USE - % of Lettable Fl Area 16% 16% 16%
Scenario Results -SITE COVERAGE % (Gr.Fl. Area c/f Site Area) Site Coverage % 30% 30% 30%
Open Space % 70% 70% 70% 100%
Site Density (Units per Hectare) 128.3 64.0
Plot Ratio 1.20 0.60
Floor Area 5,476m² 3,008m² OK 8,484m² 5,476m² 3,008m²
84
85
86
87
88
89
90
91
92
93
94
95
96
97
98
99
100
101
102
103
104
105
106
107
108
Lettable Area 4,709m² 2,587m² OK 7,296m² 4,709m² 2,587m²
No.of Units - 59 32 - OK 91 59 32
Total Potential Value on Completion -$ 10,620,000$ 5,760,000$ -$ OK 16,380,000$ -$ 10,620,000$ 5,760,000$ -$
-SITE DENSITY (Units per Hectare) Site Coverage % 7% 14%
Open Space % 100% 93% 86% 100%
Site Density (Units per Hectare) 30 30 30
Plot Ratio 0.3 0.3 0.3
Floor Area 1,114m² 1,299m² 1,392m² OK 3,805m² 1,114m² 1,299m² 1,392m²
Lettable Area 960m² 1,120m² 1,200m² OK 3,280m² 960m² 1,120m² 1,200m²
No.of Units 12 14 15 - OK 41 12 14 15
Total Potential Value on Completion -$ 2,520,000$ 2,700,000$ -$ OK 5,220,000$ -$ 2,520,000$ 2,700,000$ -$
-PLOT RATIO (Tot. Fl. Area c/f Site Area) Site Coverage % 33% 65%
Open Space % 100% 67% 35% 100%
Site Density (Units per Hectare) 140.0 139.1 140.0
Plot Ratio 1.30 1.30 1.30
Floor Area 5,238m² 5,932m² 6,516m² OK 17,686m² 5,238m² 5,932m² 6,516m²
Lettable Area 4,505m² 5,102m² 5,604m² OK 15,211m² 4,505m² 5,102m² 5,604m²
No.of Units 56 64 70 - OK 190 56 64 70
Total Potential Value on Completion10,080,000$ 11,520,000$ 12,600,000$ -$ OK 34,200,000$ 10,080,000$ 11,520,000$ 12,600,000$ -$
Scenario ChoiceBest Scenario Choice (Site Maximum) 10,080,000$ 11,520,000$ 12,600,000$ -$
Plot Ratio Plot Ratio Plot Ratio Site CoverageStats for Best Scenario Site Coverage %
File: Feasibility - Mixed Use Template - Aug 2011 FINAL.xlsx
(22/08/2012 8:54 AM)
Prepared by: Bill Wright
GENESIS MANAGEMENT SERVICES PTY LTD
P O Box 260 Crafers SA 5152 Phone: 0414 267 196 Page 2 of 21

INITIAL FEASIBILITY STUDY PURPOSES ONLY
109
110
111
112
113
114
115
116
117
118
119
120
121
122
123
124
125
126
127
128
129
130
131
132
133
134
135
136
137
138
139
A B C D E F G H I J K L M N
Open Space % 100%
Site Density (Units per Hectare)Plot RatioFloor Area OK
Lettable Area OK
No.of Units - - - - OK -
Total Potential Value on Completion -$ -$ -$ -$ OK -$ -$ -$ -$ -$
Land Cost Per Unit -$ -$ -$ -$
SITE COVERAGE ANALYSIS
-SITE COVERAGE % - ASSUMED - (SEE ABOVE) 30% 30% 30%
- Open Space Ratio (as a %) 70% 70% 70% 100%
-SITE AREA - SQ.M 4,029m² 4,563m² 5,012m² OK 13,604m² 4,029m² 4,563m² 5,012m²
-SITE COVERAGE-GRND FL-SQ.M (Net Site Area x Assumed Site Cov %) 1,209m² 1,369m² 1,504m² OK 4,082m² 1,209m² 1,369m² 1,504m²
-NO.OF STOREYS 4 2
-TOTAL FLOOR AREA SQ.M (Ground Floor x No. of Storeys) 5,476m² 3,008m² OK 8,484m² 5,476m² 3,008m²
-PLOT RATIO (Total Floor Area : Site Area) 1.20 0.60
- BUILDING FOR COMMON USE - % of Total Fl Area 14% 14% 14%
- BUILDING FOR COMMON USE - M2 767m² 421m² OK 1,188m² 767m² 421m²
-LETTABLE FLOOR AREA- SQ.M (Total Floor Area less % Building for Common Use) 4,709m² 2,587m² OK 7,296m² 4,709m² 2,587m²
- Av. UNIT SIZE - M2 (Private) #DIV/0! 80m² 81m² #DIV/0! 80m² 80m² 80m² 80m²
-RESID NO.OF UNITS (Rounded) - 59 32 - OK 91 59 32
- Target Price/Value Per Unit 180,000$ 180,000$ 180,000$ -$
- Total Potential Value on Completion -$ 10,620,000$ 5,760,000$ -$ OK 16,380,000$ -$ 10,620,000$ 5,760,000$ -$
-RESID NO.OF UNITS - PER HECTARE 128.3 64.0 66.9 128.3 64.0
SITE DENSITY ANALYSIS
-NO.RESID.UNITS P/HECT - ASSUMED - (SEE ABOVE) 30 30 30
-SITE AREA - HECTARES 0.40hec 0.46hec 0.50hec OK 1.36hec 0.40hec 0.46hec 0.50hec
-RES UNITS POSSIBLE (Rounded) 12 14 15 - OK 41 12 14 15
- Target Price/Value Per Unit -$ 180,000$ 180,000$ -$
- Total Potential Value on Completion -$ 2,520,000$ 2,700,000$ -$ OK 5,220,000$ -$ 2,520,000$ 2,700,000$ -$ 139
140
141
142
143
144
145
146
147
148
149
150
151
152
153
154
155
156
157
158
159
160
161
162
163
- Total Potential Value on Completion -$ 2,520,000$ 2,700,000$ -$ OK 5,220,000$ -$ 2,520,000$ 2,700,000$ -$
- Av. UNIT SIZE - M2 (Private) 80.0m² 80.0m² 80.0m²
-LETTABLE FLOOR AREA-RES-SQ.M 960m² 1,120m² 1,200m² OK 3,280m² 960m² 1,120m² 1,200m²
- BUILDING FOR COMMON USE - % of Lettable Fl Area 16% 16% 16%
- BUILDING FOR COMMON USE - M2 154m² 179m² 192m² OK 525m² 154m² 179m² 192m²
-TOTAL FLOOR AREA SQ.M (Ground Floor x No. of Storeys) 1,114m² 1,299m² 1,392m² OK 3,805m² 1,114m² 1,299m² 1,392m²
-NO.OF STOREYS 4 2
-GROUND FLOOR AREA SQ.M 325m² 696m² OK 1,021m² 325m² 696m²
-SITE AREA - SQ.M 4,029m² 4,563m² 5,012m² OK 13,604m² 4,029m² 4,563m² 5,012m²
-SITE COVERAGE % 7% 14%
- Open Space Ratio (as a %) 100% 93% 86% 100%
-PLOT RATIO 0.3 0.3 0.3 0.3 0.3 0.3 0.3
PLOT RATIO ANALYSIS
-PLOT RATIO - ASSUMED (SEE ABOVE) 1.30 1.30 1.30
-SITE AREA - M2 4,029m² 4,563m² 5,012m² OK 13,604m² 4,029m² 4,563m² 5,012m²
-TOTAL FLOOR AREA SQ.M 5,238m² 5,932m² 6,516m² OK 17,686m² 5,238m² 5,932m² 6,516m²
-NO.OF STOREYS 4 2
-GROUND FLOOR AREA SQ.M 1,483m² 3,258m² OK 4,741m² 1,483m² 3,258m²
-SITE COVERAGE % 33% 65%
- Open Space Ratio (as a %) 100% 67% 35% 100%
- BUILDING FOR COMMON USE - % of Total Fl Area 14% 14% 14%
- BUILDING FOR COMMON USE - M2 733m² 830m² 912m² OK 2,475m² 733m² 830m² 912m²
-LETTABLE FLOOR AREA- SQ.M (Total Floor Area less % Building for Common Use) 4,505m² 5,102m² 5,604m² OK 15,211m² 4,505m² 5,102m² 5,604m²
- Av. UNIT SIZE - M2 (Private) 80m² 80m² 80m²
File: Feasibility - Mixed Use Template - Aug 2011 FINAL.xlsx
(22/08/2012 8:54 AM)
Prepared by: Bill Wright
GENESIS MANAGEMENT SERVICES PTY LTD
P O Box 260 Crafers SA 5152 Phone: 0414 267 196 Page 3 of 21

INITIAL FEASIBILITY STUDY PURPOSES ONLY
164
165
166
167
168
169
170
171
172
173
174
175
176
177
178
179
180
181
182
183
184
185
186
187
188
189
190
191
192
193
A B C D E F G H I J K L M N
-RESID NO.OF UNITS (Rounded) 56 64 70 - OK 190 56 64 70
- Target Price/Value Per Unit 180,000$ 180,000$ 180,000$ -$
- Total Potential Value on Completion 10,080,000$ 11,520,000$ 12,600,000$ -$ OK 34,200,000$ 10,080,000$ 11,520,000$ 12,600,000$ -$
-RESID NO.OF UNITS - PER HECTARE 140.0 139.1 140.0 139.7 140.0 139.1 140.0
SCHEDULE OF ACCOMMODATION (Existing Design)1. Core Building Code Level
RESIDENTIALUnit Size (Lettable Floor Area) Res 80.00 m² 80.00 m² 80.00 m²
No. of Units 28Net Lettable Floor Area 2,240m² OK 2,240m² 2,240 m²
RETAILUnit Size (Lettable Floor Area) 80.00 m² 80.00 m² 80.00 m²
No. of Units
Net Lettable Floor Area OK
OFFICEUnit Size (Lettable Floor Area) 80.00 m² 80.00 m² 80.00 m²
No. of Units
Net Lettable Floor Area OK
Sub-Total Net Lettable Floor Area 2,240m² OK 2,240m² 2,240 m²
NON-LETTABLE/NON-SALEABLE SPACEBuilding Envelope
% of Net Lettable Floor Area to Add 16% 16% 16%
Allowance - m2 358 m²
No. of Undercover Carparks
Residential 22 carsRetail
Office
Area per carpark 14.50 m² 14.50 m² 14.50 m²
Area 319m² OK 319m² 319 m²
Driveways (internal) 858m² OK 858m² 858 m²193
194
195
196
197
198
199
200
201
202
203
204
205
206
207
208
209
210
211
212
213
214
215
216
217
Driveways (internal) 858m² OK 858m² 858 m²
Storage
No. of Storage Areas 28Area per storage area 4.00 m²
Area 112m² OK 112m² 112 m²
Stairs 160m² OK 160m² 160 m²
Sitting Rooms 180m² OK 180m² 180 m²
Lift 60m² OK 60m² 60 m²
Services Room 100m² OK 100m² 100 m²
Passages 525m² OK 525m² 525 m²
Tank area 175m² OK 175m² 175 m²
Lounge 100m² OK 100m² 100 m²
Kitchen 50m² OK 50m² 50 m²
Patios 100m² OK 100m² 100 m²
Other OK
Total Non-Lettable 3,097m² OK 3,097m² 3,097 m²
TOTAL CORE BUILDING 5,337m² OK 5,337m² 5,337 m²
2. Secondary Building Choose Code - RES, RET, OFF) OFF
Lettable 248m² OK 248m² 248 m²
Non-Lettable 248m² OK 248m² 248 m²
Undercover Car Parks
3. Other Building Choose Code - RES, RET, OFF) OFF
Lettable 30m² OK 30m² 30 m²
Non-Lettable 30m² OK 30m² 30 m²
Undercover Car Parks
File: Feasibility - Mixed Use Template - Aug 2011 FINAL.xlsx
(22/08/2012 8:54 AM)
Prepared by: Bill Wright
GENESIS MANAGEMENT SERVICES PTY LTD
P O Box 260 Crafers SA 5152 Phone: 0414 267 196 Page 4 of 21

INITIAL FEASIBILITY STUDY PURPOSES ONLY
218
219
220
221
222
223
224
225
226
227
228
229
230
231
232
233
234
235
236
237
238
239
240
241
242
243
244
245
246
247
A B C D E F G H I J K L M N
TOTAL GROSS FLOOR AREA 5,337m² 556m² OK 5,893m² 5,337 m² 556 m²
Lettable 2,240m² 278m² OK 2,518m² 2,240 m² 278 m²
Non-Lettable 3,097m² 278m² OK 3,375m² 3,097 m² 278 m²
TOTAL GROSS FLOOR AREA 5,337m² 556m² OK 5,893m² 5,337 m² 556 m²
Proof OK OK OK OK
No. of Floors (above & below ground)Core Building 4
Secondary Building 2
Other Building 1
FootprintCore Building 1,334m² OK 1,334m² 1,334 m²
Secondary Building 248m² OK 248m² 248 m²
Other Building 60m² OK 60m² 60 m²
Total Site Coverage 1,334m² 308m² OK 1,642m² 1,334 m² 308 m²
External Car Parking1. Core Building 9 cars
Residential 100 m² 120 m² 140 m² 160 m² 180 m² 200 m²
Car parking ratio - No. of Cars per unit (inc VP) 1.1 1.4 1.6 1.8 2.0 2.2 1.1 1.1 1.1
No. of Resid Units 28
No.of Cars Req. Total 31
No.of Open Space car parks Required 9
RetailCar parking ratio - Spaces/100M2 Lettable Fl Area 7.0 7.0 7.0Lettable Floor AreaNo.of Cars Req. Total
No.of Open Space car parks RequiredOffice
Car parking ratio - Spaces/100M2 Lettable Fl Area 7.0 7.0 7.0Lettable Floor AreaNo.of Cars Req. Total247
248
249
250
251
252
253
254
255
256
257
258
259
260
261
262
263
264
265
266
267
268
269
270
271
No.of Cars Req. TotalNo.of Open Space car parks Required
2. Secondary Building 17 cars
ResidentialLettable Floor AreaDerived No. of Resid UnitsNo.of Cars Req. Total (use above ratio)
No.of Open Space car parks RequiredRetail
Car parking ratio - No. of Cars per unit (inc VP) 7.0 7.0 7.0Lettable Floor AreaNo.of Cars Req. Total
No.of Open Space car parks RequiredOffice
Car parking ratio - No. of Cars per unit (inc VP) 7.0 7.0 7.0Lettable Floor Area 248 m²
No.of Cars Req. Total 17
No.of Open Space car parks Required 17
3. Other Building 2 cars
ResidentialLettable Floor AreaDerived No. of Resid UnitsNo.of Cars Req. Total (use above ratio)
No.of Open Space car parks RequiredRetail
File: Feasibility - Mixed Use Template - Aug 2011 FINAL.xlsx
(22/08/2012 8:54 AM)
Prepared by: Bill Wright
GENESIS MANAGEMENT SERVICES PTY LTD
P O Box 260 Crafers SA 5152 Phone: 0414 267 196 Page 5 of 21

INITIAL FEASIBILITY STUDY PURPOSES ONLY
272
273
274
275
276
277
278
279
280
281
282
283
284
285
286
287
288
289
290
291
292
293
294
295
296
297
298
299
300
301
A B C D E F G H I J K L M N
Car parking ratio - No. of Cars per unit (inc VP) 7.0 7.0 7.0Lettable Floor AreaNo.of Cars Req. Total
No.of Open Space car parks RequiredOffice
Car parking ratio - No. of Cars per unit (inc VP) 7.0 7.0 7.0Lettable Floor Area 30 m²
No.of Cars Req. Total 2
No.of Open Space car parks Required 2No.of Open Space car parks Required - TOTAL 9 cars 19 cars
Area per carpark 14.50 m² 14.50 m² 14.50 m²
Area 131m² 276m² OK 407m² 131 m² 276 m²
Driveways (external) 600m² 1,956m² OK 2,556m² 600 m² 1,956 m²
Roads to Units 200m² OK 200m² 200 m²
Landscaping 2,348m² OK 2,348m² 2,348 m²
Other (by subtraction) 4,029m² 2,298m² 124m² OK 6,451m² 4,029 m² 2,298 m² 124 m²
TOTAL EXTERNAL AREAS 4,029m² 3,229m² 4,704m² OK 11,962m² 4,029 m² 3,229 m² 4,704 m²
SITE AREA (see above) 4,029m² 4,563m² 5,012m² OK 13,604m² 4,029 m² 4,563 m² 5,012 m²
Floor Area AnalysisExisting Design
Core Building 4,160m² OK 4,160m² 4,160 m²
Secondary Building 496m² OK 496m² 496 m²
Other Building 60m² OK 60m² 60 m²
Undercover Parking 1,177m² OK 1,177m² 1,177 m²
Total Existing Design ED 5,337m² 556m² OK 5,893m² 5,337 m² 556 m²
Proof OK OK OK OK
Preferred Scenario (see above) PS OK
Revised Development Objective DO 8,000m² 5,000m² OK 13,000m² 8,000 m² 5,000 m²
Development Strategic Choice Enter each cell without formulaefor scenario calc purposes ED ED ED ED
Total For Financial Analysis Purposes 5,337m² 556m² OK 5,893m² 5,337 m² 556 m²301
302
303
304
305
306
307
308
309
310
311
312
313
314
315
Total For Financial Analysis Purposes 5,337m² 556m² OK 5,893m² 5,337 m² 556 m²
Footprint Analysis - M2Existing Design 1,642m² 1,334m² 308m²
Preferred ScenarioRevised Development Objective 4,500m² 2,000m² 2,500m²
Core Building 1,334 m² OK 1,334 m² 1,334 m²
Secondary Building248 m² OK 248 m² 248 m²
Other Building
60 m² OK 60 m² 60 m²
Open Space parking131 m² 276 m² OK 407 m² 131 m² 276 m²
Roads 800 m² 1,956 m² OK 2,756 m² 800 m² 1,956 m²
Landscaping etc 4,029 m² 2,298 m² 2,472 m² OK 8,799 m² 4,029 m² 2,298 m² 2,472 m²
Total Existing Design ED 4,029 m² 4,563 m² 5,012 m² OK 13,604 m² 4,029 m² 4,563 m² 5,012 m²
Site Analysis (M2) - Existing Design
File: Feasibility - Mixed Use Template - Aug 2011 FINAL.xlsx
(22/08/2012 8:54 AM)
Prepared by: Bill Wright
GENESIS MANAGEMENT SERVICES PTY LTD
P O Box 260 Crafers SA 5152 Phone: 0414 267 196 Page 6 of 21
INITIAL FEASIBILITY STUDY PURPOSES ONLY
316
317
318
319
320
321
322
323
324
325
326
327
328
329
330
331
A B C D E F G H I J K L M N
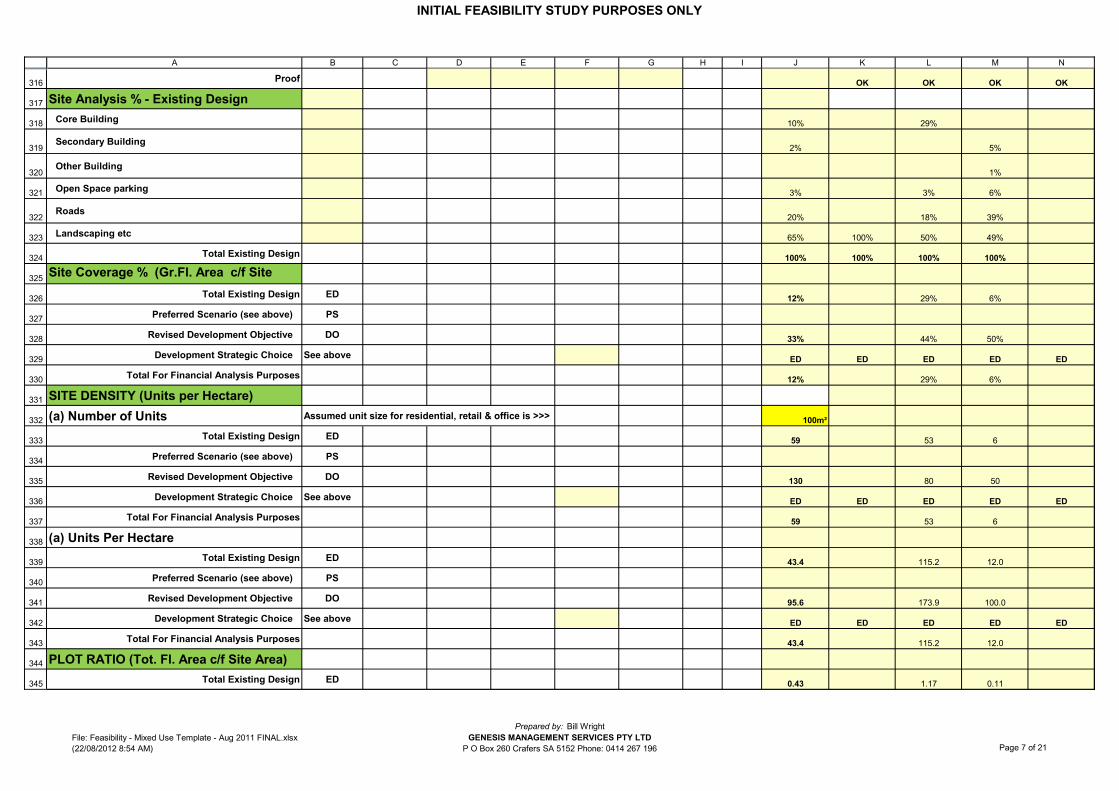
Proof OK OK OK OK
Site Analysis % - Existing Design
Core Building 10% 29%
Secondary Building2% 5%
Other Building1%
Open Space parking 3% 3% 6%
Roads20% 18% 39%
Landscaping etc 65% 100% 50% 49%
Total Existing Design 100% 100% 100% 100%
Site Coverage % (Gr.Fl. Area c/f Site
Area) Total Existing Design ED 12% 29% 6%
Preferred Scenario (see above) PS
Revised Development Objective DO 33% 44% 50%
Development Strategic Choice See above ED ED ED ED ED
Total For Financial Analysis Purposes 12% 29% 6%
SITE DENSITY (Units per Hectare)
(a) Number of Units Assumed unit size for residential, retail & office is >>>332
333
334
335
336
337
338
339
340
341
342
343
344
345
(a) Number of Units Assumed unit size for residential, retail & office is >>> 100m²
Total Existing Design ED 59 53 6
Preferred Scenario (see above) PS
Revised Development Objective DO 130 80 50
Development Strategic Choice See above ED ED ED ED ED
Total For Financial Analysis Purposes 59 53 6
(a) Units Per Hectare
Total Existing Design ED 43.4 115.2 12.0
Preferred Scenario (see above) PS
Revised Development Objective DO 95.6 173.9 100.0
Development Strategic Choice See above ED ED ED ED ED
Total For Financial Analysis Purposes 43.4 115.2 12.0
PLOT RATIO (Tot. Fl. Area c/f Site Area)
Total Existing Design ED 0.43 1.17 0.11
File: Feasibility - Mixed Use Template - Aug 2011 FINAL.xlsx
(22/08/2012 8:54 AM)
Prepared by: Bill Wright
GENESIS MANAGEMENT SERVICES PTY LTD
P O Box 260 Crafers SA 5152 Phone: 0414 267 196 Page 7 of 21

INITIAL FEASIBILITY STUDY PURPOSES ONLY
346
347
348
349
350
351
352
353
354
355
356
357
358
359
360
361
362
363
A B C D E F G H I J K L M N
Preferred Scenario (see above) PS
Revised Development Objective DO 0.96 1.75 1.00
Development Strategic Choice See above ED ED ED ED ED
Total For Financial Analysis Purposes 0.43 1.17 0.11
Lettable (M2)
Existing Design
Core Building #DIV/0! 2,240 m² OK 2,240 m² 2,240 m²
Secondary Building #DIV/0! 248 m² OK 248 m² 248 m²
Other Building #DIV/0! 30 m² OK 30 m² 30 m²
Undercover Parking #DIV/0! OK
Open Space parking #DIV/0! OK
Roads #DIV/0! OK
Landscaping etc #DIV/0! OK
Total Existing Design ED 2,240 m² 278 m² OK 2,518 m² 2,240 m² 278 m²
Proof OK OK OK OK
Preferred Scenario (see above) PS OK
Revised Development Objective DO 7,200 m² 4,500 m² OK 11,700 m² 7,200 m² 4,500 m²
Development Strategic Choice ED ED ED ED
Total364
365
366
367
368
369
370
371
372
373
374
375
376
377
378
Total 2,240 m² 278 m² OK 2,518 m² 2,240 m² 278 m²
CAR PARKING (Cars)
Existing Design
Undercover Parking 22 cars OK 22 cars 22 cars
Open Space parking 9 cars 19 cars OK 28 cars 9 cars 19 cars
Total ED 31 cars 19 cars OK 50 cars 31 cars 19 cars
Preferred Scenario
Undercover Parking OK
Open Space parking OK
Total PS OK
Revised Development Objective
Undercover Parking OK
Open Space parking OK
Total DO OK
Development Strategic Choice ED ED ED ED
File: Feasibility - Mixed Use Template - Aug 2011 FINAL.xlsx
(22/08/2012 8:54 AM)
Prepared by: Bill Wright
GENESIS MANAGEMENT SERVICES PTY LTD
P O Box 260 Crafers SA 5152 Phone: 0414 267 196 Page 8 of 21
INITIAL FEASIBILITY STUDY PURPOSES ONLY
379
380
381
382
383
384
385
386
387
388
389
390
391
392
393
394
395
396
397
A B C D E F G H I J K L M N
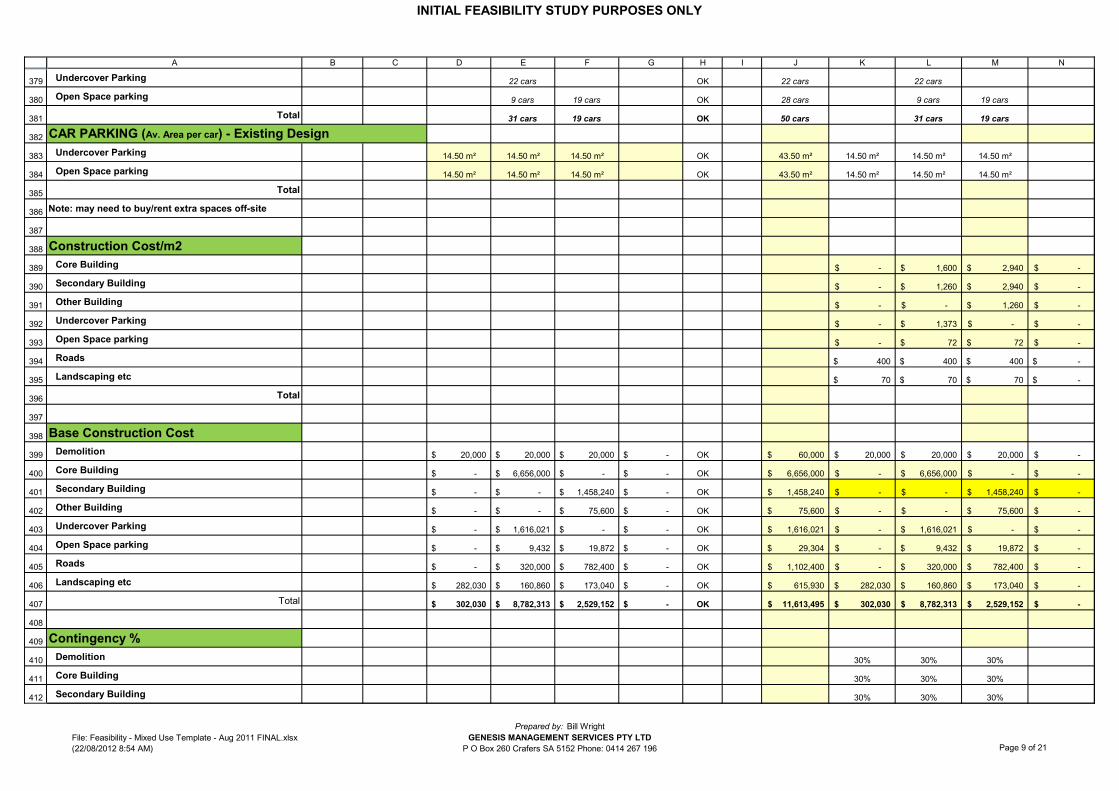
Undercover Parking 22 cars OK 22 cars 22 cars
Open Space parking 9 cars 19 cars OK 28 cars 9 cars 19 cars
Total 31 cars 19 cars OK 50 cars 31 cars 19 cars
Undercover Parking 14.50 m² 14.50 m² 14.50 m² OK 43.50 m² 14.50 m² 14.50 m² 14.50 m²
Open Space parking 14.50 m² 14.50 m² 14.50 m² OK 43.50 m² 14.50 m² 14.50 m² 14.50 m²
Total
Note: may need to buy/rent extra spaces off-site
Construction Cost/m2
Core Building -$ 1,600$ 2,940$ -$
Secondary Building -$ 1,260$ 2,940$ -$
Other Building -$ -$ 1,260$ -$
Undercover Parking -$ 1,373$ -$ -$
Open Space parking -$ 72$ 72$ -$
Roads 400$ 400$ 400$ -$
Landscaping etc 70$ 70$ 70$ -$
Total
CAR PARKING (Av. Area per car) - Existing Design
397
398
399
400
401
402
403
404
405
406
407
408
409
410
411
412
Base Construction Cost
Demolition 20,000$ 20,000$ 20,000$ -$ OK 60,000$ 20,000$ 20,000$ 20,000$ -$
Core Building -$ 6,656,000$ -$ -$ OK 6,656,000$ -$ 6,656,000$ -$ -$
Secondary Building -$ -$ 1,458,240$ -$ OK 1,458,240$ -$ -$ 1,458,240$ -$
Other Building -$ -$ 75,600$ -$ OK 75,600$ -$ -$ 75,600$ -$
Undercover Parking -$ 1,616,021$ -$ -$ OK 1,616,021$ -$ 1,616,021$ -$ -$
Open Space parking -$ 9,432$ 19,872$ -$ OK 29,304$ -$ 9,432$ 19,872$ -$
Roads -$ 320,000$ 782,400$ -$ OK 1,102,400$ -$ 320,000$ 782,400$ -$
Landscaping etc 282,030$ 160,860$ 173,040$ -$ OK 615,930$ 282,030$ 160,860$ 173,040$ -$
Total 302,030$ 8,782,313$ 2,529,152$ -$ OK 11,613,495$ 302,030$ 8,782,313$ 2,529,152$ -$
Contingency %
Demolition 30% 30% 30%
Core Building 30% 30% 30%
Secondary Building 30% 30% 30%
File: Feasibility - Mixed Use Template - Aug 2011 FINAL.xlsx
(22/08/2012 8:54 AM)
Prepared by: Bill Wright
GENESIS MANAGEMENT SERVICES PTY LTD
P O Box 260 Crafers SA 5152 Phone: 0414 267 196 Page 9 of 21
INITIAL FEASIBILITY STUDY PURPOSES ONLY
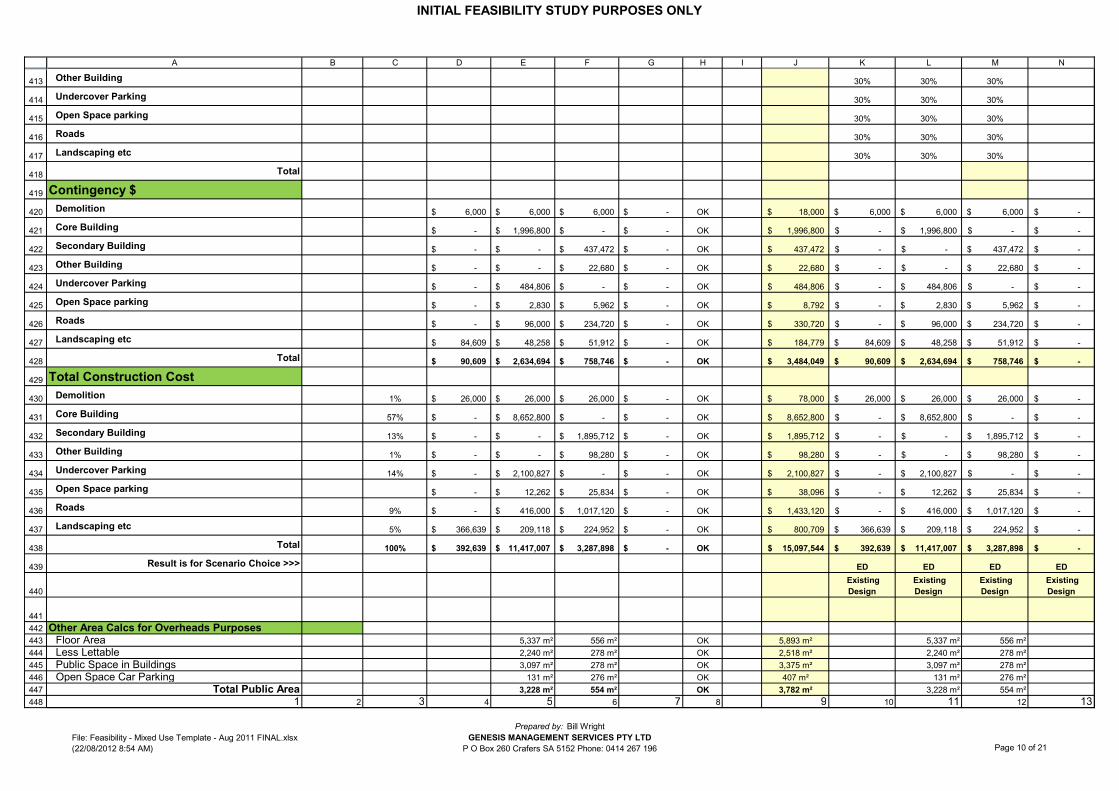
413
414
415
416
417
418
419
420
421
422
423
424
425
426
427
428
429
430
431
A B C D E F G H I J K L M N
Other Building 30% 30% 30%
Undercover Parking 30% 30% 30%
Open Space parking 30% 30% 30%
Roads 30% 30% 30%
Landscaping etc 30% 30% 30%
Total
Contingency $
Demolition 6,000$ 6,000$ 6,000$ -$ OK 18,000$ 6,000$ 6,000$ 6,000$ -$
Core Building -$ 1,996,800$ -$ -$ OK 1,996,800$ -$ 1,996,800$ -$ -$
Secondary Building -$ -$ 437,472$ -$ OK 437,472$ -$ -$ 437,472$ -$
Other Building -$ -$ 22,680$ -$ OK 22,680$ -$ -$ 22,680$ -$
Undercover Parking -$ 484,806$ -$ -$ OK 484,806$ -$ 484,806$ -$ -$
Open Space parking -$ 2,830$ 5,962$ -$ OK 8,792$ -$ 2,830$ 5,962$ -$
Roads -$ 96,000$ 234,720$ -$ OK 330,720$ -$ 96,000$ 234,720$ -$
Landscaping etc 84,609$ 48,258$ 51,912$ -$ OK 184,779$ 84,609$ 48,258$ 51,912$ -$
Total 90,609$ 2,634,694$ 758,746$ -$ OK 3,484,049$ 90,609$ 2,634,694$ 758,746$ -$
Total Construction Cost
Demolition 1% 26,000$ 26,000$ 26,000$ -$ OK 78,000$ 26,000$ 26,000$ 26,000$ -$
Core Building 57% -$ 8,652,800$ -$ -$ OK 8,652,800$ -$ 8,652,800$ -$ -$ 431
432
433
434
435
436
437
438
439
440
441
442
443
444
445
446
447
448
Core Building 57% -$ 8,652,800$ -$ -$ OK 8,652,800$ -$ 8,652,800$ -$ -$
Secondary Building 13% -$ -$ 1,895,712$ -$ OK 1,895,712$ -$ -$ 1,895,712$ -$
Other Building 1% -$ -$ 98,280$ -$ OK 98,280$ -$ -$ 98,280$ -$
Undercover Parking 14% -$ 2,100,827$ -$ -$ OK 2,100,827$ -$ 2,100,827$ -$ -$
Open Space parking -$ 12,262$ 25,834$ -$ OK 38,096$ -$ 12,262$ 25,834$ -$
Roads 9% -$ 416,000$ 1,017,120$ -$ OK 1,433,120$ -$ 416,000$ 1,017,120$ -$
Landscaping etc 5% 366,639$ 209,118$ 224,952$ -$ OK 800,709$ 366,639$ 209,118$ 224,952$ -$
Total 100% 392,639$ 11,417,007$ 3,287,898$ -$ OK 15,097,544$ 392,639$ 11,417,007$ 3,287,898$ -$
Result is for Scenario Choice >>> ED ED ED ED
Existing
Design
Existing
Design
Existing
Design
Existing
Design
Other Area Calcs for Overheads PurposesFloor Area 5,337 m² 556 m² OK 5,893 m² 5,337 m² 556 m²
Less Lettable 2,240 m² 278 m² OK 2,518 m² 2,240 m² 278 m²
Public Space in Buildings 3,097 m² 278 m² OK 3,375 m² 3,097 m² 278 m²
Open Space Car Parking 131 m² 276 m² OK 407 m² 131 m² 276 m²
Total Public Area 3,228 m² 554 m² OK 3,782 m² 3,228 m² 554 m²
1 2 3 4 5 6 7 8 9 10 11 12 13
File: Feasibility - Mixed Use Template - Aug 2011 FINAL.xlsx
(22/08/2012 8:54 AM)
Prepared by: Bill Wright
GENESIS MANAGEMENT SERVICES PTY LTD
P O Box 260 Crafers SA 5152 Phone: 0414 267 196 Page 10 of 21

INITIAL FEASIBILITY STUDY PURPOSES ONLY
449
450
451
452
453
454
455
456
457
458
459
460
461
462
463
464
465
466
467
468
469
470
471
472
473
474
475
476
A B C D E F G H I J K L M N
Electricity to Public Areas: 1 3,228 m² 554 m² OK 3,782 m² 3,228 m² 554 m²
Caretaking & Cleaning: 2 3,228 m² 554 m² OK 3,782 m² 3,228 m² 554 m²
Security Service: 3 3,228 m² 554 m² OK 3,782 m² 3,228 m² 554 m²
Sundries: 4 3,228 m² 554 m² OK 3,782 m² 3,228 m² 554 m²
Building Repairs & Maintenance: 5 5,337 m² 556 m² OK 5,893 m² 5,337 m² 556 m²
Fire Alarm & Sprinkler Service: 6 5,337 m² 556 m² OK 5,893 m² 5,337 m² 556 m²
Lift Maintenance & Operation: 7 5,337 m² 556 m² OK 5,893 m² 5,337 m² 556 m²
Air Conditioning Maintenance & Operation: 8 5,337 m² 556 m² OK 5,893 m² 5,337 m² 556 m²
Management Fees & Void Allowance: 9 5,337 m² 556 m² OK 5,893 m² 5,337 m² 556 m²
PROJECT TIMETABLECOSTS FIRM TO >>> 01-Mar-11 Mar-11
INSERT START DATE >>> 01-Mar-11 Mar-11
FOR GRAPH
CHOOSE
SHEET NO
>>>
PARK
(MONTHS) APARK
(MONTHS)
AGED
(MONTHS)
OFFICES
(MONTHS) (MONTHS)
Months Duration
Wait to Start: 3.00 3.00 6.00 9.00 3.00
PRELIMINARY SKETCH PLANS: 2.00 2.00 2.00 1.00 2.00
Wait to Apply: 1.00 1.00 1.00 1.00 1.00
DEVELOPMENT APPROVALS: 3.00 3.00 3.00 3.00 3.00
Wait to Design: 1.00 1.00 1.00 1.00 1.00
DESIGN DEVELOPMENT: 2.00 2.00 2.00 2.00 2.00
Wait to Start Tender Process: 1.00 1.00 1.00 1.00 1.00
TENDERS & CONTRACTS: 2.00 2.00 2.00 2.00 2.00
Wait to Start Construction 1.00 1.00 1.00 1.00 1.00
CONSTRUCTION: 2.00 2.00 12.00 12.00 2.00
SALE/HAND-OVER: 3.00 Max 12 3.00 1.00 1.00 3.00
Total Months from Purchase to Completion: 18.0 Mth(s) 31.0 Mth(s) 33.0 Mth(s) 18.0 Mth(s)
Start Month476
477
478
479
480
481
482
483
484
485
486
487
488
489
490
491
492
493
494
495
496
497
498
499
500
501
Start Month
Wait to Start:
PRELIMINARY SKETCH PLANS: 3.00 3.00 6.00 9.00 3.00
Wait to Apply: 5.00 5.00 8.00 10.00 5.00
DEVELOPMENT APPROVALS: 6.00 6.00 9.00 11.00 6.00
Wait to Design: 9.00 9.00 12.00 14.00 9.00
DESIGN DEVELOPMENT: 10.00 10.00 13.00 15.00 10.00
Wait to Start Tender Process: 12.00 12.00 15.00 17.00 12.00
TENDERS & CONTRACTS: 13.00 13.00 16.00 18.00 13.00
Wait to Start Construction 15.00 15.00 18.00 20.00 15.00
CONSTRUCTION: 16.00 16.00 19.00 21.00 16.00
SALE/HAND-OVER: 18.00 18.00 31.00 33.00 18.00
Days
Wait to Start: 90 180 270 90
PRELIMINARY SKETCH PLANS: 60 60 30 60
Wait to Apply: 30 30 30 30
DEVELOPMENT APPROVALS: 90 90 90 90
Wait to Design: 30 30 30 30
DESIGN DEVELOPMENT: 60 60 60 60
Wait to Start Tender Process: 30 30 30 30
TENDERS & CONTRACTS: 60 60 60 60
Wait to Start Construction 30 30 30 30
CONSTRUCTION: 60 360 360 60
SALE/HAND-OVER: 90 30 30 90
Start Date
Wait to Start: 30-May-11 28-Aug-11 26-Nov-11 30-May-11
File: Feasibility - Mixed Use Template - Aug 2011 FINAL.xlsx
(22/08/2012 8:54 AM)
Prepared by: Bill Wright
GENESIS MANAGEMENT SERVICES PTY LTD
P O Box 260 Crafers SA 5152 Phone: 0414 267 196 Page 11 of 21

INITIAL FEASIBILITY STUDY PURPOSES ONLY
502
503
504
505
506
507
508
509
510
511
512
513
514
515
516
517
518
519
520
521
522
523
524
525
526
527
528
529
530
531
532
533
A B C D E F G H I J K L M N
PRELIMINARY SKETCH PLANS: 29-Jul-11 27-Oct-11 26-Dec-11 29-Jul-11
Wait to Apply: 28-Aug-11 26-Nov-11 25-Jan-12 28-Aug-11
DEVELOPMENT APPROVALS: 26-Nov-11 24-Feb-12 24-Apr-12 26-Nov-11
Wait to Design: 26-Dec-11 25-Mar-12 24-May-12 26-Dec-11
DESIGN DEVELOPMENT: 24-Feb-12 24-May-12 23-Jul-12 24-Feb-12
Wait to Start Tender Process: 25-Mar-12 23-Jun-12 22-Aug-12 25-Mar-12
TENDERS & CONTRACTS: 24-May-12 22-Aug-12 21-Oct-12 24-May-12
Wait to Start Construction 23-Jun-12 21-Sep-12 20-Nov-12 23-Jun-12
CONSTRUCTION: 22-Aug-12 16-Sep-13 15-Nov-13 22-Aug-12
SALE/HAND-OVER: 20-Nov-12 16-Oct-13 15-Dec-13 20-Nov-12
Start Month
Wait to Start: May-11 Aug-11 Nov-11 May-11
PRELIMINARY SKETCH PLANS: Jul-11 Oct-11 Dec-11 Jul-11
Wait to Apply: Aug-11 Nov-11 Jan-12 Aug-11
DEVELOPMENT APPROVALS: Nov-11 Feb-12 Apr-12 Nov-11
Wait to Design: Dec-11 Mar-12 May-12 Dec-11
DESIGN DEVELOPMENT: Feb-12 May-12 Jul-12 Feb-12
Wait to Start Tender Process: Mar-12 Jun-12 Aug-12 Mar-12
TENDERS & CONTRACTS: May-12 Aug-12 Oct-12 May-12
Wait to Start Construction Jun-12 Sep-12 Nov-12 Jun-12
CONSTRUCTION: Aug-12 Sep-13 Nov-13 Aug-12
SALE/HAND-OVER: Nov-12 Oct-13 Dec-13 Nov-12
0 3 6 9 12 15 18 21 24
Wait to Start:
PRELIMINARY SKETCH PLANS:
PARK (MONTHS)
533
534
535
536
537
538
539
540
541
542
543
544
545
546
547
548
549
550
551
552
553
554
555
556
557
558
TOTAL PARK AGED OFFICES
CAPITAL EXPENDITURELAND COSTS �
Land Purchase Price: 742,222$ 840,596$ 923,311$ -$ OK $ 2,506,129 $ 742,222 $ 840,596 $ 923,311 $ -
29.6% 33.5% 36.8% 100.0% 29.62% 33.54% 36.84%
Other Land Costs:
PRELIMINARY SKETCH PLANS:
Wait to Apply:
DEVELOPMENT APPROVALS:
Wait to Design:
DESIGN DEVELOPMENT:
Wait to Start Tender Process:
TENDERS & CONTRACTS:
Wait to Start Construction
CONSTRUCTION:
SALE/HAND-OVER:
File: Feasibility - Mixed Use Template - Aug 2011 FINAL.xlsx
(22/08/2012 8:54 AM)
Prepared by: Bill Wright
GENESIS MANAGEMENT SERVICES PTY LTD
P O Box 260 Crafers SA 5152 Phone: 0414 267 196 Page 12 of 21

INITIAL FEASIBILITY STUDY PURPOSES ONLY
559
560
561
562
563
564
565
566
567
568
569
570
571
572
573
574
575
576
577
578
579
580
581
582
583
584
585
586
587
588
A B C D E F G H I J K L M N
Stamp Duty: On First 1,000,000$ 41,330$
Stamp Duty: Remaining 1,507,000$ 75,350$
Stamp Duty: Total 34,561$ 39,134$ 42,985$ -$ OK 116,680$ $ 34,561 $ 39,134 $ 42,985 $ -
Legal Costs: 4.50% 33,404$ 37,825$ 41,547$ -$ OK 112,776$ $ 33,404 $ 37,825 $ 41,547 $ -
Soil Tests: 2,962$ 3,354$ 3,684$ -$ OK 10,000$ $ 2,962 $ 3,354 $ 3,684 $ -
Land Surveyor's Fees: 2,962$ 3,354$ 3,684$ -$ OK 10,000$ $ 2,962 $ 3,354 $ 3,684 $ -
Other Land Costs: 73,889$ 83,667$ 91,900$ -$ OK 249,456$ 73,889$ 83,667$ 91,900$ -$
816,111$ 924,263$ 1,015,211$ -$ OK 2,755,585$ 816,111$ 924,263$ 1,015,211$ -$
BUILDING COSTS �
Contract Price: 392,639$ 11,417,007$ 3,287,898$ -$ OK 15,097,544$ 392,639$ 11,417,007$ 3,287,898$ -$
Escalation on Contract Price From Sheets 27,642$ 1,591,531$ 499,103$ -$ OK 2,118,276$ 27,642$ 1,591,531$ 499,103$ -$
Estimated Construction Cost 420,281$ 13,008,538$ 3,787,001$ -$ OK 17,215,820$ 420,281$ 13,008,538$ 3,787,001$ -$
Fees (Escalated):
Architects Fees: 9.00% 37,825$ 1,170,768$ 340,830$ -$ OK 1,549,423$ 37,825$ 1,170,768$ 340,830$ -$
Structural Engineers Fees: 4.50% 18,913$ 585,384$ 170,415$ -$ OK 774,712$ 18,913$ 585,384$ 170,415$ -$
Electrical Engineers Fees: 4.50% 18,913$ 585,384$ 170,415$ -$ OK 774,712$ 18,913$ 585,384$ 170,415$ -$
Mechanical & Lift Engineers Fees: 4.50% 18,913$ 585,384$ 170,415$ -$ OK 774,712$ 18,913$ 585,384$ 170,415$ -$
Hydraulic Engineers Fees: 4.50% 18,913$ 585,384$ 170,415$ -$ OK 774,712$ 18,913$ 585,384$ 170,415$ -$
Landscape Architects Fees: 4.50% 18,913$ 585,384$ 170,415$ -$ OK 774,712$ 18,913$ 585,384$ 170,415$ -$
Quantity Surveyors Fees: 4.50% 18,913$ 585,384$ 170,415$ -$ OK 774,712$ 18,913$ 585,384$ 170,415$ -$
Specialist Consultants Fees: 4.50% 18,913$ 585,384$ 170,415$ -$ OK 774,712$ 18,913$ 585,384$ 170,415$ -$
Project Management Fees: 4.50% 18,913$ 585,384$ 170,415$ -$ OK 774,712$ 18,913$ 585,384$ 170,415$ -$
Local Council & Planning Authority Fees: 1.40% 5,884$ 182,120$ 53,018$ -$ OK 241,022$ 5,884$ 182,120$ 53,018$ -$
Sub-Total 195,013$ 6,035,960$ 1,757,168$ -$ OK 7,988,141$ 195,013$ 6,035,960$ 1,757,168$ -$
TOTAL 615,294$ 19,044,498$ 5,544,169$ -$ OK 25,203,961$ 615,294$ 19,044,498$ 5,544,169$ -$
RATES & TAXES �
Council Rates: 0.005109 ¢ 41,933$ 47,483$ 52,155$ -$ OK 141,571$ 41,933$ 47,483$ 52,155$ -$
Land Tax:On First 1,000,000$ 12,425$
Land Tax:On Remaining 1,507,000$ 60,280$
589
590
591
592
593
594
595
596
597
598
599
600
601
602
603
604
605
606
607
608
609
610
611
612
613
614
Land Tax:Total 21,535$ 24,385$ 26,785$ -$ OK 72,705$ 21,535$ 24,385$ 26,785$ -$
Water: 0.005350 ¢ 43,911$ 49,723$ 54,615$ -$ OK 148,249$ 43,911$ 49,723$ 54,615$ -$
Sewerage: 0.006475 ¢ 53,145$ 60,178$ 66,099$ 1$ OK 179,423$ 53,145$ 60,178$ 66,099$ -$
Drainage: * Not applicable -$ -$ -$ -$ OK -$ -$ -$ -$ -$
Other Levies (Catchment & ESL): 14,774$ 16,729$ 18,375$ -$ OK 49,878$ 14,774$ 16,729$ 18,375$ -$
Annual Rates & Taxes Cost: 175,298$ 198,498$ 218,029$ 1$ OK 591,826$ 175,298$ 198,498$ 218,029$ -$
Monthly Rates & Taxes Cost: 14,608$ 16,542$ 18,169$ -$ OK 49,319$ 14,608$ 16,542$ 18,169$ -$
Planning & Construction Time: 15 Mth(s) 25 Mth(s) 24 Mth(s) 15 Mth(s)
TOTAL 219,120$ 413,550$ 436,056$ -$ OK 1,068,726$ 219,120$ 413,550$ 436,056$ -$
INTEREST �
Interest Rate (pa): 9.00% 9.00% 9.00%TOTAL (see below) 1,725,311$ 149,835$ 1,071,881$ 503,595$ -$
SUNDRY EXPENSES �
Owner's Moving Expenses: 9,000$ 9,000$ 9,000$ -$ OK 27,000$ 9,000$ 9,000$ 9,000$ -$
Furnishings: 250,000$ 250,000$ 250,000$ -$ OK 750,000$ 250,000$ 250,000$ 250,000$ -$
Market Studies: 9,000$ 9,000$ 9,000$ -$ OK 27,000$ 9,000$ 9,000$ 9,000$ -$
Advertising & Signs: 9,000$ 9,000$ 9,000$ -$ OK 27,000$ 9,000$ 9,000$ 9,000$ -$
Property Department's Costs: 9,000$ 9,000$ 9,000$ -$ OK 27,000$ 9,000$ 9,000$ 9,000$ -$
Owner's Overhead Expenses: 9,000$ 9,000$ 9,000$ -$ OK 27,000$ 9,000$ 9,000$ 9,000$ -$
Letting Agents Fees: 9,000$ 9,000$ 9,000$ -$ OK 27,000$ 9,000$ 9,000$ 9,000$ -$
Tenant Inducements: 9,000$ 9,000$ 9,000$ -$ OK 27,000$ 9,000$ 9,000$ 9,000$ -$
Contingency: -$ -$ -$ -$ OK -$ -$ -$ -$ -$
TOTAL 313,000$ 313,000$ 313,000$ -$ OK 939,000$ 313,000$ 313,000$ 313,000$ -$
TOTAL CAPITAL EXPENDITURE: 31,692,583$ 2,113,360$ 21,767,192$ 7,812,031$ -$
TOTAL CAPITAL EXPENDITURE: $'M 31.7$ 2.1$ 21.8$ 7.8$ -$
DEVELOPMENT P&L
File: Feasibility - Mixed Use Template - Aug 2011 FINAL.xlsx
(22/08/2012 8:54 AM)
Prepared by: Bill Wright
GENESIS MANAGEMENT SERVICES PTY LTD
P O Box 260 Crafers SA 5152 Phone: 0414 267 196 Page 13 of 21

INITIAL FEASIBILITY STUDY PURPOSES ONLY
615
616
617
618
619
620
621
622
623
624
625
626
627
628
629
630
631
632
633
634
635
636
637
638
639
640
641
642
643
644
645
646
A B C D E F G H I J K L M N
SALE PRICE � 2,277,689$ 24,006,561$ 8,477,786$ -$ OK 34,762,036$ 2,277,689$ 24,006,561$ 8,477,786$ -$
LESS DEVELOPMENT COSTS
Land Costs: Capex 816,111$ 924,263$ 1,015,211$ -$ OK 2,755,585$ 816,111$ 924,263$ 1,015,211$ -$
Building & Development: Capex 615,294$ 19,044,498$ 5,544,169$ -$ OK 25,203,961$ 615,294$ 19,044,498$ 5,544,169$ -$
Rates & Taxes (Construct): Capex 219,120$ 413,550$ 436,056$ -$ OK 1,068,726$ 219,120$ 413,550$ 436,056$ -$
Other Expenses: Capex 313,000$ 313,000$ 313,000$ -$ OK 939,000$ 313,000$ 313,000$ 313,000$ -$
Total Development Cost (exc. Interest): 1,963,525$ 20,695,311$ 7,308,436$ -$ OK 29,967,272$ 1,963,525$ 20,695,311$ 7,308,436$ -$
Developers Margin % 16% 16% 16%
Developers Margin $ 314,164$ 3,311,250$ 1,169,350$ -$ OK 4,794,764$ 314,164$ 3,311,250$ 1,169,350$ -$
GM % 14% 14% 14% 14%
LESS OTHER COSTS 2
Interest Cost on Development period Capex 149,835$ 1,071,881$ 503,595$ -$ OK 1,725,311$ 149,835$ 1,071,881$ 503,595$ -$
Mths to sell See program 3.00 1.00 1.00 3.00
Council Rates: 10,483$ 3,957$ 4,346$ -$ OK 18,786$ 10,483$ 3,957$ 4,346$ -$
Land Tax: 5,384$ 2,032$ 2,232$ -$ OK 9,648$ 5,384$ 2,032$ 2,232$ -$
Water & Sewerage Rates: 24,264$ 9,158$ 10,060$ -$ OK 43,482$ 24,264$ 9,158$ 10,060$ -$
Insurance (after handover): 0.10% Per Month 6,833$ 24,007$ 8,478$ -$ OK 39,318$ 6,833$ 24,007$ 8,478$ -$
Security Service (after handover): 0.05% Per Month 3,417$ 12,003$ 4,239$ -$ OK 19,659$ 3,417$ 12,003$ 4,239$ -$
Agents Fees: 1.00% 22,777$ 240,066$ 84,778$ -$ OK 347,621$ 22,777$ 240,066$ 84,778$ -$
Interest Cost on Selling period 47,551$ 163,254$ 58,590$ -$ OK 269,395$ 47,551$ 163,254$ 58,590$ -$
270,544$ 1,526,358$ 676,318$ -$ OK 2,473,220$ 270,544$ 1,526,358$ 676,318$ -$
% Revenue 7.1% 11.9% 6.4% 8.0%
NET MARGIN 43,620$ 1,784,892$ 493,032$ -$ OK 2,321,544$ 43,620$ 1,784,892$ 493,032$ -$
NET MARGIN - $'M 2.3$ -$ 1.8$ 0.5$ -$
Net Margin /Revenue 7% 2% 7% 6%
Net Margin /Capex 7% 2% 8% 6%
Net Margin /Total Cost 7% 2% 8% 6% #DIV/0!
Total Capex 2,113,360$ 21,767,192$ 7,812,031$ -$ OK 31,692,583$ 2,113,360$ 21,767,192$ 7,812,031$ -$
Proof OK OK OK OK OK
FINANCINGValuation %
Land Costs: 100% 100% 100%646
647
648
649
650
651
652
653
654
655
656
657
658
659
660
661
662
663
664
665
666
667
668
669
670
671
672
Land Costs: 100% 100% 100%
Building & Development: Contract price 100% 100% 100%
Building & Development: Escalation
Building & Development: Professional Fees 100% 100% 100%
Rates & Taxes (Construct):
Other Expenses (Development):
Other Costs (Interest & Selling Costs):
Valuation $
Land Costs: 816,111$ 924,263$ 1,015,211$ -$ OK 2,755,585$ 816,111$ 924,263$ 1,015,211$ -$
Building & Development: Contract price 392,639$ 11,417,007$ 3,287,898$ -$ OK 15,097,544$ 392,639$ 11,417,007$ 3,287,898$ -$
Building & Development: Escalation -$ -$ -$ -$ OK -$ -$ -$ -$ -$
Building & Development: Professional Fees 195,013$ 6,035,960$ 1,757,168$ -$ OK 7,988,141$ 195,013$ 6,035,960$ 1,757,168$ -$
Rates & Taxes (Construct): -$ -$ -$ -$ OK -$ -$ -$ -$ -$
Other Expenses (Development): -$ -$ -$ -$ OK -$ -$ -$ -$ -$
Other Costs (Interest & Selling Costs): -$ -$ -$ -$ OK -$ -$ -$ -$ -$
Borrowing %
Land Costs: 100% 100% 100%
Building & Development: Contract price 100% 100% 100%
Building & Development: Escalation
Building & Development: Professional Fees 100% 100% 100%
Rates & Taxes (Construct):
Other Expenses (Development):
Other Costs (Interest & Selling Costs):
Borrowing $
Land Costs: 816,111$ 924,263$ 1,015,211$ -$ OK 2,755,585$ 816,111$ 924,263$ 1,015,211$ -$
Building & Development: Contract price 392,639$ 11,417,007$ 3,287,898$ -$ OK 15,097,544$ 392,639$ 11,417,007$ 3,287,898$ -$
Building & Development: Escalation -$ -$ -$ -$ OK -$ -$ -$ -$ -$
File: Feasibility - Mixed Use Template - Aug 2011 FINAL.xlsx
(22/08/2012 8:54 AM)
Prepared by: Bill Wright
GENESIS MANAGEMENT SERVICES PTY LTD
P O Box 260 Crafers SA 5152 Phone: 0414 267 196 Page 14 of 21

INITIAL FEASIBILITY STUDY PURPOSES ONLY
673
674
675
676
677
678
679
680
681
682
683
684
685
686
687
688
689
690
691
692
693
694
695
696
697
698
699
700
701
702
703
704
A B C D E F G H I J K L M N
Building & Development: Professional Fees 195,013$ 6,035,960$ 1,757,168$ -$ OK 7,988,141$ 195,013$ 6,035,960$ 1,757,168$ -$
Rates & Taxes (Construct): -$ -$ -$ -$ OK -$ -$ -$ -$ -$
Other Expenses (Development): -$ -$ -$ -$ OK -$ -$ -$ -$ -$
Other Costs (Interest & Selling Costs): -$ -$ -$ -$ OK -$ -$ -$ -$ -$
Total 1,403,763$ 18,377,230$ 6,060,277$ -$ OK 25,841,270$ 1,403,763$ 18,377,230$ 6,060,277$ -$
Average Borrowing/Capex % 82% 66% 84% 78%
Assumed Average Borrowing/Capex % Change to = above line (this routine avoids circular N/A cells) 100% 100% 100% 100%
Borrowing - % Mix
Land Costs: 11% 58% 5% 17%
Building & Development: Contract price 58% 28% 62% 54%
Building & Development: Escalation
Building & Development: Professional Fees 31% 14% 33% 29%
Rates & Taxes (Construct):
Other Expenses (Development):
Other Costs (Interest & Selling Costs):
Total 100% 100% 100% 100%
Interest Calculations (based on Sheet Cash Flow)
Land Costs: 86,904$ 53,594$ 85,611$ -$ OK 226,109$ 86,904$ 53,594$ 85,611$ -$
Building & Development: Contract price 41,954$ 664,566$ 271,941$ -$ OK 978,461$ 41,954$ 664,566$ 271,941$ -$
Building & Development: Escalation -$ -$ -$ -$ OK -$ -$ -$ -$ -$
Building & Development: Professional Fees 20,977$ 353,721$ 146,043$ -$ OK 520,741$ 20,977$ 353,721$ 146,043$ -$
Rates & Taxes (Construct): -$ -$ -$ -$ OK -$ -$ -$ -$ -$
Other Expenses (Development): -$ -$ -$ -$ OK -$ -$ -$ -$ -$
Other Costs (Interest & Selling Costs): -$ -$ -$ -$ OK -$ -$ -$ -$ -$
Total 149,835$ 1,071,881$ 503,595$ -$ OK 1,725,311$ 149,835$ 1,071,881$ 503,595$ -$
Equity $
Land Costs: -$ -$ -$ -$ OK -$ -$ -$ -$ -$
Building & Development: Contract price -$ -$ -$ -$ OK -$ -$ -$ -$ -$
Building & Development: Escalation 27,642$ 1,591,531$ 499,103$ -$ OK 2,118,276$ 27,642$ 1,591,531$ 499,103$ -$
Building & Development: Professional Fees -$ -$ -$ -$ OK -$ -$ -$ -$ -$
Rates & Taxes (Construct): 219,120$ 413,550$ 436,056$ -$ OK 1,068,726$ 219,120$ 413,550$ 436,056$ -$
Other Expenses (Development): 313,000$ 313,000$ 313,000$ -$ OK 939,000$ 313,000$ 313,000$ 313,000$ -$
705
706
707
708
709
710
711
712
713
714
715
716
717
718
719
720
721
722
723
724
725
726
727
728
729
730
Other Costs (Interest & Selling Costs): 270,544$ 1,526,358$ 676,318$ -$ OK 2,473,220$ 270,544$ 1,526,358$ 676,318$ -$
Total 830,306$ 3,844,439$ 1,924,477$ -$ OK 6,599,222$ 830,306$ 3,844,439$ 1,924,477$ -$
Total Funding (Borrowing & Equity)
Land Costs: 816,111$ 924,263$ 1,015,211$ -$ OK 2,755,585$ 816,111$ 924,263$ 1,015,211$ -$
Building & Development: Contract price 392,639$ 11,417,007$ 3,287,898$ -$ OK 15,097,544$ 392,639$ 11,417,007$ 3,287,898$ -$
Building & Development: Escalation 27,642$ 1,591,531$ 499,103$ -$ OK 2,118,276$ 27,642$ 1,591,531$ 499,103$ -$
Building & Development: Professional Fees 195,013$ 6,035,960$ 1,757,168$ -$ OK 7,988,141$ 195,013$ 6,035,960$ 1,757,168$ -$
Rates & Taxes (Construct): 219,120$ 413,550$ 436,056$ -$ OK 1,068,726$ 219,120$ 413,550$ 436,056$ -$
Other Expenses (Development): 313,000$ 313,000$ 313,000$ -$ OK 939,000$ 313,000$ 313,000$ 313,000$ -$
Other Costs (Interest & Selling Costs): 270,544$ 1,526,358$ 676,318$ -$ OK 2,473,220$ 270,544$ 1,526,358$ 676,318$ -$
Total 2,234,069$ 22,221,669$ 7,984,754$ -$ OK 32,440,492$ 2,234,069$ 22,221,669$ 7,984,754$ -$
32,440,492$ 2,234,069$ 22,221,669$ 7,984,754$ -$
Proof OK OK OK OK OK
Diff -$ -$ -$ -$ -$
PRICE BREAKDOWNSALE PRICE � 2,277,689$ 24,006,561$ 8,477,786$ -$ OK 34,762,036$ 2,277,689$ 24,006,561$ 8,477,786$ -$
LESS DEVELOPMENT COSTS
Land Costs: 831,371$ 1,005,362$ 1,090,070$ -$ OK 2,926,803$ 831,371$ 1,005,362$ 1,090,070$ -$
Building & Development: Contract price 400,492$ 12,330,368$ 3,485,172$ -$ OK 16,216,032$ 400,492$ 12,330,368$ 3,485,172$ -$
Building & Development: Escalation 28,195$ 1,718,853$ 529,049$ -$ OK 2,276,097$ 28,195$ 1,718,853$ 529,049$ -$
Building & Development: Professional Fees 198,913$ 6,518,837$ 1,862,598$ -$ OK 8,580,348$ 198,913$ 6,518,837$ 1,862,598$ -$
Rates & Taxes (Construct): 223,502$ 446,634$ 462,219$ -$ OK 1,132,355$ 223,502$ 446,634$ 462,219$ -$
Other Expenses: 319,260$ 338,040$ 331,780$ -$ OK 989,080$ 319,260$ 338,040$ 331,780$ -$
Interest Cost on Development period 152,832$ 1,157,631$ 533,811$ -$ OK 1,844,274$ 152,832$ 1,157,631$ 533,811$ -$
Council Rates: 10,693$ 4,274$ 4,607$ -$ OK 19,574$ 10,693$ 4,274$ 4,607$ -$
Land Tax: 5,492$ 2,195$ 2,366$ -$ OK 10,053$ 5,492$ 2,195$ 2,366$ -$
File: Feasibility - Mixed Use Template - Aug 2011 FINAL.xlsx
(22/08/2012 8:54 AM)
Prepared by: Bill Wright
GENESIS MANAGEMENT SERVICES PTY LTD
P O Box 260 Crafers SA 5152 Phone: 0414 267 196 Page 15 of 21

INITIAL FEASIBILITY STUDY PURPOSES ONLY
731
732
733
734735
736
737
738
739
740
741
742
743
744
745
746
747
748
749
750
751
752
753
754
755
756
757
758
759
A B C D E F G H I J K L M N
Water & Sewerage Rates: 24,749$ 9,891$ 10,664$ -$ OK 45,304$ 24,749$ 9,891$ 10,664$ -$
Insurance: 6,970$ 25,928$ 8,987$ -$ OK 41,885$ 6,970$ 25,928$ 8,987$ -$
Security Service: 3,485$ 12,963$ 4,493$ -$ OK 20,941$ 3,485$ 12,963$ 4,493$ -$
Agents Fees: 23,233$ 259,271$ 89,865$ -$ OK 372,369$ 23,233$ 259,271$ 89,865$ -$ Interest Cost on Selling period 48,502$ 176,314$ 62,105$ -$ OK 286,921$ 48,502$ 176,314$ 62,105$ -$
Total 2,277,689$ 24,006,561$ 8,477,786$ -$ OK 34,762,036$ 2,277,689$ 24,006,561$ 8,477,786$ -$
Proof -$ -$ -$ -$ -$
ESCALATIONPeriod: Start Month End Month PA P/Month
Year: Year 1 Mth 3 Mth 14 5.00% 0.42%
Year 2 Mth 15 Mth 26 6.00% 0.50%
Year 3 Mth 27 Mth 38 7.00% 0.58%
Cum
DISCOUNT FACTOR FOR NPV/IRR 7.00%pa 7.00% 7.00% 7.00% 7.00% 7.00%
DEVELOPMENT P&L & CASH FLOWSALE PRICE (CASH INFLOW)
LESS DEVELOPMENT COSTS
Land Purchase:
Other Land Costs:
Building Costs
Escalation:
Fees:
Rates & Taxes (Construct):
Sundry Expenses:
Total Development Cost (exc. Interest):
Developers Margin
GM %759
760
761
762
763
764
765
766
767
768
769
770
771
772
773
774
775
776
777
778
779
780
781
782
GM %
LESS OTHER COSTS
Interest Cost
Mths to sell
Council Rates:
Land Tax:
Water & Sewerage Rates:
Insurance:
Security Service:
Agents Fees:
Total Other Cost:
% Revenue
Total Costs
NET MARGIN
Net Margin /Revenue
Net Margin /Total Costs
Total Cash Outflow
Net Cash Flow (pre-funding & interest)
c/f Components
Proof/Diff
#DIV/0!
Net Present Value (NPV) @ 7% 7.00% $2,007,428
Net Present Value (NPV) @ 7.5% 7.50% 0.50% $4,046,850
File: Feasibility - Mixed Use Template - Aug 2011 FINAL.xlsx
(22/08/2012 8:54 AM)
Prepared by: Bill Wright
GENESIS MANAGEMENT SERVICES PTY LTD
P O Box 260 Crafers SA 5152 Phone: 0414 267 196 Page 16 of 21

INITIAL FEASIBILITY STUDY PURPOSES ONLY
783
784
785
786
787
788
789
790
791
792
793
794
795
796
797
798
799
800
801
802
803
A B C D E F G H I J K L M N
Net Present Value (NPV) @ 7% 7.00% $2,007,447
Net Present Value (NPV) @ 8.5% 8.50% 1.50% $4,046,850
Net Present Value (NPV) @ 9% 9.00% 2.00% $1,507,556
Proof
Diff
c/f Components $2,007,447 29,223$ 1,573,098$ 405,126$ -$
c/f Components - $'m $2.0 -$ 1.6$ 0.4$ -$
Diff
Other Cash Inflow Items
Equity
Borrowings
Sub-Total
Other Cash Outflow Items
Repayment of Borrowings
Repayment of Interest
Sub-Total
Final Net cash Flow
Bank at Beginning
Bank at End
File: Feasibility - Mixed Use Template - Aug 2011 FINAL.xlsx
(22/08/2012 8:54 AM)
Prepared by: Bill Wright
GENESIS MANAGEMENT SERVICES PTY LTD
P O Box 260 Crafers SA 5152 Phone: 0414 267 196 Page 17 of 21

INITIAL FEASIBILITY STUDY PURPOSES ONLY
804
805
806
807
808
809
810
811
812
813
814
815
816
817
818
819
820
821
822
823
824
825
826
827
828
829
830
831
832
833
834
835
A B C D E F G H I J K L M N
OPERATING P&L and CASH FLOW - YEAR 1INCOME �
Car Parking Income -$ 12,896$ 7,904$ -$ OK 20,800$ -$ 12,896$ 7,904$ -$
Rent Income -$ 201,600$ 25,020$ -$ OK 226,620$ -$ 201,600$ 25,020$ -$
Accommodation Revenue -$ -$ -$ -$ OK -$ -$ -$ -$ -$
Total Other Income -$ -$ -$ -$ OK -$ -$ -$ -$ -$
TOTAL ANNUAL INCOME: -$ 214,496$ 32,924$ -$ OK 247,420$ -$ 214,496$ 32,924$ -$
Less Variable Costs
1. Cost of Goods Sold
Opening Stock -$ -$ -$ -$
Purchases -$ -$ -$ -$ OK -$ -$ -$ -$ -$
Less Closing Stock -$ -$ -$ -$
Cost of Goods Sold -$ -$ -$ -$ OK -$ -$ -$ -$ -$
2. Other Variable Costs
Labour -$ -$ -$ -$ OK -$ -$ -$ -$ -$
Other -$ -$ -$ -$ OK -$ -$ -$ -$ -$
Other Variable Costs -$ -$ -$ -$ OK -$ -$ -$ -$ -$
Total Variable Costs -$ -$ -$ -$ OK -$ -$ -$ -$ -$
Gross Margin/Contribution -$ 214,496$ 32,924$ -$ OK 247,420$ -$ 214,496$ 32,924$ -$
Gross Margin % 100% 100%
Less Overheads
GENERAL
Council Rates: 41,933$ 47,483$ 52,155$ -$ OK 141,571$ 41,933$ 47,483$ 52,155$ -$
Land Tax: 43,911$ 49,723$ 54,615$ -$ OK 148,249$ 43,911$ 49,723$ 54,615$ -$
Water & Sewerage: 53,145$ 60,178$ 66,099$ 1$ OK 179,423$ 53,145$ 60,178$ 66,099$ -$
Drainage: -$ -$ -$ -$ OK -$ -$ -$ -$ -$
Other Levies (Drainage & ESL): 14,774$ 16,729$ 18,375$ -$ OK 49,878$ 14,774$ 16,729$ 18,375$ -$
Insurances on Development Value (Insert %) 14,805$ 156,043$ 55,106$ -$ OK 225,954$ 14,805$ 156,043$ 55,106$ -$
Electricity to Public Areas: -$ 42,448$ 7,285$ -$ OK 49,733$ -$ 42,448$ 7,285$ -$
Other Overheads -$ -$ -$ -$ OK -$ -$ -$ -$
Caretaking & Cleaning: -$ 452$ 78$ -$ OK 530$ -$ 452$ 78$ -$ 835
836
837
838
839
840
841
842
843
844
845
846
847
848
849
850
851
852
853
854
855
856
857
858
859
860
861
Caretaking & Cleaning: -$ 452$ 78$ -$ OK 530$ -$ 452$ 78$ -$
Security Service: -$ 452$ 78$ -$ OK 530$ -$ 452$ 78$ -$
Sundries: -$ 452$ 78$ -$ OK 530$ -$ 452$ 78$ -$
Building Repairs & Maintenance: -$ 747$ 78$ -$ OK 825$ -$ 747$ 78$ -$
Fire Alarm & Sprinkler Service: -$ 747$ 78$ -$ OK 825$ -$ 747$ 78$ -$
Lift Maintenance & Operation: -$ 747$ 78$ -$ OK 825$ -$ 747$ 78$ -$
Air Conditioning Maintenance & Operation: -$ 747$ 78$ -$ OK 825$ -$ 747$ 78$ -$
Management Fees & Void Allowance: -$ 747$ 78$ -$ OK 825$ -$ 747$ 78$ -$
Sub-Total 168,568$ 377,695$ 254,259$ 1$ OK 800,523$ 168,568$ 377,695$ 254,259$ -$
Contingency - %
- $ 15,171$ 33,993$ 22,883$ -$ OK 72,047$ 15,171$ 33,993$ 22,883$ -$
Overheads (exc provisions) 183,739$ 411,688$ 277,142$ 1$ OK 872,570$ 183,739$ 411,688$ 277,142$ -$
INTEREST 102,496$ 1,080,295$ 381,500$ -$ OK 1,564,291$ 102,496$ 1,080,295$ 381,500$ -$
PROVISIONS
Depreciation (see below): 48,370$ 493,526$ 180,492$ -$ OK 722,388$ 48370 493526 180492
Building & Plant Maintenance: 26,146$ 266,771$ 97,564$ -$ OK 390,481$ 26146 266771 97564
74,516$ 760,297$ 278,056$ -$ OK 1,112,869$ 74516 760297 278056
TOTAL OVERHEADS: 360,751$ 2,252,280$ 936,698$ 1$ OK 3,549,730$ 360,751$ 2,252,280$ 936,698$ -$
NET ANNUAL INCOME: 360,751-$ 2,037,784-$ 903,774-$ 1-$ OK 3,302,310-$ 360,751-$ 2,037,784-$ 903,774-$ -$
ANNUAL RETURN: Negative -950% -2745% Negative
CAPITALISATION RATE: 11% 11% 11% 11%
ESTIMATED VALUE: 3,279,555-$ 18,525,309-$ 8,216,127-$ 9-$ OK 30,021,000-$ 3,279,555-$ 18,525,309-$ 8,216,127-$ -$
CASH INFLOW - TOTAL 10 YEARSCapital 2,000,000$ 1,000,000$ 1,000,000$ -$ OK 4,000,000$ 2,000,000$ 1,000,000$ 1,000,000$ -$
Borrowings 1,366,613$ 14,403,937$ 5,086,672$ -$ OK 20,857,222$ 1,366,613$ 14,403,937$ 5,086,672$ -$
Revenue 11,648$ 2,122,912$ 269,752$ -$ OK 2,404,312$ 11,648$ 2,122,912$ 269,752$ -$
File: Feasibility - Mixed Use Template - Aug 2011 FINAL.xlsx
(22/08/2012 8:54 AM)
Prepared by: Bill Wright
GENESIS MANAGEMENT SERVICES PTY LTD
P O Box 260 Crafers SA 5152 Phone: 0414 267 196 Page 18 of 21

INITIAL FEASIBILITY STUDY PURPOSES ONLY
862
863
864
865
866
867
868
869
870
871
872
873
874
875
876
877
878
879
880
881
882
883
884
885
886
887
888
889
890
891
892
893
A B C D E F G H I J K L M N
TOTAL CASH INFLOW 3,378,261$ 17,526,849$ 6,356,424$ -$ OK 27,261,534$ 3,378,261$ 17,526,849$ 6,356,424$ -$
CASH OUTFLOW - TOTAL 10 YEARSInvestment -$ -$ -$ -$ OK -$ -$ -$ -$ -$
Variable Costs -$ -$ -$ -$ OK -$ -$ -$ -$ -$
Overheads (less provisions) 1,974,051$ 5,557,273$ 3,280,087$ 10$ OK 10,811,421$ 1,974,051$ 5,557,273$ 3,280,087$ -$
Tax -$ -$ -$ -$ OK -$ -$ -$ -$ -$
Repay Loan 1,366,614$ 14,403,938$ 5,086,672$ -$ OK 20,857,224$ 1,366,614$ 14,403,938$ 5,086,672$ -$
TOTAL CASH OUTFLOW 3,340,665$ 19,961,211$ 8,366,759$ 10$ OK 31,668,645$ 3,340,665$ 19,961,211$ 8,366,759$ -$
NET CASH FLOW PER YEAR 37,596$ 2,434,362-$ 2,010,335-$ 10-$ OK 4,407,111-$ 37,596$ 2,434,362-$ 2,010,335-$ -$
NET CUMULATIVE CASH FLOW -$ -$ -$ -$
-$ -$ -$ -$
Net Operating Cash Flow 1,962,403-$ 3,434,361-$ 3,010,335-$ 10-$ OK 8,407,109-$ 1,962,403-$ 3,434,361-$ 3,010,335-$ -$
BALANCE SHEET - YEAR 1CURRENT ASSETS
CASH AT BANK 2,397,071$ 6,924,481$ 2,917,618$ -$ OK 12,239,170$ 2,397,071$ 6,924,481$ 2,917,618$ -$
STOCK ETC. -$ -$ -$ -$ OK -$ -$ -$ -$ -$
TOTAL CURRENT ASSETS 2,397,071$ 6,924,481$ 2,917,618$ -$ OK 12,239,170$ 2,397,071$ 6,924,481$ 2,917,618$ -$
FIXED ASSETS
LAND 1,231,863$ 13,335,730$ 4,575,242$ -$ OK 19,142,835$ 1,231,863$ 13,335,730$ 4,575,242$ -$
BUILDINGS 679,787$ 6,936,040$ 2,536,654$ -$ OK 10,152,481$ 679,787$ 6,936,040$ 2,536,654$ -$
LESS PROV.FOR DEPRECIATION 16,995$ 173,401$ 63,416$ -$ OK 253,812$ 16,995$ 173,401$ 63,416$ -$
BUILDINGS-WDV 662,792$ 6,762,639$ 2,473,238$ -$ OK 9,898,669$ 662,792$ 6,762,639$ 2,473,238$ -$
PLANT & EQUIPMENT 209,165$ 2,134,166$ 780,509$ -$ OK 3,123,840$ 209,165$ 2,134,166$ 780,509$ -$
LESS PROV.FOR DEPRECIATION 16,733$ 170,733$ 62,441$ -$ OK 249,907$ 16,733$ 170,733$ 62,441$ -$
PLANT & EQUIPMENT-WDV 192,432$ 1,963,433$ 718,068$ -$ OK 2,873,933$ 192,432$ 1,963,433$ 718,068$ -$
FURNITURE & FITTINGS 52,291$ 533,542$ 195,127$ -$ OK 780,960$ 52,291$ 533,542$ 195,127$ -$
LESS PROV.FOR DEPRECIATION 6,275$ 64,025$ 23,415$ -$ OK 93,715$ 6,275$ 64,025$ 23,415$ -$
FURNITURE & FITTINGS-WDV 46,016$ 469,517$ 171,712$ -$ OK 687,245$ 46,016$ 469,517$ 171,712$ -$
OTHER 104,583$ 1,067,083$ 390,254$ -$ OK 1,561,920$ 104,583$ 1,067,083$ 390,254$ -$
LESS PROV.FOR DEPRECIATION 8,367$ 85,367$ 31,220$ -$ OK 124,954$ 8,367$ 85,367$ 31,220$ -$ 893
894
895
896
897
898
899
900
901
902
903
904
905
906
907
908
909
910
911
912
913
914
915
916
917
918
LESS PROV.FOR DEPRECIATION 8,367$ 85,367$ 31,220$ -$ OK 124,954$ 8,367$ 85,367$ 31,220$ -$
OTHER -WDV 96,216$ 981,716$ 359,034$ -$ OK 1,436,966$ 96,216$ 981,716$ 359,034$ -$
TOTAL FIXED ASSETS 2,229,319$ 23,513,035$ 8,297,294$ -$ OK 34,039,648$ 2,229,319$ 23,513,035$ 8,297,294$ -$
TOTAL ASSETS 4,626,390$ 30,437,516$ 11,214,912$ -$ OK 46,278,818$ 4,626,390$ 30,437,516$ 11,214,912$ -$
CURRENT LIABILITIES
BANK OVERDRAFT -$ -$ -$ 1$ OK 1$ -$ -$ -$ -$
PROVISION FOR BUILDING MAINTENANCE 26,146$ 266,771$ 97,564$ -$ OK 390,481$ 26,146$ 266,771$ 97,564$ -$
TOTAL CURRENT LIABILITIES 26,146$ 266,771$ 97,564$ 1$ OK 390,482$ 26,146$ 266,771$ 97,564$ -$
LONG-TERM BORROWINGS 683,306$ 7,201,968$ 2,543,336$ -$ OK 10,428,610$ 683,306$ 7,201,968$ 2,543,336$ -$
CAPITAL AT BEGINNING 4,277,689$ 25,006,561$ 9,477,786$ -$ OK 38,762,036$ 4,277,689$ 25,006,561$ 9,477,786$ -$
RETAINED PROFITS 360,751-$ 2,037,784-$ 903,774-$ 1-$ OK 3,302,310-$ 360,751-$ 2,037,784-$ 903,774-$ -$
TOTAL LIABILITIES 4,626,390$ 30,437,516$ 11,214,912$ -$ OK 46,278,818$ 4,626,390$ 30,437,516$ 11,214,912$ -$
DIFF -$ -$ -$ -$
RATIOSLIQUIDITY (C.ASSETS/C.LIBS) 91.7 91.7 91.7 91.7 91.7 91.7 26 29.9 #DIV/0!
PROFITABILITY
-NET PROFIT (after tax) 360,751-$ 360,751-$ 360,751-$ 360,751-$ 360,751-$ 360,751-$ 2,037,784-$ 903,774-$ -$
-AV.CAPITAL FOR YEAR 1,958,469$ 1,958,469$ 1,958,469$ 1,958,469$ 1,958,469$ 1,958,469$ 11,484,389$ 4,287,006$ -$
-ROI P.A -18.4% -18.4% -18.4% -18.4% -18.4% -18.4% -17.7% -21.1% #DIV/0!
SECURITY
-AV.L/TERM BORR.FOR YEAR 1,024,960$ 1,024,960$ 1,024,960$ 1,024,960$ 1,024,960$ 1,024,960$ 10,802,953$ 3,815,004$ -$
-L.T DEBT/EQUITY RATIO 0.52 0.52 0.52 0.52 0.52 0.52 0.94 0.89 #DIV/0!
FUNDS STATEMENTSOURCE OF FUNDS
File: Feasibility - Mixed Use Template - Aug 2011 FINAL.xlsx
(22/08/2012 8:54 AM)
Prepared by: Bill Wright
GENESIS MANAGEMENT SERVICES PTY LTD
P O Box 260 Crafers SA 5152 Phone: 0414 267 196 Page 19 of 21

INITIAL FEASIBILITY STUDY PURPOSES ONLY
919
920
921
922
923
924
925
926
927
928
929
930
931
932
933
934
935
936
937
938
939
940
941
942
943
944
945
946
947
948
949
950
A B C D E F G H I J K L M N
NET PROFIT FOR YEAR(A/TAX) 360,751-$ 2,037,784-$ 903,774-$ 1-$ OK 3,302,310-$ 360,751-$ 2,037,784-$ 903,774-$ -$
ADD BACK DEPRECIATION 48,370$ 493,526$ 180,492$ -$ OK 722,388$ 48,370$ 493,526$ 180,492$ -$
ADD BACK PROVISION FOR BUILDING MAINTENANCE 26,146$ 266,771$ 97,564$ -$ OK 390,481$ 26,146$ 266,771$ 97,564$ -$
FUNDS FROM OPERATIONS 286,235-$ 1,277,487-$ 625,718-$ 1-$ OK 2,189,441-$ 286,235-$ 1,277,487-$ 625,718-$ -$
CASH AT BANK -$ -$ -$ -$ OK -$ -$ -$ -$ -$
STOCK -$ -$ -$ -$ OK -$ -$ -$ -$ -$
LAND -$ -$ -$ -$ OK -$ -$ -$ -$ -$
BUILDINGS -$ -$ -$ -$ OK -$ -$ -$ -$ -$
PLANT & EQUIPMENT -$ -$ -$ -$ OK -$ -$ -$ -$ -$
FURNITURE & FITTINGS -$ -$ -$ -$ OK -$ -$ -$ -$ -$
OTHER -$ -$ -$ -$ OK -$ -$ -$ -$ -$
BANK OVERDRAFT -$ -$ -$ 1$ OK 1$ -$ -$ -$ -$
LONG-TERM BORROWINGS 683,306$ 7,201,968$ 2,543,336$ -$ OK 10,428,610$ 683,306$ 7,201,968$ 2,543,336$ -$
CAPITAL AT BEGINNING 4,277,689$ 25,006,561$ 9,477,786$ -$ OK 38,762,036$ 4,277,689$ 25,006,561$ 9,477,786$ -$
TOTAL SOURCES 4,674,760$ 30,931,042$ 11,395,404$ -$ OK 47,001,206$ 4,674,760$ 30,931,042$ 11,395,404$ -$
USE OF FUNDS
CASH AT BANK 2,397,071$ 6,924,481$ 2,917,618$ -$ OK 12,239,170$ 2,397,071$ 6,924,481$ 2,917,618$ -$
STOCK -$ -$ -$ -$ OK -$ -$ -$ -$ -$
LAND 1,231,863$ 13,335,730$ 4,575,242$ -$ OK 19,142,835$ 1,231,863$ 13,335,730$ 4,575,242$ -$
BUILDINGS 679,787$ 6,936,040$ 2,536,654$ -$ OK 10,152,481$ 679,787$ 6,936,040$ 2,536,654$ -$
PLANT & EQUIPMENT 209,165$ 2,134,166$ 780,509$ -$ OK 3,123,840$ 209,165$ 2,134,166$ 780,509$ -$
FURNITURE & FITTINGS 52,291$ 533,542$ 195,127$ -$ OK 780,960$ 52,291$ 533,542$ 195,127$ -$
OTHER 104,583$ 1,067,083$ 390,254$ -$ OK 1,561,920$ 104,583$ 1,067,083$ 390,254$ -$
BANK OVERDRAFT -$ -$ -$ -$ OK -$ -$ -$ -$ -$
LONG-TERM BORROWINGS -$ -$ -$ -$ OK -$ -$ -$ -$ -$
CAPITAL AT BEGINNING -$ -$ -$ -$ OK -$ -$ -$ -$ -$
TOTAL USES 4,674,760$ 30,931,042$ 11,395,404$ -$ OK 47,001,206$ 4,674,760$ 30,931,042$ 11,395,404$ -$
Diff -$ -$ -$ -$
TABLES ConstCostCurve
Column: 1 2 3 4 5 6 7 8 9 10 11 12 13
Time 100% 100% 100%
Cost: 50.0% 100.0%950
951
952
953
954
955
956
957
958
959
960
961
962
963
964
965
966
967
968
969
970
971
972
973
974
975
976
Cost: 50.0% 100.0%
Construction Cost Options (Level of Finish)
1 Low Finish CostOption
2 Medium Finish
-10%
0%
10%
20%
30%
40%
50%
60%
70%
80%
90%
100%
1 2 3 4 5 6 7 8 9 10 11 12 13 14 15 16 17 18 19 20
CO
ST
TIME
TYPICAL CONSTRUCTION COST CURVE
File: Feasibility - Mixed Use Template - Aug 2011 FINAL.xlsx
(22/08/2012 8:54 AM)
Prepared by: Bill Wright
GENESIS MANAGEMENT SERVICES PTY LTD
P O Box 260 Crafers SA 5152 Phone: 0414 267 196 Page 20 of 21

INITIAL FEASIBILITY STUDY PURPOSES ONLY
977
978
979
980
981
982
983
984
985
986
987
988
989
990
991
992
993
994
995
996
997
998
999
1000
1001
1002
1003
1004
1005
1006
1007
A B C D E F G H I J K L M N
3 High Finish
Regional Centre Rent/m² N m² pa m² pa
Supermarkets & Discount Dept Stores 125$ 160$
Specialty Shops 650$ 1,100$
Add extra for outgoings 110$ 135$
Stamp Duty N
Source: State Taxation Office 6/4/98
Range Minimum Per $100
1$ -$ 1.00$ StampDuty
12,000$ 120.00$ 2.00$
30,000$ 480.00$ 3.00$
50,000$ 1,080.00$ 4.00$
100,000$ 2,830.00$ 4.00$
500,000$ 18,830.00$ 5.00$
1,000,000$ 41,330.00$ 5.00$
10,000,000$ 500,000.00$ 5.00$
Land Tax N
Source: State Taxation Office 7/4/98
Range Minimum Per $100
1$ -$ -$ LandTax
50,000$ -$ -$
50,001$ -$ -$
300,000$ 875.00$ 2.00$
1,000,000$ 12,425.00$ 4.00$
Emergency Services Levy N
Source: The Advertiser p19 27/5/99
Base Fee $50.00 ESLbase1007
1008
1009
1010
1011
1012
1013
1014
1015
1016
1017
1018
1019
1020
1021
1022
1023
1024
1025
1026
1027
1028
Base Fee $50.00 ESLbase
Multiplier
1 Commercial 1.0 ESLmultiplier
2 Industrial 1.0
3 Residential 0.4
4 Rural 0.3
Std Rate ESLrate
Catchment Levy N
Source: City of Marion
Rate CatchmentRate
File: Feasibility - Mixed Use Template - Aug 2011 FINAL.xlsx
(22/08/2012 8:54 AM)
Prepared by: Bill Wright
GENESIS MANAGEMENT SERVICES PTY LTD
P O Box 260 Crafers SA 5152 Phone: 0414 267 196 Page 21 of 21


![[MAP - BLOCK - LOT] FOR REAL ESTATE BY STREET ADDRESS ...images.vgsi.com/photos/StamfordCTPhotos/MapBlockLot.pdf · [MAP - BLOCK - LOT] FOR REAL ESTATE BY STREET ADDRESS STAMFORD,](https://static.fdocuments.us/doc/165x107/602d2c6ad8480055da5c3efa/map-block-lot-for-real-estate-by-street-address-map-block-lot-for.jpg)