InIInnIn- ---Place Strength by PulloutPlace Strength by ... Jan 2013/Pullout New York JAN 8... ·...
47
Test smart – Build right In In In In-Place Strength by Pullout Place Strength by Pullout Place Strength by Pullout Place Strength by Pullout The Concrete Industry Board of NYC (CIB) NYC Chapter of ACI New York January 8th, 2013 Claus Germann Petersen GERMANN INSTRUMENTS, Inc. Test smart – Build right In In In In-Place Strength by Pullout Place Strength by Pullout Place Strength by Pullout Place Strength by Pullout Acknowledgement Dr. Nicholas J. Carino Concrete Technology Consultant & Dr.Andrzej Tadeusz Moczko Professor, Wroclaw University
Transcript of InIInnIn- ---Place Strength by PulloutPlace Strength by ... Jan 2013/Pullout New York JAN 8... ·...

Test smart – Build right
InInInIn----Place Strength by PulloutPlace Strength by PulloutPlace Strength by PulloutPlace Strength by Pullout
The Concrete Industry Board of NYC (CIB)
NYC Chapter of ACI
New YorkJanuary 8th, 2013
Claus Germann Petersen
GERMANN INSTRUMENTS, Inc.
Test smart – Build right
InInInIn----Place Strength by PulloutPlace Strength by PulloutPlace Strength by PulloutPlace Strength by Pullout
Acknowledgement
Dr. Nicholas J. CarinoConcrete Technology Consultant
&
Dr.Andrzej Tadeusz Moczko
Professor, Wroclaw University

Test smart – Build right
InInInIn----Place StrengthPlace StrengthPlace StrengthPlace Strength
• Evaluation by
�Testing cores
�Rebound hammer
�UPV
�Pullout test
�Pull-off test
�Maturity method
Test smart – Build right
Pullout TestPullout TestPullout TestPullout TestASTM C 900ASTM C 900ASTM C 900ASTM C 900
Measure force to pullout an insert anchored in concrete.
� Cast-in-place (CIP): LOK-Test
� Post-installed (PI): CAPO-Test

Test smart – Build right
25 mm 25 mm
55 mm
F
25 mm
25 mm
F 55 mm
LOK-TEST CAPO-TEST
Test smart – Build right
Instrument 1972 and todayInstrument 1972 and todayInstrument 1972 and todayInstrument 1972 and today
0-100 kN, 4 kgAutomatic registration of data
and peak value
0-40 kN, 43 kg

Test smart – Build right
Birth of CAPOBirth of CAPOBirth of CAPOBirth of CAPO----TESTTESTTESTTEST1976197619761976
Drilling from the bottom of a 75 cm thick slab in preparation for LOK-TEST at the top of the slab
1st CAPO-TEST in the world performed adjacent to LOK-TEST
Test smart – Build right
LOKLOKLOKLOK----Test Pullout Test Pullout Test Pullout Test Pullout
Apply Pullout LoadConical Fragment
Failure
COMA-Meter for maturity

Test smart – Build right
CapoCapoCapoCapo----TestTestTestTestPulloutPulloutPulloutPullout
Test smart – Build right
LOKLOKLOKLOK----TEST Insert HardwareTEST Insert HardwareTEST Insert HardwareTEST Insert Hardware
Nailed to Nailed to formworkformwork
Attached toAttached toformwork cutoutsformwork cutouts
Floated Floated into surfaceinto surface

Test smart – Build right
25 mm
25 mm
LOKLOKLOKLOK----Test Pullout Test Pullout Test Pullout Test Pullout
InsertInsert
Formwork
Steel Plate
Test smart – Build right
LOKLOKLOKLOK----TEST Pullout TEST Pullout TEST Pullout TEST Pullout
InsertInsert
ReactionRing
PulloutForce

Test smart – Build right
LOKLOKLOKLOK----Test Pullout Test Pullout Test Pullout Test Pullout
Insert
ReactionRing
PulloutForce
Insert
Cut hole in formworkCut hole in formworkCut hole in formworkCut hole in formworkCut hole in formworkCut hole in formworkCut hole in formworkCut hole in formwork

Attach backing plate and fasten insertAttach backing plate and fasten insertAttach backing plate and fasten insertAttach backing plate and fasten insertAttach backing plate and fasten insertAttach backing plate and fasten insertAttach backing plate and fasten insertAttach backing plate and fasten insert
InsertInsert
PlatePlate
•• Attach insert support assembly to formAttach insert support assembly to form
•• Apply sealantApply sealant
•• Place concretePlace concrete
SealantSealant

•• Remove backing plateRemove backing plate
•• Attach loading systemAttach loading system
•• Apply loadApply load
•• Measure pullout strengthMeasure pullout strength
Pressuregage
Test smart – Build right
Ultimate Pullout LoadUltimate Pullout LoadUltimate Pullout LoadUltimate Pullout Load
• At peak load, ≈ 0.5 mm surface displacement
• Gradual decrease in load with continued displacement
Surface Displacement
Pu

Test smart – Build right
0
20
40
60
80
100
0 10 20 30 40 50 60 70 80
Compressive Strength, MPa
Pullout Load, kN
General Correlations forCylinder and Cube Strength
fcube= 0.76 F
1.16
fcyl= 0.69 F
1.12
Estimate Concrete StrengthEstimate Concrete StrengthEstimate Concrete StrengthEstimate Concrete Strength
Test smart – Build right
Strength indication by maturityStrength indication by maturityStrength indication by maturityStrength indication by maturity
Requires pre-established strength-maturity relationship in the lab, and:
• Same concrete quality on-site as in the lab
• Same curing conditions
• Same compaction

Test smart – Build right
Maturity + Pullout TestingMaturity + Pullout TestingMaturity + Pullout TestingMaturity + Pullout Testing
• Use the maturity method to determine when the required strength should have been achieved in the structure
• Verify by using pullout tests to estimate in-place strength
• Combination of maturity and pullout testing can lead to rapid and safe concrete construction
Test smart – Build right
Pullout timed by MaturityPullout timed by MaturityPullout timed by MaturityPullout timed by Maturity
0
10
20
30
40
50
0 5 10 15 20 25 30
Mixture AMixture BMixture C
Compressive Sterngth, MPa
M20, days at 20
oC

Test smart – Build right
Caution !Caution !Caution !Caution !
Tensioning of anchors in bridge girders was made at sufficient maturity, including a safety factor
The concrete failed anyhow at one of the anchors destroying one girder
Test smart – Build right
Subsequent testing by impact-echo (left) and ultrasound echo (right) revealed a large honeycomb in the anchor´s
trumphet zone

Test smart – Build right
Insert HardwareInsert HardwareInsert HardwareInsert Hardware
Floated Floated into surfaceinto surface
Test smart – Build right
Floated Surface InsertsFloated Surface InsertsFloated Surface InsertsFloated Surface Inserts
• Does not require cutting holes into formwork
• Training for proper placement
� Good consolidation around insert head
� Minimum of surface voids
� Ensure representative aggregates in failure zone
• Requires workable concrete

Test smart – Build right
Push insert into concreteMove sideward for aggregates to flow into the failure zoneTilt for air to escape below the insert plate
Test smart – Build right
Correctly installed floating inserts

Test smart – Build right
Correctly performed LOK-Test using floating inserts
Sharp 55 mm dia.edge from the reaction ring
No surface voids
Test smart – Build right
Clearance RequirementsClearance RequirementsClearance RequirementsClearance RequirementsASTM C900ASTM C900ASTM C900ASTM C900
db
>200 mm >100 mm
≥ dbor
NMSA
Edgedistance
Reinforcementclearance
Insert clearance
25 mm

Test smart – Build right
PostPostPostPost----Installed TestsInstalled TestsInstalled TestsInstalled TestsCAPOCAPOCAPOCAPO----TestTestTestTest
• Does not require pre-planning test locations
• Can perform test at any accessible location
• Permits testing of existing structures
Test smart – Build right
CAPOCAPOCAPOCAPO----Test Pullout Test Pullout Test Pullout Test Pullout

Test smart – Build right
Prepare ConcretePrepare ConcretePrepare ConcretePrepare Concrete
Plane surfaceCore hole18 mm dia.
18 mm25 mm
25 mm
Cut slot
25 mm
Test smart – Build right
Core HoleCore HoleCore HoleCore Hole

Test smart – Build right
SurfaceSurfaceSurfaceSurfacePlaningPlaningPlaningPlaning
Test smart – Build right

Test smart – Build right
Cut SlotCut SlotCut SlotCut Slot
25 mm
Test smart – Build right
Cut SlotCut SlotCut SlotCut Slot
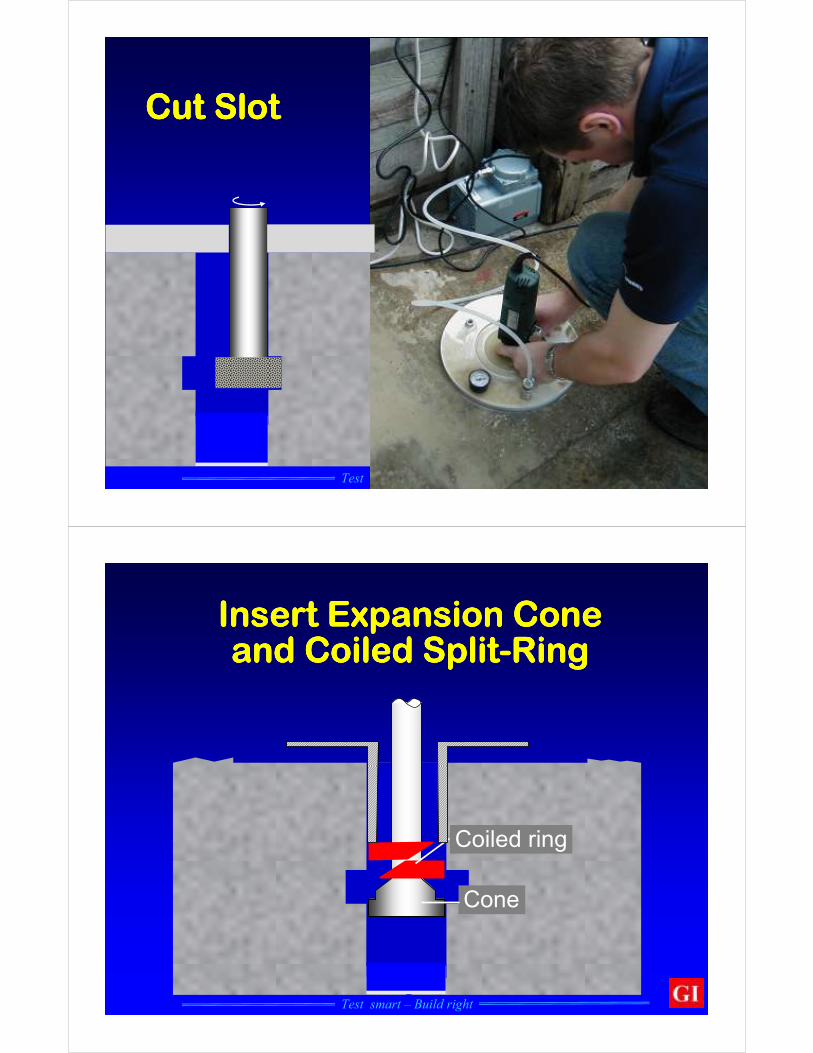
Test smart – Build right
Cut SlotCut SlotCut SlotCut Slot
Test smart – Build right
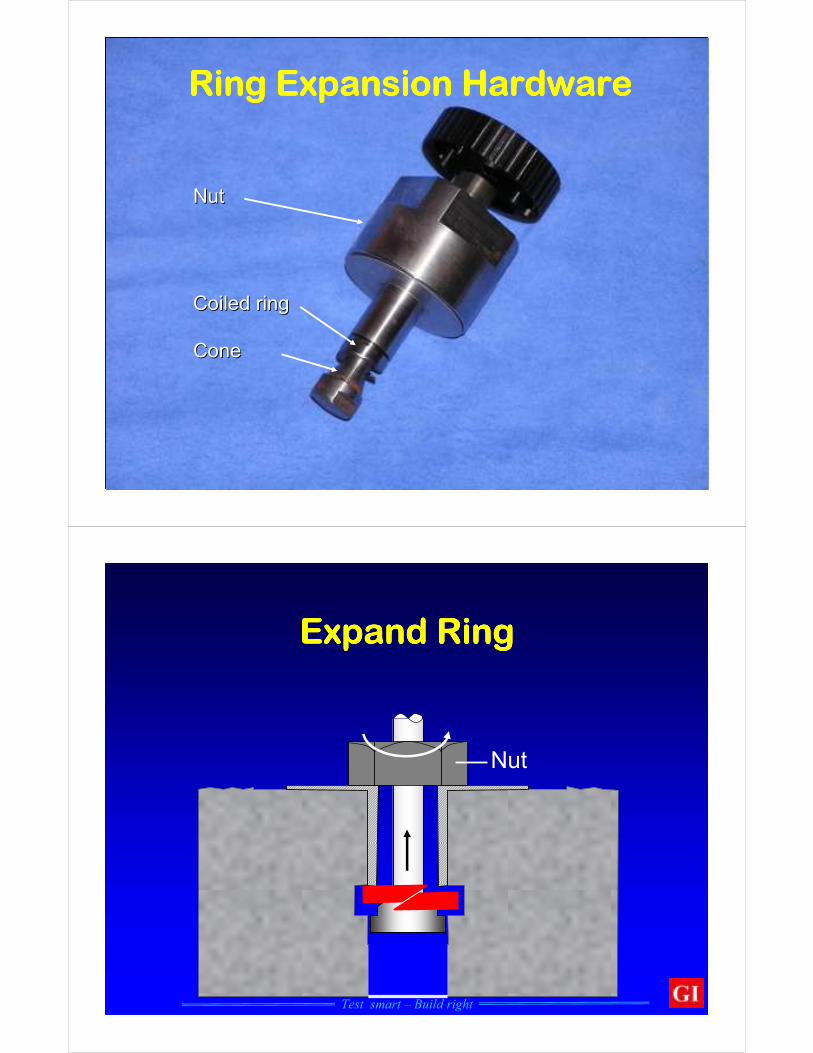
Insert Expansion ConeInsert Expansion ConeInsert Expansion ConeInsert Expansion Coneand Coiled Splitand Coiled Splitand Coiled Splitand Coiled Split----Ring Ring Ring Ring
Coiled ring
Cone
Test smart – Build right
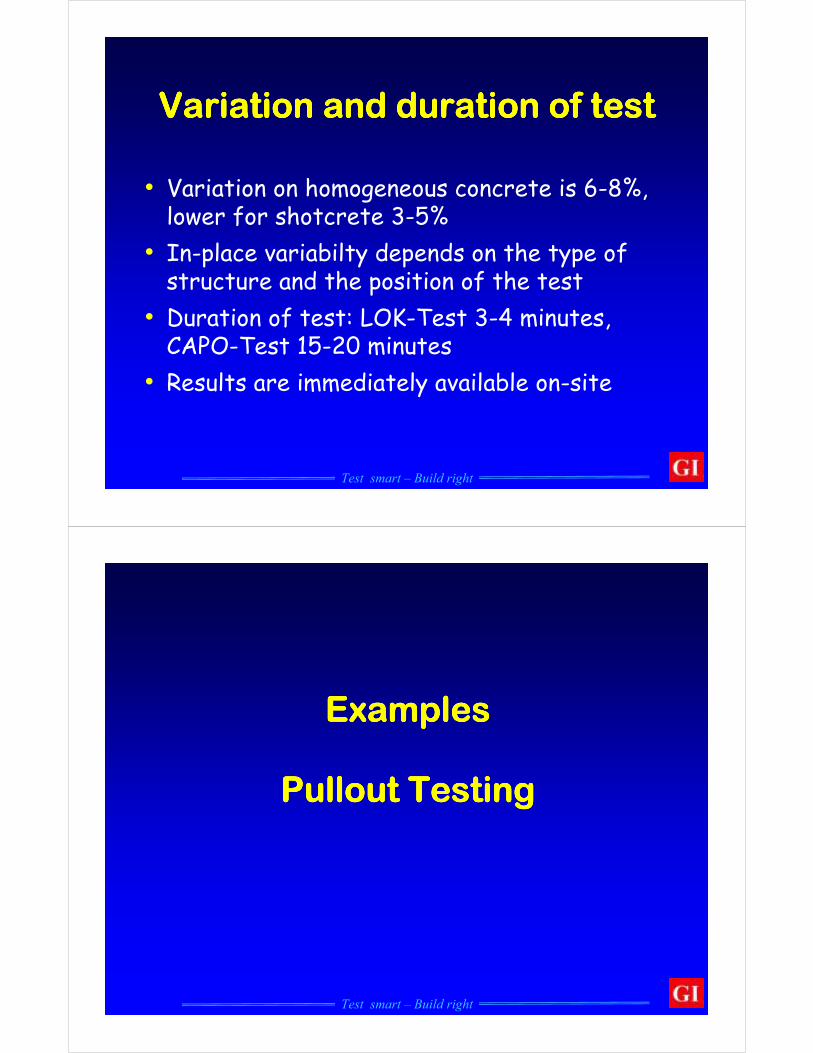
Ring Expansion HardwareRing Expansion HardwareRing Expansion HardwareRing Expansion Hardware
Coiled ringCoiled ring
ConeCone
NutNut
Test smart – Build right
Expand RingExpand RingExpand RingExpand Ring
Nut

Test smart – Build right
Expand RingExpand RingExpand RingExpand Ring
Test smart – Build right
Pullout the Expanded RingPullout the Expanded RingPullout the Expanded RingPullout the Expanded Ring

Test smart – Build right
ApplyApplyApplyApplyPulloutPulloutPulloutPulloutForceForceForceForce
Test smart – Build right
AcceptableAcceptableAcceptableAcceptableTestTestTestTest
Complete failure ring

Test smart – Build right
UnacceptableUnacceptableUnacceptableUnacceptableTestTestTestTest
Incomplete failure ring
Test smart – Build right
General Approach to General Approach to General Approach to General Approach to InInInIn----Place TestingPlace TestingPlace TestingPlace Testing
• Pre-construction meeting to plan the in-place testing program
• Develop a correlation (strength relationship) for the concrete to be used in construction
• Perform in-place tests on the structure
• Apply statistical methods to estimate in-place strength (ACI 228.1R)

Correlation TestingCorrelation TestingCorrelation TestingCorrelation Testing
• Prepare cylinders (or cubes)
• Prepare cubes with inserts
• Cure under same conditions
2 x LOK-Test 2 x CAPO-Test
Test smart – Build right
Correlation TestingCorrelation TestingCorrelation TestingCorrelation Testing
• Test 2 cylinders (cubes) and perform 8 pullout tests at each test age:
� 1, 2, 3, 7, 14 and 28 days
200 mm
200 mm

Test smart – Build right
Example of CorrelationExample of CorrelationExample of CorrelationExample of Correlation
http://www.nrmca.org/research/HVFAC_Final_Report_final.pdf
0
5
10
15
20
25
30
35
10 15 20 25 30
Cylinder Strength, MPaUpper 95 % CLLower 95 % CLManufacturer
Cylinder Strength, MPa
Pullout Force, kN
Test smart – Build right
CAPOCAPOCAPOCAPO----Test Test Test Test vsvsvsvs LOKLOKLOKLOK----TestTestTestTest
0
10
20
30
40
50
60
70
0 10 20 30 40 50 60 70
CAPO-Test, kN
LOK -Test, kN
Line of Equality

Test smart – Build right
0
20
40
60
80
100
120
0 20 40 60 80 100
Cylinder Strength, MPa
Pullout Load, kN
Cylinder Stength Correlations
Cylinder strength relationsCylinder strength relationsCylinder strength relationsCylinder strength relations
16 Cylinder Strength Correlations
Test smart – Build right
Cube Strength CorrelationsCube Strength CorrelationsCube Strength CorrelationsCube Strength Correlations
0
20
40
60
80
100
120
0 10 20 30 40 50 60 70
Cube Strength, MPa
Pullout Load, kN
Cube Strength Correlations8 Cube Strength Correlations

Test smart – Build right
LOKLOKLOKLOK---- / CAPO/ CAPO/ CAPO/ CAPO----TEST TEST TEST TEST General CorrelationsGeneral CorrelationsGeneral CorrelationsGeneral Correlations
0
20
40
60
80
100
0 10 20 30 40 50 60 70 80
Compressive Strength, MPa
Pullout Load, kN
General Correlations forCylinder and Cube Strength
fcube= 0.76 F
1.16
fcyl= 0.69 F
1.12
Test smart – Build right
Robust CorrelationRobust CorrelationRobust CorrelationRobust CorrelationNot affected by:
• Cementitious materials
• Water-cement ratio
• SCC mixtures
• Fibers
• Age
• Air entrainment
• Admixtures
• Curing conditions
• Shape, type or size of aggregate < 40 mm� Lightweight aggregate, however, produces
significantly different correlation

Test smart – Build right
CorrelationCorrelationCorrelationCorrelation
• Pullout strength is related fundamentally to concrete strength
• Studies of test have been done
� Finite element study (Ottosen, 1981)
� Compression strut theory (Krenchel, 1987)
Test smart – Build right
Pullout Failure MechanismPullout Failure MechanismPullout Failure MechanismPullout Failure Mechanism
Compression strut theory

Test smart – Build right
Pullout Failure MechanismPullout Failure MechanismPullout Failure MechanismPullout Failure Mechanism
Compression strut theory
Test smart – Build right
Compression StrutCompression StrutCompression StrutCompression Strut
Test smart – Build right
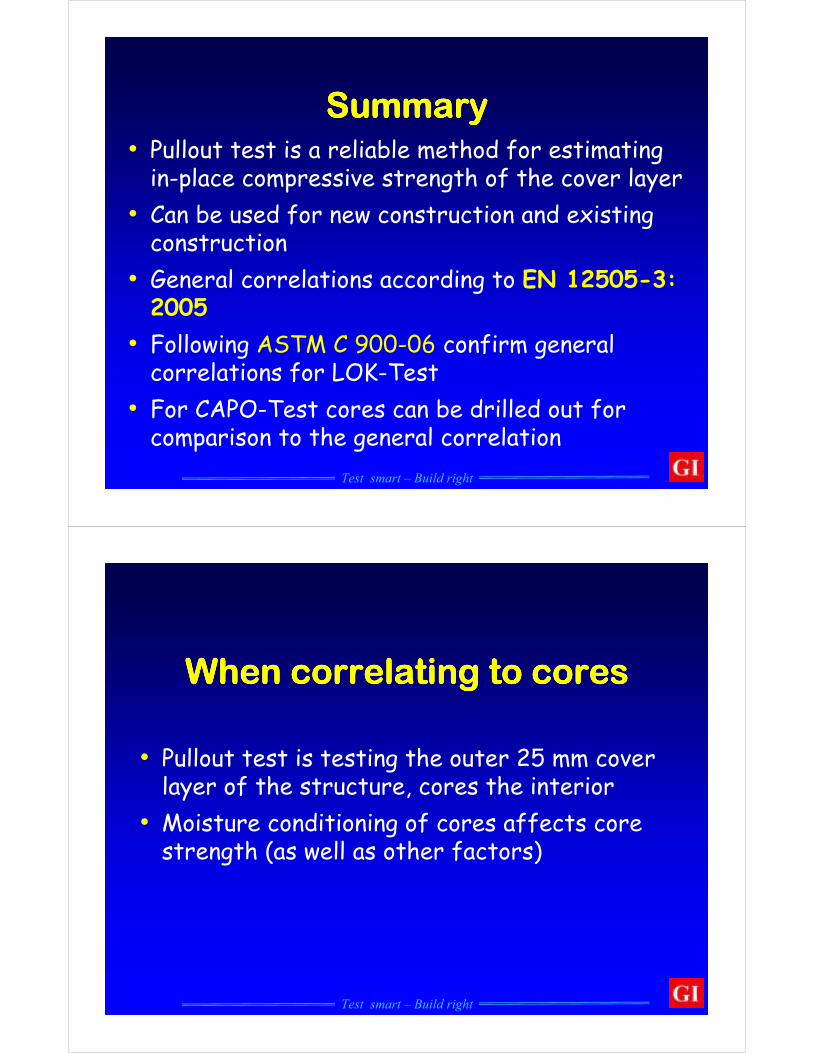
Variation and duration of testVariation and duration of testVariation and duration of testVariation and duration of test
• Variation on homogeneous concrete is 6-8%, lower for shotcrete 3-5%
• In-place variabilty depends on the type of structure and the position of the test
• Duration of test: LOK-Test 3-4 minutes, CAPO-Test 15-20 minutes
• Results are immediately available on-site
Test smart – Build right
ExamplesExamplesExamplesExamples
Pullout TestingPullout TestingPullout TestingPullout Testing

Test smart – Build right
Test smart – Build right
COMA-Meter for maturity

Test smart – Build right
Comparative study Polish bridgesComparative study Polish bridgesComparative study Polish bridgesComparative study Polish bridgesfor increased loadingfor increased loadingfor increased loadingfor increased loading
• Cores, sawcut, capped, tested after 5 days drying in lab conditions (100 mm dia x 100 mm cores)
• CAPO-Test in-situ, double amount of cores
• Schmidt Hammer in-situ, up to 20 locations, each 6 tests
• Schmidt Hammer on side of cores prior to compression tests
Age of structures: 20-30 yearsDepth of carbonation: 4-35 mm
Test smart – Build right
Bridge
No.
Cores from
structure
Capo-Test
on structure
Schmidt Hammer
on structure
Schmidt Hammer
on cores
MPa Av.
of
MPa αααα(CT) MPa αααα(L) MPa αααα(LM)
1 19.6 4 20.3 +3.4% 36.9 +88.3% 28.4 +44.3%
2 24.7 3 26.9 +8.9% 37.4 +51.4% 28.4 +15.0%
3 29.7 4 31.8 +7.1% 49.5 +66.7% 38.2 +28.6%
4 34.2 3 36.8 +10.5% 56.8 +66.1% 43.1 +26.0%
5 33.3 4 32.3 -3.0% 61.6 +85.0% 49.3 +48.0%
6 34.2 3 37.6 +9.0% 54.5 +59.4% 36.5 +6.7%
7 35.4 4 37.1 +7.1% 66.3 +87.3% 57.0 +61.0%
8 37.1 3 35.9 -3.2% 56.9 +53.4% 46.1 +24.3%
9 37.5 4 36.8 -1.9% 70.9 +89.1% 61.0 +62.7%
10 42.0 3 39.7 -5.5% 68.4 +62.9% 57.4 +36.7%
Avg. 32.8 33.5 +2.5 55.9 +71.0% 44.5 +35.7%Comparative testing, Polish experience, bridges 20-30 years old, ref. A. Mozcko,, Wroclaw University

Test smart – Build right
Capo-Test on shotcrete, Cigar Lake Mining Project, Saskatchewan, Canada
Test smart – Build right
Correlations on mortar (Yun, 1988) and concrete with < 8 mm maximum aggregate size (Krenchel, 1984)
Compressive Strength fc(MPa)
Capo-Test Pullout Load F (kN)
CYL, 150 x 300mm,<8 mm max aggregate size
Cores, 150 x 300mm,mortar

Test smart – Build right
Test smart – Build right
CAPO EquipmentCAPO EquipmentCAPO EquipmentCAPO Equipment
Preparation Kit
DSV Kit
Pullmachine Kit
Capo Inserts
Test smart – Build right
SummarySummarySummarySummary• Pullout test is a reliable method for estimating
in-place compressive strength of the cover layer
• Can be used for new construction and existing construction
• General correlations according to EN 12505-3: 2005
• Following ASTM C 900-06 confirm general correlations for LOK-Test
• For CAPO-Test cores can be drilled out for comparison to the general correlation
Test smart – Build right
When correlating to coresWhen correlating to coresWhen correlating to coresWhen correlating to cores
• Pullout test is testing the outer 25 mm cover layer of the structure, cores the interior
• Moisture conditioning of cores affects core strength (as well as other factors)

Test smart – Build right
Moisture conditioning of coresMoisture conditioning of coresMoisture conditioning of coresMoisture conditioning of cores
• In the past, cores were tested after a period of air drying or after being submerged for at least 40 h
• In high w/c concrete, storage under water for 40 h resulted in saturation
• With modern concrete and lower w/c, storage under water leads to moisture gradient
Test smart – Build right
Research FindingsResearch FindingsResearch FindingsResearch Findings

Test smart – Build right
Moisture GradientsMoisture GradientsMoisture GradientsMoisture GradientsImmediately After Wet DrillingImmediately After Wet DrillingImmediately After Wet DrillingImmediately After Wet Drilling
• Moistened concrete tends to swell
• Swelling is restrained by dry interior
• Results in internal stresses; outer region in compression
• Measured strength is reduced
Compression
Tension
Test smart – Build right
JointJointJointJointIndustry Industry Industry Industry StudyStudyStudyStudy
www.cement.org
CT003

Test smart – Build right
Effect of Core ConditioningEffect of Core ConditioningEffect of Core ConditioningEffect of Core Conditioningon Strengthon Strengthon Strengthon Strength
CT003
Test smart – Build right
Moisture ConditioningMoisture ConditioningMoisture ConditioningMoisture ConditioningASTM C42/C42MASTM C42/C42MASTM C42/C42MASTM C42/C42M
• Wipe off drilling water, surface dry
• Place in watertight containers
• Wait at least 5 days between wetting due to drilling or sawing and testing
• Other procedure permitted when required by the “specifier of tests”
Test smart – Build right
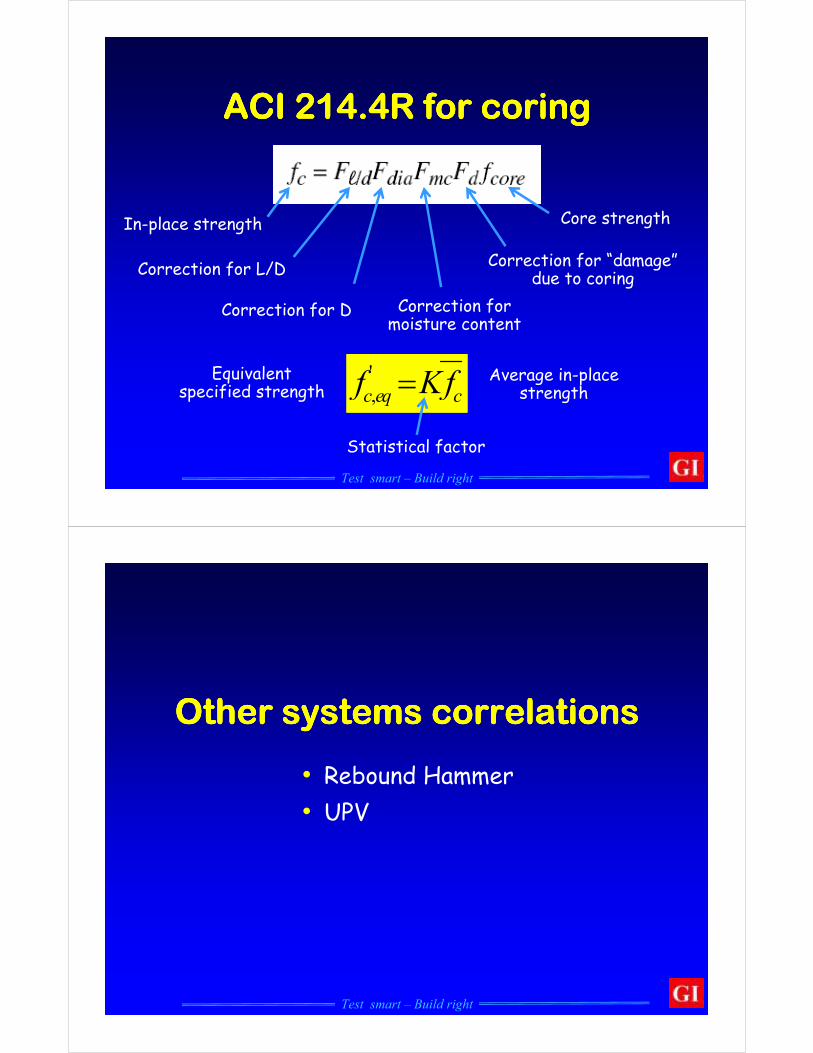
ACI 214.4R for coringACI 214.4R for coringACI 214.4R for coringACI 214.4R for coring
In-place strength Core strength
Correction for L/D
Correction for D Correction for moisture content
Correction for “damage”due to coring
'
,c eq cf Kf=Equivalent specified strength
Average in-place strength
Statistical factor
Test smart – Build right
Other systems correlationsOther systems correlationsOther systems correlationsOther systems correlations
• Rebound Hammer
• UPV

Test smart – Build right
Rebound number to cores,Rebound number to cores,Rebound number to cores,Rebound number to cores,mix specificmix specificmix specificmix specific
0
10
20
30
40
50
25 30 35 40
Core Strength
Upper 95 % CL
Lower 95 % CL
Core Strength, MPa
Rebound Number
n = 13Ward, M.A. and Langan, B.W., Cement Concrete and Aggregates, 16(2), Dec. 1994, 181-185
Test smart – Build right
Factors Affecting Factors Affecting Factors Affecting Factors Affecting Rebound NumberRebound NumberRebound NumberRebound Number
• Strength and elastic modulus of concrete near to surface
� Aggregate type dependence
• Thickness of carbonation zone
• Surface texture
• Surface moisture condition
• Rigidity of test object
Test smart – Build right
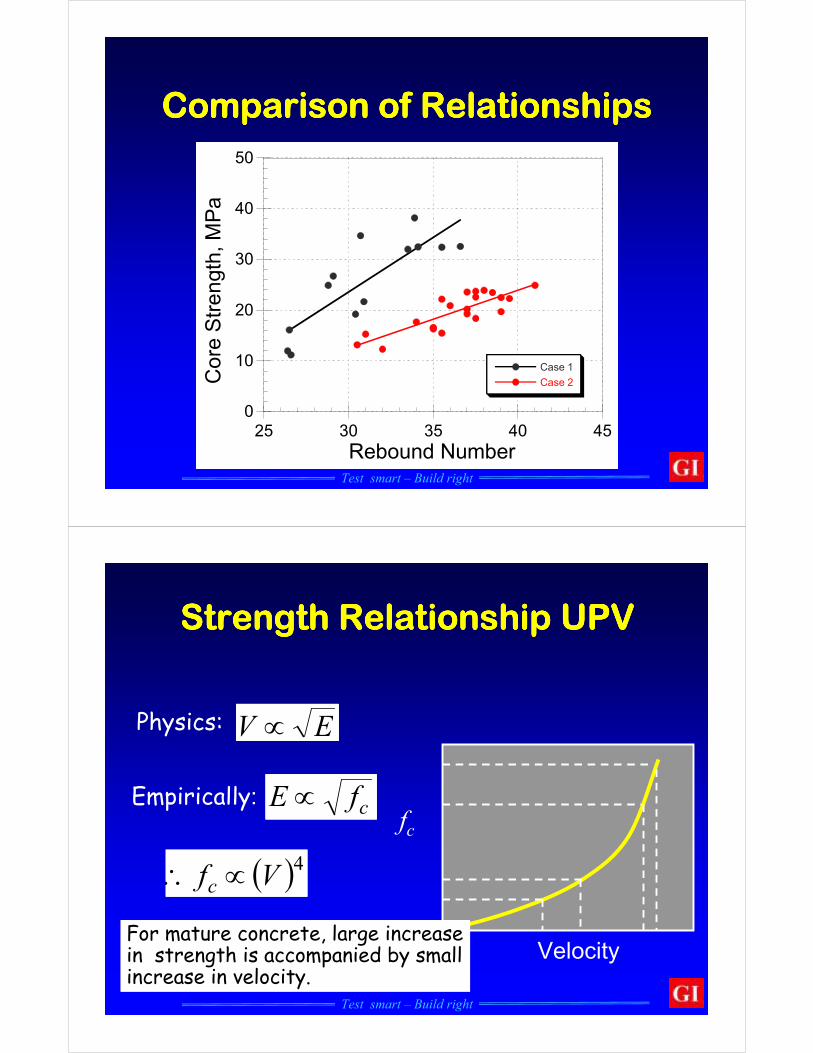
Comparison of RelationshipsComparison of RelationshipsComparison of RelationshipsComparison of Relationships
0
10
20
30
40
50
25 30 35 40 45
Case 1
Case 2Core Strength, MPa
Rebound Number
Test smart – Build right
Strength Relationship UPVStrength Relationship UPVStrength Relationship UPVStrength Relationship UPV
( )4Vfc ∝∴
fc
VelocityFor mature concrete, large increase in strength is accompanied by small increase in velocity.
EV ∝Physics:
cfE ∝Empirically:
Test smart – Build right
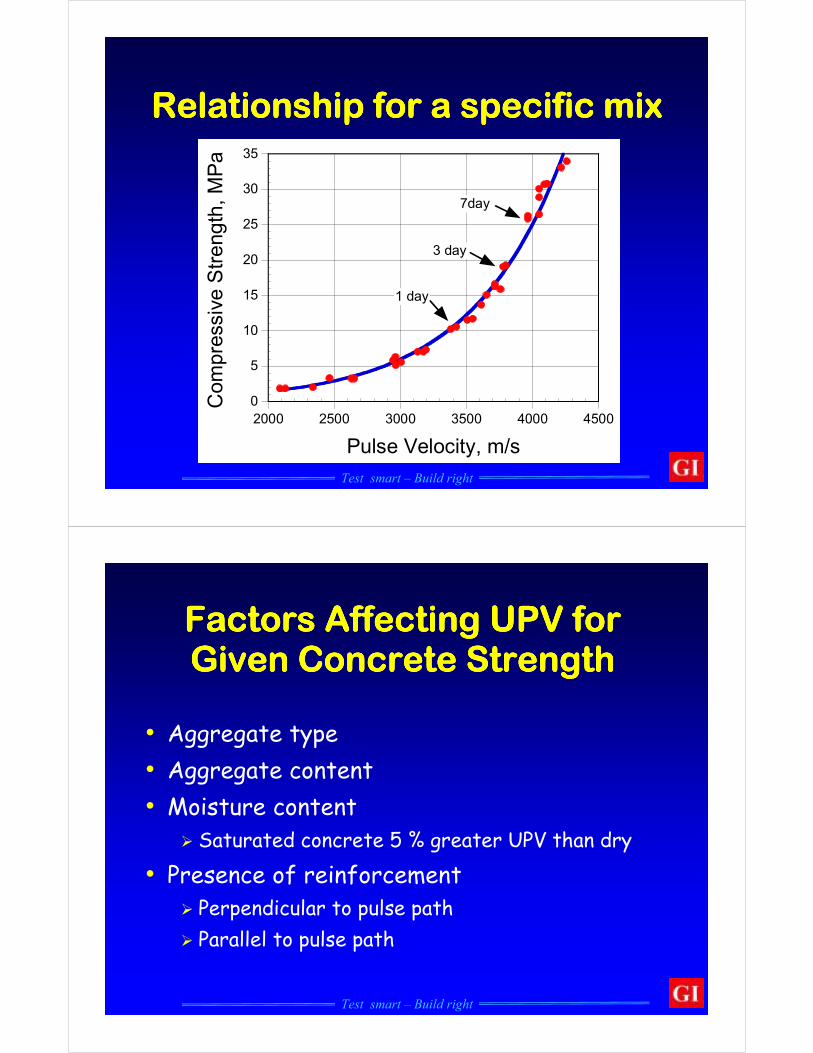
Relationship for a specific mixRelationship for a specific mixRelationship for a specific mixRelationship for a specific mix
0
5
10
15
20
25
30
35
2000 2500 3000 3500 4000 4500
Compressive Strength, MPa
Pulse Velocity, m/s
1 day
3 day
7day
Test smart – Build right
Factors Affecting UPV for Factors Affecting UPV for Factors Affecting UPV for Factors Affecting UPV for Given Concrete Strength Given Concrete Strength Given Concrete Strength Given Concrete Strength
• Aggregate type
• Aggregate content
• Moisture content
� Saturated concrete 5 % greater UPV than dry
• Presence of reinforcement
� Perpendicular to pulse path
� Parallel to pulse path

ExampleExampleExampleExampleAggregate TypeAggregate TypeAggregate TypeAggregate Type
Ref: Bungey, 1982
Test smart – Build right
Why is cube strength higher than cylinder strength?

Test smart – Build right
0
20
40
60
80
100
0 10 20 30 40 50 60 70 80
Compressive Strength, MPa
Pullout Load, kN
General Correlations forCylinder and Cube Strength
fcube= 0.76 F
1.16
fcyl= 0.69 F
1.12
Cube and cylinder strength Cube and cylinder strength Cube and cylinder strength Cube and cylinder strength correlationscorrelationscorrelationscorrelations
150 x 150 cubes
150 x 300 cylinders
Test smart – Build right
Effect of End Friction Effect of End Friction Effect of End Friction Effect of End Friction ––––TriaxialTriaxialTriaxialTriaxial CompressionCompressionCompressionCompression
Frictional Stresses
Zones of triaxial
compression

Test smart – Build right
As L/D DecreasesAs L/D DecreasesAs L/D DecreasesAs L/D Decreases
Strength Increases
Test smart – Build right
Evaluation techniques byEvaluation techniques byEvaluation techniques byEvaluation techniques by
Testing coresRebound hammerUPVPullout testPull-off testMaturity method
are dealt with in detail at our NDT Workshopswww.germann.org

Test smart – Build right
Thank you for your attentionThank you for your attentionThank you for your attentionThank you for your attention
www.germann.org