INHERITANCE OF SOME AGRONOMIC CHARACTERS AND RUSTS … · 2018-03-28 · M.A.H. DARWISH, W.Z. E...
24
INHERITANCE OF SOME AGRONOMIC CHARACTERS IN FIFTEEN F2 WHEAT POPULATIONS 5 DOI: 10.2478/cerce-2018-0001 Original Article Available online: www.uaiasi.ro/CERCET_AGROMOLD/ Print ISSN 0379-5837; Electronic ISSN 2067-1865 Cercetări Agronomice în Moldova Vol. LI , No. 1 (173) / 2018: 5-28 INHERITANCE OF SOME AGRONOMIC CHARACTERS AND RUSTS RESISTANCE IN FIFTEEN F 2 WHEAT POPULATIONS M.A.H. DARWISH 1 , W.Z.E FARHAT 1 , A. EL SABAGH 2 * *E-mail: [email protected] Received Dec. 04, 2017. Revised: Jan. 17, 2018. Accepted: Feb. 08, 2018. Published online: Mar. 30, 2018 1 Wheat Research Department, Field Crops Research Institute, ARC, Egypt 2 Department of Agronomy, Faculty of Agriculture, Kafrelsheikh University, Egypt ABSTRACT. Six parents, i.e. Gemmeiza 9, Sids 12, Misr 1, Misr 2, Sids 1 and Sham 4, were used and evaluated with corresponding 15 F 2 crosses. The parents in each cross were significantly different for most of these characters, revealing the different genetic background of the parents involved. The phenotypic variances in the F 2 crosses were differed significantly from the environmental variances in the corresponding parents in most cases. The parents Gemmeiza 9, Sids 12, Misr 1, Misr 2 were resistant for leaf rust and Gemmeiza 9, Sids 12 and Sids 1 were resistant to stem rust. Among the crosses, three crosses, i.e. Misr 2 x Sids 1, Misr 1 x Sids 1 and Gemmeiza 9 x Sids 1 gave the highest grain yield. The means of F 2 hybrids were higher than the means of the parents for most studied characters. The ranges of the F 2 values went out the ranges of the two parents in most cases, exhibiting transgressive segregation. Most characters showed moderate to high values of broad sense heritabilities. The studied plants in the F 2 's crosses segregated and gave ratios fitted the ratios 9:7, 9:7, 3:1, 1:3, 13:3 and 3:13 for leaf rust and 9:7, 7: 9, 3:1, 1:3, 3:13 and 1:15 for stem rust with insignificant χ 2 values, indicating that the resistant parents for leaf and stem rusts had one or two genes and were complimentary dominance, recessive or independent in their expressions. Based on the resistance to leaf and stem rusts, suitable plant height (90-110 cm) and grain yield higher than the highest parent, 8-17 plants were selected from seven crosses. Keywords: genetic inheritance; agronomic performance; rusts tolerance; Triticum aestivum. INTRODUCTION Wheat (Triticum aestivum L.), as a strategic crop, plays a significant role in terms of economy, production, food and nutrition in the world (Varga et al., 2002; Barutçular et al., 2017). Wheat productivity in several regions
Transcript of INHERITANCE OF SOME AGRONOMIC CHARACTERS AND RUSTS … · 2018-03-28 · M.A.H. DARWISH, W.Z. E...

INHERITANCE OF SOME AGRONOMIC CHARACTERS IN FIFTEEN F2 WHEAT POPULATIONS
5
DOI: 10.2478/cerce-2018-0001 Original Article Available online: www.uaiasi.ro/CERCET_AGROMOLD/ Print ISSN 0379-5837; Electronic ISSN 2067-1865
Cercetări Agronomice în Moldova Vol. LI , No. 1 (173) / 2018: 5-28
INHERITANCE OF SOME AGRONOMIC CHARACTERS AND RUSTS RESISTANCE IN FIFTEEN
F2 WHEAT POPULATIONS
M.A.H. DARWISH1, W.Z.E FARHAT1, A. EL SABAGH2*
*E-mail: [email protected]
Received Dec. 04, 2017. Revised: Jan. 17, 2018. Accepted: Feb. 08, 2018. Published online: Mar. 30, 2018
1 Wheat Research Department, Field Crops Research Institute, ARC, Egypt 2 Department of Agronomy, Faculty of Agriculture, Kafrelsheikh University, Egypt
ABSTRACT. Six parents, i.e. Gemmeiza 9, Sids 12, Misr 1, Misr 2, Sids 1 and Sham 4, were used and evaluated with corresponding 15 F2 crosses. The parents in each cross were significantly different for most of these characters, revealing the different genetic background of the parents involved. The phenotypic variances in the F2 crosses were differed significantly from the environmental variances in the corresponding parents in most cases. The parents Gemmeiza 9, Sids 12, Misr 1, Misr 2 were resistant for leaf rust and Gemmeiza 9, Sids 12 and Sids 1 were resistant to stem rust. Among the crosses, three crosses, i.e. Misr 2 x Sids 1, Misr 1 x Sids 1 and Gemmeiza 9 x Sids 1 gave the highest grain yield. The means of F2 hybrids were higher than the means of the parents for most studied characters. The ranges of the F2 values went out the ranges of the two parents in most cases, exhibiting transgressive segregation. Most characters showed moderate to high values of broad sense heritabilities. The studied plants in the F2's crosses segregated and gave ratios fitted
the ratios 9:7, 9:7, 3:1, 1:3, 13:3 and 3:13 for leaf rust and 9:7, 7: 9, 3:1, 1:3, 3:13 and 1:15 for stem rust with insignificant χ2 values, indicating that the resistant parents for leaf and stem rusts had one or two genes and were complimentary dominance, recessive or independent in their expressions. Based on the resistance to leaf and stem rusts, suitable plant height (90-110 cm) and grain yield higher than the highest parent, 8-17 plants were selected from seven crosses.
Keywords: genetic inheritance; agronomic performance; rusts tolerance; Triticum aestivum.
INTRODUCTION
Wheat (Triticum aestivum L.), as
a strategic crop, plays a significant role in terms of economy, production, food and nutrition in the world (Varga et al., 2002; Barutçular et al., 2017). Wheat productivity in several regions

M.A.H. DARWISH, W.Z. E FARHAT, AYMAN EL SABAGH
6
of the world is below average due to the unfavorable environmental conditions (Moaveni, 2011; Barutçular et al., 2016a,b). The productivity of wheat is influenced by various biotic or abiotic stresses (Abdelaal et al., 2017). It is a widely adapted crop grown in warm, humid to dry and cold environments (Akhtera et al., 2017).
Wheat stem rust (Puccinia graminis f. sp. tritici) is historically the most damaging disease of wheat and under favorable conditions, stem rust may cause yield losses up to 100% to the susceptible varieties (FAO, 2016), while leaf rust disease also is considered the most common and widely distributed of the three wheat rusts and has become a more serious problem of wheat. Draz et al. (2015) found yield losses up to 50% due to leaf rust. Therefore, genetic resistance is the most economic and effective means of reducing yield losses caused by the diseases.
Development of new high yielding cultivars and resistant to rusts diseases of the main objectives of wheat breeders. Breeding genotypes for disease resistance should a continuous process and plant breeders need to add new effective sources to their breeding materials (Draz et al., 2015). Several studies have been performed to estimate phenotypic and genetic variances and derived parameters like heritabilities and predicted selection responses utilizing parents and F2 analysis and other advanced generations in wheat (Ragab, 2010; Zaazaa et al., 2012; Abd El-Rahman, 2013). In addition,
considerable genetic variability for plant height, yield and its components in F2 crosses were also reported by Ragab (2010), Zaazaa et al. (2012) and Abd El-Rahman (2013), while Cruz et al. (2012) noticed that the effective selection necessarily includes the prediction of genetic values of the traits involved and might be obtained by estimating the components of the genetic and phenotypic variance. Ragab (2010) considered the mean performances of the genotypes that were resistance to leaf rust disease and grain yield plant-1 together to establish the selection index and found the genotype Giza 168, Sakha 94 and Gemmeiza 9 gave the highest mean values of both traits.
By understanding the genetic behavior of wheat resistance to stem rust (caused by Puccinia graminis f. sp. tritici) and leaf rust (caused by Puccinia triticina). These diseases are essential for deciding the breeding method, that maximizes the genetic improvement of these characters. Resistance of wheat to leaf and stem rusts has been qualitatively analyzed by several researchers: Ragab (2010), Youssef et al. (2012), El-Sayed (2015), Hermas and El-Sawi (2015) and Ali (2017). In addition, Ragab (2010), Hermas and El‐Sawi (2015) and Ali (2017) illustrated that inheritance of resistance to rusts in wheat was dominant over susceptibility in most cases, where Ragab (2010) found that resistance was controlled by recessive genes in some crosses, while estimates of heritability for resistance were,

INHERITANCE OF SOME AGRONOMIC CHARACTERS IN FIFTEEN F2 WHEAT POPULATIONS
7
generally, high in most studies in earlier, as reported by Youssef et al. (2012), El-Sayed (2015), Hermas and El-Sawi (2015) and Ali (2017).
The main objectives of this study were to analyze the nature of inheritance of leaf and stem rusts disease resistance, plant height and grain yield and its components; to evaluate the nature and number of resistance genes controlling leaf and stem rusts resistance in the studied genotypes under field conditions and to selection of the best plants using
the important characters to progress to the next generation.
MATERIALS AND METHODS
The present study was carried out
during the one successive season 2013-14 at Sakha Agricultural Research station, Kafr Elsheikh, Egypt (31°5'12" North, 30°56'49" East). Fifteen F1 crosses were obtained from previous study and planted to obtain the F2 crosses in 2012-13. Name and pedigree for the used parents are presented in Table 1.
Table 1 - Names and pedigree of the used parents No. Genotypes Cross name and pedigree P1 Gemmeiza 9 Ald ”S“/ Huac// Cmh74A .630/ Sx
P2 Sids 12 BUC//7C/ALD/5/MAYA74/ON//II60.147/3/BB/GLL/4/CHAT"S"/6/ MAYA/VUL//CMH74A.630/4*SX
P3 Misr 1 OASIS/SKAUZ//4*BCN/3/2*PASTOR P4 Misr 2 SKAUZ/BAV92 P5 Sids 1 HD2172/PAVON"S"//1158.57/MAYA74"S" P6 Sham 4 FLK/HORK
The F2 populations and their parents
(P1, P2 and F2) were sown on 30 Nov. 2013 in randomized complete design and replicated in three times. The plot of each parent and F2 crosses consisted 2 meters long, six rows, 25 cm apart and plants within rows were 20 cm spaced. In each parent and F2 cross, data were taken on fifty random competitive plants (150 plants from each generation as total). All the recommended management practices were applied at the proper time during growth period of wheat. The experiment was surrounded by mixed wheat genotypes, which were highly sensitive to leaf and stem rusts as a spreader. The average minimum and maximum temperature was 11.08°C and 22.38°C, respectively.
Data on plant height (PH, cm), spikes plant-1 (SP), kernels spike-1 (KS), 100 kernel weights (KW, g) and grain yield plant-1 (GY, g) were recorded to know the agronomic performance of F2 crosses. For evaluation of rust reaction under field conditions, frequency distribution was performed for the P1, P2 and F2 populations of the 15 crosses at both heading and anthesis stages, while the infection types were classified as resistant (R), moderately resistant (MR), moderately susceptible (MS) and susceptible (S). In addition, disease severity for leaf and stem rusts were recorded according to Stakman et al. (1962).
For the quantitative analysis, the average coefficients of infection were

M.A.H. DARWISH, W.Z. E FARHAT, AYMAN EL SABAGH
8
obtained by multiplying infection severity by an assigned constant values of 0.2, 0.4, 0.8 and 1 for R, MR, MS and S, infection types, respectively, according to Stubbs et al. (1986).
For the inheritance studies, plants having O, R, and MR infection types were pooled together and considered as resistant, while plants with MS and S infection types were considered as susceptible ones (according to Stakman et al., 1962). The Chi-square test (χ2) was used to test the significance of difference between observed and expected ratios in F2 populations for leaf and stem rusts reactions according to Steel and Torrie (1960).
The t-test was used to test the significance of difference between means of the two parents in each cross. The phenotypic (σ2
p), genotypic (σ2g) and
environmental (σ2e) variances were
obtained using parents and their F2 crosses as outlined by Cruz et al. (2012). F ratio was calculated for testing the significance of the differences between F2 variance and the corresponding environmental variance. Broad sense heritability (H,%) was calculated and equal to σ2
g / σ2p × 100,
according to Acquaah (2007). Selection differential (S), the expected response to selection (RS), the expected response to selection, expressed as % of the base population mean (RS,%) and the expected genetic gain (PGG) were calculated using the formulas reported by Cruz et al. (2012).
S = ( S - O); RS = S × HX;
RS (%) = 100 × RS/ O The statistical analyses were
performed by genes software [GENES program (Cruz, 2013)] and Microsoft Excel spreadsheets.
RESULTS AND DISCUSSION
Differences between parents and between phenotypic and genotypic variances
The data in Table 2 indicate significant, 0.01 or 0.05 probability, difference between the two parents of each cross for the most characters, revealing the different genetic background of the parents involved. On the other hand, the insignificant different was observed between Gemmeiza 9 and Sids 12 for LR; Gemmeiza 9 and Misr 1 for KS, KW and LR; Gemmeiza 9 and Misr 2 for PH, KW, GY and LR; Gemmeiza 9 and Sids 1 for KS and KW; Sids 12 and Misr 1 for KW and LR; Sids 12 and Misr 2 for KW and GY; Sids 12 and Sids 1 for SR; Misr 1 × Misr 2 for KW, GY and LR; Misr 1 and Sids 1 for KS, KW and GY; Misr 2 and Sids 1 for KW, and Misr 1 and Sham 4 for SP. These results were similar to Abd El-Rahman (2013), she found significant differences among the studied parents in cross Gemmeiza 9 × Misr 2 for SP, KS, KW and GY and in cross Sids 12 × Misr 2 for SP, KS and KW. Also, similar results were detected by Zaazaa et al. (2012).
Despite the absence of significant differences between the parents for the preceding characters, the phenotypic variances in the F2 were differed significantly (P<0.01) from the environmental variances in the corresponding parents in all crosses for the studied characters, except for SP in Misr 1 × Misr 2, Misr 2 × Sids 1 and Misr 2 × Sham 4.

INHERITANCE OF SOME AGRONOMIC CHARACTERS IN FIFTEEN F2 WHEAT POPULATIONS
9
Consequently, the F2 plants had sufficient variability to estimate the genetic variances, heritabilities and genetic advance for most characters. In general, the same results were obtained by Abd El-Rahman (2013), she detected significant genetic
variance among F2 plants in cross Gemmeiza 9 × Misr 2 and Sids 12 × Misr 2 for PH, SP, KS, KW and GY. Also, these results are in accordance with those obtained by Zaazaa et al. (2012) for grain yield and its components.
Table 2 - Significance of T-test of differences between parents and significance of
F-test for the phenotypic variances among F2 plants and environmental variances in the corresponding parents in each of the 15 crosses for the studied characters
Cross Plant height (cm)
No. spikes plant-1
No. kernel spike-1
100 kernel weight
(g)
Grain yield (g)
Leaf rust
Stem Rust
T-test ** ** ** * ** ns ** Gemmeiza 9 × Sids 12 F-test ** ** ** ** ** ** **
T-test ** ** ns ns ** ns ** Gemmeiza 9 × Misr 1 F-test ** ** ** ** ** ** **
T-test ** ** ** ns ** ns ** Gemmeiza 9 × Misr 2 F-test ** ** ** ** ** ** **
T-test ns * ** ns ns ns ** Gemmeiza 9 × Sids 1 F-test ** ** ** ** ** ** **
T-test ** ** ** ns ** ns ** Gemmeiza 9 × Sham 4 F-test ** ** ** ** ** ** **
T-test ** ** ** ns ns ns ** Sids 12 × Misr 1 F-test ** ** ** ** ** ** **
T-test ** ** ns ns ** ** ** Sids 12 × Misr 2 F-test ** ** ** ** ** ** **
T-test ** ** ** * ** ** ns Sids 12 × Sids 1 F-test ** ** ** ** ** ** **
T-test ** ** ns ns ns ** ** Sids 12 × Sham 4 F-test ** ** ** ** ** ** **
T-test ** ** ** ns ** ** ** Misr 1 × Misr 2 F-test ** ns ** ** ** ** **
T-test ** ** ** ** ** ** ** Misr 1 × Sids 1 F-test ** ns ** ** ** ** **
T-test ** ** ** ** ** ** ** Misr 1 × Sham 4 F-test ** ** ** ** ** ** **
T-test * ** ** ** ** ** ** Misr 2 × Sids 1 F-test ** ns ** ** ** ** **
T-test ** ns ** ** ** ** ** Misr 2 × Sham 4 F-test ** ns ** ** ** ** **
T-test ** ** ** ** ** ** ** Sids 1 × Sham 4 F-test ** ** ** ** ** ** **
* and ** = significant at 0.05 and 0.01 levels of probability, respectively; ns = no significant

M.A.H. DARWISH, W.Z. E FARHAT, AYMAN EL SABAGH
10
Table 3 - Means and variances for the studied characters in the used parents
Characters
Generation Parameters Plant height (cm)
No. spikes plant-1
No. kernel spike-1
100 kernel weight
(g)
Grain yield (g)
Leaf rust
Stem rust
Parents Mean 120.37 15.27 58.51 3.94 33.58 0.20 0.27 Gemmeiza 9 Variance 29.90 29.70 79.90 0.57 97.26 0.10 0.06 Mean 108.23 9.92 70.52 4.25 28.70 0.22 0.91 Sids 12 Variance 25.88 6.76 58.66 0.30 77.91 0.26 1.90 Mean 112.30 20.22 58.25 4.08 39.76 0.23 33.20 Misr 1 Variance 36.45 21.35 69.05 0.28 94.84 0.55 47.41 Mean 121.50 17.53 66.64 4.12 37.63 0.32 19.97 Misr 2 Variance 15.02 20.32 60.10 0.34 94.09 1.42 49.16 Mean 125.57 22.90 58.51 3.95 42.60 54.40 0.69 Sids 1 Variance 30.72 26.00 71.57 0.52 98.59 58.36 0.81 Mean 97.10 18.01 43.33 2.73 15.47 14.13 15.47 Sham 4 Variance 17.88 29.43 71.58 0.40 47.95 29.78 45.08
Parents' means 114.18 17.31 59.29 3.84 32.96 11.58 11.75 LSD 0.05 1.87 2.21 4.28 0.28 4.47 3.11 3.34
Table 4 - Means and ranges for the studied characters of 15 F2 wheat populations
Characters
Generation Parameters Plant height (cm)
No. spikes plant-1
No. kernel spike-1
100 kernel weight
(g)
Grain yield (g)
Leaf rust
Stem rust
F2 Crosses Mean 112.03 13.64 52.81 3.89 32.24 5.14 1.54
65.00 5.00 35.00 2.00 4.20 0.05 0.05 Gemmeiza 9 × Sids 12 Range 140.00 25.00 77.00 5.66 91.30 90.00 40.00
Mean 116.30 18.09 54.35 4.17 36.86 2.85 6.10 90.00 5.00 30.00 1.90 5.10 0.05 0.05 Gemmeiza
9 × Misr 1 Range 135.00 37.00 87.00 5.89 90.60 50.00 70.00 Mean 122.37 17.55 51.33 4.00 31.77 3.33 5.35
100.00 8.00 29.00 1.70 8.10 0.05 0.05 Gemmeiza 9 × Misr 2 Range
140.00 34.00 84.00 5.49 87.80 40.00 70.00 Mean 119.70 19.97 48.30 3.99 41.00 18.39 2.10
80.00 7.00 29.00 1.85 8.00 0.05 0.05 Gemmeiza 9 × Sids 1 Range
150.00 35.00 82.00 5.51 79.60 80.00 30.00 Mean 109.80 19.32 50.51 3.43 25.91 14.45 3.63
75.00 7.00 30.00 1.50 6.80 0.05 0.05 Gemmeiza 9 × Sham 4 Range 135.00 47.00 84.00 5.04 83.70 70.00 60.00
Mean 109.63 16.03 56.12 4.08 35.97 3.29 6.68 75.00 5.00 29.00 1.89 6.50 0.05 0.05 Sids 12 ×
Misr 1 Range 140.00 29.00 87.00 6.00 85.70 60.00 70.00 Sids 12 × Mean 115.00 14.92 59.39 4.15 33.94 2.15 7.05

INHERITANCE OF SOME AGRONOMIC CHARACTERS IN FIFTEEN F2 WHEAT POPULATIONS
11
Characters
Generation Parameters Plant height (cm)
No. spikes plant-1
No. kernel spike-1
100 kernel weight
(g)
Grain yield (g)
Leaf rust
Stem rust
75.00 5.00 29.00 1.62 6.80 0.05 0.05 Misr 2 Range 150.00 28.00 86.00 6.71 81.40 30.00 60.00
Mean 116.63 16.59 58.53 4.05 37.12 6.69 3.77 80.00 5.00 30.00 1.88 8.50 0.05 0.05 Sids 12 ×
Sids 1 Range 155.00 29.00 85.00 6.00 84.20 30.00 110.00
Mean 105.97 18.35 56.49 3.73 33.25 4.24 2.90 70.00 4.00 30.00 1.57 5.00 0.05 0.05 Sids 12 ×
Sham 4 Range 145.00 29.00 95.00 5.60 91.20 70.00 60.00
Mean 121.10 19.28 61.52 4.07 38.10 1.97 24.79 105.00 7.00 30.00 2.00 10.40 0.05 0.05 Misr 1x ×
Misr 2 Range 135.00 30.00 86.00 5.94 89.70 50.00 90.00 Mean 120.37 22.07 51.65 4.19 42.94 4.48 3.70
105.00 12.00 28.00 1.71 10.60 0.05 0.05 Misr 1 × Sids 1 Range 135.00 31.00 90.00 6.46 88.10 70.00 60.00
Mean 114.03 21.94 49.67 3.75 32.97 9.34 10.98 90.00 7.00 29.00 1.74 7.40 0.05 0.05 Misr 1 ×
Sham 4 Range 135.00 32.00 84.00 6.03 83.60 70.00 70.00 Mean 124.50 20.52 62.50 4.27 46.29 9.57 3.56
110.00 8.00 30.00 1.80 10.00 0.05 0.05 Misr 2 × Sids 1 Range
140.00 31.00 109.00 6.11 89.70 70.00 70.00 Mean 118.07 18.19 59.39 3.68 26.87 8.28 5.97
100.00 8.00 30.00 1.73 7.50 0.05 0.05 Misr 2 × Sham 4 Range
135.00 30.00 87.00 6.00 71.70 99.00 60.00 Mean 117.40 21.37 53.65 3.86 32.36 18.22 2.71
100.00 9.00 29.00 1.63 8.30 0.05 0.05 Sids 1 × Sham 4 Range 135.00 34.00 87.00 6.35 78.50 99.00 40.00 F2' means 116.19 18.52 55.08 3.95 35.17 7.49 6.05 LSD 0.05 4.03 2.27 5.06 0.32 5.53 5.19 5.66
The mean performances of the
studied characters for the six parents and their F2's are presented in Tables 3 and 4. For parents, the range of the mean values were 97.10 to 125.57 cm for PH, 9.92 to 22.90 spikes plant-1 for SP, 43.33 to 70.52 kernels spike-1 for KS, 2.73 to 4.25 g for KW, and 15.47 to 42.60 g for GY. The highest parents' values were obtained in PH, SP for Sids 1, KS for Sids 12 and Misr 2, KW for Sids 12, Misr 2 and Misr 1 and GY for Sids 1 and Misr 2.
On the other hand, the lowest values were obtained for PH, KS, KW and GY in Sham 4, and SP in Sids 12. All parents were resistant for LR, except for Sids 1 and Cham 4. For SR, Misr 1, Misr 2 and Sham 4 were the most susceptible parents, while Gemmeiza 9, Sids 12 and Sids 1 were the most resistant ones.
The range of the mean values in the studied F2 crosses were 105.97 to 124.5 cm, for PH, 13.64 to 22.07 spikes plant-1 for SP, 48.30 to 62.50

M.A.H. DARWISH, W.Z. E FARHAT, AYMAN EL SABAGH
12
kernels spike-1 for KS, 3.43 to 4.27 g for KW and 25.91 to 46.29 g for GY. Misr 2 × Sids 1, Gemmeiza 9 × Misr 2, Misr 1 × Misr 2 and Misr 1 × Sids 1 were the tallest crosses, while Sids 12 × Cham 4, Sids 12 × Misr 1 and Gemmeiza 9 × Sham 4 were the shortest ones. The crosses Misr 1 × Sids 1, Misr 1 × Sham 4, Sids 1 × Sham 4, Misr 2 × Sids 1 and Gemmeiza 9 × Sids 1 had the highest SP, while Gemmeiza 9 × Sids 12, Sids 12 × Misr 2 were vice versa. The highest KS were recorded in Misr 2 × Sids 1, Misr 1 × Misr 2, Misr 2 × Sham 4, Sids 12 × Misr 2 and Sids 12 × Sids 1, while Gemmeiza 9 × Sids 1, Misr 1 × Sham 4, Gemmeiza 9 × Sham 4, Gemmeiza 9 × Misr 2, Misr 1× Sids 1 and Gemmeiza 9 × Sids 12 showed the opposite trend. The heaviest 100 kernel weight were detected in Misr 2 × Sids 1, Misr 1 × Sids 1, Gemmeiza 9 × Misr 1, Sids 12 × Misr 2, Misr 1 × Misr 2, Sids 12 × Misr 1, Sids 12 × Sids 1, Gemmeiza 9 × Misr 2 and Gemmeiza 9 × Sids 1, while Gemmeiza 9 × Sham 4, Misr 2 × Sham 4, Sids 12 × Sham 4 and Misr 1 × Cham 4 had the lightest 100 KW values. The highest and lowest GY were detected in crosses Misr 2 × Sids 1, Misr 1 × Sids 1 and Gemmeiza 9 × Sids 1 and crosses Gemmeiza 9 × Cham 4 and Misr 2 × Cham 4, respectively. The results of leaf rust resistance revealed that Gemmeiza 9 × Sids 1, Sids 1 × Sham 4 and Gemmeiza 9 × Sham 4 were the most sensitive crosses, while the other crosses were resistant or moderately resistant. Furthermore, Misr 1 × Misr 2
was the most sensitive cross for stem rust, while the remaining crosses were resistant or moderately resistant.
The means of F2 hybrids was higher than the means of the parents for all characters, except for KS, LR and SR. The F2 mean values were higher than or close to the corresponding high parents means for SP in Gemmeiza 9 × Misr 1; Sids 12 × Misr 2 and Misr 1 × Sids 1; SR in Misr 1 × Sham 4 and Misr 2 × Sham 4; GY and SP in Gemmeiza 9 × Misr 2; PH and SP in Gemmeiza 9 × Sids 1 and KW in Misr 1 × Misr 2. Further, the means of the F2 crosses fallen less than or nearest to the corresponding lowest parent mean values for GY and KW in Misr 1 × Sids 1 and Misr 2 × Sids 1; LR in Gemmeiza 9 × Sham 4, Sids 12 × Misr 1, Sids 12 × Misr 2 and Misr 1 × Misr 2; GY and SR in Gemmeiza 9 × Sids 1; GY and SP in Sids 12 × Sham 4; SP and SR Gemmeiza 9 × Misr 2; PH and SP in Misr 1 × Sham 4; SP in Misr 2 × Sham 4; KS, LR and SR in Gemmeiza 9 × Misr 1; LR and SR in Gemmeiza 9 × Sids 12 and SR in Sids 12 × Sids 1. Meanwhile, the F2 means exhibited intermediate scores between the two corresponding parents for the remaining characters.
From another point of view, the ranges of the F2 values went out the ranges of the two parents in each cross for the studied characters, except Misr 2 × Sham 4 for PH and GY, Sids 1 × Sham 4 for PH and GY and Misr 1 × Sham for GY. These results indicate the size of the difference among the parents, which

INHERITANCE OF SOME AGRONOMIC CHARACTERS IN FIFTEEN F2 WHEAT POPULATIONS
13
were expressed in the amount of the variability produced from segregation in the F2 crosses. Transgressive segregation occurred even in crosses involving parents that were similar in phenotypic performance, indicating that these parents were different genotypically. In this respect, Abd El-Rahman (2013) reported that
Gemmeiza 9 × Misr 2 could be selected for obtaining plants having high grain yield. In the study of Ragab (2010) and Zaazaa et al. (2012), the mean value of the F2 population, comparing with their parents, was higher than the highest parent for grain yield and its components in many cases.
Table 5 - Estimates of phenotypic (σp
2), genotypic (σg2) and environmental (σe
2) variance components and broad sense heritability (h2
bs) for the studied characters of the parents and their 15 F2 bread wheat crosses: Gemmeiza 9 × Sids 12, Gemmeiza 9 × Misr 1, Gemmeiza 9 × Misr 2 and Gemmeiza 9 × Sids 1
Characters
Genetic component
Plant height (cm)
No. spikes plant-1
No. kernel spike-1
100 kernel weight (g)
Grain yield (g)
Leaf rust
Stem rust
Gemmeiza 9 × Sids 12 σp
2 379.56 33.52 174.16 1.06 461.71 184.75 21.81 σe
2 27.89 18.23 69.28 0.43 87.59 0.18 0.98 σg
2 351.67 15.29 104.87 0.62 374.12 184.58 20.83 h2
bs (%) 92.65 45.61 60.22 58.98 81.03 99.90 95.52 Gemmeiza 9 × Misr 1
σp2 81.69 46.72 240.64 0.87 381.40 44.36 161.65
σe2 33.18 25.53 74.48 0.42 96.05 0.32 23.73
σg2 48.51 21.20 166.17 0.45 285.35 44.04 137.92
h2bs (%) 59.39 45.36 69.05 51.47 74.82 99.27 85.32
Gemmeiza 9 × Misr 2 σp
2 94.86 35.50 258.03 0.70 276.42 56.03 110.03 σe
2 22.46 25.01 70.00 0.45 95.68 0.76 24.61 σg
2 72.41 10.49 188.03 0.24 180.74 55.28 85.43 h2
bs (%) 76.33 29.54 72.87 34.78 65.39 98.65 77.64 Gemmeiza 9 × Sids 1
σp2 210.48 41.22 219.82 0.85 345.57 359.00 23.22
σe2 30.31 27.85 75.73 0.55 97.93 29.23 0.43
σg2 180.17 13.37 144.09 0.30 247.64 329.77 22.78
h2bs (%) 85.60 32.44 65.55 35.64 71.66 91.86 98.14
As in Table 5, the phenotypic
variances in F2 crosses were between 51.59 (Misr 2 × Sids 1) and 496.21 cm2 (Sids 12 × Sham 4) for PH; 24.23
(Misr 1 × Sids 1) and 58.03 spikes2 (Gemmeiza 9 × Sham 4) for SP; 160.71 (Misr 1 × Sham 4) and 304.52 (Sids 12 × Sham 4) kernels2 for KS;

M.A.H. DARWISH, W.Z. E FARHAT, AYMAN EL SABAGH
14
0.53 (Misr 1 × Misr 2) and 1.33 g2 (Sids 12 × Sids 1) for KW; 187.92 (Misr 2 × Sham 4) and 511.84 g2 (Sids 12 × Sham 4) for GY; 29.88 (Sids 12 × Misr 2) and 409.58 (Sids 1 × Sham 4) for LR and 21.81 (Gemmeiza 9 × Sids 12) and 534 (Misr 1 × Misr 2) for SR. In addition, the highest phenotypic variances were detected for SR, GY, PH and LR.
Furthermore, the environmental variance in the two parents in each cross of the F2 hybrids ranged from 16.45 (Misr 2 × Sham 4) to 33.59 cm2 (Misr 1 × Sids 1) for PH; 13.54 (Sids 12 × Misr 2) to 29.57 spikes2 (Gemmeiza 9 × Sham 4) for SP; 59.38 (Sids 12 × Misr 2) to 75.74 kernels2 (Gemmeiza 9 × Sham 4) for KS; 0.29 (Sids 12 × Misr 1) to 0.55 g2 (Gemmeiza 9 × Sids 1) for KW; 62.93 (Sids 12 × Sham 4) to 79.93 g2 (Gemmeiza 9 × Sids 1) for GY; 0.18 (Gemmeiza 9 × Sids 12) to 44.07 (Sids 1 × Sham 4) for LR and 0.43 (Gemmeiza 9 × Sids 1) to 48.28 (Misr 1 × Misr 2) for SR. More than, the highest environmental variances in the parents belonged the GY, KS, SR, LR (Table 6).
The character SP in crosses Misr 1 × Misr 2, Misr 2 × Sids 1 and Misr 2 × Sham 4 (Table 2) had not sufficient variability to estimate the genetic variances, heritabilities and genetic advance, as a result of insignificant F ratio between the phenotypic variances and the corresponding environmental variances. For genetic variances, the minimum and maximum values were 20.47 (Misr 1 × Sids 1) and 474.33 cm2 (Sids 12 ×
Sham 4) in PH; 10.49 (Gemmeiza 9 × Misr 2) and 31.89 spikes2 (Sids 12 × Sids 1) in SP; 90.39 (Misr 1 × Sham 4) and 239.4 kernels2 (Sids 12 × Sham 4) in KS; 0.23 (Misr 1 × Misr 2) and 0.92 g2 (Sids 12 × Sids 1) in KW; 116.90 (Misr 2 × Sham 4) and 448.91 g2 (Sids 12 × Sham 4) in GY; 29.04 (Sids 12 × Misr 2) and 365.51 (Sids 1 × Sham 4) in LR and 12.59 (Sids 1 × Sham 4) and 486.63 (Misr 1 × Misr 2) in SR. The highest genetic variances in the F2 resulted by SR, PH, GY, LR.
The broad sense heritabilities exhibited ranges of 37.87 (Misr 1 × Sids 1) to 95.71 (Sids 12 × Misr 2) for PH; 29.54 (Gemmeiza 9 × Misr 2) to 66.07 (Sids 12 × Sids 1) for SP; 56.25 (Misr 1 × Sham 4) to 78.62 (Sids 12 × Sham 4) for KS; 34.11 (Gemmeiza 9 × Sham 4) to 75.74 (Sids 12 × Misr 1) for KW; 61.78 (Misr 1 × Misr 2) to 87.70 (Sids 12 × Sham 4) for GY; 60.18 (Sids 12 × Sids 1) to 99.9 (Gemmeiza 9 × Sids 12) for LR and 35.43 (Sids 1 × Sham 4) to 98.86 (Sids 12 × Sids 1) for SR. Characters LR, SR, PH, GY were the highest ones in broad sense heritability values. In addition, all characters showed moderate to high values of broad sense heritabilities, except for SP, which had low to moderate values. These results were, generally in accordance with those of Abd El-Rahman (2013), El-Sayed (2015), Hermas and El-Sawi (2015) and Ali (2017). On the contrary, Hussain et al. (2011) reported lower estimates of narrow sense heritability for leaf rust resistance.

INHERITANCE OF SOME AGRONOMIC CHARACTERS IN FIFTEEN F2 WHEAT POPULATIONS
15
Table 6 - Estimates of phenotypic (σp2), genotypic (σg
2) and environmental (σe2)
variance components and broad sense heritability (h2bs) for the studied
characters of the parents and their 15 bread F2 wheat poulations: Gemmeiza 9 × Sham 4, Sids 12 × Misr 1, Sids 12 × Misr 2, Sids 12 × Sids 1, Sids 12 × Sham 4, Misr 1 × Misr 2, Misr 1 × Sids 1, Misr 1 × Sham 4, Misr 2 × Sham 4 and Sids 1 × Sham 4
Characters
Genetic component
Plant height (cm)
No. spikes plant-1
No. kernel spike-1
100 kernel
weight (g)Grain
yield (g)Leaf rust
Stem rust
Gemmeiza 9 × Sham 4 σp
2 136.54 58.03 202.41 0.73 282.08 302.37 62.80 σe
2 23.89 29.57 75.74 0.48 72.61 14.94 22.57 σg
2 112.65 28.46 126.67 0.25 209.47 287.43 40.23 h2
bs (%) 82.51 49.05 62.58 34.11 74.26 95.06 64.06 Sids 12 × Misr 1
σp2 358.42 34.31 290.35 1.18 449.32 52.62 166.76
σe2 31.17 14.06 63.86 0.29 86.38 0.40 24.65
σg2 327.25 20.26 226.49 0.90 362.94 52.22 142.10
h2bs (%) 91.30 59.04 78.01 75.74 80.78 99.23 85.22
Sids 12 × Misr 2 σp
2 476.85 38.03 237.23 0.98 343.95 29.88 148.44 σe
2 20.45 13.54 59.38 0.32 86.00 0.84 25.53 σg
2 456.39 24.50 177.85 0.66 257.95 29.04 122.91 h2
bs (%) 95.71 64.40 74.97 67.68 75.00 97.20 82.80 Sids 12 × Sids 1
σp2 413.25 48.27 286.33 1.33 423.16 73.60 118.82
σe2 28.30 16.38 65.12 0.41 88.25 29.31 1.35
σg2 384.95 31.89 221.22 0.92 334.91 44.29 117.47
h2bs (%) 93.15 66.07 77.26 69.24 79.14 60.18 98.86
Sids 12 × Sham 4 σp
2 496.21 40.62 304.52 0.76 522.72 129.40 66.65 σe
2 21.88 18.09 65.12 0.35 62.93 15.02 23.49 σg
2 474.33 22.52 239.40 0.41 459.79 114.38 43.16 h2
bs (%) 95.59 55.45 78.62 54.48 87.96 88.39 64.75 Misr 1 × Misr 2
σp2 52.31 24.83 176.72 0.53 249.91 44.82 534.91
σe2 25.73 20.84 64.57 0.31 94.47 0.98 48.28
σg2 26.57 4.00 112.15 0.23 155.44 43.84 486.63
h2bs (%) 50.80 16.10 63.46 42.25 62.20 97.81 90.97
Misr 1 × Sids 1 σp
2 54.06 24.23 270.24 0.77 325.94 116.28 81.61 σe
2 33.59 23.68 70.31 0.40 96.72 29.46 24.11 σg
2 20.47 0.55 199.93 0.37 229.23 86.83 57.50 h2
bs (%) 37.87 2.29 73.98 48.41 70.33 74.67 70.46 Misr 1 × Sham 4
σp2 113.66 36.78 160.71 1.06 268.39 227.34 248.71
σe2 27.16 25.39 70.31 0.34 71.40 15.17 46.25
σg2 86.49 11.39 90.39 0.72 196.99 212.18 202.47
h2bs (%) 76.10 30.97 56.25 68.20 73.40 93.33 81.41

M.A.H. DARWISH, W.Z. E FARHAT, AYMAN EL SABAGH
16
Characters Genetic
component Plant height (cm)
No. spikes plant-1
No. kernel spike-1
100 kernel
weight (g)Grain
yield (g)Leaf rust
Stem rust
Misr 2 × Sids 1 σp
2 51.59 26.82 259.73 0.80 367.40 252.51 66.26 σe
2 22.87 23.16 65.83 0.43 96.34 29.89 24.98 σg
2 28.73 3.66 193.90 0.37 271.06 222.62 41.28 h2
bs (%) 55.68 13.64 74.65 46.31 73.78 88.16 62.30 Misr 2 × Sham 4
σp2 72.41 31.43 216.36 0.76 212.94 289.50 116.69
σe2 16.45 24.87 65.84 0.37 71.02 15.60 47.12
σg2 55.97 6.55 150.52 0.39 141.92 273.90 69.56
h2bs (%) 77.29 20.85 69.57 51.36 66.65 94.61 59.62
Sids 1 × Sham 4 σp
2 90.17 51.19 298.47 1.09 229.81 409.58 35.54 σe
2 24.30 27.71 71.57 0.46 73.27 44.07 22.94 σg
2 65.88 23.48 226.90 0.63 156.54 365.51 12.59 h2
bs (%) 73.06 45.86 76.02 57.90 68.12 89.24 35.43 * and ** = significant differences at 0.01 and 0.05 probability between the phenotypic variances in F2 and the environmental variances in the corresponding parents.
Selection differential, expected response to selection and expected genetic gain
Knowledge of the expected response to selection and the consequent expected genetic gain are essential to identify the appropriate selection criteria (Acquaah, 2012). The selection intensity was 10% from the base population in each F2 cross for the studied characters. Also, selection differentials, expected response to selection and expected response to selection as a percentage were illustrated by negative values for PH, LR and SR because the deceased values in these characters is the desiring trend.
Tables 7 and 8 showed that the values of the selection differential ranged from -12.37 (Misr 1 × Sids 1) to -37.03 cm (Gemmeiza 9 × Sids 12) for PH; 9.26 (Misr 1 × Sham 4) to 14.61 spikes (Gemmeiza 9 × Sham 4)
for SP; 21.59 (Gemmeiza × Sids 12) to 31.97 kernels (Sids 12 × Sham 4) for KS; 1.12 (Gemmeiza 9 × Misr 2) to 1.85 g (Sids 1 × Sham 4) for KW; 29.98 (Misr 2 × Sham 4’) to 47.04 g (Sids 12 × Sham 4) for GY; -1.92 (Misr 1 × Misr 2) to -18.34 (Gemmeiza 9 × Sids 1) for LR and -1.49 (Gemmeiza 9 × Sids 12) to -24.12 (Misr 1 × Misr 2) for SR.
The expected responses to selection were in the range of -4.68 (Misr 1 × Sids 1) to -35.09 cm (Sids 12 × Misr 2) for PH; 2.87 (Misr 1 × Sham 4) to 7.36 spikes (Sids 12 × Sids 1) for SP; 13.0 (Gemmeiza 9 × Sids 12) to 25.14 kernels (Sids 12 × Sham 4) for KS; 0.39 (Gemmeiza 9 × Misr 2) to 1.40 g (Sids 12 × Misr 1) for KW; 18.65 (Misr 2 × Sham ) to 41.26 g (Sids 12 × Sham 4) for GY; -1.88 (Misr 1 × Misr 2) to -16.85 (Gemmeiza 9 × Sids 1)

INHERITANCE OF SOME AGRONOMIC CHARACTERS IN FIFTEEN F2 WHEAT POPULATIONS
17
for LR and -0.94 (Sids 1 × Sham 4) to -21.94 (Misr 1 × Misr 2) for SR.
The expected responses to selection varied as a percentage from -3.89 (Misr 1 × Sids 1) to -30.94 (Sids 12 × Sham 4) for PH; 13.07 (Misr 1 × Sham 4) to 46.39 (Sids 12 × Misr 2) for SP; 22.5 (Misr 1 × Misr 2)
to 44.49 (Sids 12 × Sham 4) for KS; 9.74 (Gemmeiza 9 × Misr 2) to 34.22 (Sids 12 × Misr 1) for KW; 51.62 (Misr 1 × Misr 2) to 123.32 (Sids 12 × Sham 4) for GY; -59.73 (Sids 12 × Sids 1) to -98.93 (Gemmeiza 9 × Sids 12) for LR and -34.78 (Sids 1 × Sham 4) to -97.55 (Sids 12 × Sids 1) for SR.
Table 7 - Base population mean (X0), mean of the selected plants (Xs), selection differential (S), expected response to selection (RS), expected response to selection expressed as percentage of the base population mean (RS, %), and predicted gain genetic (PGG) for the studied characters of the following F2 wheat crosses: Gemmeiza 9 ×Sids 12, Gemmeiza 9 × Misr 1, Gemmeiza 9 × Misr 2, Gemmeiza 9 × Sids 1, Gemmeiza 9 × Sham 4, Sids 12 × Misr 1 and Sids 12 × Misr 2.
Characters
Genetic component
Plant height (cm)
No. spikes plant-1
No. kernel spike-1
100 kernel weight (g)
Grain yield (g)
Leaf rust
Stem Rust
Gemmeiza 9 × Sids 12 X0 112.03 13.64 52.81 3.89 32.24 5.14 1.54 Xs 75.00 24.00 74.40 5.38 77.37 0.05 0.05 S -37.03 10.36 21.59 1.49 45.12 -5.09 -1.49 RS -34.31 4.73 13.00 0.88 36.56 -5.08 -1.42 RS, % -30.63 34.64 24.62 22.63 113.39 -98.93 -92.41 PGG 77.72 18.37 65.81 4.77 68.81 0.05 0.12
Gemmeiza 9 × Misr 1 X0 116.30 18.09 54.35 4.17 36.86 2.85 6.10 Xs 99.00 30.80 81.60 5.53 74.76 0.05 0.05 S -17.30 12.71 27.25 1.36 37.90 -2.80 -6.05 RS -10.27 5.77 18.82 0.70 28.35 -2.78 -5.16 RS, % -8.83 31.89 34.63 16.81 76.91 -97.53 -84.62 PGG 106.03 23.85 73.17 4.87 65.22 0.07 0.94
Gemmeiza 9 × Misr 2 X0 122.37 17.55 51.33 4.00 31.77 3.33 5.35 Xs 104.67 29.33 80.20 5.12 65.54 0.05 0.05 S -17.70 11.79 28.87 1.12 33.77 -3.28 -5.30 RS -13.51 3.48 21.04 0.39 22.08 -3.23 -4.11 RS % -11.04 19.84 40.99 9.74 69.49 -97.17 -76.91 PGG 108.86 21.03 72.37 4.39 53.85 0.09 1.23
Gemmeiza 9 × Sids 1 X0 119.70 19.97 48.30 3.99 41.00 18.39 2.10 Xs 90.33 31.47 77.20 5.35 72.72 0.05 0.05 S -29.37 11.49 28.90 1.36 31.72 -18.34 -2.05 RS -25.14 3.73 18.94 0.48 22.73 -16.85 -2.01 RS, % -21.00 18.67 39.22 12.10 55.43 -91.61 -95.81 PGG 94.56 23.70 67.24 4.47 63.73 1.54 0.09

M.A.H. DARWISH, W.Z. E FARHAT, AYMAN EL SABAGH
18
Characters Genetic
component Plant
height (cm)
No. spikes plant-1
No. kernel spike-1
100 kernel weight (g)
Grain yield (g)
Leaf rust
Stem Rust
Gemmeiza 9 × Sham 4 X0 109.80 19.32 50.51 3.43 25.91 14.45 3.63 Xs 89.33 33.93 77.13 4.82 65.50 0.05 0.05 S -20.47 14.61 26.62 1.40 39.59 -14.40 -3.58 RS -16.89 7.17 16.66 0.48 29.40 -13.69 -2.29 RS, % -15.38 37.10 32.98 13.90 113.47 -94.73 -63.18 PGG 92.91 26.49 67.17 3.90 55.31 0.76 1.33
Sids 12 × Misr 1 X0 109.63 16.03 56.12 4.08 35.97 3.29 6.68 Xs 79.33 25.60 82.53 5.93 76.60 0.05 0.05 S -30.30 9.57 26.41 1.85 40.63 -3.24 -6.63 RS -27.67 5.65 20.60 1.40 32.82 -3.21 -5.65 RS, % -25.23 35.23 36.71 34.22 91.24 -97.72 -84.58 PGG 81.97 21.68 76.72 5.48 68.79 0.07 1.03
Sids 12 × Misr 2 X0 115.00 14.92 59.39 4.15 33.94 2.15 7.05 Xs 78.33 25.67 82.13 5.70 70.42 0.05 0.05 S -36.67 10.75 22.74 1.56 36.48 -2.10 -7.00 RS -35.09 6.92 17.05 1.05 27.36 -2.04 -5.79 RS, % -30.52 46.39 28.70 25.39 80.62 -94.94 -82.21 PGG 79.91 21.84 76.44 5.20 61.30 0.11 1.25
Table 8 - Base population mean (X0), mean of the selected plants (Xs), selection
differential (S), expected response to selection (RS), expected response to selection expressed as percentage of the base population mean (RS, %), and predicted gain genetic (PGG) for the studied characters of the following F2 wheat crosses: ‘Sids 12 × Sids 1, Sids 12 × Sham 4, Misr 1 × Misr 2, Misr 1 × Sids 1, Misr 1 × Sham 4, Misr 2 × Sids 1, Misr 2 × Sham 4, Sids 1 × Sham 4
Characters
Genetic component
Plant height (cm)
No. spikes plant-1
No. kernel spike-1
100 kernel weight (g)
Grain yield (g)
Leaf rust
Stem rust
Sids 12 × Sids 1 X0 116.63 16.59 58.53 4.05 37.12 6.69 3.77 Xs 83.33 27.73 83.00 5.83 77.02 0.05 0.05 S -33.30 11.15 24.47 1.78 39.90 -6.64 -3.72 RS -31.02 7.36 18.91 1.23 31.58 -4.00 -3.68 RS % -26.60 44.40 32.31 30.38 85.07 -59.73 -97.55 PGG 85.61 23.95 77.43 5.29 68.70 2.70 0.09
Sids 12 × Sham 4 X0 105.97 18.35 56.49 3.73 33.25 4.24 2.90 Xs 71.67 27.73 88.47 5.05 80.50 0.05 0.05 S -34.30 9.39 31.97 1.32 47.25 -4.19 -2.85

INHERITANCE OF SOME AGRONOMIC CHARACTERS IN FIFTEEN F2 WHEAT POPULATIONS
19
Characters Genetic
component Plant
height (cm)
No. spikes plant-1
No. kernel spike-1
100 kernel weight (g)
Grain yield (g)
Leaf rust
Stem rust
RS -32.79 5.21 25.14 0.72 41.56 -3.71 -1.85 RS, % -30.94 28.37 44.49 19.33 124.97 -87.35 -63.64 PGG 73.18 23.55 81.63 4.45 74.81 0.54 1.05
Misr 1 × Misr 2 X0 121.10 19.28 61.52 4.07 38.10 1.97 24.79 Xs 108.00 27.80 83.33 5.38 70.03 0.05 0.67 S -13.10 8.52 21.81 1.31 31.93 -1.92 -24.12 RS -6.65 1.37 13.84 0.55 19.86 -1.88 -21.94 RS, % -5.50 7.11 22.50 13.60 52.13 -95.33 -88.50 PGG 114.45 20.65 75.36 4.62 57.96 0.09 2.85
Misr 1 × Sids 1 X0 120.37 22.07 51.65 4.19 42.94 4.48 3.70 Xs 108.00 30.07 79.93 5.67 78.34 0.05 0.05 S -12.37 7.99 28.28 1.48 35.40 -4.43 -3.65 RS -4.68 0.18 20.92 0.71 24.89 -3.31 -2.57 RS, % -3.89 0.83 40.51 17.04 57.97 -73.84 -69.51 PGG 115.68 22.26 72.58 4.91 67.84 1.17 1.13
Misr 1 × Sham 4 X0 114.03 21.94 49.67 3.75 32.97 9.34 10.98 Xs 96.33 31.20 74.40 5.57 66.15 0.05 0.05 S -17.70 9.26 24.73 1.82 33.18 -9.29 -10.93 RS -13.47 2.87 13.91 1.24 24.36 -8.67 -8.90 RS, % -11.81 13.07 28.01 33.08 73.87 -92.83 -81.04 PGG 100.56 24.81 63.58 4.99 57.33 0.67 2.08
Misr 2 × Sids 1 X0 124.50 20.52 62.50 4.27 46.29 9.57 3.56 Xs 111.67 29.13 89.40 5.72 82.98 0.05 0.05 S -12.83 8.61 26.90 1.45 36.69 -9.52 -3.51 RS -7.15 1.17 20.08 0.67 27.07 -8.39 -2.19 RS, % -5.74 5.73 32.13 15.68 58.47 -87.70 -61.42 PGG 117.35 21.69 82.58 4.94 73.36 1.18 1.38
Misr 2 × Sham 4 X0 118.07 18.19 59.39 3.68 26.87 8.28 5.97 Xs 103.33 28.00 83.93 5.21 57.70 0.05 0.05 S -14.73 9.81 24.54 1.53 30.83 -8.23 -5.92 RS -11.39 2.05 17.07 0.78 20.54 -7.79 -3.53 RS, % -9.64 11.25 28.75 21.33 76.45 -94.04 -59.12 PGG 106.68 20.23 76.47 4.46 47.42 0.49 2.44
M.A.H. DARWISH, W.Z. E FARHAT, AYMAN EL SABAGH
20
Characters Genetic
component Plant
height (cm)
No. spikes plant-1
No. kernel spike-1
100 kernel weight (g)
Grain yield (g)
Leaf rust
Stem rust
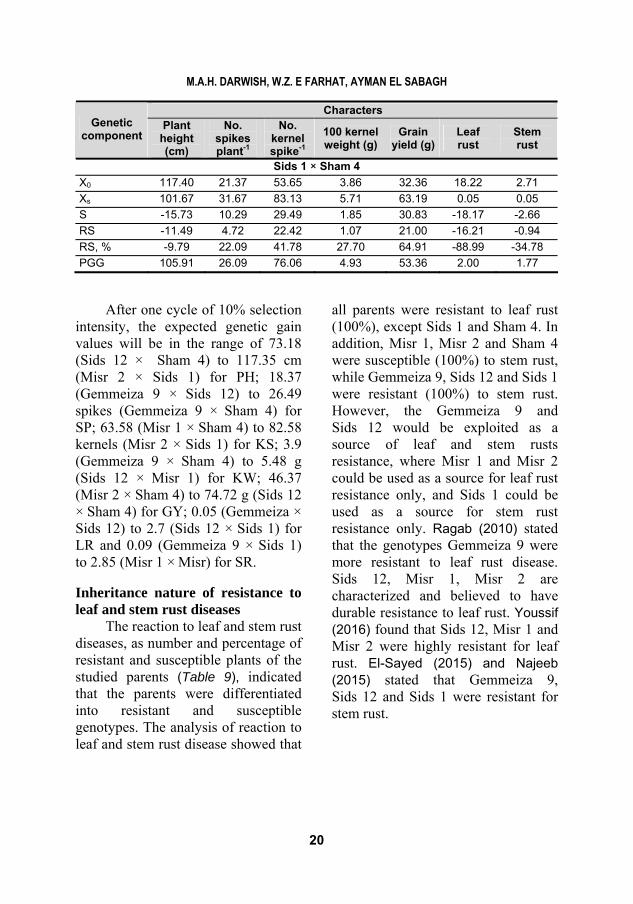
Sids 1 × Sham 4 X0 117.40 21.37 53.65 3.86 32.36 18.22 2.71 Xs 101.67 31.67 83.13 5.71 63.19 0.05 0.05 S -15.73 10.29 29.49 1.85 30.83 -18.17 -2.66 RS -11.49 4.72 22.42 1.07 21.00 -16.21 -0.94 RS, % -9.79 22.09 41.78 27.70 64.91 -88.99 -34.78 PGG 105.91 26.09 76.06 4.93 53.36 2.00 1.77
After one cycle of 10% selection intensity, the expected genetic gain values will be in the range of 73.18 (Sids 12 × Sham 4) to 117.35 cm (Misr 2 × Sids 1) for PH; 18.37 (Gemmeiza 9 × Sids 12) to 26.49 spikes (Gemmeiza 9 × Sham 4) for SP; 63.58 (Misr 1 × Sham 4) to 82.58 kernels (Misr 2 × Sids 1) for KS; 3.9 (Gemmeiza 9 × Sham 4) to 5.48 g (Sids 12 × Misr 1) for KW; 46.37 (Misr 2 × Sham 4) to 74.72 g (Sids 12 × Sham 4) for GY; 0.05 (Gemmeiza × Sids 12) to 2.7 (Sids 12 × Sids 1) for LR and 0.09 (Gemmeiza 9 × Sids 1) to 2.85 (Misr 1 × Misr) for SR. Inheritance nature of resistance to leaf and stem rust diseases
The reaction to leaf and stem rust diseases, as number and percentage of resistant and susceptible plants of the studied parents (Table 9), indicated that the parents were differentiated into resistant and susceptible genotypes. The analysis of reaction to leaf and stem rust disease showed that
all parents were resistant to leaf rust (100%), except Sids 1 and Sham 4. In addition, Misr 1, Misr 2 and Sham 4 were susceptible (100%) to stem rust, while Gemmeiza 9, Sids 12 and Sids 1 were resistant (100%) to stem rust. However, the Gemmeiza 9 and Sids 12 would be exploited as a source of leaf and stem rusts resistance, where Misr 1 and Misr 2 could be used as a source for leaf rust resistance only, and Sids 1 could be used as a source for stem rust resistance only. Ragab (2010) stated that the genotypes Gemmeiza 9 were more resistant to leaf rust disease. Sids 12, Misr 1, Misr 2 are characterized and believed to have durable resistance to leaf rust. Youssif (2016) found that Sids 12, Misr 1 and Misr 2 were highly resistant for leaf rust. El-Sayed (2015) and Najeeb (2015) stated that Gemmeiza 9, Sids 12 and Sids 1 were resistant for stem rust.

INHERITANCE OF SOME AGRONOMIC CHARACTERS IN FIFTEEN F2 WHEAT POPULATIONS
21
Table 9 - Parental wheat genotypes and their reaction to leaf rust disease as number of resistance plants and percentage of resistance
Resistant plants Susceptible plants Parent No. % No. %
Total number of plants
Leaf rust Gemmeiza 9 150 100 - - 150 Sids 12 150 100 - - 150 Misr 1 150 100 - - 150 Misr 2 150 100 - - 150 Sids 1 - - 150 100 150 Sham 4 - - 150 100 150
Stem rust Gemmeiza 9 150 100 - - 150 Sids 12 150 100 - - 150 Misr 1 - - 150 100 150 Misr 2 - - 150 100 150 Sids 1 150 - - 100 150 Sham 4 - - 150 100 150
Segregation and chi square (χ2)
analysis of 150 plants of F2 crosses between the six parents under field conditions are presented in Tables 10 and 11. The obtained crosses in F2 generation were divided into three and four groups, based on the reaction of their parents to leaf and stem rust reactions. These groups (Tables 10 and 11) were resistant x resistant, resistant x susceptible, susceptible x susceptible for leaf and stem rust and susceptible x resistant for stem rust. In addition, the highest percentage of resistant plants to leaf rust was detected in crosses Misr 1 × Misr 2 (81.3 %), Gemmeiza 9 × Misr 1 (74%) and Gemmeiza 9 × Misr 2 (70%), while the lowest percentage was observed in crosses Sids 1 × Sham 4 (15.3%), Gemmeiza 9 × Sids 1 (16%) and Gemmeiza 9 × Sham 4 (26%). Moreover, the highest
percentage of resistant plants to stem rust was revealed in crosses Gemmeiza 9 × Sids 12 (70.7%), Sids 12 × Sids 1 (64%) and Gemmeiza 9 × Sids 1, while the lowest percentage was showed in crosses Misr 1 × Misr 2 (2.7%), Misr 1 × Sham 4 (20.7%), Misr 2 × Sham 4 (28.7%) and Sids 12 × Misr 2 (28.7%).
It was clear that in the crosses which compound from one resistant parent at least, the resistance was dominant over the susceptibility for leaf rust in all cases, except Sids 12 × Sids 1, Gemmeiza 9 × Sham 4 and Gemmeiza 9 × Sids 1 and these resistance genes were complementary dominance, recessive or independent in their expressions. The F2 plants of the studied crosses were segregated and gave fit to the ratio 9 (resistant): 7 (susceptible) in Gemmeiza 9 × Sids 12, Gemmeiza 9 × Misr 2,

M.A.H. DARWISH, W.Z. E FARHAT, AYMAN EL SABAGH
22
Sids 12 × Sham 4, Misr 1 × Sids 1, Misr 1 × Sham 4, Misr 2 × Sids 1 and Misr 2 × Sham 4, indicating that Gemmeiza 9, Sids 12, Misr 1 and Misr 2 had two complimentary
dominant genes. Where, the ratio of segregation was fitted to 7 (resistant): 9 (susceptible) in Sids 12 × Sids 1, showing that Sids 12 had two complimentary recessive genes.
Table 10 - Segregation and chi square (χ2) analysis of F2 plants (150 plants) from the
15 crosses between the six parents to leaf rust under field condition
Leaf rust Cross No. of
resistantplants
No. of susceptible
plants
% of resistant
plants
% of susceptible
plants Expected
ratio χ2 P value
Resistant cross x resistant cross Gemmeiza 9 × Sids 12 94 56 62.7 37.3 9:7 2.51 0.11
Gemmeiza 9 × Misr 1 111 39 74.0 26.0 3:1 0.08 0.78
Gemmeiza 9 × Misr 2 95 55 63.3 36.7 9:7 3.06 0.08
Sids 12 × Misr 1 100 50 66.7 33.3 3:1 5.56 0.02
Sids 12 × Misr 2 105 45 70.0 30.0 3:1 2.00 0.16
Misr 1 × Misr 2 122 28 81.3 18.7 13:3 0.00 0.98
Resistant cross × susceptible cross Gemmeiza 9 × Sids 1 24 126 16.0 84.0 3:13 1.50 0.39
Gemmeiza 9 × Sham 4 39 111 26.0 74.0 1:3 0.08 0.78
Sids 12 × Sids 1 70 80 46.7 53.3 7:9 5.60 0.47
Sids 12 × Sham 4 92 58 61.3 38.7 9:7 1.58 0.21
Misr 1 × Sids 1 89 61 59.3 40.7 9:7 0.58 0.45
Misr 1 × Sham 4 78 72 52.0 48.0 9:7 1.10 0.29
Misr 2 × Sids 1 78 72 52.0 48.0 9:7 1.10 0.29
Misr 2 × Sham 4 90 60 60.0 40.0 9:7 0.86 0.36
Susceptible cross × susceptible cross Sids 1 × Sham 4 23 127 15.3 84.7 3:13 2.04 0.28
This segregation in F2 plants in
crosses Gemmeiza 9 × Misr 1, Sids 12 × Misr 1 and Sids 12 × Misr 2 gave a
good fit to the ratio 3 (resistant):1 (susceptible), revealing that Gemmeiza 9 and Sids 12 had one

INHERITANCE OF SOME AGRONOMIC CHARACTERS IN FIFTEEN F2 WHEAT POPULATIONS
23
dominant gene and resistance was dominant over susceptibility, while Gemmeiza 9 had one recessive gene, as a result of the good fit of segregation to the ratio 1 (resistant): 3 (susceptible) in Gemmeiza 9 × Sham 4. Misr 1 × Misr 2 segregated and gave a good fit to the ratio 13 (resistant): 3 (susceptible) and showed that Misr 1 had two dominant genes, while Gemmeiza 9 had two recessive genes as a result of the good fit of segregation to the ratio 3 (resistant): 13 (susceptible) in Gemmeiza 9 × Sids 1.
On the other hand, the only cross in which the two parents were susceptible (Sids 1 × Sham 4) to leaf rust showed the dominance of the susceptibility over the resistance to leaf rust and gave a good fit to the ratio 3 (resistant): 13 (susceptible), indicating that Sids 1 had two recessive genes.
All crosses in which the two parents were resistant, the resistance was dominant over the susceptibility for stem rust and these resistance genes were complementary dominance, recessive or independent in their expressions. The segregations in Gemmeiza 9 × Sids 1 and Sids 12 × Sids 1 had a good fit to the ratio 9 (resistant): 7 (susceptible), revealing that Gemmeiza 9 had two complimentary dominant genes. In addition, the ratio of segregation was good fit to 3 (resistant):1 (susceptible) in Gemmeiza 9 × Sids 12, showing that Gemmeiza 9 had one dominant gene.
All crosses with at least one susceptible parent revealed susceptible ratio dominant over resistant one for stem rust, except Sids 1 × Sham 4. The segregations were a good fit to the ratio 7 (resistant): 9 (susceptible) in Gemmeiza 9 × Misr 1, Gemmeiza 9 × Misr 2, Gemmeiza 9 × Sham 4, Sids 12 × Misr 1, Sids 12 × Sham 4, Misr 1 × Sids 1 and Misr 2 × Sids 1 and revealed that Gemmeiza 9 and Sids 12 had two complementary recessive genes and Sids 1 had two complementary dominant genes. While, Gemmeiza 9 × Sids 1, Sids 12 × Sids 1 and Sids 1 × Sham 4 crosses segregated and gave a good fit to ratio 9 (resistant): 7 (susceptible), indicating that Gemmeiza 9, Sids 12 and Sids 1 had two complementary dominant genes. The ratio 1 (resistant): 3 (susceptible) was well fitted in segregation of crosses Sids 12 × Misr 2 and Misr × Sham 4 and showed that Sids 12 and Misr 2 had one recessive gene. Misr 1 had two recessive genes, as a result of the good fit of segregation to the ratio 3 (resistant): 13 (susceptible) in Misr 1 × Sham 4. The cross Misr 1 and Misr 2 was segregated and gave a good fit to the ratio 1 (resistant): 15 (susceptible), indicating that Misr 1 had two independent recessive genes. Similar result was obtained by Ragab (2010), Youssef et al. (2012) and Ali (2017), who reported that leaf and stem rusts were controlled by one or two genes and these resistance genes were complimentary dominance, recessive or independent in their expressions.

M.A.H. DARWISH, W.Z. E FARHAT, AYMAN EL SABAGH
24
Table 11 - Segregation and chi square (χ2) analysis of F2 plants (150 plants) from the 15 crosses between the six parents to stem rust under field condition
Stem rust
Cross No. of resistant
plants
No. of susceptible
plants
% of resistant
plants
% of susceptible
plants Expected
ratio χ2 P value
Resistant cross × resistant cross Gemmeiza 9 × Sids 12 106 44 70.7 29.3 3:1 1.50 0.22
Gemmeiza 9 × Sids 1 90 60 60.0 40.0 9:7 0.86 0.36
Sids 12 × Sids 1 96 54 64.0 36.0 9:7 3.66 0.06
Resistant cross × susceptible cross Gemmeiza 9 × Misr 1 66 84 44.0 56.0 7:9 7.68 0.95
Gemmeiza 9 × Misr 2 65 85 43.3 56.7 7:9 6.75 0.92
Gemmeiza 9 × Sham 4 52 98 34.7 65.3 7:9 0.12 0.03
Sids 12 × Misr 1 72 78 48.0 52.0 7:9 4.15 0.29
Sids 12 × Misr 2 43 107 28.7 71.3 1:3 0.31 0.58
Sids 12 × Sham 4 71 79 47.3 52.7 7:9 4.85 0.38
Sids 1 × Sham 4 83 67 55.3 44.7 9:7 0.05 0.82
Susceptible cross × resistant cross Misr 1 × Sids 1 59 91 39.3 60.7 7:9 2.43 0.28
Misr 2 × Sids 1 74 76 49.3 50.7 7:9 2.92 0.17
Susceptible cross × Susceptible cross Misr 1 × Misr 2 4 146 2.7 97.3 1:15 28.17 0.07
Misr 1 × Sham 4 31 119 20.7 79.3 3:13 0.04 0.55
Misr 2 × Sham 4 43 107 28.7 71.3 1:3 1.47 0.30
The reaction to leaf and stem
rusts, plant height and grain yield for each plant were taken into consideration together to establish selection index of the four characters to select the best plants in the studied crosses (Table 12). The plants were classified based on reaction to leaf
and stem rusts into tolerant and susceptible, compared to Sham 4 reaction. More than, the plants were classified into favorable in relation to the height with 90-110 cm and unfavorable with height lower than 90 cm or higher than 110 cm. In addition, the plants were classified

INHERITANCE OF SOME AGRONOMIC CHARACTERS IN FIFTEEN F2 WHEAT POPULATIONS
25
based on the grain yield into three groups, the first group was higher than the highest parent (Sids 1 and Misr 1), the second group was between the highest (Misr 1) and lowest (Sham 4) parent and the third
group was lower than the lowest parent (Sham 4). The selected plants, with tolerance to leaf and stem rusts, favorable height and higher than the highest parents, varied from no plant (0%) to 17 plants (11.33%).
Table 12 - Number and percentage of the resistant plants to leaf and stem rusts,
compared to the highest (Misr 1) and lowest (Sham 4) parents in grain yield in the studied F2 crosses (150 plants in each cross)
Plants with grain yield higher than
Misr 1
Plants with grain yield between Sham 4 and
Misr 1 Plants with grain yield
lower than Sham 4 Crosses
No. % No. % No. % Gemmeiza 9 × Sids 12 8 5.33 16 10.67 5 3.33
Gemmeiza × Misr 1 9 6.00 19 12.67 2 1.33
Gemmeiza 9 × Misr 2 4 2.67 12 8.00 5 3.33
Gemmeiza 9 × Sids 1 11 7.33 6 4.00 - -
Gemmeiza 9 × Sham 4 4 2.67 35 23.33 1 0.67
Sids 12 × Misr 1 17 11.33 11 7.33 8 5.33
Sids 12 × Misr 2 3 2.00 15 10.00 10 6.67
Sids 12 × Sids 1 15 10.00 15 10.00 4 2.67
Sids 12 × Sham 4 14 9.33 24 16.00 7 4.67
Misr 1 × Misr 2 6 4.00 5 3.33 - -
Misr 1 × Sids 1 11 7.33 10 6.67 - -
Misr 1 × Sham 4 7 4.67 27 18.00 3 2.00
Misr 2 × Sids 1 4 2.67 2 1.33 - -
Misr 2 × Sham 4 4 2.67 27 18.00 9 6.00
Sids 1 × Sham 4 - - - - - -

M.A.H. DARWISH, W.Z. E FARHAT, AYMAN EL SABAGH
26
Table 13 - Summarization of number of the selected plants, means, broad sense heritability and expected response to selection expressed as percentage of the base population mean (RS, %) in the selected crosses
PH GY
Crosses No. % Mean h2 RS, % Mean h2 RS, %
Sids 12 × Misr 1 17 11.33 109.63 91.30 -27.67 35.97 80.78 32.82
Sids 12 × Sids 1 15 10.00 116.63 93.15 -26.60 37.12 79.14 85.07
Sids 12 × Sham 4 14 9.33 105.97 95.59 -30.94 33.25 87.96 124.97
Gemmeiza 9 × Sids 1 11 7.33 119.70 85.60 -21.00 41.00 71.66 55.43
Misr 1 × Sids 1 11 7.33 120.37 76.10 -3.89 42.94 73.40 57.97
Gemmeiza × Misr 1 9 6.00 116.30 59.39 -8.83 36.86 74.82 76.91
Gemmeiza 9 × Sids 12 8 5.33 112.03 92.65 -30.63 32.24 81.03 113.39
LR SR Crosses
Mean h2 RS, % % resistant plants Mean H2 RS, % % resistant
plants Sids 12 × Misr 1 3.29 99.23 -3.21 48.0 6.68 85.22 -5.65 48.0
Sids 12 × Sids 1 6.69 60.18 -59.73 46.7 3.77 98.86 -97.55 64.0
Sids 12 × Sham 4 4.24 88.39 -87.35 47.3 2.90 64.75 -63.64 47.3
Gemmeiza 9 × Sids 1 18.39 91.86 -91.61 16.0 2.10 98.14 -95.81 60.0
Misr 1 × Sids 1 4.48 93.33 -73.84 39.3 3.70 81.41 -69.51 39.3
Gemmeiza × Misr 1 2.85 99.27 -97.53 74.0 6.10 85.32 -84.62 44.0
Gemmeiza 9 × Sids 12 5.14 99.90 -98.93 62.7 1.54 95.52 -92.41 70.7
The best crosses based on the
selected plants were Sids 12 × Misr 1 (17 plants with 11.33%), Sids 12 × Sids 1 (15 plants with 10%), Sids 12 × Sham 4 (14 plants with 9.33 %), Gemmeiza 9 × Sids 1 (11 plants with 7.33%), Misr 1 × Sids 1 (11 with 7.33%), Gemmeiza 9 × Misr 1 (nine plants with 6%) and Gemmeiza 9 × Sids 12 (eight plants with 5.33%). On
the other hand, the cross Sids 1 × Sham 4 did not have any plants resistant to leaf and stem rusts, with favorable height and higher than the highest parent in grain yield. These results were so far in agreement with those obtained from the previous part and these results were summarized in Table 13. In this respect, Ragab (2010) used the mean performances of

INHERITANCE OF SOME AGRONOMIC CHARACTERS IN FIFTEEN F2 WHEAT POPULATIONS
27
resistance to leaf rust disease and grain yield per plant together and establish selection index and found that Gemmeiza 9 was one of the highest parents in mean values of both traits.
REFERENCES
Abd El-Rahman, M.E. (2013). Estimation
of some genetic parameters through generation mean analysis in three bread wheat crosses. Alex.J.Agric.Res, 58(3), 183-195.
Abdelaal, A.A., Kh., Omara, I., Reda, Hafez, M.Y., Samar, M., Esmail & EL Sabagh, A. (2017). Anatomical, biochemical and physiological changes in some Egyptian wheat cultivars inoculated with Puccinia gramini f. tritici f. sp. tritici f. sp. tritici. Fresen.Environ.Bull., 27 (1): 296-305.
Acquaah, G. (2012). Principles of plant genetics and breeding. 2nd ed. John Wiley & Sons.
Ali, O.I.M. (2017). Durable resistance to leaf rust in some Egyptian wheat cultivars. Ph.D., Faculty of Agric., Cairo Univ.
Akhtera, M.M., EL Sabagh, A., Alama, M.N., Hasand, M.K., Hafez E., Barutçular, C. & Islam, M.S (2017). Determination of seed rate of wheat (Triticum aestivum L.) varieties with varying seed size. Sc.J. Crop Sci., 6(3): 161-167.
Barutçular, C., Yıldırım, M., Koç, M., Akıncı, C.,Tanrıkulu, A., EL Sabagh, A.,Saneoka, H.,Ueda, A.,Islam, MS., Toptas, I., Albayrak, O. & Tanrikulu, A. (2016a). Quality traits performance of bread wheat genotypes under drought and heat stress conditions. Fresen. Environ.Bull., 25(12a): 6159-6165.
Barutçular, C., Yıldırım, M., Koç, M., Akıncı, C., Toptaş, I., Albayrak, O., Tanrıkulu, A. & EL Sabagh, A. (2016b). Evaluation of SPAD
chlorophyll in spring wheat genotypes under different environments. Fresen.Environ.Bull., 25(4):1258-1266.
Barutçular, C., EL Sabagh, A., Koç, M. & Ratnasekera, D. (2017). Relationships between grain yield and physiological traits of durum wheat varieties under drought and high temperature stress in mediterranean conditions. Fresen.Environ.Bull., 26 (6), 4282-4291.
Cruz, C.D., Regazzi, A.J & Carneiro, P.C.S. (2012). Modelos biométricos aplicadosao melhoramento genético. 4th ed. UFV, Viçosa.
Cruz, C.D. (2013). Programa genes: aplicativo computacional em genética e estatística, Versão Windows, 2013. UFV, Viçosa, MG.
Draz, I.S., Abou-Elseoud, M.S., Kamara, A.E.M., Alaa-Eldein, A.E.A. & El-Bebany, A.F. (2015). Screening of wheat genotypes for leaf rust resistance along with grain yield. AOAS, 60(1), 29-39. doi.org/10.1016/j.aoas.2015.01.001.
El-Sayed, O.A. (2015). Further studies on stem rust disease of wheat in Egypt. Ph. D., Faculty of Agriculture, Mansoura Univ, Egypt.
FAO (2016). Rust-Stem: Ug99 (Race TTKSK). Wheat Rust Disease Global Programme, FAO, AGP Division, Room C797, Viale delle Terme di Caracalla, 00153, Rome, Italy. Available in online: http://www.fao.org/agriculture/crops/rust/stem/rust-report/stem-ug99racettksk/en/
Hermas, G.A. & El-Sawi, S.A. (2015). Inheritance of stem rust Resistance and some yield components in crosses from five Egyptian wheat cultivars. Egypt.J. Plant Breeding, 19(1): 71-87.
Hussain, F., Ashraf, M., Hameed, A.M., Hussain, N. & Sial, R.A. (2011). Genetic studies in wheat for leaf rust resistance (Puccinia recondita). African J.Bio., 10(16): 3051-3054.

M.A.H. DARWISH, W.Z. E FARHAT, AYMAN EL SABAGH
28
Moaveni, P. (2011). Effect of water deficit stress on some physiological traits of wheat (Triticum aestivum). Agric.Sci.Res.J.,1: 64-68.
Najeeb, K.M.A. (2015). Studies on some Puccinia triticina genes in selected Egyptian wheat cultivars. M.Sc., Faculty of Agric., Cairo Univ.
Ragab, K.E.I. (2010). Breeding and genetical studies on resistance to leaf rust disease in wheat. Ph.D. Thesis, Faculty of Agriculture, Menoufia Univ., Egypt
Stakman, E.C., Stewart, D.M & Loegering, W.Q. (1962). Identification of physiologic races of Puccinia graminis var. Tritici. ARsS, USDA., Agr.Res.Serv.Bull., E6/7, 53 pp.
Steel, R.G.D & Torrie, T.H. (1960). Principles and procedures of statistics. McGrow Hill, N.Y., U.S.A.
Stubbs, R.W., Prescott, J.M., Saari, E.E. & Dubin, H.J. (1986). Cereal disease methodology manual. Centrol International de Majormiento
de Maiz Y Trigo (CIMMYT). Mexico, pp. 222.
Youssef, I.A.M., Ramadan, R.A & Hamada, M.S. (2012). Genetics of leaf rust resistance in eleven crosses derived from two low resistant and eight high rust severity Egyptian wheat cultivars at seedling and adult plant stages. Mansoura Univ., 3 (8): 219-232.
Youssif, A.W.A. (2016). Studies on leaf rust disease on wheat and methods of its control. M.Sc., Faculty of Agric., Mansoura Univ.
Varga, B., Svecnjak, Z. & Pospisi, A. (2002). Grain yield and yield components of winter wheat grown in two management systems. Die Bodenkultur, 51(3): 145-150.
Zaazaa, E.I., Hager, M.A & El-Hashash, E.F. (2012). Genetical analysis of some quantitative traits in wheat using six parameters genetic model. American-Eurasian J.Agric.Environ. Sci., 12 (4): 456-462.