Inglewood Shire Handbook
112
INGLEWOOD SHIRE HANDBOOK An Inventory of the Agricultural Resources and Production of Inglewood Shire, Queensland Queensland Department of Primary Industries November 1977
Transcript of Inglewood Shire Handbook

INGLEWOOD SHIRE
HANDBOOK
An Inventory of the Agricultural Resources
and Production of Inglewood Shire, Queensland
Queensland Department of Primary Industries
November 1977

INGLEWOOD SHIRE HANDBOOK
An Inventory of the Agricultural Resourcesand Production of Ingle wood Shire, Queensland
Compiled by: G. H. Malcolmson, District Adviser, Inglewood.
Edited by: P. L. Lloyd, Extenson Officer, Brisbane.
Published by: Queensland Department of Primary Industries.
November 1977

FOREWORD
The Shire Handbook was conceived in the mid-1960s. A limited number of a serieswas printed for use by officers of the Department of Primary Industries to assist them intheir planning of research and extension programmes.
The Handbooks created wide interest and, in response to public demand, it wasdecided to publish progressively a new updated series.
This volume is one of the new series.
Shire Handbooks review, in some detail, the environmental and natural resourceswhich affect farm production and people in the particular Shire. Climate, geology,topography, water resources, soils and vegetation are described.
Farming systems are discussed, animal and crop production reviewed and yieldsand turnoff quantified. The economics of component industries are studied.
The text is supported liberally by maps and statistical tables.
Shire Handbooks provide important reference material for all concerned with ruralindustries and rural Queensland.
* They serve as a guide to farmers and graziers, bankers, stock and station
agents and those in agricultural business.
* Provide essential information for regional planners, developers and
environmental impact students.
* Are a very useful reference for teachers at all levels of education and
deserve a place in most libraries.
I commend this series to students of agriculture and all whose business isassociated with the land and rural people.
(V.B. Sullivan)Minister for Primary
Industries

11
CONTENTS
Page
1. INTRODUCTION
1.1 Introduction 1
1.2 Early Exploration and Settlement 1
1.3 Topography 3
1.4 Geology 4
2. CLIMATE
2.1 General 6
2.2 Rainfall 6
2.3 Temperature 7
2. A Humidity 8
2.5 Cloudiness and Sunshine Hours 9
2.6 Evaporation 11
2.7 Floods 11
2.8 Climate in Relation to Agriculture 12
3. WATER RESOURCES AND IRRIGATION
3.1 General 14
3.2 Surface Supplies 14
3.3 Underground Supplies 19
3.4 Irrigation 20
3.5 Future Irrigation Development 23
4. SOILS
4.1 Introduction 25
4.2 Major Groups of Soils 25
4.3 Soil Conservation 31
4.4 Areas Available for Future Development 34
5. VEGETATION AND FAUNA
5.1 Introduction 36
5.2 Vegetation Associations 36
5.3 Poisonous Plants 39
5.4 Fauna 39
6. FARMING SYSTEMS AND PRACTICES
6.1 Land Tenure 41
6.2 Land Valuation 41
6.3 History of Tobacco Production in Inglewood Shire 41
6.4 Farming Systems 43

Ill
Contents (Cont.)
Page
7. CROP PASTURE AMD ANIMAL PERFORMANCE
51
60
62
66
68
71
72
73
8.
9.
10.
7.1
7.2
7.3
7.A
7.5
7.6
7.7
7.8
Agricultural Crops
Horticultural Crops
Pastures
Heeds of Crop and Pasture
Beef Cattle
Sheep
Pigs
Beekeeping
REGISTER OF RESEARCH PROJECTS
8.1
8.2
8.3
8.4
8.5
OTHER
9.1
9.2
OTHER
Inglewood Field Station
Department of Primary Industries
C.S.I.R.O.
Lands Department
Forestry Department
PRIMARY INDUSTRIES
Forestry
Mining
SHIRE STATISTICS AND GENERAL INFORMATION
76
76
78
78
78
79
79
10.1 Other Rural Industry Statistics 81
10.2 Demography Statistics 82
10.3 State Government Services to Primary Producers 82
11 . ECONOMICS
11.1 Introduct ion 84
11.2 Agr icu l tura l Crops 85
11.3 Hor t i cu l tura l Crops 91
11.4 Sheep 92
11.51 Beef C a t t l e 94
12. REFERENCES AND FURTHER READING 100
ACKNOWLEDGEMENTS 103

iv
LIST OF TABLES
Table No. Page
1.1 Elevation of Towns and Localities 4
2.1 Rainfall Recording Stations in Inglewood Shire 6
2.2 Average Monthly and Annual Rainfall for Stations in Inglewood Shire 7
2.3 Temperatures - Texas Post Office 9
2.4 Temperature Frequencies - Texas Post Office 9
2.5 Temperatures - Inglewood Field Station 10
2.6 Temperature and Humidity - Texas Post Office 10
2.7 Mean Daily Sunshine Hours - Inglewood Field Station 10
2.8 Evaporation - Inglewood Field Station 11
2.9 Flood Frequencies - Texas and Inglewood 11
2.10 Peak Flood Heights - Texas and Inglewood 12
2.11 Rainfall Distribution in Relation to Winter Cereal Production 13
3.1 Details of Weirs on Mac in tyre Brook 14
3.2 Details of Storage Sites on Macintyre Brook 15
3.3 Coolmunda Dam Specifications 16
3.4 Details of Weirs on Dumaresq River 18
3.5 Glenlyon Dan Specifications 18
3.6 Water Quality Data - Border River and Tributaries 19
3.7 Area Crops Grown Under Irrigation 1970-71 and 1975-76 20
3.8 Water Allocation and use Coolmunda Dam 21
3.9 Irrigation on Rural Holdings - Inglewood Shire . 23
4.1 Land Capability Divisions and Classes 33
6.1 Land Valuations - Inglewood Shire 41
6.2 Tobacco Production - South-West Queensland 44
6.3 Inglewood Shire - Rural Holdings Classified to Principal Activity 45
6.4 Inglewood Shire - Major Activit ies on Rural Holdings 1975-76 46
6.5 Inglewood Shire - Agricultural Establishments Classified 47According to Industry Class 1975-76
6.6 Inglewood Shire - Rural Holdings Classified According to Size of 48Sheep Flock and Size of Meat Cattle Herd
6.7 Inglewood Shire - Rural Holdings Classified According to Area of 49Holding and Size of Sheep Flock
6.8 Inglewood Shire - Rural Holdings Classified to Size of Holding 49and Size of Meat Cattle Herd
7.1 Inglewood Shire - Wheat Production 52
7.2 Inglewood Shire - Barley Production 53
7.3 Inglewood Field Station - Barley Variety Trials 53
7.4 Inglewood Shite - Grain Sorghum Production 54
7.5 • Inglewood Shire - Sunflower Production 55
7.6 Inglewood Shire - Navy Bean Production 55
7.7 Inglewood Field Station - Navy Bean Variety Trials 56
7.8 Inglewood Field Station - Irrigation of Navy Bean Trials 56

V
List of Tables (Cont.)
Table No. Page
7.9 Inglewood Shire - Soybean Production 5 7
7.10 Inglewood Field Station - Soybean Variety Trials 57
7.11 Inglewood Shire - Tobacco Production 58
7.12 Inglewood Shire - Hay and Green Fodder Production 59
7.13 Stanthorpe Shire - Winter Fodder Crops Trials 607.14 Inglewood Shire - Area and Production Figures for Tree Fruit 62
Crops Grown During the 1975-76 Season
7.15 Inglewood Shire - Estimated Area and Production Figures for 62Grapes Grown During the 1975-76 Season
7.16 Inglewood Shire - Area and Production Figures for Vegetables 62Grown During the 1975-76 Season
7.17 Inglewood Shire - Sown Pastures Area and Production 66
7.18 Inglewood Shire - Beef Cattle Numbers 68
7.19 Inglewood Shire - Breeds of Beef Cattle on Rural Holdings 69
7.20 Dumaresq River - Type of Fat Cattle Turned Off 69
7.21 Inglewood Shire - Sheep Numbers and Wool Production 71
7.22 Inglewood Shire - Lambing Percentages 71
7.23 Inglewood Shire - Pig Production 73
7.24 Inglewood Shire - Useful Honey Flora • 74
9.1 Inglewood Shire - Forestry Reserves 79
9.2 Inglewood Shire - Timber Milled 80
10.1 Inglewood Shire - Area and Production of Major Crops 81
10.2 Inglewood Shire - Application of Arti f ic ial Ferti l izer to Crop 821975-76
10.3 Inglewood Shire - Population Trends 82
11.1 Inglewood Shire - Estimated Gross Value of Rural Production 84
11.2 Gross Margins for Irrigated Crops • 87
11.3 Gross Margins for Dryland Crops 88
11.4 Gross Margins - Apricots . 92
11.5 Gross Margins - Grapes 92
MAPS
MAP 1 Climate and Water Resources
MAP 2 Vegetation
MAP 3 Land Use
MAP 4 Soils
MAP 5 Land Capability

1 . INTRODUCTION
1.1 INTRODUCTION
The Shire of Inglevood is situated on the southern border of Queensland, and l iesbetween 28°15'S and 29°15'S latitude and the 150°45' and 151°45' longitude. The town ofInglewood is 260 km south-vest fron Brisbane. A locality map of the Shire i s included onHap 5.
The area of the Shire is 5850 km2, of which approximately 5 percent is devoted tocrops and sown pastures. The remainder is native pasture grazing country (76 percent)running both sheep and cattle, and State Forest Reserves (19 percent), where grazing i srestricted to cattle only.
Agriculture, wool growing and beef breeding are the major industries of InglewoodShire. Other Important industries are timber getting and milling and beekeeping. MiningIs also undertaken on a small scale. The 'Shire i s not well endowed with natural resourceshowever, with the increased supply of stored water from the Glenlyon Dam, the comparativelycheap non-tobacco-quota land, and relative closeness to Brisbane, the Shire is well suitedto expansion in areas such as horticultural and specialized field .crops.
1.2 EARLY EXPLORATION AND SETTLEMENT
Amongst the foremost of Australia's explorers was Allan Cunningham, whose mostImportant journey began at Segenhoe, the distant outpost.on the Upper Hunter River and nearthe present town of Scone, on 30 April 1827. With the backing of the new Govenor of NewSouth Wales, Ralph Darling, who was interested in the potential for. settlement of theinland area fcetween Bathurst and southern Queensland, Cunningham, with six men and elevenhorses, journeyed northward. ~
After many discoveries, he was forced, because of the arid conditions of thedrought sticken land, to turn more to the east. This led to his greatest discovery - thefamous Darling Downs.
'He appears to have crossed the Dumaresq River (or Severn), near Beebo; then heswung a little east of Inglewood past Coolmunda, and just touched Bodumba Creek at itssouth-eastern corner. Continuing in a direction roughly parallel to the present railwayline, he passed a little south of Durakai and Thane. From an elevated ridge near Thane'sCreek, on June 1827, he got a glimpse of the Downs, which he named in honour of GovernorDarling, and a few hours later, he camped on the bank of the Condamine, near southToolburra.'1
Cunningham actually named only a narrow valley along Glengallan Creek about 29.kilometres long and three to five kilometres wide. Today, Darling Downs includes a districtof over 64 750 km2 stretching from the New South Vales border to the Bunya Mountains, andvest to Miles and Talwpod.
One important and relevant geographical feature in the area is the MacintyreBrook, which rises in the hills near Gore, about 60 kilometres east of Inglewood, and joinsthe Dumaresq River opposite Yelarbon, when then becomes the Macintyre River at Goondiwindi.It was named by Cunningham, after his friend at Segenhoe.
It was 13 years after Cunningham's return to Segenhoe with his valuable report tothe Governor, and two years preceding official free settlement in Queensland, before anysettlers moved to occupy the rich fertile flats of the Downs.
The first of these was Patrick Leslie, who made a reconnaissance with a convict,Peter Murphy, in 1840. Leslie followed Cunningham's tracks until he reached Catfish Creek,and then took a northerly direction, instead of Cunningham's north-easterly. Leslie cameout at Sawpit Gully, about 400 metres from Deep Gully, crossed the Macintyre Brook andcamped at Leslie's Flat, which was selected by Henry Slack Sar, in 1889.
As the route via Pikes Creek was too rough for his. stock and drays, Leslie .returned for his main party by a route roughly1 approximating that of Cunningham's outward
1 Centennial of Inglewood - P.M.G. Historical Society 1972
.2.
journey. He crossed Canal Creek, Mosquito Creek, Canning Creek, and Macintyre Brook nearInglewood, from there making l:o Brush Creek and the Severn River (Dusaresq) and back toFalconer's Plains.
However, the party did not settle near Inglewood, but fi&sily ac Toolburra, on2 July 1840. This was the first permanent pastoral settlement in what Is new the State ofQueensland. George and Walter Leslie later settled at Canning Downs, about sevenkilometres from Warwick.
Henry Slack, who married Catherine Earl Freestone on IS May 1859, is reputed tobe one of the first settlers In the Inglewood area. Their eldest son, Joseph, later tobecome the first Chairman of the Inglewood Shire Council, was the first white child born atTnglewood.
Official records indicate the Whetstone Consolidated Run, consisting of theParishes Whetstone, Swithland, Eena and Moogoon East, was leased to an unknown personbefore 1847. Whetstone was leased by William Dumaresq in 1847, and it is thought his wifeheld Swithland the same year.
. Alexander Campbell was lessee in 1851, while the valuation dated 5 February 1851was made by Robert Abercrambie, and is No. 11 in the Land Commissioner's Record Book.
Philip Devine leased Whetstone Consolidated Run in 1858, although gravestonesshow his parents Charles Edward Devine who died on 10 March 1853, and Sarah ElizabethDevine on 24 March 1853, were there much earlier.
Surveys, in the early days, were non-existent, a leaseholder taking watersheds asboundaries. For instance, Warroo, which was selected in 1842 by Frederick Bracker, had thechoice of the watershed of what; is now known as the Brook, or Bracker Creek. He choseBracker Creek, giving him an jirea of 12 000 hectares. He arrived with his wife and infantson in 1848, and built a homestead. Fred Bracker is credited, prior to going to Warroo,with the growing of the first wheat, lucerne and maize on the Downs, and of making thefirst flour mill driven by horse-power. The flour mill was brought to Warroo and thestation was self supporting, except for sugar, in its early days.
Amongst other historic stations founded in the 1840 to 1850 period, wereCoolmunda, Bodumba, Glenelg, Brush Creek and Terrica holdings.
The proclamation of Queensland as a State in 1859, and the consequent Lands Actof 1860 resulted in the subdivision of many of these holdings. However, even at the turnof the century, Whetstone Run still consisted of more than 120 000 hectares.
Wool growing was the primary enterprise, although cattle numbers increased afterI860.
The first commercial settlement at Inglewood was called Brown's Inn, and wassituated on the Leyburn Road, close to the junction of Macintyre Brook and Canning orMosquito Creek. This was on the teamsters route to Leyburn, with a toll gate at CanalCreek. The toll was for repairs to the road.
The first survey of the town began on 15 April 1862, by L.F. Landberg, and a saleof lots was held at Warwick on 26 January 1865, of Lots 62 to 65, Portions 19 to 22, Parishof Inglewood, County Marsh, Darling Downs. These blocks were purchased by WilliamSutherland, and his descendants held the land for many years.
On 13 October 1862, Catherine Brown the proprietress of Brown's Inn boughtallotments 1 to 5 of Section 1, and built the Royal Hotel. Other buyers were originalsettlers including Meiers, Evans, Freestone, Dowling, Smith, Lovell, Sutherland andTumbull families.
When the town was surveyed, the-name Brown's Inn was changed to Inglewood. Thename was derived from Ingol, an aboriginal word for cypress pine, as a clump of these pinesgrew on the northern bank of the Macintyre Brook.
A move to change the name in 1906 met with strong opposition from local residents.The railway Department began to build a line to Inglewood in that year, and named the

.3.
station Parainga, but angry inhabitants pulled down the name sign, and insisted on the nameof their choice. Eventually, the Railway Department complied with their wishes.
The local authority of Inglewood was proclaimed on 11 November 1879, with thetown of Inglewood its headquarters.
The- town of Texas was gazetted in 1875. The land was originally part of theTexas Station run. Sales of land were held in Stanthorpe in 1880, 1881 and 1883, but noland was sold. The first town lots sold were sold at Inglewood on 25 June 1889, In 1901the population of Texas was 203. Texas was linked to Inglewood by rail on 3 November 1930.
Texas is divided into two parts. The older part of town is a low-lying area onthe banks of the Dumaresq River and is known as Texas Flat.- This area was flooded in 1890and most of the inhabitants moved to a high ridge away from the river Where the main townof Texas now stands.
Texas Station homestead lies about two kilometres away from the town. The firstowners were Andrew R. and John F. Macdougall who lodged a lease claim on 13 February 1851.It appears however, that they had occupied the run from at least 1848.
In 1901 a State Tobacco Experiment Farm was established on a leased portion ofTexas Station about five kilometres from Texas. This farm was operated for a short periodby the first tobacco experimentalist appointed to the then Department of Agriculture,Mr. R.S. Neville. In 1953 a Tobacco Experiment Farm was established at Whetstone (seeSection 8).
With the subdivision into farms, dairying gradually became an important industrywithin the Shire. A private cheese factory at Oman-ama, and later factories at Yelarbonand Texas were associated with this early development. The first butter factory was builtin Goondiwindi, and cream was railed from the Shire to this factory. The cheese factory atTexas was converted to a butter factory in the 1930s. It closed down in 1955. TheInglewood butter factory, opened in 1941, was closed down in September 1960, due to thedecline in production.
Tobacco has been grown in the area for more than (10 years. (A complete historyof tobacco growing in Inglewood Shire is given in Section 6.3.) In the early daysvarieties producing leaf for air curing were grown, mainly around Texas. With the changein consumer demands from pipe tobacco to cigarette tobacco, the industry declined, but itrevived in the 1930s partly because of introduction of varieties producing leaf suitablefor flue curing and the manufacture of tobacco suitable for cigarettes, but principally asthe direct result of the development of irrigation schemes. The incidence and intensity ofsummer rains was far too erratic to afford any reliability of production. Consequently,only those farms adjacent to the main streams had any access to irrigation and persisted.
The acreage planted to tobacco has varied considerably, with 426 hectares beinggrown in 1943-44, 218 hectares in 1948-49, to the record 972 hectares harvested from the1960-61 crop. The crash in prices in 1961 resulted in an exodus of sharefarmers from thedistrict and a severe reduction in area. The industry stabilized after 1965 following theintroduction of an Australia-wide quota system.
The invasion of prickly pear early this century, particularly oh the brigalow-belah soils, restricted agricultural development, and it was not until the release of theCactoblastis in the late 1920s, that the potential of this country could be realized.Records indicate that the pear was planted on properties as a means of subdivision shortlyafter settlement first occurred in the 1850s.
Rabbits have been, and still are, a significant economic problem to the grazingindustry of the Shire. Their numbers increased in the 1920s until by the early 1930s theyhad reached plague proportions. Numbers have been cut back by the use of myxomatosis, and,more recently, the poison '1080'.
1.3 TOPOGRAPHY
The Shire boundary to the south is the Dumaresq River, which also acts as theborder between Queensland and New South Wales. This river becomes the Macintyre atGoondiwindi, the Barwon near Mungindi and eventually the Darling.

.4 .
The eastern boundary of the Shire runs through the traprock area, which comprise*the Maclotyre Brook watershed, to the Berries Range, and then swings west, cutting theInglewood-Millmerran road. From there, it runs south-west to near Yelarbon, and thejunction of Macintyre Brook with the Duaaresq River.
The Shire is relatively flat, with snail undulations becoming steeper towards theeastern traprock area. The elevations of the towns and localities in the Shire incomparison to centres aearby, are shown in Table 1.1
Hacintyre Brook is the drainage line for the northern half of the Shire, andflows into the Dumaresq, which drains the remainder of the Shire, near Yelarbon. TheDumaresq then becomes the Hacintyre River.
Table 1.1
Elevation of Towns and Localities(m)
InglewoodTexasOman-amaWhetstoneGoondlvindiWarwickStanthorpeCobba-da-manaYelarbon
284284331265218455809314245
Source: Queensland RailwaysTimetable 1977
1.4 GEOLOGY
' The principal formations in the Shire are as follows:
The Palaeozoic Basement
This occurs on the eastern portion of the Shire and is continuous with theextensive massif of Palaeozoics that occurs near Warwick and Stanthorpe. There are chertsand silicified mudstones with limestone lens near Limevale and a small area of granodioritenear Texas.
The Mesozoie Sequences
The Bundamba Group appear to rest unconformably on the Palaeozoic basementparticularly in the vicinity of Cobba-da-mana Where they may be traced in a south-westdirection almost to the border, with the irregular eastern margin resting unconformably onthe old basement rock.
The Walloon Coal Measures rest directly on the Bundamba Group or the Palaeozoicbasement as th is variation is shown by the lack of conformity in the area. At Cobba-da-mana the basement is the Bundamba group, whereas on the Dumaresq River near Texas, theyrest on Palaeozoic basement material. They can be best seen to the east of Inglewoodextending as far as the Bundamba margin at Cobba-da-mana}
Other Walloon developments occur between Texas and Brush Creek on the DumaresqRiver, particularly around Smithfield as is indicated by the undulating clay soils. Thefew outcrops near Borella are brown and pale yellow to almost white sandy mudstones thathave been weakly lateritized in parts. The characteristic landscape of this formation iscovered by grey clay soi ls but it is likely that some of these areas may not be derivedin situ from the Walloon Coal Measures, but are a later Quaternary development as is foundaround Coolmunda.
The Blythesdale Group is characterized by stony lateritized sandstone ridges,deep sandy cypress and black pine forest areas, and light coloured shallow solonized soilscarrying bull oak, which covers much of the central and northern'sections of the Shire.Sandstones dominate the sequence but shales and sandy mudstones also appear to be fairlycommon.

. 5 .
Cainozoio Developments
Post laterite and- recent deposits occur around Yelarbon as i s shown by a lowridge north-east of Yelarbon which i s composed of conglomerate and coarse g r i t s . This i sthought to underlie the Yelarbon 'desert' as shallow wells In the town penetrate waterbearing gravels while to the north of Yelarbon near the margin of the desert, an earth tankhas exposed white, fa ir ly coarse, weakly cemented sandstone and gr i t s .
Recent Alluvium
These are associated with functional streams and areas subject to frequentflooding and occur on both the Dumaresq River and the Macintyre Brook.
Sources of Information
1. P.H.G. Historical Society (1972) - Centennial of Inglewood
2. Isbel l , R.F. (1957) - The Soils of the Inglewood-Talwood-Tara-Glenmorgan Region,Queensland. Queensland Bureau of Investigation Technical Bulletin Wo. 5
3. Lucas, K.G. (1960) - in Hi l l , D. and Deranead, A.K. (ed) - The Geology of Queensland.Geological Society of Australia Vol. 7
A. Anon. (1901) - Tropical Industries. Tobacco growing at: Texas. Queensland AgriculturalJournal. Nov. 1901 : 485-6

.6.
2. CLIMATE
2.1 GENERAL
Inglewood Shire experiences a temperate climate with hot summers and cold winters.At Inglewood, which has an elevation of 284 metres, daily temperatures range from 18°C to32°C in summer and 4°C to 18°C in winter when frosts are common. Over 65 percent of theannual rainfall of 630 mm falls between October and March. An appreciable rainfall (100 mm)is received in winter and can be followed by thunderstorms between September and November.Thunderstorms occur also in December, January and February, some with devastating intensity.
There are two climate recording stations in the Shire. One is located at thePost Office, Texas, and the other is on the Department of Primary Industries' InglewoodField Station at Whetstone, approximately 15 kilometres west of Inglewood. The Shire iswell endowed with rainfall recording stations, and these are listed in Table 2.1. Thelocations of climate and rainfall recording stations are shown in Map 1.
Table 2.1
Rainfall Recording Stations in Inglewood Shire
cmNumber
041009041034041047041048041064041066041078041087041100041101041122041125041151041164041340041341041347041375041376041377041382041383041384041385
Station Name
ByberaGlenelgInglewood Post OfficeInglewood Forestry ReserveLimevale Post OfficeMaidenheadOman-amaRiverton NorthTexas Post OfficeTexas StationYelarbonWhetstoneSilverspurBadgery Forestry StationInglewood ForestryInglewood Field StationRiver ViewColumbaWarroo LagoonsTummeraineRivertonMingoolaLesbrookWhetstone Weir
Elevation
(ifavailable)(m)
284
331346285274238265
335
YearOpened
193118901883194019211922191219501881188719231940190319651968196819691939190919361919188919111898
YearClosed
19491948
19641942
1954195319661955
Period ofRecord to1974(Years)
43849134532732249387512440966535653835645557
Source: Bureau of Meteorology - Catalogue of Australian Rainfall and Evaporation Data,1972 (and unpublished data)
2.2 RAINFALL
Long term records of rainfall are available for several locations in the Shire.The average monthly and annual rainfall for al l stations in the Shire with more than 30years records is shown in Table 2.2
The average annual rainfall for the Shire is about 625 mm with variations of onlyabout 25 mm above and below that figure in different parts of the Shire.
During summer, the dominant rain producing influence is the north-easterly tosouth-easterly airflow which introduces moist unstable maritime air from the Pafific Oceanor the Tasman sea. This rainfall declines considerably with distance inland. Other summer

.7.
influences are essentially random in their occurrence and come in the form of thunderstormsand degenerated tropical cyclones.
In winter, the northward movement of the western systems produces airflowspredominantly from the south-west to the south-east quadrant. The main influences in thisseason are the generally regular pattern of cold fronts which move across the regionresulting in instability and moderate rainfalls on the plains country to heavy falls in theupland country to the east of the Shire.
Table 2.2
Average Monthly and Annual Rainfall for Stations in InglewoodShire Based on all Years of Record to 1974
(mm)(All stations
Station
ByberaColumbaGlenelg
Inglewood ForestryInglewood Post OfficeLesbrook1
Limevale Post OfficeMingoola 1
Oman-ama'Riverton1
Silverspur *Texas Post OfficesTexas StationTummeraineWarroo LagoonsWhetstone Weir]
Yelarbon
Jan
8597869686768492737675878786776676
Feb
6873698473657264547453746973696074
with
Mar
5152565060524951455154545352505248
more
Apr
2932373532283126322732323429352731
than
May
3228373640303736293331373831353230
30 years
Jun
3743473844434049504545444438454236
Jul
3534443442393946394745434135424034-
record)
Aug
3337383834283338293337353538353335
Sep
35 :37433941333647334538404036393831
oat
6068636957516161497150585866604858
Nav
6267645766606564666554636160665855
Dec
9882839181738676767374787985866377
Year
624651663669656579638642553641589645643630637558585
Source: Bureau of Meteorology (unpublished data)1 Station ceased recording (see Table 2.1)
The pattern of summer rainfall in the Shire shows a distinct westward declinewhile the pattern of winter rainfall is generally associated with elevation with theexception of an isolated area around Inglewood which experiences a slightly higher winterrainfall.
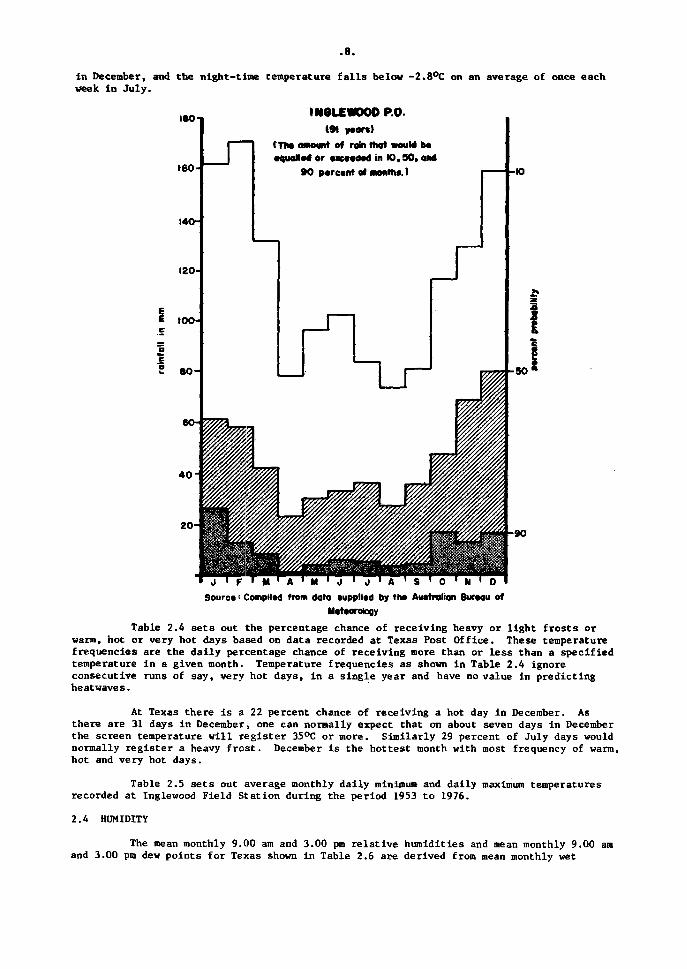
The monthly expectations of receiving a certain amount of rain are important toagricultural activity. The following graph shows the amount of rainfall which would beexpected to be equalled or exceeded in 10, 50 and 90 percent of years at Inglewood.PostOffice, based on 91 years of record. For example, in June the rainfall could be expectedto equal or exceed 6 mm in nine out of 10 years, 33 mm in five out of 10 years, and 102 mmin one out of 10 years.
2.3 TEMPERATURE
Temperatures in the Shire are recorded at Texas Post Office and Inglewood FieldStation. Table 2.3 sets out the average monthly daily minimum and daily maximumtemperatures recorded at Texas Post Office.
The percentiles in Table 2.3 are used to show the spread of temperature throughoutthe month. The 14 percentile of the maximum is that temperature which was not reached on14 percent of days, or one day per week. The 86 percentile is that higher temperature whichwas not reached on 86 percent of days on six days per week, having being equalled orexceeded on the other one day in the week. In the case of minimum temperatures, the over-night temperature falls below the 14 percentile on an average of once per week and remainsabove the 86 percentile on an average of once per week.
In Texas the daytime temperature exceeds 36.1°C on an average of once each week
. 8 .
In December, and the night-time temperature f a l l s below -2.8°C on an average of once eachweek in July.
Table 2.4 sets out the percentage chance of receiving heavy or light frosts orwarm, hot or very hot days based on data recorded at Texas Post Office. These temperaturefrequencies are the daily percentage chance of receiving more than or less than a specifiedtemperature in a given month. Temperature frequencies as shown in Table 2.4 ignoreconsecutive runs of say, very hot days, in a single year and have no value in predictingheatwaves.
At Texas there i s a 22 percent chance of receiving a hot day in December. Asthere are 31 days In December, one can normally expect that on about seven days in Decemberthe screen temperature wil l register 35°C or more. Similarly 29 percent of July days wouldnormally register a heavy frost . December i s the hottest month with most frequency of warm,hot and very hot days.
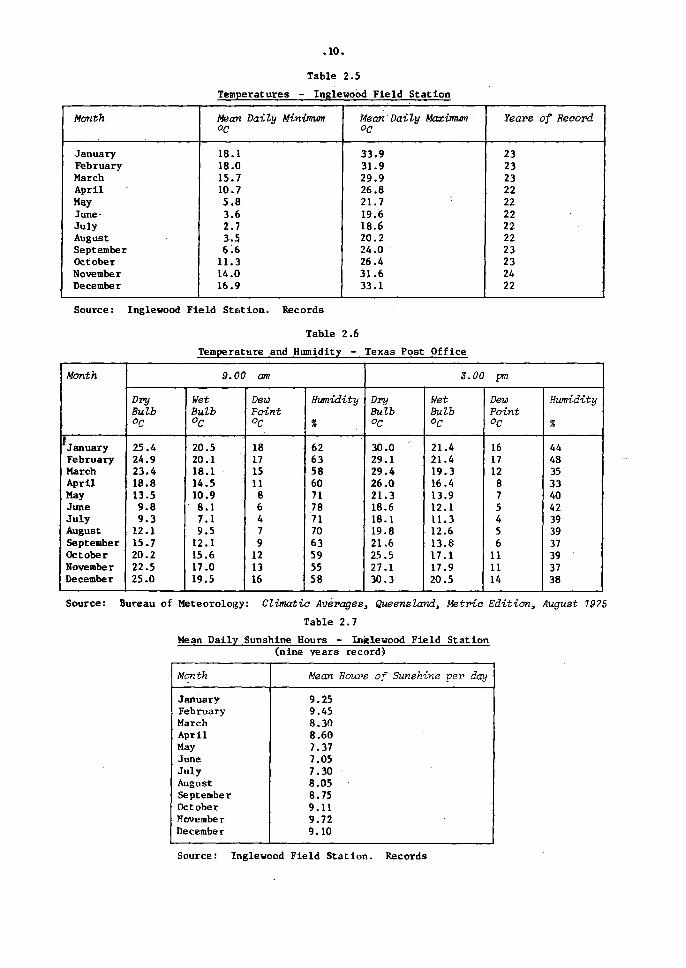
Table 2.5 sets out average monthly daily minimum and daily maximum temperaturesrecorded at Inglewood Field Station during the period 1953 to 1976.
2.4 HUMIDITY
The mean monthly 9.00 am and 3.00 pm relative humidities and mean monthly 9.00 amand 3.00 pm dew points for Texas shown in Table 2.6 are derived from mean monthly wet

.9 .
Table 2.3
Temperature* - Texas Post Office
Month
JanuaryFebruaryMarchAprilMayJuneJulyAugustSeptemberOctoberNovemberDecember
Year
Daily Minimum
Mean
17.718.115.010.36.34.02.95.57.8
11.913.617.3
10.9
Percentile
86
20.721.818.513.«10.67.78.7
11.212.915.917A20.5
14
14.014.912.26.02.30.1
-2.80.92.86.9
10.013.8
Daily Maximum
Mean
••31.530.731.027.222.319.619.120.722.826.928.331.7
26.0
Percentile
86
35.133.934.029.525.422.322.323.827.829.931.536.1
- 14
28.827.918.724.818.416.515.717.517.823.325.227.3
Source: Bureau of Meteorology - Climatic Averages, Queensland, Metric Edition.August 1975
Table 2.4
Temperature Frequencies - Texas Post Office(Percentage chance of temperature not being attained {frosts}
or being equalled or exceeded {hot days})
Month,
JanuaryFebruaryMarchAprilMayJuneJulyAugustSeptemberOctoberNovemberDecember
Based on recordings from
Daily Minimum
Heavy Frost< 0OC
3.915.828.611.52 . 3
Light Frost< 2OC
0 . 811.027.745.926.210.9
1969 to 1974
Daily Maximum
Warm Da»> 30°C
74.670.065.310.30 . 6
2.914.836.377.2
Sot Day> 35°C
15.619.1
7.41.7
1.15.0
21.6
Very Hot Day> 40°C
0 .1
Source: Bureau of Meteorology (unpublished data)
and dry bulb temperatures recorded at Texas Post Office.
The relative humidity is the ratio of the actual amount of water vapour presentin a unit of atmosphere to the quantity that would be present if the air was.saturated atthat temperature. Dew point is the temperature at which the amount of water vapour presentin the atmosphere would be sufficient to produce saturation.
2.5 CLOUDINESS AND SUNSHINE HOURS
Sunshine hours are recorded daily at the Inglewood Field Station,shows average daily sunshine hours experienced at Inglewood, by months.
Table 2.7
.10.
Table 2.5
Temperatures - Inglewood Field Station
Month
JanuaryFebruaryMarchAprilMayJune-JulyAugustSeptemberOctoberNovemberDecember
Mean Daily Minimum°C
18.118.015.710.75.83.62.73.56.611.314.016.9
Mean Daily Maximum°C
33.931.929.926.821.719.618.620.224.026.431.633.1
Years of Record
232323222222222223232422
Source: Inglewood Field Station. Records
Table 2.6
Temperature and Humidity - Texas Post Office
Month
JanuaryFebruaryMarchAprilMayJuneJulyAugustSeptemberOctoberNovemberDecember
9.00 am
DryBulb
°C
25.424.923.418.813.59.89.312.115.720.222.525.0
WetBulb°C
20.520.118.114.510.98.17.19.512.115.617.019.5
DewPoint°C
1817151186479121316
Humidity
%
626358607178717063595558
3.00 pm
DryBulb°C
30.029.129.426.021.318.618.119.821.625.527.130.3
NetBulb°C
21.421.419.316.413.912.111.312.613.817.117.920.5
DewPoint°C
161712875456111114
Humidity
%
444835334042393937393738
Source: Bureau of Meteorology: Climatic Averages, Queensland, Metric Edition, August 1975
Table 2.7
Mean Daily Sunshine Hours - Inglewood Field Station(nine years record)
Month
JanuaryFebruaryMarchAprilMayJuneJulyAugustSeptemberOctoberNovemberDecember
Mean Hours of Sunshine per day
9.259.458.308.607.377.057.308.058.759.119.729.10
Source: Inglewood Field Station. Records

.11.
2.6 EVAPORATION
Losses from a free water surface are recorded at Inglewood Field Station using astandard Class 'A' Pan evaporimeter. Table 2.8 shows average daily evaporation by monthsrecorded at Inglewood Field Station.
Table 2.8
Evaporation - Inglewood Field StationAverage Daily (mm)
(From Standard Class 'A' Pan Evaporinseter)
Month
JanuaryFebruaryMarchAprilMayJuneJulyAugustSeptemberOctoberNovemberDecember
1970
2.42.02.13.43 .44.65 .85 . 8
1971
5 .34.44 .43.62.61.81.72 .33.05 .35 . 36 . 4
1972
S.95.65 .53.62.61.92.52.54.14 .85 .87.7
1973
6.66.06 .24.62.92.11.72.03 .34 .96.06.6
1974
6 . 37.35 .04.12.51.52 .22.83.24.45 .87.0
197S
7.16.84.63.82.91.91.82.53.64.66.46 .8
1976
4.75.04 . 34 . 32.61.21.92.73.54.25 .98 . 2
19??
6.26 .33.63 .42.4
Average
6.05 .95 .04.02.61.82.02.63.44.75 .96.9
Source: Inglewood Field Station. Records
2.7 FLOODS
As much of the intensive agriculture in the Shire is carried out on the alluvialflood plains of the Dumaresq River and the Macintyre Brook, floods have an Importantinfluence on agricultural activity in the Shire. Table 2.9 shows the flood frequenciesrecorded at Texas on the Dumaresq River and at Inglewood on Che Macintyre Brook for yearsup to 1960. Table 2.10 shows the dates of the peak flood heights, and their severity,which have occurred at Texas and Inglewood.
Table 2.9
Flood Frequencies - Texas and Inglewood(The number of times flood height was exceeded)
Month
JanuaryFebruaryMarchAprilMayJuneJulyAugustSeptemberOctoberNovemberDecember
Total
Texas(70 years)
911622
1110
34897
82
Tnglexoood(36 years)
231------11-
8
Source: Bureau of Meteorology: ClimatologicalSurvey Region 6 - Western Downs,Queensland
The data in Table 2.10was taken from Climafcological Survey Region 6 - WesternDowns, Queensland p u b l i s h e d i n November 1 9 6 1 , h o w e v e r , i t h a s b e e n updated t o J u l y 1977 w i t h

.12.
heights adjusted to Australian Standard Flood Heights, the heights of new bridges and theheights of floods since 1960.
Table 2.10
Peak Flood Heights - Texas and Inglewood
Station
Texas
loglewood
Whetstone
Records Camenaec1.
1890
1924
1924
Peak Height
Level
10.1 n>
12.5 n
12.5 m
Date
19 February 1956
22 January 19S6
22 January 1956
Height of Bridges
3 m
6.6 m
3 n
Source: Bureau of Meteorology
The flood of 11 and 12 February 1976, which was caused by the degeneration ofcyclone 'David' and which brought record floods to the Condamine River at Warwick, did notexceed the flood heights shown In Table 2.10. Peak heights of the 1976 flood were ninemetres at Texas on 12 February 1976 and 11.7 metres at Ingle wood on 11 February 1976.
2.8 CLIMATE IN RELATION TO AGRICULTURE
Rainfall is the most important factor Influencing plant growth within the Shireand the incidence and reliability are more Important than the total amount.
The mean and median annual rainfall values for the Shire are 625 mm and 600 mmrespectively with around 36 percent of this falling in the winter months. Whilst theproportion of rainfall is greater during the warmer half of the year a moisture deficit,that is when evapotranspiration exceeds rainfall plus moisture storage, is experienced forabout seven months of the year, November to May inclusive. This is mainly due to highersummer temperatures and the effect on dryland pastures and annual crops can -often result inserious loss of productivity, especially in the traprpck country. The relief and soiltypes (hard setting surfaces with low. infiltration rates) in the traprock are such that theeffectiveness of rainfall received is invariably very low, thus predisposing the area tomore serious drought conditions-
The introduction of pasture species is restricted because of temperatures beingtoo cool for most tropical species and rainfall too low for some major temperate andtropical species. Lucerne and medics are the most generally adaptable pasture species.
Successful grain production is largely determined by rainfall and soil types, notonly from the point of view of fertility, but the moisture holding capacity of districtsoils. With the exception of patches of brigalow soil types the majority of the croppingarea has low moisture holding capacity.—In view of this situation and the high evapotrans-piration, summer dryland cropping is a risky venture. This situation could change with theintroduction of new varieties of crops incorporating such characteristics as droughttolerance.
Winter rainfall, whilst significantly lower than that received in the summermonths, is more reliable, reasonably well distributed and has greater impact on winter cerealcrops than its relatively low figures would Indicate. The lower temperatures result in agreater proportion of effective rainfall, and as a direct consequence to this situation theemphasis Is placed on winter grain production. For the five year period 1969-1974,approximately 83 percent each year, of the area set aside for annual cropping, was sown towinter crops.
The distribution of the annual rainfall in relation to the fallowing, plantingand growing periods of the major winter crops is contained in Table 2.11.
From Table 2.11 using Dalby as a comparison, it can be seen that In InglewoodShire, fallowing rains are somewhat less whilst planting and growing rains are more than atDalby, which is the centre of the major grain growing district in the State.

.13.
Table 2.11
Rainfall (am) Distribution In Relation to Winter Cereal Production
Centre
InglewoodTexasYelarbonGoondiwindiDalby
Fallowing(December-April)
332325306311359
Planting(May-June)
8481668274
Growing(July-October)
17417615816116?
Source: Bureau of Meteorology (unpublished data)
Frosts can assume considerable Importance within the Shire. Late frosts can haveserious affect on winter cereals and some early sown summer crops, whilst early frosts canequally have serious affect on late sown bean crops.
Sources of Information
1. Australia Bureau of Meteorology (1972) - Catalogue of Australian Rainfall andEvaporation Data. Melbourne
2. Australia Bureau of Meteorology (1975) - Climatic Averages, Queensland Metric Edition.Melbourne
3. Australia Bureau of Meteorology (1961) - Climatological Survey, Region 6 - WesternDowns, Queensland. Melbourne
4. Australia Bureau of Meteorology, Brisbane. Unpublished data
5. Queensland Department of Primary Industries. Inglewood Field Station Records,(unpublished)
6. Wills, A.K. (1976) - 'Climate of the Granite and Traprock Area' in 'The Granite andTraprock Area of South-East Queensland'. Queensland Department of Primary Industries,Division of Land Utilization, Technical Bulletin No. 13
7. Isbel l , R.F. (1957) - The s o i l s of the Inglewood-Tara-Glenmorgan Region, Queensland.Queensland Bureau of Investigation Technical Bulletin No. 5

.14.
3. WATER RESOURCES AND IRRIGATION
3.1 GENERAL
The character of agricultural activity in Inglewood Shire is considerablyaffected by the supply of irrigation water from water storage developments in and near theShire.
Rainfall in Inglewood is enough, in most years, for the production of broadacregrain crops. However Che supply of irrigation water has enabled crops such as tobacco,lucerne and fruit to be grown in the Shire.
The main irrigation areas are located alonp the Dumaresq River, which forms thesouthern boundary of the Shire and the Macintyre Brook, which drains the centre of theShire. Coolmunda Dam supplies irrigation water to Macintyre Brook and the recentlycompleted Glenlyon Dam supplies water to the Dumaresq River through Pike Creek.
Inglewood Shire is not well endowed with underground water. Yields are small andwater quality ranges considerably. This source of water is used mainly for stock wateringin the Shire.
3.2 SURFACE SUPPLIES
The Macintyre Brook and the Dumaresq River and their tributaries are the mainsource of surface water within the Shire.
Macintyre Brook
Main tributaries of the Macintyre Brook are the Chain of Ponds, Bracker, Canningand Catfish Creeks. The Brook is a relatively narrow stream and natural storage in thestream during periods of nil flow is lov. Rainfall on the catchment area can cause a rapidrise in the stream, and flooding can be a problem. In the 1940s and 1950s three small weirswere constructed along the Macintyre Brook in an endeavour to alleviate water shortages fortobacco. These are Greenup, Whetstone and Ben Dor weirs. A fourth weir was constructedsolely to supply water for domestic and commercial use in the town of Inglewood. Detailsof these weirs are shown in Table 3.1, and their localities are shown in Map 1.
Table 3.1
Details of Weirs on Macintyre Brook
Purpose of Supply
UrbanIrrigationIrrigationIrrigation
Total
Name and Location(from junction with. Dumaresq)
Inglewood - 55 kmBen Dor - 18.7 kmWhetstone - 38.5 kmGreenup - 73.4 km
Height(m)
2.45.65.04.3
Storage CapacityMl
190.34734.00506 .00370.00
1800.34
Source: Irrigation and Water Supply Commission, Brisbane
The total storage capacity of the three irrigation weirs (1610 Ml) did not providean assured water supply for irrigation because of the fairly long periods of low flow inMacintyre Brook and its tributaries.
Investigations of the effect of a further six small weirs which could be
constructed along the Brook, with a height of the vicinity of two metres showed that thesesix structures together would not increase the available supply by more than sufficient toirrigate a further 80 to 120 hectares. Because of this, no further consideration was givento this class of storage.
Water Supply Problems. The rapid expansion in tobacco production in the 1950sresulted in water supply problems which came to a head in 1960-61, with a record plantingof 590 hectares of tobacco. This record planting coincided with an extremely dry summer.Water supplies were short and the quality of the available water was low. Tobacco sales

.15.
were disastrous for growers with a large quantity of leaf not sold. This resulted in manyof the sharefarmers leaving the area, and a severe reduction in tobacco acreage in thefollowing years.
This decline in tobacco production brought about a very depressed situation, notonly in the rural community, but also in business activity and employment in the Shire.
A joint investigation by the then Department of Agriculture and Stock, and theIrrigation and Water Supply Commission was authorized, and a report on water conservationpossibilities on Macintyre Brook was prepared. This report recommended construction of adam below the junction of Macintyre Brook and Bracker Creek at 77.85 km.
Two other sites for a storage were also assessed in the preparation of this report,as is shown in Table 3.2 and Table 3.3.
Table 3.2
Details of Storage Sites on Macintyre Brook
Site
Macintyre Brook(77.9 km)
Macintyre Brook(97 km)
Bracker Creek(3 km)
No.
1
2
3
Height From Bed of Streamto Pull Supply Level(m)
16.0
22.4
9.8
Storage Capacity
(Ml)
75 250
27 750
16 000
Annual AssuredSupply(Ml)
20 350
12 950
9 250
Estimated Capital Cost 1963
Site No.
1
2
3
Total Cost$M
4.86
3.6
3.8
Per Ml of Storage$
65
130
238
Per Ml of Assured Supply$
239
278
411
Source: Irrigation and Water Supply Commission, Brisbane
One disadvantage of the Macintyre Brook site (77.9 km) at Coolmunda is that theassured annual supply is only a small proportion of the storage capacity. This is becausethe Macintyre Brook catchment is a relatively dry one, with an average rainfall of only620 mm, and subject to long periods of low rainfall and runoff which means that storage hasto be carried over for several years at a time to meet irrigation requirements during thesevery long dry spells.
None of the sites was particularly attractive, as the storages were relativelysmall and the capital cost per megalitre of assured supply was higher than had been the casefor any approved structure to that date.
The Coolmunda site was recommended because no other site provided sufficientstorage and the site gave the lowest cost per megalitre of assured supply. Furthermore,the site controlled water from two catchments, and as Bracker Creek was a major contributorof poor quality water during low flow periods, it was considered advantageous to have thistaken into storage. This enabled the low quality water to be diluted with better qualitywater rather than have this water used as unregulated flow in low flow periods, particularlywhen the flow was just sufficient to meet irrigation requirements.
The disadvantages of the site were that it inundated some 850 hectares of alluvialsoil and a deviation of the railway and main road was required.

.16 .
Construction of the dam commenced in 1963, and the dan was completed in 1968.Full capacity was reached in December 1970.
Detai ls of the dam are given in Table 3 .3 .
Table 3.3
Coolmunda Dam Specifications
Type of Dam
Length of Dam
Height of Crest above stream bed
Full Supply Level - above sea level
Full Supply Level - above stream bed
Total width of Spillway
Net Length of Spillway Crest
Spillway Gates(Counterbalanced, automatically operated)
Total Volume of F i l l in Embankment
Volume of Concrete in Dam
Reservoir Area ( fu l l supply level)
Length of Shoreline
Storage Capacity
Catchment Area
Annual Average Rainfall
Period of Construction
Cost
Supply Available (annual)
Earth and Rockfill
2286 metres
18.9 metres
314.1 metres
16.1 metres
107 metres
89.6 metres
7, each 12.8 metres long11 metres high
659 000 m3
31 500 m3
1740 hectares
30.6 km
75 200 Ml
1735 km2
620 mm
1963-1968
$6 900 000
16 100 Ml
Source: I r r iga t ion and Water Supply Commission, Brisbane
Conditions of Supply. On completion of Coolmunda Dam, landholders were advisedby the I r r iga t ion and Water Supply Commission that a licence was required in which thelandholder was asked to s ta te the area intended to be i r r i ga t ed , the desired water e n t i t l e -ment and the term for which the licence was to be issued, or renewed, up to a period of 10years . A minimum period of three years was s t ipulated by the Commission.
No charge i s made for water used solely for stock or domestic purposes, but apermit i s required, and the pump size i s limited to 75 mm.
Conditions of Licences. The i r r igated area for which a licence i s granted orrenewed, i s as requested by the landholder, except tha t :
(a) The licenced area must not be less than four hectares;
(b) Restr ict ions to the area i r r iga ted on any one property may be applied when the t o t a larea of i r r iga t ion approaches 3200 hectares ;
(e) All l icences held by a landholder are grouped together for the purpose of measuringwater use and determining payment; and
(d) The quantity of water licenced to be diverted each year, wil l normally be sixmegalitres per hectare l icenced. In no case wil l the to t a l water entitlement perlandholder be less than 25 megali tres.
Pump Size. No l imit was placed on the size of the pump, and the number oflicenced pumps per landholder i s not normally l imited.
Meters. Up to three water meters per landholder are supplied, ins ta l l ed ,

.17.
maintained and read by the Irrigation and Water Supply Commission, at its own expense, onlicenced pimps. Any additional meters are supplied and installed at the landowner'sexpense, but the Commission will maintain and read these at Its expense.
Water Charges and Payments. Water charges are $3.00 per megalitre. A review ofthese charges is made annually. A minimum lump sum payment is required for 75 percent (tothe nearest megalitre) of the total water entitlement for each landholder at the currentunit charge. This payment is required within one month of notification. When the useexceeds 75 percent of the entitlement, payment Is required for the extra water used.
For the 1976-77 and 1977-78 years the minimum percentage for lump sum payment hasbeen reduced to 50 percent as a concession to loss of production due to the 1976 flood.
Landholders who require more water than the entitlement, in any year, can applyfor additional supply, providing sufficient water is available for other users.
Water entitlements cover a 12 month period, from 1 April to 31 March.
Water Quality. One of the main problems confronting tobacco growers on MacintyreBrook in the past has been the low quality of irrigation water available. High chloridelevels were the main cause of this low quality water.
High chloride levels In irrigation water do not retard crop growth and development.However, with tobacco, these chlorides are absorbed very easily by the plant and accumulatedin the leaf and resultant leaf quality is lowered.
In the Macintyre Brook prior to the building of Coolmunda Dam the chlorideproblem was accentuated during period of drought, when the use of supplementary irrigationwas even more necessary. McNee and Skerman (1965) found that during a normal seasonchloride concentrations in the Brook ranged from 10 to 120 parts per million, depending onthe sampling site. During a period of drought, figures as high as 540 ppm were obtained.The ideal chloride content of irrigation water for tobacco culture is below 25 ppm, althoughup to 40 ppm is acceptable.
The completion of Coolmunda Dam, and the effect of continued water releases fromthe dam, has levelled out the normal seasonal fluctuations in chloride levels in theMacintyre Brook, below the storage. Chloride analyses or water samples taken from the dansite indicate that levels between 25 ppm and 40 ppm can be expected, whereas samples takenat Ben Dor Weir are generally 10 to 20 ppm higher. There are numerous springs feeding lowquality water in the Macintyre Brook downstream from Coolmunda Dam. This accounts for theprogressive increase in chloride content downstream from the dam.
The chloride content of irrigation water from the Macintyre Brook will be in the40 to 60 ppm range during periods of nil flow from the lower tributaries. When thesetributaries flow or following releases from the storage, the chloride level can be expectedto fall below 40 ppm.
The levels of sodium in the irrigation water from the Macintyre Brook arecomparable with the chloride levels. This indicates a potential hazard in the continueduse of this water for irrigation. Sodium absorption ratios of water samples from the Brookare normally between three and four. This irrigation water is also considered to be ofmedium salinity with levels between 130 and 330 ppm.
Irrigation practices will largely determine the effect of continued use ofirrigation water on the silty clay loam soils. Trials have indicated that gypsumapplications although showing some beneficial effect on the soil, can not be economicallyjustified. The high cost of bulk gypsum and the need for large quantities (2.5 to 5 tonnesper hectare) has deterred any commercial use of the product.
Dumaresq Fiver
The Dumaresq River Valley is formed by the confluence of four streams, Mole Riverand Tenterfield Creek (New South Wales) and Severn River and Pike Creek (Queensland).
They converge in the relatively small area known as Mingoola, about 55 kilometreswest of Tenterfield (New South Wales), to form the Dumaresq River.

.18.
From Mingoola, the river is the border between the States of Queensland and NewSouth Wales, and continues as such to its junction with the Macintyre Brook, where theyboth form the Macintyre River, some 183 kilometres distant.
In the upper reaches, there is a well defined valley which gradually broadens andflattens out, from the town of Texas in Queensland towards Goondiwindi.
Rainfall on the catchment area can cause a rapid rise in the river, and floodingcan be a problem.
In the mid to late 1950s, three small weirs were constructed along the DumaresqRiver, in an endeavour to alleviate water shortages. These are Bonshaw, Cunningham andGlenarbon. Details of these weirs are shown in Table 3.4. Map 1 shows their locations.
Table 3.4
Details of Heirs on Dumaresq River
Purpose of Supply
IrrigationIrrigationIrrigation
Total
Name
BonshawCunninghamGlenarbon
Height<m)
2.94.62.7
Capacity(Ml)
61754335 3
1513
Source: Irrigation and Water Supply Commission
The total storage capacity (1513 Ml) of the three irrigation weirs, along theDumaresq River, did not provide an assured water supply for existing irrigation, because ofthe irregular flow in the Dumaresq River.
The Dumaresq-Barwon Border Rivers Commission, established under the New SouthWales-Queensland Border Rivers Agreement, is responsible for the investigation, design,construction, operation and maintenance of water conservation works along the Border Rivers.As a result of its investigation of major storages on the Dumaresq River, the Commission ina report of March 1961, recommended that the first step in the provision of waterconservation should be provided by the construction of a dam at 6.8 kilometres on PikeCreek.
The Glenlyon Dam, completed in 1976 on Pike Creek, a tributary of the DumaresqRiver, will supply irrigation water to both States.
Construction of the Glenlyon Dam commenced in 1973, with costs being borne by theQueensland and New South Wales Government, with Queensland's apportionment of water being48 500 megalitres which was calculated as half the assured annual supply measured at theMingoola gauging station.
Table 3.5
Glenlyon Dam Specifications
Type of DamCatchment AreaCapacitySurface AreaLength alpng^Pike CreekHeight of Embankment above BedHeight of Spillway above BedLength of Embankment CrestWidth of SpillwayVolume of Fill in EmbankmentHigh Capacity Outlet DiameterLow Capacity Outlet DiameterAverage Annual Rainfall
Earth and Rockfill1326 km 2
261 000 Ml1750 hectares27 km61 metres49 metres449 metres74.4 metres1 450 000 m 3
1500 mm600 mm650 mm

.19.
Quality of Water. In periods of low flow in the Dumaresq River, the sodiumchloride content of the water increases significantly to levels at which it seriouslyaffects the quality of tobacco leaf.
Without storage, the high level of sodium chloride is detrimental to tobacco leafquality at certain periods but is satisfactory for other types of crops that could be grownin the area.
The result of storage of high flows and the release of this low salinity water(see Table 3.6) as required to maintain flows in the river- and to meet irrigation demand isexpected to considerably reduce the average level of salinity compared with that of thenatural unregulated flow in certain periods.
Table 3.6
Water Quality DataBorder River and Tributaries
Date
19 January 19668 March 19669 March 196621 September 196625 January 19676 April 196724 August 196725 August 196 712 December 196714 December 19674 March 196816 July 196817 July 19688 August 1968
Pike CreekDam
Discharge(Cusecs)
0.91
0.9
3.3
0.150.52
17.520.4
Site
SodiumChlorideContentppm
36
40
42
5038
3634
Dumaresq River(Cunningham Weir)
Discharge(Cusecs)
1050
140
SodiumChlorideContentppm
22
36
Mac in tyre River(Goondiwindi)
Discharge(Cusecs)
773
31.51800115
284
13.3
196
SodiumChlorideContentppm
36
522440
28
32
54
Source: Dumaresq Valley I r r i ga t ion Project - July 1969
3.3 UNDERGROUND SUPPLIES
The Shire may be considered as consit ing of two groups of rocks, divided by thel ine Beebo-Inglewood-Millmerran. East of t h i s l i n e , there are old rocks, f a i r ly hard forthe most p a r t , while to the west are the sandstones and shales of the Artesian Basin. TheArtesian Basin sediments are overlain in some areas by the th in cover of unconsolidatedclays and sands.
Old Bocks
The mudstones shales, slates, etc., of this group are Palaeozoic in age.most part, groundwater in these rocks is stored in fractures, joints and crevices.
For the
Supplies vary in both quality and quantity. The supply ranges from nil to 1350 lph.Quality is usually suitable for stock use but can vary from domestic quality water tounsuitable for all purposes. Depth to the main aquifers varies between 30 and 60 metres.
Bores in these rocks should be located adjacent to creeks, gullies or majordrainage lines, since these features control the recharge to the rock freactures, and hencethe permanency of supply.

,20 .
Artesian- Basin, Rooks and Overlying Sediments
Where present, the sediments are about 27 metres deep and produce water fromsands, weakly cemented sandstones and small gravels from about 16 metres on. Yields areusually a few hundred l i t r e s per hour and quality can often be poor.
The sandstones and shales of this sequence vary in depth from 0-46 metres at theeastern edge, to 155 metres at the western boundary of the Shire. The most commonly usedacquifers are encountered in the range 65-123 metres.
Water quality i s usually described as suitable for stock, but there i s l i t t l eanalytical information available to indicate su i tabi l i ty for domestic use.
The supply available from the sandstones i s variable, ranging from 200-4500 l i t r e sper hour. Towards the western boundary of the Shire occasional bores could yield small(tr ickle) flows.
3.4 IRRIGATION
3.4.1 Water Use
The area under irrigation in the Shire has increased steadily following thecompletion of the Coolmunda Dam in 1968, and wi l l continue as growers become moreexperienced with irrigation. Increased areas of irrigation are expected along the DumaresqRiver following the completion of the Glenlyon Dam.
, Table 3.7 i l lus trates the increases in area of crops under irrigation from 1970-71 to that of 1975-76 water year.
The irrigation area includes double crop areas which were counted twice and alsoany area that was irrigated at least once was assumed to be an Irrigated crop.
Table 3.7
Area Crops Grown Under Irrigation 1970-71 and 1975-76
Crop Irrigated
LucerneTobaccoSoybeansNavy BeansFrench BeansSorghumMilletPumpkinsWheatMung BeansBarleyHorticultural CropsPasturesWinter Fodder CropsTocal
Maeintyre Brook
1970-71
365142-
24- I
2(4-
2520
-803624
214
954
1975-76
20816588
34672
202
25-
302008130
n .a .
1447
Dumaresq
1970-71
350120-----
15160---
10200
855
River
1975-76
4,50160150116
-218
2015
--
2002024
n .a .
1373
fcource: Department of Primary Indus t r ies , Inglewood
Table 3.8 shows the amount of i r r i ga t i on water used by i r r i g a t o r s since completionof the Coolmunda Dam, compared to the t o t a l water a l locat ions applied for by property ownersin these years . Whilst there has been an increase in water usage per hectare , i t i s s t i l lshort of crop requirements, although supplies are ava i lab le .
3.4.2 I r r iga t ion Methods
Several systems of i r r i g a t i o n are now in use on Maeintyre Brook and the Dumaresq

.21.
River. Initially, irrigation was concerned with the production of tobacco and it is onlyin recent years that extensive irrigation of other crops has occurred. The uneventopography of most of the irrigation soils on Macintyre Brook and the Dumaresq River hasrestricted the acceptance of flood systems of irrigation.
Table 3.8
Water Allocation and Use - Coolnunda Dam
Year
1968-691969-701970-711971-721972-731973-74197A-751975-761976-77
Liaencees(end ofyear)
No.
n.a.n.a.n.a.n.a.5676767675
PumpaLicenced
Ho.
8482859094
129132132132
DamStorage(end ofyear)
(Ml)
23 31324 42369 44666 60963 64946 00074 40072 40075 200
Allocation
(Ml)
3 9143 7933 9474 3314 629
14 98015 41715 51515 232
DivertedbyFarmers'-
%
2 4372 1812 3193 1224 9977 HI4 9463 0123 862
PercentofAllocation
%
62585972
10847321925
ReleasedfromDam
(Ml)
n.a.n.a.n.a.n.a.10 82511 2074 8562 1544 979
Source: Irrigation and Water Supply Commission. Annual Reports1 Excludes water diverted for Inglewood town (280 Ml in 1976-77)
Furrow Irrigation
This was the first method used to irrigate tobacco. The small areas involved andthe system of culture encouraged the practice of furrow irrigation, and until 1967 it wasthe only irrigation system used for this crop.
Water was lifted by pumps from the stream and, depending on the situation, wastransferred by ditch or fluming to the site of the crop. Elevated galvanized iron flumingsupported by poles and carried under roadways by a syphon system, was used to carry waterto the higher stream terraces.
Control of irrigation water with this system was generally obtained by shovel andit is only in recent years that syphons have been used. The uneven topography of manypaddocks produced erratic watering and checks in the furrow were used to help alleviatethis problem.
The more recent trend is to do away with syphons and use 'gated pipes'. Thislatter system whilst more costly initially, proves its superior efficiency by allowing thefanner greater control of irrigation water flow rates on the more difficult soils whereinfiltration rates can be as low as two millimetres per hour.
Gated pipes also are labour saving and do away with head ditches, which are costlyto construct and maintain.
Lateral water penetration in the silty loam soils is poor and the single V-shapedfurrow is unsuitable for effective water distribution. A flat-bottomed or double V-shapedfurrow is required to allow water to spread close to the row.
Surface sealing reduces the rate of penetration and Ions flow periods arerequired to ensure effective watering. Infiltration rates are satisfactory following acultivation, but are very low when water is applied to uncultivated furrows. Furrowirrigation of many tall-growing field crops such as tobacco, grain sorghum, sunflowers islargely ineffective after the last cultivation stage. As the water requirement of most ofthese crops is highest at flowering, it is most difficult to maximize yields on these soilswith furrow irrigation.
Spray Irrigation
The first spray irrigation plant was installed on Macintyre Brook in 1958. The

.22.
number of planes installed in the following 10 years was small and no major increaseoccurred until 1967 when 'towllne' type plants and an assured future water supply becameavailable.
Irrigation of field crops and lucerne has emphasized the importance of a simplesystem of spray irrigation which eliminates the need for excessive labour. At present, the'towline system' is satisfying this requirement, although the capital cost is high ($500-$580) per hectare. The major problem with this system is the difficulty of shifting theline in a crop over one metre high.
A move to the sandier soils for tobacco culture and a realization of theimportance of more effective irrigation on the silty clay loams has encouraged tobaccogrowers to change from furrow to spray irrigation. During the 1974-75 growing season, 290hectares (56 percent) were grown under spray irrigation, 126 hectares of which is situatedon the Macintyre Brook.
It has been necessary to design plants with low rate of application to obtaingood moisture penetration and prevent excessive runoff and crusting on the silty clay loams.Most plants are designed to supply seven to nine millimetres per hour.
The introduction of the first travelling irrigator in 1972 resulted in a smallincrease to a total of five on four properties in 1975.
The main problem with spray irrigation is the high capital cost involved,particularly when low value crops and pastures are to be irrigated.
Other Systems of Irrigation
Border. The border check system is used on 10 properties commercially. Thetotal area in 1975 was 275 hectares. The uneven topography of most irrigable soilsrestricts the use of this system due to the excessive grading that is required.
Solid Set. An overhead irrigation system, essentially designed for efficiency,timely operation and labour saving. High capital cost restricts the use of this system tohigh value crops. Two are currently in operation in the district.
Trickle. This system would appear to be eminently suited to horticultural crops,and three by two hectare areas of grapes and also one area of 40 hectares - pecan nuts - arenow being watered with this system. The high capital cost ($2500 per hectare) will restrictits use to vines, orchards and high value vegetable erops. Trickle irrigation experimentsare being conducted at the Inglewood Field Station (see Section 8).
Table 3.9 sets out areas irrigated in Inglewood Shire for the last four yearsaccording to type of crops irrigated, source of water and method of application of thewater. • - . • • -
3.4.3 Irrigation Practices
The advantages of preplanting irrigation for crop establishment is now realizedby irrigators, but the practice has been rare in the past. This has resulted in lateplantings and problems with emergence, particularly with summer crops.
A high soil moisture regime is essential at planting as post planting pre-emergence irrigation on the silty clay loams causes severe crusting. Germination can alsobe affected by a wet crust developing following rain.
During heatwave periods, irrigation is required in 10 day cycles on the siltyclay loams, and more frequently on the deep sands. Irrigation plants therefore must bedesigned to apply at least 50 mm per week or 75 mm every 10 days for summer crops.
3.4.4 Drainage
Some degree of levelling is required on most soils. Heavy grading should beavoided on the silty clay loams. Exposure of the subsoil causes patchy crop growth due tothe poor and uneven water penetration, and the increased tendency of this exposed subsoilto crust. Less lasting damage is done by a series of light levellings which should be

.23.
carried out as early as possible prior to planting of the crop.
Table 3.9
Irrigation on Rural Holdings - Inglewood Shire
Particulars
Crops Irr igatedCereals ( a l l purposes)TobaccoFruit and vegetablesOther crops
Pasture Irr igatedLucerneOther pasture
Total Area I r r iga ted
Source of WaterSurfaceUnderground
Method of ApplicationFurrowsSpraysFloodingTrickleMultiple
Holdings Using I r r iga t ion
7972-73ha
504303
20182
601194
1807
1695112
661511
1913
35
No.
99
1973-74ha
754255
14169
63424 7
2073
198588
741729237
528
No.
96
1974-75ha
83825367
316
710270
2454
236391
591998360
730
No.
100
1975-76ha
818245
46215
565267
2156
207482
1201720309
7-
No.
96
Source: Australian Bureau of Statistics
3.4.5 Irrigation Plants
Motors. Up to June 1975, 20 percent of the pumps on the Macintyre Brook werepowered by electricity, whilst 25 percent of the motors on the Dumaresq River were poweredby electricity.
Lower tariff charges, introduced in recent years, have resulted in a move toelectric motors as electricity becomes more competitive with diesel fuel. Other irrigatorsare using mainly stationary diesel motors, which although considerably more expensive tobuy than the electric motor, have had a much lower running cost, with their mobility anadded advantage.
Mains. Asbestos cement mains are used in all the larger plants. Most of thesemains are underground and do not restrict machinery. Main sizes are 15 cm and 20 cmdepending on the area involved.
Pumps. Cetrifugal pumps are used and the size varies considerably,they are in the 100-200 mm range.
3.5 FUTURE IRRIGATION DEVELOPMENT
Generally,
An increase in the area under forms of flood irrigation can be expected. Thelimitations have already been discussed, but one of the main advantages of this system willbe the lower capital costs, and therefore a more economic use of water on grazing crops andpastures in particular. Another advantage is the ease and speed of applying water to acrop during periods of stress. The maintenance of a ground cover for example in the caseof pastures, has reduced surface sealing of the silty clay loams. The area under sprayirrigation will also increase. This increase will be associated with annual crops such astobacco, and also where irrigation is required on the more uneven areas of the silty clayloams, and on the porous sands. Although initially the increase will utilize the 'towline'system it can be expected that other forms of spray irrigation such as 'solid set'
.24.
and 'travelling irrigators' will also increase.
If the acreage under fruit and vines increases, the 'trickle' system will alsobecome more widely accepted.
Sources of Information
1. Irrigation and Water Supply Commission, Warwick and Brisbane
2. Department of Primary Industries, Inglewood
3. Kerr, J.C. (1971) - Irrigation on the Macintyre Brook. Agriculture Branch TechnicalBulletin No. 10. Queensland Department of Primary Industries. Brisbane
4. McNee, D.A.K. and Skerman, P.J. (1965) - Distribution of Chlorides in the waters ofthe catchment of the Macintyre Brook, southern Queensland, and their effect on tobaccoproduction. Queensland Journal of Agricultural and Animal Sciences. 22 : 39
5. Queensland Department of Primary Industries and Irrigation and Water Supply Commission(1976) - Irrigation in Inglewood Shire (mimeo.) Inglewood Field Station
6. Australian Bureau of Statistics - Irrigation on Rural Holdings, Queensland (1972-73to 1975-76). Brisbane
7. Queensland. Irrigation and Water Supply Commission - Annual Reports
8. Queensland. Irrigation and Water Supply Commission (1968) - Macintyre Brook IrrigationProject. Coolmunda Dam. (Pamphlet). Brisbane
9. Dumaresq-Barwon Border Rivers Commission (1976) - Glenlyon Dam (Pamphlet). Irrigationand Water Supply Commission. Brisbane

. 2 5 .
4. SOILS
4.1 INTRODUCTION
The so i l s of the Inglewood Shire have been broadly mapped at a scale of1:2 000 000 in sheets 3 and 4 of the Atlas of Australian Soils (Northcote, 1966 and Isbellet a l . , 1966). However, separate sections of the Shire have been reported on in mored e t a i l . Isbel l (1957) mapped part of the Shire west of 151°5'E longitude at the scale fourmiles to one inch (approximately 1:253 000) while Powell (1976) has mapped the Shire eastof th i s longitude at the scale of 1:250 000. The accompanying so i l s map (Map 4) of theShire i s a composite of these more detailed repor ts .
The main groups of soi ls in the Shire are:
Soils developed on alluvium
Soils developed on limestone
Soils developed on sandstone
Soils developed on ' traprock1
Gravelly so i l s of mixed origin
Brigalow-belah so i l s
Sandalwood-poplar box so i l s
Tea tree-spinifex so i l s
There are minor areas of so i l s developed on granite at Mt. Bullanganang, Pikedaleand Smithfield. They are predominantly g r i t t y s i l iceous sands amongst rock outcrops orgr i t ty texture contrast so i l s . *
These areas are marked on the map but granite soils have not been described inthe tex t .
The main soil groups are discussed in more detai l in Section 4.2. In thisSection, Principal Profile Forms (Northcote, 1974) are given for many of the soilsdescribed Ce.g. Gn 3.11, Dy 3.43).
4 .2 MAJOR GROUPS OF SOILS
4 . 2 . 1 S o i l s Developed on Alluvium
MAP UNIT 1
This map unit can be found bordering the Dumaresq River and Macintyre Brook, andcan be divided into two sub-groups:
Soils of the younger terraces and levees (regosols). These are dominantly deep,slightly acid to neutral, sandy-loams to silty-loams showing little profile differentiation.(Dm 4.31, Um 6.12, Um 6.11) and silty clays (Uf 6.3) also occur. Vegetation is usuallyan open fringing forest of Murray River red gum, poplar box and occasionally coolibah andMoreton Bay ash. These soils are highly productive and easy to manage.
Soils of the older terraces and levees. These are much more extensive than theregosols and slope generally away from the stream. They are deep soils with slightly acidto neutral, light grey-brown or light brown loams, silty-loams or clay-loam surface soilsto 30 to 60 cm overlying compacted,red-brown, alkaline, clay subsoils (Dr 2.42, Dr 2.63).Vegetation is usually a woodland dominanted by silver-leaf ironbark and poplar box, withoccasionally rough-bark apple on the sandy areas. Cultivation and irrigation often lead tosurface crusting and the development of pans. Most areas are subject to inundation byexceptional floods.
Fertility status is generally good for both sub-groups, however on the soils ofthe older terraces and levees there is a possibility of undesirable chloride accumulationwith irrigation.1 See end of section for definitions

. 2 6 .
MAP UNIT 2
This map unit i s found bordering the Dumaresq River upstream from Smithfield.
Dominant Soils
Dark brown structured earths^ (Gn 3.23, Gn 3.25, Gn 3.42). Deep so i l s with ahard se t t ing massive, brownish-black to dark brown, clay-loam surface so i l commonly under-la in by a pale ^ - h o r i z o n grading into a dark brown, blocky, neut ra l , to alkaline clay sub-s o i l containing lime concretions.
Dark brown, texture contrast soils (Db 1.42, Db 1.43, Dy 2.42, Dd 1.43, Dd 3.23).Deep so i l s with a massive, greyish-yellow-brown, loam to clay-loam surface soi l usuallyhardset t ing, over a bleached A2-horizon to 30 to 35 cm, over a greyish-yellow-brown to darkbrown, blocky or columnar, alkaline clay subsoi l . Lime may occur at depth.
Minor Soils
Dark loams (Urn 1.43, Urn 1.44, Gn 2.43). Deep, dark brown, massive, sandy-clay-loam to clay-loams of neutral pH, occasionally becoming more clayey and alkaline with depth.
Dark, hardsetting clays (Uf 6.31, Uf 6.32, Uf 6.33). Deep, black to dark brownclay becoming alkaline with depth. Lime concretions in subsoil are common. Clay colourmay become browner with depth.
Vegetation is usually a cleared open forest of river red gum, white box and poplarbox with minor rough-bark apple.
The hardsetting surface is a problem for cultivation and the impermeable, poorlydrained, clay subsoils of the dark brown texture contrast soils restrict the soilscultivation and irrigation potential. Flooding can occur.
Soil fertility is generally good but salt accumulation, particularly in the darkbrown texture contrast soil is a severe restriction.
MAP UNIT 3
This map unit i s found bordering the Macintyre Brook east of Inglewood andbordering other streams surrounded by sandstone or traprock.
Dominant Soils
Yellowish-brown and brown, neutral to alkaline, texture contrast soils (Db 1.43,Db 3.12, Dy 2.12, Dy 2.42, Dy 3.43). Moderately deep to deep so i l s with a hardset t ing,massive, brownish-black to dull yellowish-brown, loamy-fine sand to clay-loam, frequentlygravelly, surface soi l frequently underlain by a bleached A2~horizon to 10 to 40 cm over acoarse blocky or columnar structured dull yellowish-brown or mottled brown, neutral toalkal ine , clay subsoi l .
Minor Soils
Soloths (Dr 2.41, Dr 4.41, Dr 4 .22) . Deep so i l s with a dark brown to brown,loamy-sand to fine sandy-loam surface soi l over a pale or bleached A2~horizon to 60 cm overa red-brown, acid, clay subsoi l .
Red and brown, alkaline, structured earths (Gn 3 . 1 6 , Gn 3 .19 , Gn 3 . 5 5 , Gn 3 . 7 4 ) .Deep so i l s with a dark brown to brown, loam, fine sandy to fine sandy-clay-loam surfaceso i l usually underlain by a pale A2- horizon grading into a reddish-brown, mottled brown oryellowish-brown a lka l ine , clay subsoi l .
Sandy-loams (Uc 1.23, Uc 4.22) . Deep s o i l with a brown to reddish-brown, finesandy-loam to sandy-loam surface so i l frequently underlain by a pale A2~horizon over abrown, acid to neut ra l , sandy-loam subsoi l .
1 See end of section for definitions

.27.
Brown, grey and dark cracking clays (Ug 5 .1 , Ug 5.2 , Ug 5.3) . Deep so i l withlarge hexagonal surface cracks and brownish-black or dark-brown, clay to clay-loam surfaceveneer over grey, brown to brownish-black, neutral to alkaline, clay subsoil, usually withlime at depth.
The vegetation in this map unit i s variable with pure and mixed stands of poplarbox, yellow box, brown box and rough bark apple occurring, much of i t cleared.
The hardsetting surface and poorly structured clay subsoil of the dominant s o i lrestrict long term cultivation prospects without irrigation. Soil f er t i l i ty status i sfair but nitrogen levels are low and subsoil sodicity i s occasionally undesirably high.
4.2.2 Soils Developed on Limestone
MAP UNIT 4
These so i l s cover small areas around Limevale and The Pinnacle.
Dominant Soils
Red-brown, structured earths (Gn 3.13, Gc 2.22). Deep so i l with a hardsetting,dark reddish-brown, clay-loam surface so i l grading into a red-brown blocky, medium clay,subsoil containing manganiferous nodules and neutral to alkaline at depth.
Minor Soils
Dark red, hardsetting, calcareous clays (Uf 6.31). Moderately deep clay with agritty, brownish-black to brown surface soil grading into a dark brown to brownish-black,blocky subsoil with powdery lime throughout.
Vegetation is dominanted by an open forest of brown box. These soils aresuitable for cultivation but soil surfaces may be hardsetting and salinity levels may behigh. Soil fertility status is fair.
4.2.3 Soils Developed on Sandstone
MAP UNIT S
This association consists of both texture contrast soils and deep acid sands. Thetexture contrast soils consist of an acid, sandy, loose surface soil over a bleached sandysubsurface overlying a tough solonized, acid to alkaline, clay subsoil (Dy 2.41, Dy 3.43,Db 1.42, Db 1.43). The deep sands (Uc 1.23, Uc 2.12, Uc 2.31, Uc 2.34) and acid texturecontrast soils dominate the upper slopes while the lower slope soils often contain alkalineclay subsoils.
The vegetation is dominated by cypress pine, with bulloak, narrowleaf ironbark,tumbledown gum and smooth bark apple (rusty gum) generally associated. The grass cover issparse. These soils are low in available nutrients and are commonly laterized to somedegree with ironstone concretions in the B-horizons.
The texture contrast soils are undesirable agricultural soils because of theirlow fertility, often very acid (pH 5.0-5.5) surface and impermeable clay subsoil causingimpeded internal drainage and waterlogging.
Deep, light grey to light brown sands occur near Macintyre Brook and are usuallyat least two metres deep. The vegetation is usually cypress pine, black pine, smooth barkapple and silver leaf ironbark. This soil type offers scope for agriculture and horticulture,particularly under spray or trickle irrigation, although fertilizer requirements would behigh.
MAP UNIT 6
The dominant so i l i s a deep texture contrast so i l with an occasionally gravelly,loam to clay-loam surface so i l over a bleached subsurface to 10 to 25 cm deep. This over-l i e s a coarse blocky or columnar, grey-brown to reddish-brown, commonly mottled, neutral toalkaline, clay subsoil. (Dr 2.13, Dr 2.43, Db 1.42).

.28.
Vegetation is open forest dominated by bulloak with cypress pine, poplar box,narrowleaf ironbark and mallee box usually associated.
Hardsetting, weakly structured surfaces and impermeable subsoils make these soilsunsuitable for agriculture. The soils are of low to very low fertility and subsoils containundesirably high contents of magnesium and sodium.
AMP WIT 7
These are shallow stony soils having numerous rock outcrops (Urn 1.43, Uf 1.43).Where the parent rocks have been laterized, the soils have a redder hue.
The vegetation is an open forest of silver leaf ironbark, narrowleaf ironbark,poplar box and cypress pine. Wattle is present in some areas, and Acacia cwminghcmii isthe main species found.
Slopes and the shallow stony nature of the soils restrict agriculture. They arealso probably soils of low fertility.
MAP UNIT 8
The dominant soil is a shallow to moderately deep texture contrast soil with agravelly, massive, loamy-sand to light sandy-clay-loam surface soil over a gravellybleached A2~horizon to 25 to 40 cm. This abruptly overlies a reddish-brown to dullyellowish-brown, commonly mottled, blocky or columnar, acid, clay subsoil (Dy 3.41, Dy 4.41,Dr 5.41).
Vegetation consists of an open forest of very t a l l narrowleaf ironbarks amongcypress pine with the occasional smooth bark apple (rusty gum) present.
These soils have no agricultural potential because of hardsetting surfaces, poorinternal drainage, shallow soil depth and a high gravel content. Fertility status is lowto fair, being very low in phosphorus and the subsoil has an undesirably high sodicity.
4.2.4 Soils Developed on 'Traprock1
These soils are shallow and are characterized by a high content of angular parentrock.
MAP WIT 9
Dominant Soils
Shallow, gravelly, loams (Um 2.12, K-Um 2.12, Um 2.21 , lira 5.51). Shallow,gravelly, massive loam to clay-loam with a brownish-black to brown surface so i l over abrown or bleached, acid subsoi l .
Shallow, gravelly, texture contrast soils (Dr, Dy, Db). Shallow, gravelly soilwith a massive, brownish-black to dark brown, loam to sandy clay-loam surface soil over ableached A2~horizon with increasing gravel to 15 to 30 cm, over a coarse blocky or columnar,reddish-brown, brown to dull yellowish-brown, acid to neutral, clay subsoil.
Minor Soils
Shallow to deep, gravelly earths (K-Gn 2.41, Gn 2.11, Gn 3.11). Shallow to deep,gravelly soil with a massive, brownish-black to brown, sandy-loam to light sandy-clay-loamsurface occasionally over a pale A2- horizon grading into a massive or weakly structureddull yellowish-brown to reddish-brown, acid, clay-loam or clay subsoil.
Shallow, gravelly alays (Uf 6.31). Shallow, gravelly, blocky, red-brown claywith a thin (2 cm) dark brown clay-loam hardsetting surface veneer.
The vegetation varies with locality, with mixed and pure stands of cypress pine,tumbledown gum, narrowleaf ironbark, and silver leaf ironbark occurring. Shallow depth,rough terrain and rock outcrops make grazing or forest reserve the only possible land uses.

.29.
Fert i l i ty status i s extremely variable but i s more commonly low. Subsoil sodicityi s commonly high in the gravelly texture contrast s o i l s .
AMP UNIT 10
Dominant Soils
Shallow, gravelly, loams over clays (Dr, Dy, Db) . Shallow to moderately deep s o i lwith a gravelly, massive, brownish-black to brown, sandy-loam to clay-loam surface so i lusually underlain by a bleached A2~horizon to 10 to 30 cm over a brown, reddish-brown oryellowish-brown, clay subsoil .
Minor Soils
Shallow, gravelly loams (Um). These s o i l s f i t the description of the dominantso i l Shallow, gravelly loams in Map Unit 9.
Deep, gravelly, texture contrast soils (Dy, Db). Deep, gravelly, massive,brownish-black sandy-loam to clay-loam surface so i l over bleached A2~horizon to 10 to 30 cmover reddish-brown to dull yellowish-brown, alkaline clay subsoil.
Vegetation i s the same as for Map Unit 9. Cultivation may be attempted inlimited areas where subsoil structure and so i l depth and slope are satisfactory.
Fert i l i ty status i s low to fair , often being low in phosphorus. Subsoil sodicityi s undesirably high.
4.2.5 Gravelly Soils of Mixed Origin
MAP UNIT 11
These so i l s are characterized by a hardsetting stony surface and the presence oflarge amounts of gravel, ironstained quartz, and jasper-like si l iceous material in theupper levels of the profi le . They are shallow to deep texture contrast s o i l s with finesandy-loam to clay-loam surface so i l s over a bleached subsurface to 30 to 35 cm. Thisoverlies a columnar brown to dull yellowish-brown, acid to alkaline clay subsoil.(Db 1.41, Db 1.42, Dy 2.41, Dy 2.42, Dy 2.43).
Vegetation i s an open forest dominated by broadleaf ironbark, poplar box, somebulloak, cypress pine and smooth-barked apple (rusty gum).
The s o i l s are undesirable for agriculture because of their hardsetting, gravellysurface, poor internal drainage and low f e r t i l i t y . Subsoils contain undesirably highcontents of magnesium and sodium.
4.2.6 Brigalow-Belah Soils
MAP UNIT 12
The grey and brown clays are deep, strongly gilgaied soils with a self-mulchingsurface soil, commonly with gypsum and lime present and with acid or alkaline subsoils(Ug 5.24, Ug 5.25, Ug 5.34).
Associated with the clays are texture contrast soils with sandy-loam to clay-loamsurface soils commonly over a thin bleached A2~horizon to 10 to 30 cm. This overlies acommonly gravelly, coarse blocky or columnar, reddish-brown to greyish-brown alkaline claysubsoil, usually containing lime (Db 2.13, Dr 2.43, Dy 2.43).
Vegetation is brigalow with varying degrees of belah and some mulga and falsesandalwood. Belah tends to dominate on the texture contrast soils. Fertility status isfair to good except where the surface soil is acid. Salt contents may be fairly high.Strong gilgai development may restrict cultivation. As the land is usually flat and clayshave a fair water holding capacity, many areas are suitable for cereal crops where land canbe successfully prepared.

.30.
MAP UNIT 13
Some of the texture contrast soils in Unit 12 could be classed in this association.This Unit is usually closely associated with the grey clay association (Map Unit 12). Thesoils are deep texture contrast soils with a clay-loam surface 5 to 13 cm deep commonlyunderlain by a thin (< 3 cm) bleached A2~horizon. This is underlain by a brown to grey-brown, coarse blocky or prismatic brown to grey-brown, alkaline clay subsoil which maybecome acid at depth. Free gypsum and lime commonly occur in the subsoil (Db 1.33, Db 1.23,Db 1.13, Db 1.43).
Surface soil horizons have weak structure but clay subsoil structure is good.Drainage is fairly good and subsoils hold a fair range of available moisture. With a flattopography and only occasional slight gilgai micro-relief the soils are generally suitablefor cereal crops.
Vegetation of this group is normally belah, with some brigalow, mulga and falsesandalwood.
Fertility status is fair to good and subsoil salt may be moderate to fairly high.
4.2.7 Sandalwood-Poplar Box Soils
MAP UNIT 14
These soils occur on the outer fringes of the alluvial flats along MacintyreBrook and the Dumaresq River. Also drainage lines that flow through the grey clay gilgaiareas almost invariably have narrow fringes of these weakly solodized solonetz soils. Theyare deep texture contrast soils with a clay-loam surface soil 5 to 15 cm deep, commonlyunderlain by a thin (* 3 cm) bleached A2~horizon. The A2-horizon abruptly overlies a grey-brown to brown, columnar, prismatic or coarse blocky, alkaline, clay subsoil which maybecome acid with depth. Lime may occur in the alkaline, clay subsoil (Db 1.43, Dy 2.43).
Very shallow gilgai development is found in these soils. The poorly structured,low water holding capacity clay-loam surface and impermeable poorly drained clay subsoilsrestrict agricultural use of these soils.
Vegetation is characterized by the presence of sandalwood, and is usuallyaccompanied by poplar box and mulga. The soils normally have a short but fairly densegrass cover of CKloris spp.
The soil has a moderate fertility status with some subsoil salt accumulation.
4.2.8 Tea Tree-Spinifex Soils
MAP UNIT IS
These are very strongly alkaline soils, with a clay B-rhorizon of columnar
structure and free sodium carbonate, found around Yelarbon and called the Yelarbon 'desert'.Much of the area has a clay pan appearance due to the removal of the surface soil byerosion.
The soils are deep texture contrast soils with a hardsetting, grey to light grey-brown loam to clay-loatn surface soil commonly over a bleached A2~horizon to 7 to 10 cm.This abruptly overlies a coarse columnar, alkaline, clay subsoil (Dy 2.43). Towards themargin of the area, less alkaline soils occur which are similar to the dominant soil in MapUnit 6 (Dy 3.43).
This association supports a stunted community of tea tree, sandalwood, bulloak,and mallee box with spinifex very prominent.
Soil conditions are unsatisfactory for almost any crop growth. These are highlyalkaline soils with undesirably high amounts of sodium and magnesium. Free sodiumcarbonate may be present in the profile.

. 3 1 .
Definitions
Earths. Are so i l prof i les which gradually increase in clay content with depth.The texture differences between consecutive horizons or layers i s less than 1% texturegroups, while the- range of texture throughout the en t i re solum exceeds the span covered byone texture group ( e . g . , loam •+ clay-loam -* c lay) . For defini t ions of texture groups seeNorthcote (1974).
Texture Contrast Soils. Are so i l profi les which abruptly increase in clay contentat the boundary of the A and B-horizons. The distance from the bottom of the A-horizon(topsoil) to the top of the main B-horizon (subsoil) occurs over a ve r t i ca l in terval of10 cm or l e s s , and there i s a texture contrast of V-i texture groups or greater between theA and B-horizons ( e . g . , loam over c lay) .
4.3 SOIL CONSERVATION
Erosion
Both water and wind erosion occur in the Shire.
Erosion caused by rain water runoff is mainly confined to the sloping cultivatedland. The main types are sheet and r i l l erosion with some gullying in depressions wherewater concentrates.
Erosion caused by overflow flooding occurs on cultivated land adjacent to theDumaresq River, the Macintyre Brook and other major streams and water courses.
On grassland, water and wind erosion results when the land surace is denuded ofvegetation by overgrazing.
Wind erosion is mainly a problem of the lighter soil types (sands to sandy clay-loams) . It can be severe in cultivation paddocks void of surface cover. The longer thelength of the eroding surface, the worse the problem i s . With increasing length more andmore sand grains, transported by wind, bounce over the ground surface dislodging finer soilparticles which in turn are blown away.
Conservation Requirements
In 1972 it was estimated that of the 29 000 hectares of cultivated land in theShire, 11 500 hectares would require intensive soil conservation treatment. Most of theremaining 17 500 hectares of cultivation would require treatment of a simple and inexpensivenature. The total area of cultivated (crops, lucerne, and other sown pastures) land in theShire in 1976 was s t i l l approximately 29 000 hectares.
Although soil erosion problems in the grazing areas of the Shire do occur, themain recommendations for soil conservation here is to maintain, or establish and maintain,good permanent ground cover. There is probably also a needfor gully stabilization wherenatural water courses are unstable. In most cases however, the instability of watercoursesis a very difficult problem due to the very high erodibility of the subsoils in these areas.
Intensive Treatment
Intensive soil conservation treatment is interpreted as a combination of stubblemulching, broad grass-legume-crop rotations and contour cultivation supported by contourbanks at regular intervals.
This type of treatment applies to cultivated land on slopes steeper than threepercent and on slopes between one percent and three percent if these slopes are very long,especially where gullies have already developed.
Simple Measures
Simple soil conservation measures are interpreted as a combination of stubblemulching (or stubble incorporation in flood prone areas), broad grass-legume-crop rotations,strip cropping, contour cultivation with or without grass strips (sometimes with the supportof an occasional strategically placed structure) and contour renovation of pastures.

.32.
This type of treatment, where it concerns cultivation, applies to land on slopesof up to three percent. Strip cropping on sloping lace must confers closely to the contour,while strip cropping on flat land may be carried out on the app«*Jid»ate contour.
Conservation Work Completed
At May 1976 a total of 3335 hectares of cultivation land had been treated withintensive conservation measures. At the same time, on a total of 343 hectares of grassland,level lines had been marked which serve as a guide for contour pasture renovation.
Major Needs
The major conservation needs in the Inglewood Shire could be stated as:
(a) Resolution of crop residue management problems and the acceptance of residue surfacemulching techniques as one of the most important conservation measures to be adoptedon cropping land (particularly on the lighter soils which are subject to wind as wellas water erosion).
(b) Increased acceptance of the need and adoption of the practice of broad grass-legume-crop rotations related to the various soil types in the area.
(c) Acceptance of the fact that practices such as (a) and (b) are the backbone ofconservation in the Shire. These practices where necessary supported by contourworking, contour grass strips, contour banks or strip cropping or a combination ofthese improve the ability of a soil to absorb and store water. The availability ofstored moisture for plants is also increased.
(d) Acceptance of the need to consider ground cover, shade, shelter and wind brakes as animportant part of grazing management.
Future Development and Redevelopment
When planning the development of a property it should be determined, in the firstplace, how different types of land and different soils on the property can be best and mostsafely utilized. On the basis of a land capability assessment of each different parcel ofland the type of enterprise and land use can be decided upon. Also, appropriate soilconservation measures can be planned to overcome the erosion hazard or potential hazardconnected with a specific land usage. Land capability, type of land use and soilconservation measures to be adopted have a deciding effect on the property layout, e.g.,location of fences, watering points, stock and vehicle access, etc.
Land Capability and Land Use
Land capability classification is the basis for land use planning. Land is madeup of areas of different production potential, i.e. land capability units or land classes.
When classifying land it is necessary to determine the limitations to agriculturalproduction for each land unit. The kind and severity of these limitations determine thetype of land use a particular land unit is best suited to. The form of land use thatensures long term productivity is the one which should be practised.
Knowing the limitations of each land unit and the degree of erosion hazard toovercome, a selection of conservation measures can be prescribed.
Under the system of land capability classification adopted in Queensland, eightmain classes are recognized. These classes are grouped into three broad classifications ofuse called land capability divisions. The eight classes fall into these three divisionsand are shown in Table 4.1.
Limiting Pastors
Factors affecting land capability are:
Available moisture holding capacity of the soil.Effective soil depth.

.33.
Soil physical factors affecting crop growth.Soil nutrient fertility.Soil salinity or sodicity.Topography.Soil Workability.Rockiness or Stonlness.Surface microrelief (e.g., gilgai and gullying).Wetness.Susceptibility to water erosion.Susceptibility to flooding.Susceptibility to wind erosion.
The combination of limiting factors, but especially the severity of thelimitations, determine the class of the land.
Table 4.1
Land Capability Divisions and Classes
Land Capability Divisions
Land Suitable'for Cultivation
Land not Suitable forCultivation but Productive
Land not Suitable forCultivation or Grazing
Land.
ClassClassClassClass
Class
Class
Class
Class
Capability Classes
IIIIIIIV
V
VI
VII
VIII
No special practices neededSpecial, but simple, practices neededComplex or intensive practices requiredSuitable for occasional or limitedcultivation only
Good land but with obstructions tocultivation not practical to remove(e.g., gilgais)Moderately susceptible to deterioration,therefore requiring some restrictions inuse (moderate grazing)Highly susceptible to deteriorationtherefore requiring severe restrictions inuse (light grazing)
Suitable only for wildlife reserves andwatershed protection
- A Land Capability Classification for AgriculturalSource: Rosser, et al. (1974)Purposes
Patterns of Land Capability
For a broad land capability classification of the Shire, reference is made to theLand Capability Map (Map 5 ) . The basis of this map is the Land Capability Map of TheGranite and Traprock Area of South-East Queensland by A.K. Wills (Division of LandUtilization, Queensland Department of Primary Industries) which has been extended to coverthe western part of the Inglewood Shire. Some modifications have been made to the originalto suit the author's interpretation of the peculiarities of the Shire area.
The intention of this section is to highlight and explain the main variations inland capability within the Shire.
Class II land is found on the flood plains of Canning Creek and the MacintyreBrook. The main limitations to cultivation are occasional wetness and flooding. Soilphysical problems and workability restrictions of the soils of older terraces and leveeslopes of the Macintyre Brook, can be so severe that some areas would have to be downgradedto Class III and IV. Also the risk of severe flood damage could put low lying areas andnarrow depressions into Class III or IV.
Class II land is also found along the western boundary of the Shire north ofYelarbon. This is the low sloping brigalow-belah country in that area. The mainlimitations are slight water erosion and a slightly restricted available moisture holdingcapacity of the soil. Severe gilgai and wetness downgrade some parts within this area toClass V.

.34.
Class II to III areas are mainly on the Dumaresq flood plain with a few minoralluvial strips along Oakey, Nanny and Bracker Creeks. The erodible surface structure ofthe soil combined with some relief make them slightly tc moderately erosion prone. Therisk of severe flood damage downgrades some areas into Class III or IV.
Class III land occurs east-north-east of Inglewood. This is brigalow-belahcountry where erosion risk is the main limitations arising out of moderate slopes or longslopes which allow runoff water to concentrate. The lower areas with severe gilgai are ofClass V. Other Class III areas are found along a number of watercourses. Susceptibilityto water erosion often combined with shallow effective soil depth, susceptibility toflooding and poor surface soil structure is the main limitation here.
Class III to IV and IV country is similar in its limitations to the previousclass but stoniness is also significant. The difference between Class III, III to IV andIV is mostly in the degree of the limitations.
Class V land is very strongly gilgaied brigalow country. Wetness is the mainlimitation. As land levelling has for a number of years an adverse effect on theproductivity of the soil and is also costly. The economics of it do not favour cultivation.
Class IV to VI land is concentrated around Warroo and Limevale. The main hazardis erosion through poor soil structure, but occasionally complicated by long slopes andlocation relative to steeper land units which discharge concentrated runoff onto theselower units. Soil depth, stoniness and poor moisture holding characteristics are alsolimitations in some areas. This is the last unit In which there is any chance of successfulcultivation. However, this can only be conducted under careful controls to preventdeterioration of the land resource.
Class VI land is found mainly in the sandstone country north and south-west ofCoolmunda Dam and between Limevale and Clarinda Station and Limevale and Magee Station.This is the better class of grazing land and is limited by the erosion potential of itsshallow, stony, poorly structured soils.
Classes VI to VII, VII and VII to VIII are the lower grazing classes. They aresuccessively more restricted for mainly the same reasons- as Class VI. The traprock area ingeneral and the sandstone country in the western sector of the Shire fall in this categoryof land classes.
Strictly speaking, the deeper sandy soils of the sandstone country of the Shireare arable soils and some areas are cleared and cultivated for crops, or for improvedpasture establishment. However, the overall very low nutrient fertility of these soilscombined with a very low waterholding capacity and a very high wind erosion potential makesthis an unsafe and uneconomic proposition.
Timber production is really the only suitable form of land use but care should betaken that forestry tracks do not wash out.
Another problem in clearing this land is timber regrowth. To control it, itbecomes necessary to cultivate for several years during which time couch grass invades.
Improved species do not persist because of the element deficiencies of the soil.Fertilization of improved pastures under similar soil and climatic conditions has proveduneconomical.
If the end result of timber clearing is regrowth or a solid mat of couch grassafter a period of cultivation, the expenditure would certainly not be warranted. In theprocess severe erosion by wind or water or both is likely to occur. Contour banking forwater erosion control would be another heavy cost.
Class VIII land has negligible productive potential. The land is often ruggedand inaccessible. To ensure stability of this land, the vegetation should be preserved.
it.it AREAS AVAILABLE FOR FUTURE DEVELOPMENT
The solodic soils are the only extensive areas within the Shire that have notbeen developed to any extent.

.35.
The hesitancy to develop these soi ls in the past has been justified because of thenumerous problems often associated with these areas once cleared of original timber. Apartfrom the very low ferti l i ty and low water holding capacity of these soi ls , the main problemsfollowing clearing are their vulnerability to wind and water erosion and timber regrowth.Fortunately, a large percentage of this country is in State Forest Reserves and perhaps inreality it is a pity the remainder of the solodic soils were not also included as Stateforest reserve. These soi ls are more suited to timber production than agricultural orpastoral pursuits.
Future development is expected to be confined to the deeper, more arable sandysoils within the solodic group for specialist cropping. Apart from the above problems, thehigh development costs and low potential of the country prohibit large scale developmentfor agricultural crops or pastures. The other major areas, namely the alluvial f lats ,brigalow and traprock country are reasonably well developed and further development willdepend on technological and economic changes.
Sources of Information
1. Isbell, R.F. (1957) - The soils of the Inglewood-Talwood-Tara-Glenmorgan region,Queensland. Queensland Bureau of Investigation Technical Bulletin Ho. 5
Isbel l , R.F. et a l . (1967) - Atlas of Australian Soils, Sheet 4,- Brisbane-Charleville-RocWiampton-Clermont area. With explanatory data. C.S.I.R.O. Australia. MelbourneTTTH W » I * ^ f" v Pi"pfie
2. Isbell, R.F. et al.RocJdiampton-ClenUniversity Press
3. Northcote, K.H. (1966) - Atlas of Australian Soils, Sheet 3. Sydney-Canberra-Bourke-Armidale area. With explanatory data. C.S.I .R.O. Aus tra l i a . Melbourne Univers i tyPress
4 . Northcote, K.H. (1974) - A factual hey for the recognition of Australian soils (4thed). Rellim Tech. Publr Adelaide. S.A.
5. Powell, B. (1976) - 'Soils of the Granite and Traprock Area1 In Wills, A.K. (Ed) -The Granite and Traprock Area of South-east Queensland - A Land Inventory and LandUse Study. Queensland Department of Primary Industries. Division of Land UtilizationTechnical Bulletin No. 13
6. Rosser, J. et al . (1974) - A Land Capability Classification for Agricultural Purposes.Queensland Department of Primary Industries, division of Land Utilization TechnicalBulletin. No. 14
7. Wills, A.K. (1976) - 'Land Use and Land Capability in the Granite and Traprock Area'.In Wills, A.K. (Ed). The Granite and Traprock Area of South-East Queensland.Queensland Department of Primary Industries. Division of Land Utilization TechnicalBulletin No. IS

. 3 6 .
5 . VEGETATION AND FAUNA
5.1 INTRODUCTION
The vegetation of parts of the Shire has been described by Isbell (1957) andPedley (1976). Map 2 shows the distribution of vegetation in Inglewood Shire.
In the western part of the Shire plant communities are similar to those of largeareas of inland Queensland, but the vegetation of the southern part (and the adjacentportion of the Stanthorpe Shire) shows a distinct affinity with that of the north-westernslopes of New South Wales and not with other parts of Queensland. Large areas ofEucalyptus microcarpa and E. albens are found only in this part of Queensland.Floristically the area is also unusual. For example, Acacia flexifolia, A. lineata andA. mantana reach the northern limit of their ranges a little south of Inglewood.
The Shire is relatively flat with hills reaching 700 metres in the eastern partof the Shire with a gradual slope to the west. There is a decrease in annual rainfall fromabout 700 mm at the headwaters of Macintyre Brook to about 600 mm at Yelarbon. Theoccurrence of distinct plant communities is not correlated with topography and elevation orwith climatic factors, but in general there is a definite relationship between the natureof the soils of the Shire and the plant communities.
Structurally (Specht, 1970) the vegetation ranges from open-forest to small areasof heath (near Inglewood) and hummock grassland (near Yelarbon). Natural grassland ofeconomic importance does not occur.
White settlement of the Shire took place in the 1850s and since then all plantcommunities have been altered to some extent. Large areas of fertile land have beencompletely cleared and are cultivated. Much of the remainder of the Shire has been clearedor partly cleared for grazing; and selective logging of areas now reserved as State forestshas altered the composition of communities which are otherwise untouched. Preferentialgrazing of palatable species and frequent burning to control unwanted woody plants hasdrastically altered the ground vegetation. Periodic fires must have been an ecologicalfactor of some importance in eucalypt communities prior to the colonization of Australia byman and the exclusion of fire from areas now reserved as State forests has probably alsoaffected the vegetation.
5.2 VEGETATION ASSOCIATIONS
An attempt has been made to describe plant communities as they probably werebefore disturbance. Detailed information is often lacking and the communities are thereforebroadly defined. The map of the vegetation has been adapted from the vegetation map ofPedley and the soils map, and associated description of vegetation, Isbell.
5.2.1 Woodland
Eucalyptus crebra - E. dealbata
This woodland association predominates usually on upper slopes of traprock areasin the east of the Shire. The upper stratum 10 to 15 metres tall consists of equalproportions of E. avebra and E. dealbata. Occasionally on gentler slopes E. creba up to 25metres tall predominates and in places along the Herries Range E. sideroxylon and E. exsertavar. parvula occur.
The understory is usually not dense, but there are sometimes low trees ofCallitris columellaris and between Inglewood and Texas Acacia sparsiflora. A well developedshrub layer of Oleavia elliptica, Jacksonia scoparia and Acacia spp. occasionally occurs.
Eucalyptus crebra - Angophora costata
Unlike the community described above, this is usually a definitely layered wood-land. The composition varies considerably from place to place but the upper stratumconsists of about equal amounts of E. cvebva and A. costata 20 to 25 metres tall. Casuavinaluehmannii almost invariably predominates in a lower tree layer about 10 metres high, oftenwith significant quantities of Callitvis columellaris. The shrub layer which is often denseis rich in species, Acacia spp. (particularly A. deanei, A. ixiophylla and A. semilunata)

.37.
Daoiesia spp. and Leucopogon spp. predominate. Ground cover is low.
Eucalyptus melanophloia
Woodland 12 to 18 metres tall of E. melanophloia and occasional Angophorafloribunda are widespread on traprock in the southern part of the Shire, usually onintermediate slopes. On upper slopes E. dealbata is a conspicuous component of thecommunity. Callitris columellaris forms a slightly lower patchy understory, probably muchmodified by fire. Shrubs of Oleapia elliptica and Cassinia laevis sometimes occur on upperslopes but a shrub layer is not well developed except in a small area near Bonshaw whereCadellia pentastylis, Geijera parviflora and Carissa ovata occur. Ground cover ofBothriochloa deaipiens, Aristida ramosa and Cymbopogon refractus is sparse.
The community grades into the E. microcarpa-E. melliodora association on lowerslopes and E. melliodora is sometimes present.
Near Inglewood there are small areas of E. melanophloia-Callitris columellariswoodland with a shrub layer of Geijera parviflora and ground cover of Viohanthium sericewn.These are found only on basalt and are rather different in aspect and composition fromother woodlands of E. melanophloia.
Eucalyptus populnea
E. populnea shrub woodland covers wide areas of inland Queensland. In InglewoodShire it only occupies a small area on the western part, mainly only the Dumaresq River andMacintyre Brook, and most of it has been cleared.
E. populnea 10 to 20 metres tall, with occasional patches of E. melanophloia formsa rather open woodland often with scattered lower trees of Acacia excelsa and a patchyshrub layer of Geijera parviflora, Eremocitrus glauca and Eremophila mitchellii. The lastspecies are often pests in grazing land. The ground cover has been much modified.Bothriochloa decipiens and Aristida spp. predominate with occasional patches of Dichxnthiwnsericeum and Chlcris divaricata.
Around Inglewood Eucalyptus pilligaensis is a conspicuous tree in an area whichis transitional to the E. microcarpa-E. melliodora community described below.
Eucalyptus microcarpa - E. melliodora
Only remnants of this association remain. The upper stratum of E. microcarpaalone or of E. microcarpa and occasional E. melliodora is 10 to 20 metres tall. Over mostof its range there are few shrubs in the community, but Acacia ixiophylla and/or Cassinialaevis sometimes form a dense layer one to two metres tall.
The ground cover is moderately dense and fairly uniform in composition. The mostconspicuous species are Bothriochloa decipiens, Cymbopogon refractus, Danthonia linkii andDichelachne micrantha.
Eucalyptus albens
E. albens occurs throughout the traprock area, but is usually only a minorcomponent of the vegetation. In the area drained by Bracker Creek however, a distinctwoodland of E. albens occurs on intermediate slopes. On upper slopes it merges with E.crebra woodland and on the lower slopes with E. microcarpa-E. melliodora woodland.
Structurally it resembles the E. microcarpa-E. melliodora association though onlyscattered subshrubs, Pinelea parviflora and Olearia elliptica occur. Ground cover issimilar to that of the previous community.
In the rugged country at the headwaters of Bracker Creek, E. albens,E. melanophloia and E. dealbata form a woodland with a dense understory of Aaaeia leioaalyxand Dodonaea attenuata.

.38.
5.2.2 Open Forest
Acacia harpophylla - Casuarina cristaba
The western part of the Shire might be considered part of the 'brigalow lands'.Almost all of the original vegetation has been cleared, and the description below has beenderived from small relict patches all of which are disturbed to some extent.
The upper stratum consists of Acacia harpophylla and Casuarina cristata with awell developed shrub layer of Geijera parviflora, Eremophila mitchellii and less commonlyE. maaulata and Carissa ovata. The ground cover consists of short palatable grasses, mostlyPaspalidium spp. and Chloris divaricata, and forbs (JSnchylaena tomentosa, Atriplex spp.,etc.).
After clearing Dichanthium sevicewn usually becomes dominant.
Areas shown on the map as woodland of Eucalyptus populnea often include smallareas of Acacia harpophylla open-forest.
5.2.3 Grassland
Open Humnock Grassland
A floristically and structurally interesting association occurs on the so-called'desert' area surrounding Yelarbon. The community is developed on alkaline texturecontrast soils with a shallow A-horizon.
The vegetation consists of large separate clumps of Triodia irvitans var.laxispicata often separated by bare areas where the surface soil has been eroded. Scatteredsmall low trees of Melaleuca adnata and Eremophila mitchellii occur.
Miscellaneous
South of Inglewood there are areas, too small to map, of heath. This consists ofa dense shrub layer chiefly of Leptospenmm spp. with scattered low mallee eucalypts,Eucalyptus viridis and E. bakeri. Heath-like vegetation of different composition alsooccurs south of Coolmunda Dam on sandy soi ls , but these have been largely cleared.
Species Mentioned in Text
Acacia deanei, Green Wattle Dichelachne micrantha, Plum grassA. excelsa, Ironwood Dodanaea attenuata, a Hop BushA. flexifolia Echylaena tomentosa, Berry SaltbushA. harpophylla, Brigalow Evemocitrus glauca, LimebushA. ixiophylla Eremophild maculata, FuschsiaA. leiocalyx E. mitchellii, SandalwoodA. lineata Eucalyptus albens, White BoxA. montana E. bakeri, Baker's MalleeA. semilunata E.' crebra, Narrowleaved IronbarkA. sparsiflora E. dealbata, Mountain Gum or Tumbledown GumAngophora costata, Rusty gum E. exserta var. parvulaA. floribunda, Rough-barked Apple E. melanophloia, Silver leaved IronbarkAristida ramosa, a Wire grass E. melliodora, Yellow BoxAtriplex spp., Saltbushes E. micvocarpa, Brown BoxBothriochloa decipiens, Pitted blue-grass E. pilligaensis, Mallee BoxCadellia pentastylis, Ooline E. populnea, Poplar BoxCallitris columellavis, Cypress Pine E. sideroxylon, MuggaCarissa ovata, Currant Bush E. viridis, Green MalleeCassinia laevis, Cough Bush or Wild Rosemary Geijera parviflora, WilgaCasuarina cristata, Belah Jacksonia scoparia, DogwoodC. luehmannii, Bulloak Leucopogon spp., Beard HeathsChloris divaricata, Windmill grass Melaleuca adnata, a Tea TreeCymbopogon refractus, Barbed-wire grass Olearia elliptica, Peach Bush or Sticky Daisy BushDanthonia linkii Paspalidium spp., Brigalow grassesDaviesia spp. Pimelea paucifloraDichanthium sericeum, Queensland Blue grass Iriodia irritans var. laxispicata, a Spinifex

.39.
5.3 POINSONOUS PLANTS
Plants poisonous to stock in the Shire include many of those discussed inSection 7.4, Weeds of Crops and Pastures. Their names are set out below.
Common Name
Bathurst burrcrownbeardclimbing buckwheatcurled docksdeadnettledodderEuropean bindweedflannel weedgreen amaranthcotton bushmarshmallowmexican poppymintweednoogoora burrpigweed (black)rockfernrosemary bush or cough bushspiny emexthornapplevariegated thistlewireweed
5.4 FAUNA
Botanical Name
Xanthiwn spinosumVerbesina encelioidesPolygonum convolvulusRurmx spp.Lamium amplexioauleCuscuta epithymumConvolvulus arvensisSida spp.Amaranthus viridisKoehia spp.Malva spp.Argemove oehvoleucaSalvia veflexaXanthium pungensTrianthema portulacastimmCheilanthes sieberiCassinia laevisEmex australisDatura spp.Silybum mavianwnPolygonum aviaulare
The mammal and bird fauna of Inglewood Shire consists entirely of species widelydistributed throughout eastern Australia, and includes some 25 mammal species and more than120 species of birds. Six members of the kangaroo family occur, of which the grey kangaroo,the wallaroo and the red-necked wallaby are abundant and generally regarded as pests by thegrazing community. The introduced rabbit is widespread, and during dry years isparticularly troublesome. The feral pig is another unwelcome introduction. Among thebirds, the Shire represents the eastern boundary of the range of several species includesthe emu and the red-winged parrot. The attractive turquoise parrot occurs commonly, andthe wedge-tailed eagle is one of the several raptorial species common in the Shire.
Coolmunda Dam has proved to be a significant addition to the waterfowl habitat ofthe Shire, and a wide range of waterbirds are associated with it including the pelican andmost of the duck species found in southern Queensland with the wood duck probably the mostabundant. During dry times, particularly, the dam serves as a valuable drought refuge forwetland species.
Spec-ies Mentioned in the Text
grey kangaroowallaroored-necked wallabyrabbitPig
Maeropus giganteusM. robustusM. TufogviseusOryctolagus cunioulusSus scrofaDromaius novaehollandiae
red-winged parrotturquoise parrotwedge-tailed eaglepelicanwood duck
Aprosmictus erythropterusNeophema pulchellaAquila audaxPelecanus conspicillatusChenonetta jubata
As mentioned in Section 1.2, rabbits are a significant economic problem to thegrazing industry of the Shire. Early control was by netting of paddocks, trapping,poisoning or fumigating, and finally ripping up of the burrows. This was a costly and timeconsuming task, but was the only effective means of control. Myxomatosis initially provedmost effective, but unfortunately, resistance developed fairly quickly. In recent years,control has revolved around che use of a poison '1080' (sodium fluoracetate) distributed asa bait, followed by ripping of the burrows. Rabbit control is organized through the RabbitBoard, a section of the Land Department, which is responsible for rabbit control within theShire.

.40.
Sources of Information
1. Isbell , R.F. (1957) - The soils of the Inglewood-Tara-Glenmorgan region, Queensland.Queensland Bureau of Investigation Technical Bulletin No. S
2. Pedley, L. (1976) - 'Vegetation of the Granite and Traprock Area1, In Wills, A.K. (Ed)The Granite and Traprock Area of South-East Queensland. Division of Land UtilizationTechnical Bulletin No. 13. Queensland Department of Primary Industries. Brisbane
3. Specht, R.L. (1970) - 'Vegetation' In The Australian Environment. 4th ed. C.S.I.R.O.Melbourne University Press
4. Everist, S.L. (1974) - Poisonous Plants of Australia. Angus and Robertson. Australia
5. Kirkpatrick, T.H. (1976) - 'Fauna of the Granite and Traprock Area' In Wills, A.K. (Ed)The Granite and Traprock Area of South-East Queensland. Division of Land UtilisationTechnical Bulletin No. IS. Department of Primary Industries. Brisbane.
6. National Parks and Wildlife Service, Hermitage, via Warwick
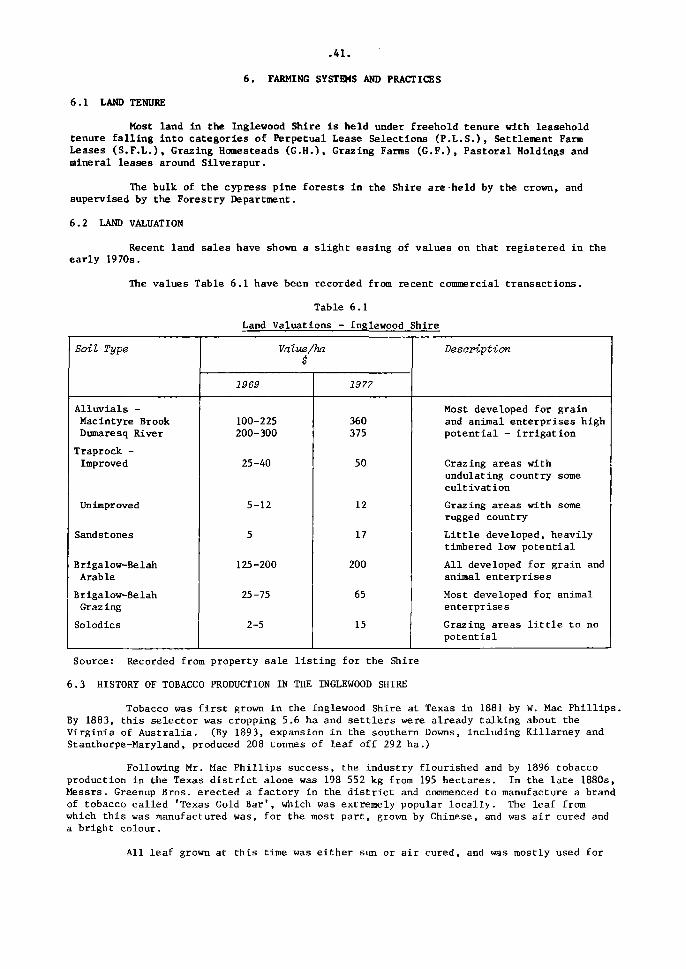
.41.
6. FARMING SYSTEMS AND PRACTICES
6.1 LAND TENURE
Most land in the Inglewood Shire is held under freehold tenure with leaseholdtenure falling into categories of Perpetual Lease Selections (P.L.S.), Settlement FarmLeases (S.F.L.), Grazing Homesteads (G.H.), Grazing Farms (G.F.), Pastoral Holdings andmineral leases around Silverspur.
The bulk of the cypress pine forests in the Shire are held by the crown, andsupervised by the Forestry Department.
6.2 LAND VALUATION
Recent land sales have shown a slight easing of values on that registered in theearly 1970s.
The values Table 6.1 have been recorded from recent commercial transactions.
Table 6.1
Land Valuations - Inglewood Shire
Soil Type
Alluvials -Macintyre BrookDumaresq River
Traprock -Improved
Unimproved
Sandstones
Brigalow-BelahArable
Brigalow-BelahGrazing
Solodics
Value/ha$
1969
100-225200-300
25-40
5-12
5
125-200
25-75
2-5
1977
360375
50
12
17
200
65
15
Description
Most developed for grainand animal enterprises highpotential - irrigation
Grazing areas withundulating country somecultivationGrazing areas with somerugged countryLittle developed, heavilytimbered low potentialAll developed for grain andanimal enterprisesMost developed for animalenterprisesGrazing areas l i t t l e to nopotential
Source: Recorded from property sale listing for the Shire
6.3 HISTORY OF TOBACCO PRODUCTION IN THE INGLEWOOD SHIRE
Tobacco was first grown in the Inglewood Shire at Texas in 1881 by W. Mac Phillips.By 1883, this selector was cropping 5.6 ha and settlers were already talking about theVirginia of Australia. (By 1893, expansion in the southern Downs, including Killarney andStanthorpe-Maryland, produced 208 tonnes of leaf off 292 ha.)
Following Mr. Mac Phillips success, the industry flourished and by 1896 tobaccoproduction in the Texas district alone was 198 552 kg from 195 hectares. In the late 1880s,Messrs. Greenup Bros, erected a factory in the district and commenced to manufacture a brandof tobacco called 'Texas Gold Bar', which was extremely popular locally. The leaf fromwhich this was manufactured was, for the most part, grown by Chinese, and was air cured anda bright colour.
All leaf grown at this time was either sun or air cured, and was mostly used for

.42.
pipe smoking, it being of a heavier class than that used for cigarettes. The bulk of thetobacco was produced by Chinese operating on the share system, the crop mostly being plantedon rich alluvial flats.
In 1900, a tobacco expert, Mr. Neville from Kentucky, U.S.A., was appointedtobacco expert for Queensland, and experiments in fire curing of tobacco were conducted bythis officer on a Government farm at Texas.
A well known tobacco manufacturing firm, the British Australasian Tobacco Company,was attracted by the success of cultivation of tobacco in the Shire. In 1910 this companypurchased land at Texas for the purpose of growing tobacco by white labour on wages, undersupervision of the Company's expert. Fire curing, air curing, flue-curing systems weretried, but the project was abandoned after a few years owing to labour difficulties andunfavourable climatic conditions, together with the ravages of blue mould.
The area cultivated for tobacco from this time waned considerably as growers didnot adopt fire curing and were loathe to introduce flue-curing. The same decline in theindustry took place elsewhere and may be attributed in a large measure to the change inpublic taste commonly experienced in all English speaking countries, when light, brighttobacco was sought after. This change, and the inauguration of flue-curing methods in lieuof the old or air drying methods of curing, revolutionized the industry. It then becamenecessary to give attention to the production of light, bright, tobacco leaf, suitable forflue-curing and this necessitated a drastic alteration in the practices previously adopted,which involved a changeover from the fertile soils to the sandy soils and light sandy loamsof medium to low fertility, and the more general use of artificial fertilizers. Thischange commenced in 1930-31 and the area under tobacco rapidly increased throughoutQueensland. Perhaps the most important factor in bringing about this sudden increase, wasthe rapid rise in Import duty on tobacco leaf in 1930, from three shillings and sixpence tofive shilling and tuppence, plus a primary duty of 10 percent. Other forms of primaryindustry were also feeling the effects of financial depression. At this time, growers inthe Texas district turned their attention to the less fertile types of soil and the Chinesesharefarming was replaced by the employment of a large number of white persons.
The first peak in production was in 1932 when 670 hectares were planted. As wasto be expected however, a large proportion of the leaf was of inferior quality, owing tothe fact that many growers persisted in planting on unsuitable soil and also to theinexperience of a large number of new growers in tobacco cultural and flue-curing practices.This sudden boom was destined to halt due to the incidence of disease as well as theincreasingly limited demand for low grade leaf. Persons endeavouring to produce leaf onunsuitable soils discovered, to their cost, that the industry (for them) was not profitable,and the inefficient grower was forced out of the industry for the same reason. This passingof both classes from the ranks of tobacco growers proved to be a big step in placing theindustry on a more stable footing. With the passing of the boom period, the industrybecame stabilized and in the mid-1930s, leaf from the Texas district was the best to thatdate.
Production was then confined mostly to the Dumaresq River and Macintyre Brook,where crops were grown under irrigation. In 1936-37, an estimated 86 growers cultivated237 hectares for flue-curing and 14 growers 28 hectares for sun and air curing. Districtyield was 204 000 kg. District production figures are presented in Table 6.2.
One report, written in the early 1930s predicted that 'while the more fertilesoils of the alluvials of the Dumaresq River and the Macintyre Brook can be expected to growheavy crops under irrigation, advantage in that direction is offset by a greatersusceptibility to blue mould disease and liability to damage from hail storms.
'Tobacco lands in the Texas district are, it is understood, available around fivepounds per acre - less for some unimproved. . . Variations will be decided by the amountsof improvements - clearing, grubbing, fences, buildings, etc. In the Texas district flue-curing barns are made of cypress pine logs, as are also bulk barns. Those 16 x 16 x 16cost in the vicinity of 70 pounds each complete by contract. Bulk shed, according to size,would be from 50 pounds to 100 pounds. There is a number of barns on unsuitable land thatcould be bought cheaply for removal. Including the purchase price and cost of transport,it is thought that these barns could be erected at a cost of not more than 50 pounds eachcomplete.

.43.
'An irrigation plant is a necessity in the Texas district, as the rainfall isusually insufficient and unreliable. The installed cost of a plant for, say, 10 acreswould be 100 to 120 pounds, that of ditches being extra.'
History has shown therefore, that the main reasons for the fluctuations andinstability in the industry were lack of water, the depredations of insect pests anddiseases and unsuitability of soils. The incidence and intensity of summer rains was fartoo erratic to afford any stabilization in production. Only those farms adjacent to themain streams had any access to irrigation and persisted. The farms in the hilly areas awayfrom the streams simply closed down. In those early years growers were not equipped withtodays sophisticated equipment and chemicals with vhich to keep pests and diseases in check.Many of the soil types then in use had poor internal drainage and waterlogged readily whenthe rains did eventuate.
Since the 1930s, the persistence of tobacco production has been the direct resultof the development of irrigation schemes.
For 30 years before 1960 the 'Texas district' ranked second in importance toMareeba-Dimbulah in tobacco production. During this period, a number of weirs, WhetstoneWeir (1951), Bendor Weir (1954) and Greenup Weir (1958) on the Macintyre Brook; andCunningham Weir (1954), Bonshaw Weir (1958) and Glenarbon Weir (1959) on the Dumaresq River,were constructed to provide limited supplies of water for irrigation.
In 1968 Coolmunda Dam.was opened on the Macintyre Brook, and in 1976 Glenlyon Damwas opened on Pike Creek, a tributary of the Dumaresq River. These major storages haveimproved both the quantity and quality of water available for irrigation; the downstreamweirs now providing for intermediate control of water supply.
Since 1932, with irrigation and the sharefanning system, area planted to tobaccoin the Shire increased to a second peak of 983 hectares in 1960. Severe marketing problemsin that year culminated in a dramatic decrease in area to 120 hectares and many sharefarmersmigrated from the district. These price reductions were a result of increased production oftobacco in other areas of the State, and greater selectivity by buyers for qualityrequirements. The variable chloride content of tobacco grown on the Macintyre Brook,especially in dry seasons, was the main argument in buyer resistance.
Production has now stabilized at a district quota of 481 tonnes produced offabout 300 hectares on 46 registered properties, following the introduction of aStabilization Scheme in 1965. A move to better soil types and improved production methodshave accompanied this stabilization.
6.4 FARMING SYSTEMS
6.4.1 Introd uct ion
Rural production systems in the Shire range from intensive complex systemsinvolving multiple enterprises to more extensive type systems specializing in one or twoenterprises.
The more intensive farming systems are based on land adjoining Macintyre Brook andDumaresq River and use irrigation. They represent about one-third of the total number ofholdings in the Shire.
The remainder of the agricultural land in the Shire is used predominantly forsheep and beef grazing, with extensive grain growing as a sideline on the more suitablesoils.
The area east of a line running north-south from Oman-ama to Beebo, which ispredominantly 'traprock' country, is traditionally fine wool producing country. In recentyears some diversification into beef cattle has taken place. West of this line, which ispredominantly 'brigalow-belah' and cypress pine country, has been and still is traditionallybeef cattle and grain growing country.
Map No. 3 shows land use in Inglewood Shire indicating areas predominantly beef,predominantly sheep and a mixture of beef and sheep. Areas under State Forest Reserve arealso shown.

.44.
Table 6.2
Tobacco Production - South-West Queensland
Year
189618971898189919001901190219031904190519061907190819091910191119121913191419151916191719181919192019211922
Areaha
19523521127223528028930927530423917224518820320320918915910457643966494948
Product ion
198 588210 984139 557300 499169 986254 87892 05529 821
311 676403 680286 721111 512237 213157 067324 179191 72669 950
154 420214 70649 42642 99915 82917 76546 67925 19946 80552 044
Year
19231924 l
1925 I192619271928192919301931193219331934193519361937193819391940194119421943194419451946194719481949
Areaha
8122223840485217
27366933414328326226526 3277215333243435353243260328236220
Production
72 08732 84732 84739 98640 84040 61379 6 7620 30159 586
307 450219 677
39 643113 399242 674204 119242 438296 415240 232378 455226 174482 068311 217226 174264 886395 602182 738284 648
Year
195019511952195319541955195619571958195919601961196219631964196519661967196819691970197119721973197419751976
Areaha
307419514478521622655799903916891984478590484266121157177217269312395346282290325
Production
372 902199 133589 676530 593640 368603 685148 206660 971802 099583 652960 275683 387269 937507 615362 377254 755124 897203 798260 572306 078352 908383 254485 737487 291508 881475 555370 309
Source: : Head Office f i les , Department of Primary Industries - 1896-19372 Stat is t ical Register of Queensland - 1938-19423 Queensland Agricultural Journal (August 1952) - 1943-1952h Tobacco Leaf Marketing Board - 1953-1976
1 The similarity in data here probably is the result of an original compilation error
There are very few properties with a single enterprise farming system. Theprinciple identifiable systems with combined enterprises in Inglewood Shire can be classedunder the following headings:
(a) Intensive agriculture - tobacco, beef, lucerne, grain, horticulture
- grain, lucerne, beef, horticulture
(b) Sheep and beef
(c) Beef and grain
(d) Other systems (dairying and pig raising)
Table 6.3 shows rural holdings in Inglewood Shire classified according topredominant activity in selected years to 1973-74. Table 6.4 shows activit ies on ruralholdings and Table 6.5 shows rural establishments classified to predominant activity in1975-76.
6.4.2 Intensive Farming Systems
Tobacco, Beef, Lucerne, Grain, Horticulture
These properties have a complete reliance on irrigation, and are scatteredthroughout the irrigation areas of the Shire. The major crop grown on these holdings istobacco. Annual tobacco quotas range from 2900 kg to 47 550 kg per farm.
Property size varies from 20 hectares to 2900 hectares, with an average of about
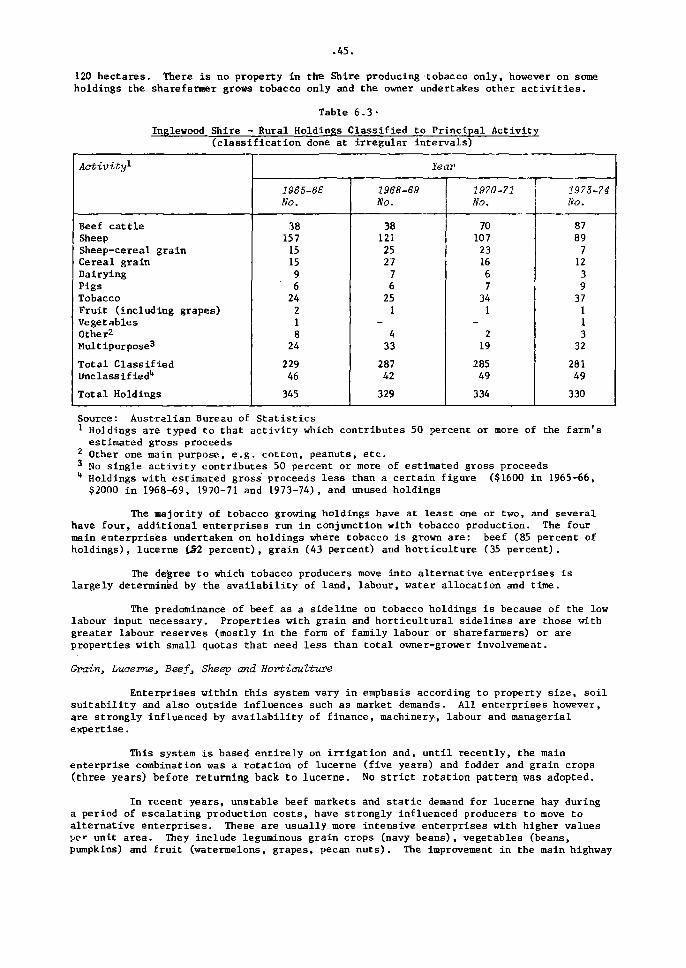
.45.
120 hectares. There is no property in the Shire producing tobacco only, however on someholdings the sharefarraer grows tobacco only and the owner undertakes other activities.
Table 6.3-
Inglewood Shire - Rural Holdings Classified to Principal Activity(classification done at irregular intervals)
Activity^
Beef cattleSheepSheep-cereal grainCereal grainDairyingPigsTobaccoFruit (including grapes)VegetablesOther2
Multipurpose'
Total ClassifiedUnclassified1*
Total Holdings
Year
1985-66So.
38157
151596
24218
24
22946
345
196S-69No.
381212527
76
251
-4
33
28742
329
1970-71No.
70107
231667
341
-2
19
28549
334
1973-74No.
8789
712
39
37113
32
28149
330
Source: Australian Bureau of Statistics1 Holdings are typed to that activity which contributes 50 percent or more of the farm'sestimated gross proceeds
2 Other one main purpose, e.g. cotton, peanuts, etc.3 No single activity contributes 50 percent or more of estimated gross proceeds"* Holdings with estimated gross' proceeds less than a certain figure ($1600 in 1965-66,$2000 in 1968-69, 1970-71 and 1973-74), and unused holdings
The majority of tobacco growing holdings have at least one or two, and severalhave four, additional enterprises run in conjunction with tobacco production. The fourmain enterprises undertaken on holdings where tobacco is grown are: beef (85 percent ofholdings), lucerne iS2 percent), grain (43 percent) and horticulture (35 percent).
The degree to which tobacco producers move into alternative enterprises islargely determined by the availability of land, labour, water allocation and time.
The predominance of beef as a sideline on tobacco holdings is because of the lowlabour input necessary. Properties with grain and horticultural sidelines are those withgreater labour reserves (mostly in the form of family labour or sharefarmers) or areproperties with small quotas that need less than total owner-grower involvement.
Grain, Lucerne, Beef, Sheep and Horticulture
Enterprises within this system vary in emphasis according to property size, soilsuitability and also outside influences such as market demands. All enterprises however,are strongly influenced by availability of finance, machinery, labour and managerialexpertise.
This system is based entirely on irrigation and, until recently, the mainenterprise combination was a rotation of lucerne (five years) and fodder and grain crops(three years) before returning back to lucerne. No strict rotation pattern was adopted.
In recent years, unstable beef markets and static demand for lucerne hay duringa period of escalating production costs, have strongly influenced producers to move toalternative enterprises. These are usually more intensive enterprises with higher valuesVer unit area. They include leguminous grain crops (navy beans), vegetables (beans,pumpkins) and fruit (watermelons, grapes, pecan nuts). The improvement in the main highway

.46.
to Brisbane (now three to four hours) has also made it easier to market these crops.
Table 6.4
Inglewood Shire - Major Activities on Rural Holdings, 1975-76
Activity
Total number of rural holdingsHoldings running - meat cattle
- milk cattle- sheep- pigs
Holdings with - sown pastures (excluding lucerne)- lucerne only- sown pasture/lucerne mixed
Holdings growing - cereal crops- other crops- field crops
Holdings double croppingHoldings growing - vegetables
- orchard crops- any crop- vineyards- wheat for grain- oats for grain- oats for green feed- barley for grain- grain sorghum for grain- millets for grain- tobacco- navy beans- forage sorghum green feed- beans- pumpkins- tomatoes- apricots- grapes, table
Holdings using irrigation
Number of Holdings
3162853
1663167951301706818815125
19186419717051113716175534896
Source: Australian Bureau of Statistics (published and unpublished data)
At the present time, production of these more intensive alternative crops issecondary to the main activities of lucerne, coarse grains and beef production. However,if the present trend continues there will be a definite change of emphasis in the foreseeablefuture. During the 1970-71 season, 17 percent of producers in this system had embarked onmore intensive activities, but during the next four years to the 1974-75 season, the numberhad more than doubled to 44 percent.
Several factors were involved in this sudden change, the main one being thecollapse in the beef market, but also coinciding with this event was the sudden interestbeing shown by food processors for Dwarf French beans and potatoes, along with the highdemand for grain. The processors have found the district suitable climatically, relativelyfree of diseases and in close proximity to their factories and market outlets.
Producers, on the other hand, have found a highly productive economic alternative,especially with Dwarf French beans, and little to no additional capital outlay in machinery(machinery is owned and operated by the companies). Also these crops require significantlyless water than lucerne, which is of major importance amongst producers in low annual waterallocations along the Macintyre Brook (max 430 Ml).
In conjunction with other enterprises, sheep are run on a number of propertiesfor both wool and prime lamb production. The interest in prime lambs bred or introduced(store lambs) from northern New South Wales and south-west Queensland in recent years hasfluctuated along with the market.

.47.
Table 6.5
Inglewood Shire - Agricultural Establishments ClassifiedAccording to Industry Class 1975-76
Principal Activity
Cereal grainOilseedsSheep-cereal grainMeat-cereal grainSheep-meat cattleSheepHeat cattleMilk cattlePigsFruit (including vines)VegetablesMultipurpose and other n.e.c.TobaccoTotal Rural Establishments2
Number of Establishments*
272
1635306931
312
239
26
265
Source: Australian Bureau of Statistics1 Until 1973-74, rural holdings were classified according to the main type of activity.From 1974-75 the basic economic unit has been changed from 'holding' to 'establishment'.These establishments generally coincide with the holding unit and are classified,according to the Australian Standard Industrial Classification, into industry classes.
2 This figure will disagree with total rural holdings to the extent to which rural holdingsare run together as agricultural establishments and the existence of rural holdings withmainly non-agricultural operations. The figure underestimates the actual number ofseparate agricultural units in the Shire as the operations of sharefarmers are includedin the activity of the holding in which they are located.
In addition to the irrigation area, on individual holdings may be dryland croppingand pasture land of varying area. The arable land area is used both for opportunity cerealgrain production and oats for grazing whilst the pasture land is used specifically for beefand sheep production. The emphasis on winter crop production in the Shire is because ofthe more effective winter rainfall for dryland crops in comparison to the erratic natureof the predominantly summer rainfall.
6.4.3 Sheep and Beef Cattle
This system is predominant to the east of an imaginary line from Oman-ama toBeebo on the New South Wales border. The country is known as the 'traprock' and hasshallow gravelly loam soils over clays (solodics). These soils have low inherent fertility.Pockets of 'brigalow' country (grey and brown cracking clays) occur on the western extremityof this area.
The pasture productivity of the 'traprock1 country is poor and is not good cattlecountry. Winter feed difficulties that occur in this country are more critical in cattlethan in sheep. Wool, therefore, has predominated as the main source of income, withlimited prime lamb production. Cattle have contributed little to farm incomes, althoughtheir numbers on sheep holdings in this area rose significantly in the early 1970s.
The major reasons for this latter development were the wool slump in the early1970s, the use of urea-molasses and phosphate supplements, establishment of lucerne andannual medics and rising prices for cattle. In addition, the majority of holdings were toosmall to consider further increases in sheep numbers to offset narrowing profit margins forwool production and many growers found that finance was more readily available for buyingcattle than it was for increasing sheep numbers. Table 6.6 shows rural holdings inInglewood Shire classified according to size of sheep flock and size of meat cattle herd.
Cattle numbers in this eastern section of the Shire have eased slightly followingthe 1974 drought and low beef prices since 1973-74. Many producers who would have preferredto return to wool production completely were prevented by their commitments to cattle. Asmall number in this group have turned to. crops on the deeper soils on lower slopes and
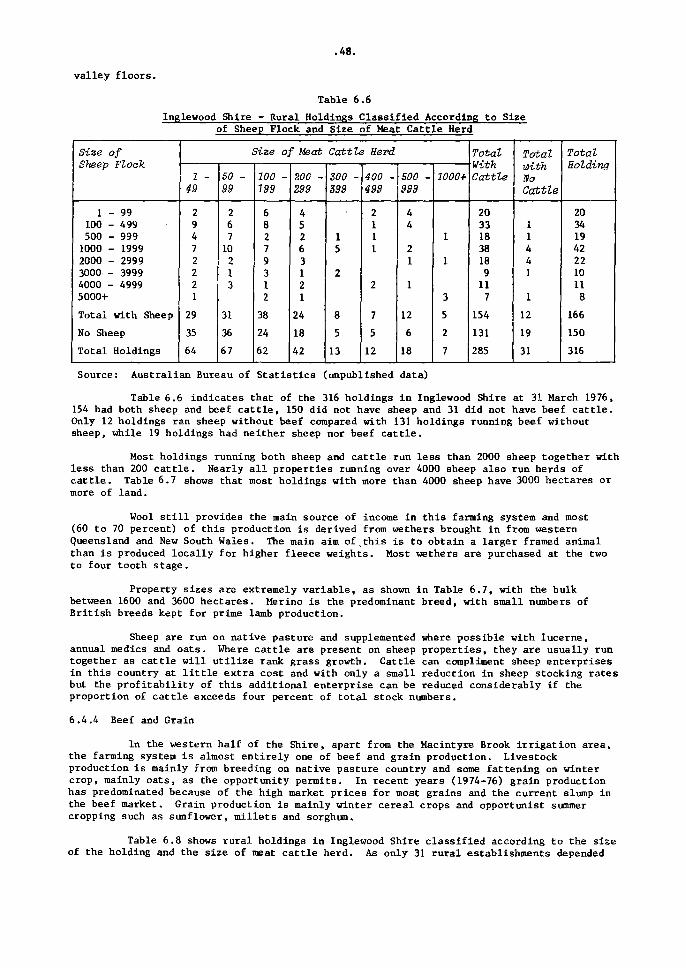
.48.
valley floors.
Table 6.6
Inglewood Shire - Rural Holdings Classified According to Sizeof Sheep Flock and Size of Meat Cattle Herd
Size ofSheep Flock
1 - 99100 - 499500 - 9991000 - 19992000 - 29993000 - 39994000 - 49995000+
Total with Sheep
No Sheep
Total Holdings
1 -49
29472221
29
35
64
Size of Meat
SO -99
26710213
31
36
67
100 -199
68279312
38
24
62
200 -299
45263121
24
18
42
Cattle Herd
300 -399
15
2
8
5
13
400 -499
2111
2
7
5
12
500 -999
44
21
1
12
6
18
2000+
1
1
3
5
2
7
TotalWithCattle
20331838189117
154
131
285
TotalwithHoCattle
il441
1
12
19
31
TotalHolding
203419422210118
166
150
316
Source: Australian Bureau of Statistics (unpublished data)
Table 6.6 indicates that of the 316 holdings in Inglewood Shire at 31 March 1976,154 had both sheep and beef cattle, 150 did not have sheep and 31 did not have beef cattle.Only 12 holdings ran sheep without beef compared with 131 holdings running beef withoutsheep, while 19 holdings had neither sheep nor beef cattle.
Most holdings running both sheep and cattle run less than 2000 sheep together withless than 200 cattle. Nearly all properties running over 4000 sheep also run herds ofcattle. Table 6.7 shows that most holdings with more than 4000 sheep have 3000 hectares ormore of land.
Wool scill provides the main source of income in this farming system and most(60 to 70 percent) of this production is derived from wethers brought in from westernQueensland and New South Wales. The main aim of this is to obtain a larger framed animalthan is produced locally for higher fleece weights. Most wethers are purchased at the twoto four tooth stage.
Property sizes are extremely variable, as shown in Table 6.7, with the bulkbetween 1600 and 3600 hectares. Merino is the predominant breed, with small numbers ofBritish breeds kept for prime lamb production.
Sheep are run on native pasture and supplemented where possible with lucerne,annual medics and oats. Where cattle are present on sheep properties, they are usually runtogether as cattle will utilize rank grass growth. Cattle can compliment sheep enterprisesin this country at little extra cost and with only a small reduction in sheep stocking ratesbut the profitability of this additional enterprise can be reduced considerably if theproportion of cattle exceeds four percent of total stock numbers.
6.4.4 Beef and Grain
In the western half of the Shire, apart from the Macintyre Brook irrigation area,the farming system is almost entirely one of beef and grain production. Livestockproduction is mainly from breeding on native pasture country and some fattening on wintercrop, mainly oats, as the opportunity permits. In recent years (1974-76) grain productionhas predominated because of the high market prices for most grains and the current slump inthe beef market. Grain production is mainly winter cereal crops and opportunist summercropping such as sunflower, millets and sorghum.
Table 6.8 shows rural holdings in Inglewood Shire classified according to the siseof the holding and the size of meat cattle herd. As only 31 rural establishments depended

.49.
on meat catt le for the main part of their income in 1975-76 (see Table 6.5) meat cattleproduction i s very much a sideline activity in Inglewood Shire.
Table 6.7
Inglewood Shire - Rural Holdings ClassifiedAccording to Area of Holding and Size of Sheep Flock
Area ofHolding(ha)
1 - 99100 - 199200 - 299300 - 499500 - 9991000 - 19992000 - 29993000 - 39994000 - 49995000+
Total
1 -99
1333163
20
100 -499
1355683111
34
500 -999
13651111
19
Size of Sheep
1000 -1499
26561
1
21
1500 -1999
37911
21
Flock
2000 -2999
168421
22
3000 -3999
2521
10
4000 -4999
1712
11
5000+
1223
8
Total
269132339371999
166
Source: Australian Bureau of Statistics (unpublished data)
Table 6.8
Inglewood Shire - Rural Holdings Classifiedto Size of Holding and Size of Meat Cattle Herd
Size of Holding\ rlCU
1 - 9 9100 - 249250 - 499500 - 9991000 - 19992000 - 29993000 - 39994000 - 49995000+
Total
1 -49
16161194431
64
50 -99
310171478413
67
Size
100 -199
811131012332
62
of Meat
200 -299
129810543
42
Cattle Herd
300 -399
236
1I
13
400 -499
1
62111
12
500 -999
166221
18
1000+
115
7
Total
203649474643181313
2 85
Source: Australian Bureau of Statistics (unpublished data)
6.4.5 Other Systems
Inglewood Shire was once a large dairying area, with butter factories at Inglewoodand Texas. In 1944-45 there were 188 holdings running 9473 dairy cattle with over 250 000 kgof butter produced at the two factories. In 1975-76 there were three commercial dairy farmsrunning 131 dairy cat t le . In addition there were 442 house cows and heifers on 104 holdingsin the Shire.
With the decline in dairying there has also been a reduction in the number ofholdings running pigs. Pig production in the Shire is no longer tied to dairying, being fedmostly on home grown or locally purchased grain and protein supplements. At 31 March 1976there were 31 holdings in the Shire running 25 26 pigs. Nearly 60 percent of these pigs wererun on five holdings running over 100 pigs. Only three holdings in the Shire rely on pigsfor the major part of their income.

.50.
Sources of Information
1. Queensland Department of Primary Industries - Brisbane and Inglewood Field Station(records and f i les )
2. Australian Bureau of Stat is t ics (unpublished data)
3. Australian Bureau of Stat i s t ics - Part "B1 - Rural Production (several years)- Agricultural Industry - Section 1. 1975-76- Stat i s t ica l Register of Queensland
4. Queensland Agricultural Journal (August 1952)
5. Queensland Tobacco Leaf Marketing Board
6. Waterson, D.B. (1968) - Squatter, Selector and Storekeeper. A history of the DarlingDowns 1859-1895. Sydney University Press. Sydney

.51.
7. CROP, PASTURE AND ANIMAL PERFORMANCE
7.1 AGRICULTURAL CROPS
Intensive agricultural cropping within the Inglewood Shire is largely confined tothose properties adjoining the Macintyre Brook and Dumaresq River and tributaries of thesestreams where varying areas of land on individual holdings are suitable for cultivation.The grey-brown clay soils in the north and western sectors of the Shire are used forextensive cropping.
Crops grown in the Shire include wheat, barley, oats, linseed, grain sorghum,sunflower, grain millets, forage sorghums. In 1975-76, the area of crops In Inglewood Shiretotalled 17 095 hectares. This was made up of 15 835 hectares of cereal crops, 1164hectares of other crops (mainly tobacco), and 96 hectares of fruit and vegetables.
Where irrigation is available, tobacco, navy beans, soy beans, green beans areproduced, while cotton, mung beans, cowpeas and vegetables can also be grown. Irrigationof crops in Inglewood Shire is discussed in Section 3.4 and areas of crops irrigated aregiven in Table 3.9. Lucerne, which is grown as an irrigated crop for hay in the Shire isdiscussed in Section 7.3.3.
7.1.1 Winter Crops
Wheat
Wheat is the most important cereal crop grown in the Shire even though there hasbeen some fall off in interest in recent years years. Table 7.1 shows wheat production inInglewood Shire for the last seven years and for selected years prior to 1969-70.
The introduction of wheat quotas in 1969 contributed to some of the recentdecrease in area, especially within the irrigation area where property owners were allocatedquotas ranging from as low as 3 to 27 tonnes.
The crop is normally sown between May and July, with a preference for late May-early June sowings.
Planting rates vary, but in recent years the trend to lighter planting rates (22to 27 kg/ha) has been accepted.
New varieties of wheat are continually being introduced to the district, but overthe past five years Gatcher and Timgalen have been the major varieties grown. Othervarieties which have been grown during the same period are Festiguay, Mendos, Spica,Windebri, Tarsa, Gamut, Eagle and Oxley.
Wheat yields are relatively low and the average for the 1967 to 1973 period wasapproximately 0.88 t/ha.
The major factors affecting wheat production in the Shire are soil moisture,nutrient deficiencies and weeds (weed problems are discussed in Section 7.4). Several otherfactors that limit production occasionally are frost and hail damage, insect pests anddiseases.
Stress from insufficient soil moisture is a frequent occurrence with local wheatcrops, particularly during the critical flowering period on the lighter textured soil.This stress has an adverse affect on yield, and also on grain quality, resulting in'pinched' grain.
Fertilizer usage is largely restricted to superphosphate on the grey-brown soils.The alluvial soils, except in isolated cases, are reasonably well endowed with phosphorus.
Nitrogen is the main deficiency on the alluvial soils but is rarely used as afertilizer in dryland crop situations. Fertilizer usage is shown in Table 10.2.
On-farm grain storage is virtually non-existent except for temporary mesh silosand this situation has arisen because of the close proximity of adequate storage facilitiesat the State Wheat Board Depots.

.52.
These silos are situated at:
Site
Inglewood
Texas
Yelarbon
Total Storage
Source: State Wheat Board
These storages, namely Yelarbon and Texas, are also used by wheat producers inneighbouring Shires.
Table 7.1
Inglewood Shire - Wheat Production
Type
Horizontal bulk storage(Perrin type)
Horizontal bulk storage(Perrin type)
Horizontal bulk storage(Perrin type)
Vertical concrete-steel silos (6)
Capacityt
2
2
3
10
19
721
721
265
448
155
Year
1944-45
1954-55
1959-60
1964-65
1969-701970-711971-721972-731973-741974-751975-76
Areaha
649
3 016
2 501
6 241
10 0069 2949 0747 3075 2914 6455 803
Productiont
391
3 010
2 789
10 752
7 9755 128
10 0645 0335 0393 6187 734
Yieldt/ha
0.603
0.998
1.115
1.723
0.7970.5521.109
•0.6890.9520.7791.333
Growers
n.a .
61
66
103
11096
10169595264
Source: Australian Bureau of Statistics
Barley
Although a relatively minor crop in the Shire, barley does play an integral partin crop rotations, particularly on the irrigable soils. Elsewhere in the Shire the crop isgrown on a wide range of soil types, but more particularly on the very marginal solodic andsandstone-type soils. Both these soil types have modest fertility levels and moistureretention ability and barley has shown more potential Chan any other winter cereal crops,both as a grain and a fodder crop.
Table 7.2 shows barley for grain production in Inglewood Shire for the last sevenyears and for selected years prior to 1969-70.
The climatic conditions (hot and dry) experienced during the 'finishing1 stage ofgrowth are not conducive to producing a malting quality grain. Instead, they favour thedevelopment of a thin, coarse-skinned, vitreous grain.
Since the 1971 season Clipper has been the sole malting variety acceptable by theBarley Marketing Board and comprises almost 100 percent of the total area sown for grainpurposes. Small areas of black barley are sown for grazing.
Variety trials conducted at the Inglewood Field Station have indicated that thenew feed lines from the Waite Agricultural Institute, South Australia, may have some

.53.
application at Ingle wood (table 7.3).
Table 7.2
Inglewood Shire - Barley Production
Year
1944-45
1954-55
1959-60
1964-65
1969-701970-711971-721972-731973-741974-751975-76
Areaha
8
94
239
268
12061247r9941111145824164073
Productiont
5
90
245
454
1114834
1868781
114026135191
Yieldt/ha
0.963
1.026
1.693
0.9230.6690.9370.7030.7821.0821.274
Growers
n.a.
n.a.
n.a.
n.a.
36345036405070
Source: Australian Bureau of Statistics
Table 7.3
Inglewood Field Station - Barley Variety Trials
Variety
W. 1.2355LaraW.I.2197W.1.2352BusselClipperKetchPrior
Yield in kg/ha
1974
42484120410336043584350534282878
197S
29953007263627292673228924192512
Source: Inglewood Field Station records
Barley is sown from May to August at a planting rate of 25 to 30 kg/ha. Irrigatedcrops are sown at 55 kg/ha.
Yields are dependent on soil fertility and moisture availability; the Shireaverage for the 1967 to 1973 period was 0.94 t/ha. Irrigated crops have yielded in excessof 4 t/ha.
The Barley Marketing Board controls the marketing of the crop and, by agreement,the State Wheat Board supplies the handling and storage facilities at three centres -Inglewood, Texas and Yelarbon.
The only disease of any significance that has affected barley locally in recentyears is powdery mildew. Clipper, originally tolerant to the disease, has in recent yearslost this tolerance, but it does appear to have the ability to recover and not suffer asseverely as the previous malting barley, Prior.
7.1.2 Summer Crops
Grain Sorghum
Sorghum is the main summer grain crop in the Shire but climatic conditions aresuch that it is only marginally suited to the area. Compared with the central Darling Downs,the summer rainfall pattern is not reliable, available moisture holding capacity of the soil

.54.
is lower and heatwave conditions are more common.
The area sown to grain sorghum annually is anything but stable and fluctuatesaccording to the success or failure of the winter cereal crops and price of the grain.
In recent years, there has been an increase in area sown, as a result of thecurrent beef situation and high grain prices. Fortunately, summer seasonal conditionsduring this period have been reasonably favourable, providing fair returns.
Table 7.4 shows grain sorghum production in Inglewood Shire for the last sevenyears and for selected years prior to 1969-70.
Table 7.A
InRlewood Shire - Grain Sorghum Production
leap
1945-55
1959-60
1964-65
1969-701970-711971-721972-731973-741974-751975-76
Areaha
440
274
442
354104620221713961
31922012
Productiont
730
240
274
405315723051204
71427843003
Yieldt/ha
1.658
0.878
0.620
1.1453.0181.1400.7030.7430.8721.493
Growers
n.a.
n.a.
n.a.
n.a.223928175951
Source: Australian Bureau of Statistics
Numerous varieties are grown and, apart from small areas of Alpha, the entirecrop is sown to hybrids. The main varieties sown are Texas 610, Yates NK212 and Dekalb E57.
Yields vary greatly depending mainly on seasonal conditions although soilfertility is also a major limiting factor. Commercial crops average around 1 t/ha.ideal conditions, yields up to 3 t/ha have been produced.
In
Main plantings commence in September and continue through to January with themost successful being planted in the mid-summer period. These crops are growing when theincidence of rain is high and flower during the cooler late summer months.
Apart from moisture stress, other factors limiting crop production are midge andbirds. Sorghum midge has been reasonably active in the past five years, particularly inlate sown crops.
Bird damage can be very severe particularly in small isolated crops adjoining theheavily timbered areas which are common in the western half of the Shire. Feral pigs canalso cause damage in these areas.
Most of the grain sorghum produced is marketed through the Queensland GrainGrowers Association Grain Sorghum Export Committee scheme whilst smaller quantities gointerstate through grain merchants•
Sunflower
Sunflower production in the Shire is extremely small and the continual failure ofcrops in recent years together with falling prices resulted in negligible sowings in 1975-76.
Table 7.5 shows sunflower production in Inglewood Shire for the past five years.
The climatic conditions experienced in the Shire are such that growing the cropinvolves a large element of risk: In addition to this, two other discouraging aspects ofsunflower production are firstly that failed frops provide no worthwhile grazing and,

.55.
secondly, seed lost during the harvesting process can become a serious weed problem insubsequent winter cereal crops, especially at harvesting. Damage from birds can also beheavy.
Table 7.5
Inglewood Shire - Sunflower Production
Year
1971-721972-731973-741974-751975-76
Areaha
4741117
39 3266141
Production
219 540372 000105 00010 3 000133 000
Yieldkg/ha
463333267387943
Growers
91866
1
Source: Australian Bureau of Statistics1 Less than five growers
Yields vary greatly, from nil to 1000 kg/ha with an average of around 400 kg/ha.
Grain Millets
White French millet is the major variety planted and even then on a minor scale.
The crop's performance is akin to most summer growing crops in that it issusceptible to the erratic nature of the climatic conditions of the Shire.
White French millet is sown mainly in the mid-summer period and yields from suchplantings can be as high as 2 t/ha. Millet production is given in Table 10.1.
Average yields however, are generally in the vicinity of 0.75 t/ha.
Navy Beans
During the past five years there has been an increase in area sown to navy beans.Table 7.6 shows navy bean production in Inglewood Shire in the last seven years. Much ofthis increase is due to the great adaptability the crop has shown to both the difficultclimatic conditions experienced and the soils, particularly those irrigable soils adjacentto the Macintyre Brook.
Table 7.6
Inglewood Shire - Navy Bean Production
Year
1969-701970-711971-721972-731973-741974-751975-76
Areaha
99563652
111161315
Product ion*g
42 6389 979
21 31948 000
114 000151 000152 000
Yieldl<g/ha
431181592923
1027940483
Growers
n.a.n .a.n.a.n.a.n.a.
816
Source: Australian Bureau of Statistics
The potential of navy beans in the Shire is high and if the current high demandand prices hold, then further increases in area sown are likely.
The optimum time of planting is from mid-January to the first week of February.Planting undertaken during this period permits the crop to flower and mature in the coolermonths of March-April, thus avoiding the heatwaves often experienced in mid-summer, anddamage from frosts in late April-May.

.56.
Under irrigation it is important to plant sufficient seed to give a good evenstart. The aim should be to achieve a plant density of at least 125 000 plants per hectare.To achieve this plant population, a sowing rate of 35 kg/ha will be necessary. Row spacingof 70 cm is essential to obtain high yields.
Fertilizer requirements are high and nitrogen at rates of 100 to 150 kg/ha isrecommended. Except in isolated cases, phosphorus is not required.
Two main varieties grown under Irrigation are Gallaroy and Selection 46. Of thetwo, Selection 46 is preferred because of its higher yielding ability. Table 7.7 showsyields obtained from navy bean varieties at Inglewood Field Station.
Table 7.7
InRlewood Field Station - Navy Bean Variety Trials(kg/ha)
Variety
Selection 46GallaroySelection 61Selection 45KermanSelection 21Selection 23BurniaCal. Small WhiteSelection 44Selection 51Selection 39Selection 40Selection 52
1968
156915081522138312171562147614021517
1970
21451959271221361251
1971
22851478121119621898
1975
19791772
975
2451203921111486944
1976
26752515
2 363
26292365228219432192
Source: Inglewood Field Station records
The greater susceptibility of Selection 46 to split or crack during the harvestingprocess has confined annual plantings to 50 percent of the total area of navy beans.
The yields are dependent on the timeliness of irrigation, especially during thecritical flowering period. The importance of having adequate soil moisture during itsflowering is borne out in a series of trials conducted at the Inglewood Field Station andoutlined in Table 7.8.
Table 7.8
Inglewood Field Station - Irrigation of Navy Beans Trials(Yield of Grain - kg/ha)
Treatment
No irrigation
Irrigation at flowering
Full irrigation-schedule
1969
1858
2615
2574
1970
399
1040
1105
1971
626
1161
1457
1972
1448
2237
2495
Source: Inglewood Field Station records
The Navy Bean Marketing Board at Kingaroy controls the marketing of the crop.
Soybeans
Table 7.9 shows soybean production in Inglewood Shire for recent years. Interestin this fairly new crop has waned to some extent. Two local problems with this crop areirrigation methods and water requirements.
The irrigation method commonly practised is sprinkler irrigation using the "end

.57.
tow' or *tonline' technique to move the pipelines. This technique presents some difficultyas moving the lines through the crop around flowering and later results in crop damage.Secondly, crop water requirements are high and irrigators with small water allocations fromMacintyre Brook have found it difficult to justify economically using the amount andfrequency the crop requires.
Apart from these factors the crop is suited to the locality and the results fromDepartmental variety trials and commercial findings have confirmed this opinion. Results oftrials are shown in Table 7.10. Yields range from 1 to 5 t/ha with Shire averages around1.4 t/ha.
Table 7.9
Inglewood Shire - Soybean Production
Year
1969-701970-711971-721972-731973-741974-751975-76
Areaha
121212
11310313591
Productiont
191919
105146238128
Yieldt/ha
1.6011.6011.6010.9291.4171.7631.407
Growers
n.a.n.a .n.a.n .a .n.a.56
Source: Australian Bureau of Statistics
Planting commences in December and may continue through to mid-January,sown are mainly Bragg and lavis, with Hill for late sowings.
Table 7.10
Inglewood Field Station - Soybean Variety Trials(kg/ha)
Varieties
Variety
BraggDavisHamptonWillsHi l lHoodSemmesLesliePickettDareSemstarHinn70-50 (Flegler)HR-1 (Collee)HR-2BossierRuse
1971-72
195517401838166316381771192819281740168815001446
1972-73
208523752208211519382203198017851671
230717241826
1973-74
319828182776256124522267
291022762058
1974-75
32353319
34472731
n i l
31072906
31143047
1975-76
37253515
33873258
3439
36502748
34062758
Source: Inglewood Field Station records
Cotton
Cotton has been grown in the Inglewood Shire over the years but never for anylength of time. The most recent attempts at production occurred in 1973-74 and 1974-75seasons when about 160 hectares were grown. The overall y ie lds were disappointing at about2.5 bales per hectare. The main problem was the d i f f i cu l ty in meeting the crops waterrequirements from squaring onwards on the crusting s o i l s .

.58.
Tobacco
Tobacco has been grown in the Shire since 1881, and the industry has waxed andwaned over the last 96 years. A history of tobacco production in the Shire is given inSection 6.3. During the last 10 years the development of two irrigation schemes within theShire, together with the advent of specialized equipment and chemicals with which to keeppests and diseases in check, has resulted in a firm consolidation of the industry within theShire. The stabilization Scheme of 1965 fixed district tonnage to approximately half of thepeak district production of 945 tonnes. This quota is produced from approximately 300hectares and satisfies the District Stabilization Quota requirement of 481 tonnes from 46quota-holding properties. Individual property quotas are fixed.
Economics of production is forcing a modernization of the indjistry. Antiquatedlabour-demanding systems, renovated temporarily during the revival, now require ultimatereplacement, and major changes in production methods within the district are beingimplemented especially because of low supply, inferior quality and high cost of labour.
Recent technical advances in the form of weedicides, desuckerants, specificmachinery etc., have reduced labour requirements substantially, thus allowing for largerindividual crop areas. Spray irrigation has largely replaced flood methods withsubsequently improved crops.
Since 1974, price rises have increased the national average from 252 c/kg to 346c/kg and this has materially assisted in the present mechanization trend on farms. Improvedyields, (district average - 1640 kg/ha in 1975) are also assisting to increase net profits.The cost of production may vary quite considerably from farm to farm.
Soil types in use vary from silty loams to pure sands on cypress pine ridges. A16 percent higher price (1973) from crops grown on sandier soils has resulted in asubstantial move away from the tighter silty loams previously cultivated for tobacco.
Individual growers average five to eight hectare crops with a firm trend towardslarge planted areas as overhead costs, particularly machinery and permanent labour, continueto increase.
This trend is also reducing the number of siiaref armers. The owner usually suppliesland, buildings and equipment to the sharefarmer in return for 22^ percent to 25 percent ofthe gross return of the crop. The sharefarming system is itself a major consequence ofintensive cultivation of a specialized crop within an extensive agricultural system.
Table 7.11 shows tobacco production in Inglewood Shire for the last seven yearsand for selected years prior to 1969-70. Shire figures may vary from those given for south-west Queensland in Table 6.1 because of different crop periods and also because some tobaccogrowers are in neighbouring Shires.
Table 7.11
Inglewood Shire - Tobacco Production
Year
1944-45
1954-55
1959-60
1964-65
1969-701970-711971-721972-731973-741974-751975-76
Areaha
216
602
821
292
235261301303254252262
Product iont
194
661
760
256
333312382461364338351
Yieldkg/ha
899
1097
925
878
1418119612701521143313411339
Growers
32
50
69
39
35353739373537
Source: Australian Bureau of Statistics

.59.
7.1.3 Other Crops
Small areas of millets, canary, linseed, mung beans and cowpeas have been grownfor grain. However, fluctuating demands and prices for these products have generallyhampered grower interest. Yields have also been quite erratic because of seasonalconditions and lack of knowledge in management techniques.
In 1975-76 there were 82 hectares of French White millet grown for a total yieldof 59 tonnes, giving an average yield of 720 kg/ha. In addition, there were 145 hectaresof other millets and panicurn grown for a total yield of 45 tonnes, or 310 kg/ha. Thesecrops were produced by seven growers.
Apart from barley and grain sorghum, the main irrigated cash crops produced inthe Shire are tobacco, navy beans, soybeans, green beans and cotton. Areas of cropsirrigated are given in Table 3.9.
7.1.4 Fodder Crops
Winter fodder crops are of more importance to the annual feed programme thansummer fodder crops, as this is the period of the year when high quality feed is at apremium. Native pasture production is also at a low ebb.
The area sown is restricted because of limited suitable land in individualproperties.
The area sown also fluctuates from year to year, depending upon seasonalconditions. Table 7.12 shows annual crops grown for green fodder in Inglewood Shire in thelast five years. Total area has declined in recent years due to the drop in cattle prices.
Table 7.12
Inglewood Shire - Hay and Green Fodder Production
Year
1971-721972-731973-741974-751975-76
Wheat
ha
265298496486386
Annual Crept
Oats
ha
34905021380033542210
Barley
ha
770623992374255
; Used for
GrainSorghumha
43081
847508
Green Fodder
ForageSorghumha
39379860755 7
495
Other
ha
325405495407137
Total
ha
56747226723756863483
HayAnnual
ha
62 79
2833
154
fromCrops
t
43447112
76426
Source: Australian Bureau of Statistics
Oats is by far the most popular crop for grazing purposes. The late maturingvarieties Algerian, Cooba and Camellia make up the bulk of annual plantings with smallerareas sown to Belar, Benton, Bentland and Saia. Many other varieties are grown but theirarea is relatively small. Availability of seed often determines the selection, rather thanany recognized differences in grazing yield potential.
Planting of oats commences in late February to late March. Further plantings,depending on the rainfall, available land and property need, will be made in May and evenas late as July and August. Late plantings will often provide feed into the late spring.
The fodder produced annually from oats largely depends on seasonal conditions,soil fertility, variety, presence of weeds, etc. Crops sown on the more fertile soils(brigalow) north-east of Inglewood, in average seasons, are highly productive, whereas undersimilar climatic conditions, crops on the traprock and poorer sandstone areas are oftenlower in yield, due to low soil fertility. With an estimated four years in 10 failure rate,stockmen are generally reluctant to use fertilizer.
An indication of what could be expected when fertilizer is used, is summarized inTable 7.13 which shows trial results from the neighbouring Stanthorpe Shire. This trial was

.60.
conducted on winter fodder crops at 'Verri', Glen Aplin, in 1971.years experienced fair winter rain.
Table 7.13
Soils are granitic. The
Stanthorpe Shire - Winter Fodder Crops Trlala(planted 21 April 1977)
Crop
Cereal RyeOats (Bentland)Oats (Camellia)Barley (Cape)Oats (Algerian)Golden Tares
DateHarvested
1/75 /8
31/85 /8
10/910/9
No Fertilizer
Heldkg/ha
246426522070180020521523
Protein%
17.512.99.2
16.18 .3
25.5
P (22.
yieldkg/ha
348538005000262531002168
S kg/ha)
Protein%
16.611.29.4
20.58.1
30.0
P (22.5 kg/ha) +N (S9 kg/ha)
Yieldkg/ha
4 4985 985
10 5555 8064 8112 330
Protein%
21.0IS .612.020.110.728.6
Source: Department of Primary Industries, Warwick
Irrigated winter fodder crops are equally productive where well supplied withnecessary nutrients, especially nitrogen. These crops are highly productive and willfatten beasts at the rate of five head per hectare. Leaf and stem r/ist rarely becomes asignificant problem.
r forage crops in the Shire has been a relatively minor one. TwoThe role of sreasons for this are:
(a) The main growing period of the native pasture species is during the summer period andonly on rare occasions do the pastures fail to meet stock requirements;
(b) Cultivation areas are relatively small on Individual holdings and the area availablefor annual cropping is invariably diverted to winter forage crop production.
More summer fodder cropping, particularly leguminous types, could play a usefulrole in supplementing the native pastures as well as assisting in alleviating gaps (latesummer-early winter and spring) in the feed year programme.
A change in emphasis of types of summer fodder crops could also be beneficial.
Approximately 70 percent of the area sown to summer fodder crops is planted tohybrid sorghum varieties. The remaining area is evenly divided to grazing millets, cowpeasand lablab bean.
Whilst hybrid sorghums (fodder) have a place, the diversion of some of this areato lablab bean or Caloona cowpeas is warranted.
Strategically placed summer leguminous crops, in addition to sugardrip, couldalleviate protein shortages in the late summer-early winter period and provide a bettermeans of maintaining bodyweight in cattle until early sown oat crops are available forgrazing. The other important consideration is they do not require nitrogenous fertilizer.
7.2 HORTICULTURAL CROPS
Horticulture crops are mainly a sideline industry for farmers in the InglewoodShire. The main crops are grapes, apricots and green beans. Other crops such as potatqes,pumpkins, melons (water and rock), peaches, and plums are grown in small areas.
Grapes
In 1975-76, the area of grapes in the Shire was 14 hectares. Table grapes haveproved to be a profitable sideline for the present growers with areas of from one to threehectares. This is due to the earlier harvest of this crop in comparison to Stanthorpewhich is the main production area.

.61.
On the sands, harvesting can commence from the first week in January, whereas onthe silty loams it is normally a few weeks later. Grapes in this Shire along with otherWestern Downs grape producing areas have a secure early market until mid-February when themain Stanthorpe crop commences.
The main variety grown is Muscat Hamburg which has proved superior to othercommercial varieties in this area. A regular spray programme is required to control pestsand diseases. White ants and nematodes can be a problem. Nematodes can be controlled byfumigating or by using nematode resistant rootstocks which are readily available.
Some light table wines are made from the late portion of the crop. Quantity ofwine made depends on the price of these late grapes. The Department of Primary Industriesis investigating the potential for a wine industry in this area. Early trial results lookpromising.
The grape area can be expected to expand because there is a market for early tablegrapes. Unfortunately, the peak activity periods for grape growing clash with those forother intensive row crops which are grown by fanners in the Shire.
Apricots
Apricots have also proved to be a profitable enterprise. Favourable climaticconditions (fewer spring frosts), availability of irrigation, and early maturity incomparison with Stanthorpe makes this crop an attractive proposition. There are aboutseven hectares of apricots grown in the Shire.
Four varieties can be grown with varying harvest periods as follows:
Glengarry - First two weeks in November
Newcastle - Last two weeks in November
Trevatt - First two weeks in December
Moorpark - Mid-December
Fruit fly is the most important pest but control measures for scale, freckle,mites, brown rot, etc., need to be taken as required.
Peaches, nectarines and plums can be produced. But at present only a few treesare in commercial production and expansion could coincide with the main Stanthorpe harvest.
Vegetables
The main vegetables grown are green beans, watermelons, rockmelons, pumpkins andpotatoes. Green beans are mainly grown for processing. Most other vegetables are grown insmall areas.
Dwarf French Beans
Commonly referred to as green beans, this crop was first introduced to the Shireduring the 1974-75 summer season.
Most contracts are with food processing firms for autumn produced crops.Plantings commence in late January and continue at the rate of five hectares per day untilthe contracted area is sown. During the 1974-75 summer 137 hectares was sown. Theperformance of these plantings has been most satisfactory with yields ranging from 4500 to6000 kg/ha with an overall average of approximately 5000 kg/ha (payweight).
The 1976 seasons crop saw a slight reduction in area sown, principally becauseone Company (Edgells) withdrew from the area. Yields in 1975-76 dropped to a Shire averageof a little over one tonne per hectare.
Future expansion within the Inglewood Shire will largely depend upon the futuredemand for beans and the availability of land for bean production in close proximity to theBrisbane based companies.

.62.
The only Company operating in the Inglewood Shire during the 1975-76 season wasWat tie Pict.
tables:The horticulture statistics for the Inglewood Shire are listed in the following
Table 7.14
Inglewood Shire - Area and Production Figures for Tree FruitCrops Grown during the 1975 - 76 Season
Crop
ApricotsPeachesPlumsNectarinesPecan Huts
Bearing Trees
1520----
Non-bearingTrees
2050
10030
230
Total Trees
154050
10030
2 30
Production
25 000---—
Table 7.15
Inglewood Shire - Estimated Area and Production Figures for Grapes
Crop
Grapes (table)
Grown during the 1975-76
Area Bearing
ha
14
AreaSon-bearingha
2.5
Season
Total Area
ha
16.5
Production
84 482
Table 7.16
Inglewood Shire - Area and Production Figures for VegetablesGrown during 1975 - 76 Season
Crop
Green beansPumpkinsMelons (water and rock)Other Vegetables
Total
Areaha
3520
75
67
Productiont
3857
4-
7.3 PASTURES
Pastures in Inglewood Shire can be classified in terms of the major soil types assoil type bears an important relationship to pasture species and productivity in the Shire.The most widely occurring soil type is the traprock-derived soils, covering most of theeastern half of the Shire, next is the sandstone-derived solodic soils which cover the majorpart of the western half of the Shire and include most State forest areas. Relativelysmaller areas of grey-brown clay soils, carrying brigalow-belah vegetation, occur along thewestern boundary of the Shire, while alluvial soils occur throughout the Shire but mainlyalong Macintyre Brook, Dumaresq River and Bracker Creek. A very small area of alkaline'desert' soils occur near Yelarbon. See Map 4 for a detailed distribution of soils in theShire.
7.3.1 Native Pastures
Traprock
The location of the areas of 'traprock' soils in the Shire is identified on Map 4.This area comprises most of the eastern half of the Shire and includes the major areas ofnative pasture in the Shire.

.63.
The country varies in topography from flat land to undulating and hilly terrain.The soils are basically poor in inherent fertility and structure and the ground cover isgenerally sparse (basal area < 10 percent). Moisture infiltration is low and runoff is high.The effectiveness of the rainfall is therefore low, resulting in poor pasture productivity.The area is thus very susceptible to drought conditions.
The main species of native pasture in the traprock region are Queensland bluegrass (.Dicanthiicn serioeum), pitted blue grass (fiothriodhloa deaipiens) , slender bamboograss (Stipa verticillata), love grass {Eragrostis spp.), slender rats-tail grass {Sporoboluselongatus), spear grass (Stipa spp.) and Chloris spp., particularly C. divarioata andC. venticulosa.
Native pasture production is confined to a five month period from November throughto March. Even during this period, pasture production is of a fair to low quality and willonly enable cattle to improve condition, rarely to the stage of finishing. After March,pasture quality rapidly deteriorates, with protein shortage from April through to September.Energy supply also becomes critical in mid to late winter and there is generally noimprovement in this until November. The country is therefore, more suited to wool productionwith cattle grazing confined to store production except in favoured localities.
On unimproved traprock, carrying capacities are extremely low for both sheep andcattle. On the other hand the annual dry matter production from timber treated country(improved traprock) averages about 1000 kg/ha. This pasture production will support about1.5 dry sheep equivalents (DSE) per hectare.
Sandstone-Solodios
The solodic woodland normally grows harsher, less productive species of nativepastures in which wiregrasses, especially many-headed wiregrass (Aristida caput-medusae),predominate, with minor occurrences of ridge grass (Enneapogon avenaceus) and some lovegrasses (Eragrostis spp.). These light soils provide very poor winter grazing because ofthe poor types of grasses and the virtual absence of winter crop or other supplementary feedis provided.
In Inglewood Shire, most of the sandstone-solodic soil type areas are covered byState Forest Reserves (see Map 3). These areas are scattered throughout the Shire, butprincipally in the north and west of the Shire. The State Forest Reserves are availablefor cattle grazing only, under special forestry leases. Sheep damage the regenerativegrowth of the tree species. Pasture productivity varies widely, but generally of very poorquality and quantity. Average stocking rates are approximately one beast to 10 hectares.
Grey-Brown Clays
These areas are situated to the north and west of Inglewood and include thebrigalow-belah association. Areas are not very large and are usually heavily timbered withbrigalow regrowth. Cleared areas are devoted almost entirely to winter graiji and fodderproduction. Native pasture species within the brigalow-belah association are brigalowgrass (Paspalidium caespitosum) and minor Chloris spp.
Alluvials
Alluvial country is scattered throughout the Shire. A large number of propertieshave some alluvial frontage country. Broken areas in this country not suitable to annualcropping support mainly pitted blue grass, slender bamboo grasses, love grasses and speargrass. Carrying capacities on this country are quite high (1:4 hectares) and these areasare suited to cattle breeding.
lelarbon 'Desert '
This is a small area of spinifex-tea tree country situated just north of Yelarbon.Although this area is used for livestock production, carrying capacities are extremely low.
7.3.2 Sown Pastures
Pasture improvement using introduced pasture grasses and legumes did not becomesignificant until the mid-1950s. Initial attempts using temperate species such as rye

.64.
grasses, phalaris, cocksfoot, white clover, subterranean clover, and lucerne were notparticularly successful. Persistence was poor and productivity low, except in above averagerainfall years. These species, apart from lucerne, are no longer used under drylandconditions but areas could be planted where irrigation is possible.
In more recent years greater success has been obtained using the subtropicalgrasses buffel, green panic and Rhodes grass, with lucerne and annual medics.
Eighty percent of the Shire's sown pastures are on traprock soils, 14 percent onrecent alluvia, three percent on grey-brown soils (brigalow-belah) and three percent on thesandstone-solodic soils.
Trapvook
The hilly terrain and shallow, hardsetting soils of low fertility impose majorlimitations to pasture development in this region. Areas which readily lend themselves forpasture improvement are small and usually confined to valley floors and in most cases areset aside for lucerne and oat production.
The main species being used is lucerne. Production and persistence is quitesatisfactory on the deep soils of the valley floors but is only fair on the shallowerhillside soils. Lucerne responds quickly to rain but during hot, dry periods in mid-summerit wilts and drops its leaves very quickly.
On average, lucerne stands persist for about two to three years, then the areaprogressively reverts back into native pasture. In many situations where the initial landpreparation for lucerne sowing has been thorough, eliminating all original native pasturespecies, and where the subsequent lucerne stand has weakened and died out because ofintensive grazing, low fertility or climatic soil conditions, the return of native grassspecies is slow and is generally dominated by excessive weed growth. The consequences ofsuch recession can be serious, often resulting in loss of production, overstocking adjoiningareas, soil erosion and extra cost in restoring the area into a more stable state.
Lucerne introduced into native pastures with minimum tillage (sod-seeding), whilsthaving similar production life to that planted into well prepared seedbed conditions, doesnot subject the land to the same magnitude of problems. Using this method, there is aconsiderable saving in initial pasture establishment costs and sucker management practices.This will result in a more stable, uniform and productive pasture, relatively free fromundesirable weed species and soil erosion.
The benefits native pasture species derive from introduced Mediaago species arenot well documented for this area, but in a small observation area located near Texas, ithas been found following analyses of samples taken at regular intervals throughout the year,that the native grass species benefit significantly both in dry matter yield and nitrogencontent where associated with annual medics. Evidence from this area showed that up to 57kg/ha of N per year was available to the grass from the medics.
To reclaim areas originally sown to lucerne, which subsequently died out, buffelgrass has been used to great advantage, along with lucerne and barrel medic (Medicago sativacv. Jemalong) to establish more permanent and productive ground cover in areas suffering fromveeds and little native grass cover.
Based on trials at Texas, it has been estimated that the development of one-sixthof a unit area to lucerne allows stocking rate to be raised from one sheep per 0.8 hectareto approximately one sheep per 0.5 hectare. However, in view of the cost and short lifeof lucerne on such soils, it may be more economical to introduce annual medics as a cheaperand more persistent alternative. In addition the stocking rate had a major effect on woolproduction whilst the proportion of lucerne to native pasture had only a minor effect, withthe exception of the one winter when large quantities of lucerne were available. Theproportion of lucerne appears to be more significant in the production of quality feed forlambing ewes, and fattening, than wool production.
Sandstone-Solodic Soils
On the more difficult bulloak-cypress pine country west of Inglewood, minorpasture development has taken place by introducing green panic, Rhodes grass, buffel grassand medic species. But because of the poor fertility and regrowth problems experienced on

.65.
such country, pasture development is expected to remain slow and insignificant.
Grey-Brown Soils
These soils are basically reserved for grain and annual fodder crop production,but during the early 1970s, when beef prices were reaching new peaks, some of this land wassown to improved pastures. Introduced species were mainly green panic with buffel grass,lucerne and annual medics.
Alluvial Soils
Pasture development on these soil types had not been extensive and to a largeextent is based on lucerne. Since the 1960s however, improved pastures comprising temperatepasture species have been established and maintained under irrigation. The productivityfrom these pastures has not been good and the maintenance costs, especially the irrigationrequirements, are very high. In recent years, subtropical species such as green panic,Rhodes grass and Bambatsi have been sown under dryland conditions. Pasture development onthese soils is not likely to expand rapidly because of interest landholders have in theseareas for grain cropping.
7.3.3 Lucerne for Hay Production
Early records indicate that lucerne on the river alluvia was grown as a drylandgrazing crop after the turn of the century. Today over 60 percent of the crop is irrigatedand used principally for the production of quality hay.
The potential productivity of lucerne from irrigated stands in the Shire iscomparable with yields obtained in recognized lucerne growing areas such as the LockyerValley in south-east Queensland.
A large quantity of the lucerne hay produced is sold to neighbouring districtsand particularly the dairying areas on the north cost of New South Wales.
Seed production assumed importance in the late 1940s and seed valued at $20 000was produced on the Hacintyre Brook in 1956, prior to the 'flood'. In recent years seedproduction has received only minor attention. Yields of lucerne seed around 400 kg/ha arenot uncommon.
The first spray irrigated lucerne stand on the Macintyre Brook was grown in 1958and on the Dumaresq River country in 1952. The areas under irrigation have graduallyincreased to an estimated 540 hectares and 600 hectares on the Macintyre Brook and DumaresqRiver respectively.
The only commercial cultivar grown is Hunter River, but there are indications thatSlro Peruvian gives higher yields under irrigation, particularly in the winter period.However, its persistence Is poor, and trials have indicated that stands are thinner andyields are lower than those of Hunter River after several years.
Witches Broom and root rot have caused severe losses in some years. In suchsituations, invasion by weeds and grasses is rapid and further reduces the yield and qualityof lucerne produced.
Insect pests, such as jassids and leaf roller cause damage occasionally, butrarely warrant chemical control. White-fringed weevil, present in lucerne stands adjacentto the Dumaresq has caused considerable damage and presented the greatest entomologicalthreat to this crop before the advent of spotted alfalfa and blue alfalfa aphids in 1977.
Table 7.17 sets out details of lucerne and other pasture production in InglewoodShire for the last five years.
Although the official statistics in Table 7.17 sho^ total iucerne yield in theShire to average only around 8.5 t/ha, irrigated lucerne stands used purely for hayproduction normally have yields ranging up to 15 t/ha. The average shown in Table 7.17includes stands which are not irrigated and also stands which are grazed for part of theyear. Table 3.10 shows that in 1975-76, 565 hectares of lucerne were irrigated out of atotal of 898 hectares cut for hay.

.66.
Table 7.17
Inglewood Shire - Sown Pastures Area and Production
Year
1971-721972-731973-741974-751975-76
Pasture Cut for
Lucerne
Area
ha
11301080936
1118898
Production
t
92969774625596396889
Hay During Year
Other Pasture
Area
ha
106122569246
Production
t
494467178262140
Area of Sown Pasture& 31 March
PureLucerneha
35583416165718801517
Other Sown
ha
5 7196 481
10 25610 5975 048
>n to other
Source: Australian Bureau of Statistics
7.4 WEEDS OF CROP AND PASTURE
Most weed problems which occur in the Inglewood Shire are cadjoining districts of the Southern Downs Region.
Weeds vary in their incidence and intensity depending upon many factors, some ofwhich are climatic conditions, soil types and cultivation, crop and pasture management.
There are many weed species present and collectively they have substantiallyreduced potential crop and pasture yields and in some cases have been suspected of poisoningstock.
Crop rotations involving winter and summer fallows and diversion to pastures wherethe weed problem is most severe are the means most commonly adopted by local producers.Whilst these methods must be encouraged there are situations when the use of chemicals couldbe most beneficial. Chemical weed control is still not widely accepted and this reluctanceto spray undesirable plants in crops and pastures has led to substantial financial losses inproduction.
7.4.1 Weeds of Cultivation
Alluvial Soils
Perhaps the most important weed pest on these soils is the perennial weed nutgrass(Cyperus rotundus). Almost without exception, nutgrass affects all crops whether they aregrown under irrigation or raingrown conditions. The effects range from almost completefailure to establish to serious losses of yield and quality from established crops.
Control measures are based largely on crop rotations, with smaller use ofherbicides on selective crops.
Chemical control measures of nutgrass are economically justified in such crops astobacco and bean even though such measures at this stage, are only of temporary nature.The effective chemical control diminishes after approximately three to four weeks, but isgenerally sufficient to allow such crops to attain a stage of growth where they in turn arecapable of suppressing the weed problem.
A major weed of weakened lucerne stands is couch grass (Cynodon spp.) . Thisgreatly affects yield and quality of hay produced.
Datura spp. (fl. fevox and D. stramonium) and noogoora burr (Xanthium pungens) arealso of major significance on these soil types. The presence of such weeds on propertiesnot only seriously affects yields and quality of product produced, but also restricts whatcrops are grown. Timely use of chemical sprays where possible will provide season longcontrol, but careful planning of the crop rotation system is necessary to avoid damage fromresidue chemical if the following crop is a susceptible one such as tobacco, beans, lucerne.

.67.
sunflower, etc.
Wild oats {Avena ludoviciana and A. fatud), turnip weed {Bapistrum rugosum) andclimbing buckwheat {Polygonum convolvulus) are major weeds present in most winter crops,and are often countered by various management practi es including some use of chemicals.
Brigalow Soils
Crops on these soil types suffer from many of the above annual weeds present inthe district, but the major weeds of concern are New Zealand Spinach {Tetragoniatetrogonoides), mintweed {Sdlvia reflexa) and European bindweed {Convolvulus arvensis) alsobrigalow suckers {Acacia harpophylla) and limebush {Eremoaitrus glauca) . Control of thesepests can seriously interrupt annual cropping programmes especially European bindweed.
Tvappock Soils
Weeds of concern in annual crops grown on these soil types include many of theones listed previously with the exception of New Zealand Spinach, European bindweed andnutgrass.
One common weed pest that is present in addition to many others is mayne's pest{Verbens tenuisecta).
Other weeds of importance in summer and winter crops are:
Common Name
amaranth, greenbarnyard grassbathhurst burrblue heliotropeblack pigweedcouchcrownbeardcrowsfoot grassdocksdodder, commondead nettlefeather top rhodes grassfat-henhexham scentliverseed grassmallowsmustardsmexican poppyredshanksaffron thistlestink grasssummer grassspiny emexvariegated thistlewild radish
wireweed
7.4.2 Weeds in Pastures
Brigalow
Weeds most prevalent in these situations are brigalow regrowth {Asaaiaharpophylla), limebush (Eremoaitrus glauaa) and pear (Opuntia spp.).
The degree of incidence varies according to the early development of the area andsubsequent management. For example, areas cropped for some years following timber removalare relatively free from such problems.
Botanical Name
Amaranthus viridisEohinochloa cvus-galliXanthium spinosumHeliotropium amplexioauleTvianthema portulacastrvmCynodon dactylonVevbescina enaelioidesEleusine indicaRimex spp.Cuscuta epithywumLco-iium amplexicauleCn'iovis virgataChenopodium albumMelilotus indicaUrochloa panicoidesMalva spp.Sisymbvium spps.Avgemone ochroleucaAmaranthus cvuentusCarthamus lanatusBragrostis cilianensisDigitaria ciliarisEmex australisSilybum mavianumRaphanus raphanistrumVolygonum aviculare

.68.
Traprock and Associated Country
Weeds invading pastures in these areas are both of an annual and perennial nature.The incidence of both depends to a large degree on climatic conditions and pasturemanagement.
Cotton bush (Kochia spp.), Rosemary or cough (Caasinia laevis), couch grass{Cynodcn spp.), galvanized burr (Bassia birchii), flannel weed (Sida spp.), and nettle{Urtica spp.), blue heliotrope (Ueliotropvum amplexicaule) , horehound (Marrubiwi vulgare),and mayne's pest (Verbena tenuiseata) are the most prevalent weed species present.
Timber seedling regrowth is also a problem following removal of the originalvegetation. The use of sheep at high stocking rates periodically has alleviated some ofthe problem, but on cattle dominant properties this system is not practical. Also with thehigh cost of labour and chemicals, the economics of controlling timber seedling growth isquestionable.
7.5 BEEF CATTLE
Beef cattle numbers in the Inglewood Shire in 1976 were 59 376. Theirdistribution is shown in Map 3. Beef cattle production within farming systems is describedin Section 6.4. Table 7.18 shows numbers of beef cattle in Inglewood Shire in recent yearsand for selected years prior to 1969-70.
Table 7.18
Inglewood Shire - Beef Cattle Numbers
Year(SI March)
1945
1950
1955
1960
1965
1970197119721973197419751976
Number ofBeef Cattle
35 006
30 661
31 939
31 851
36 840
36 71644 66550 40757 40153 92857 93959 376
Holdings loithBeef Cattle
n.a.
n.a.
221
236
272
274283284296301294285
The Inglewood Shire is largely a store producing district with the exception ofthe irrigation areas fronting the Dumaresq and Macintyre Rivers. A small number of cattleare also fattened on dryland oats and improved pastures such as lucerne medics, buffel grassand green panic.
Cattle numbers per property depend on the size of the holdings aiid the manager'sinterest, but can vary from 50 to 2000 head. Table 6.6 shows holdings in Inglewood Shireclassified according to the size of holding and size of meat cattle herd. Table 6.7 showsholdings cross-classified to meat cattle herds and sheep flocks.
The dominant breed in the area is Hereford (and Poll Hereford). Together thesemake up 60 percent of Shire numbers. The rest are made up of Shorthorns five percent,Angus five percent, Brahman crossbreds 10 percent, and the remaining 20 percent are mostlyother British breed or dairy crosses, with a sprinkling of European breeds. Table 7.19shows beef cattle in Inglewood Shire classified by breed as at 31 March 1973. A number ofstud herds exist, the majority of which are British breeds.
Although Bos Indicus crossbred cattle have shown considerable advantages inhandling the rougher types of country in the Inglewood Shire, their numbers have shown an

.69.
exceptionally slow increase. This is largely due Co Che market prejudice against storecrossbred cattle, many of which go to southern buyers from New South Wales.
Table 7.19
Inglewood Shire - Breeds of Beef Cattle on Rural Holdings(at 31 March 1973)
Breed
Straight Breeds -BradfordBrahmanDroughtmasterHerefordSanta GertrudisShorthornOther
Total Straight Breeds
Crossbreeds -Brit ish-Brit ishBrahman-BritishOther Tropical-BritishEuropean-OtherBeef-Dairy BreedsOther
Total Crossbreeds
Total All Beef Cattle
Breeding
Bulls
19162
5812465
141
848
513139
1062
112
960
Cattle
Cows &Heifers
66117
1818 946
3081 0703 838
24 363
1 1401 108
91743
1 5312 228
6 967
31 330
Calves(underoneyear)
8268
4H 509
243532
2 142
14 580
773892521
961 113
986
4 381
18 961
Otherloneyear ormore)
11055
3 15932
107868
4 232
214226677
2233566
1 918
6 150
Total
168211
7934 195
6071 7746 989
44 023
2 1322 2392 128
1502 8873 842
13 378
57 401
Holdings1
1310
2
173212630
214
3621166
5070
161
296
Source: Australian Bureau of Statistics1 Generally the sum total of holdings reporting various breeds exceeds the total number ofholdings with beef cattle because individual holdings frequently have more than onebreed
2 Number of holdings small, generally less than five
Store Cattle
Store cattle are mainly sold as weaners or yearlings and are turned off in theautumn to spring period. Store sales are held in Texas, Warwick and Goondiwindi.
Fat Cattle
The majority of fat cattle are sold in the spring months either at auction ordirect to the meatworks at Wallangarra and Tenterfield.
A significant trend over recent years has been towards a younger age of turnoff.A survey of Dumaresq River beef producers (1976) shows the types of turnoff favoured byproducers at that time.
Table 7.20
Dumaresq River - Type of Fat Cattle Turned Off
Type of Fat Cattle Turned Off
VealersYearlingsTwo-year-old steersBullocks
Percent of Producers
523720
9
Source: Department of Primary Industries records

.70.
Stocking Hates
Stocking rates for cattle vary with the amount of property development and typeof country, but average figures could be as listed below:
Description Beasts per Hectare
Cypress-bulloak country 1 to 12-20
Traprock - native pastures 1 to 5-7
improved pastures (i.e. medics, etc.) 1 to 2
Frontage country 1 to 3
Brigalow - developed 1 to 3-4
The poorer classes of country are usually used for breeding purposes whilst cattleare fattened on frontage country (on lucerne, irrigated oats and native medics) and somebrigalow areas (dryland oats) . Quite often owners have both a breeding and fatteningproperty.
Dryland oats on the lighter soil types is usually a risky proposition forfattening cattle, particularly younger stock which require a longer finishing period. Thisis due to a reduced moisture holding capacity on these soils and therefore, high risk ofcrop failure. On the other hand irrigated oats can support good gains (1.14 kg/hd/day) forextended fattening periods (up to 140 days).
The advantages of using younger cattle for fattening have been demonstratedrecently by Gulbransen (pers. comm.) at Hermitage Research Station near Warwick. Herecorded a 20 percent advantage in efficiency (carcase gain per hectare) of weaner cattle(9 to 12 months) as compared to yearling steers (21 to 24 months) on dryland oats for 100days. The ability to finish younger cattle however, presents a higher risk situation andirrigation is usually necessary.
With the collapse of export markets for beef, the trend of fatteners has been togo for younger cattle for the local trade. These are usually at a premium price roundSeptember-October. The economics of fattening different age cattle however, must beexamined in the light of industry circumstances each year.
Breeder herd performance also varies with the type of country. With the poorersoil types such as traprock and limited cultivation, branding rates as low as 60 percent arecommon. Likewise breeder mortalities are high (three to seven percent) owing to theprolonged winter dry spells and frosts which give native pastures a very low nutritive value.
This situation can be improved through sound breeder herd management practicessuch as seasonal calving (August to November), strategic weaning (usually before the end ofMay) and the culling of non-pregnant cows prior to the onset of winter. A winter feedsupplementation programme is also required to reduce mortalities and increase brandings.This involves the use of protein, and energy supplements such as hay or grain. The economicsof such programmes however, rely on a high market value for the extra store cattle turnoffachieved.
Urea-molasses supplements are commonly used early in the winter feeding programmeHowever, recent trial work on traprock country in the neighbouring Stanthorpe Shire(Llewelyn 1975, at 'Mt. Malakoff and Nolan etal. 1974 at 'Calm Downs') has been unable todemonstrate significant responses to urea-molasses. On the other hand some responses havebeen achieved to true-protein supplements such as meat meai(Nolan, etc., 1974). The largeinfluence of energy deficiency of these native pastures has been an important finding inthe above work.
A breeder herd survey of a number of traprock properties in both the Inglewoodand Stanthorpe Shires in 1974-75 (see Winter Feeding Approaches - Stanthorpe Beef SchoolPapers 1975) showed also the considerable benefit of improved pastures particularly medicsin providing a diet adequate to lift branding percentages into the 80s and 90s.
It was suggested there that strategic use of improved pastures showed the bestlong term approach to improvement in breeder performance. However, drawbacks include thehigh initial cost of such development and area limitations in terms of pasture sites.

.71.
Breeder performance on river frontage properties is usually of a higher standardthan that on the traprock and cypress-bulloak areas and 80 percent brandings with minimalbreeder mortality rates (one to two percent) are commonly achieved. Similarly these areassupport good liveweight gains on irrigated oats with all classes of stock (up to 1.36 kg/day),
Phosphorus deficiency in cattle can occur on the lighter soils particularly thesolodics and sometimes on traprock areas. However, traprock soils tend to be marginal andwidely variable in this respect.
The overall importance of sodium deficiency is not known but is often suspected.
From a disease point of view, cattle are probably no worse off in the InglewoodShire than elsewhere. The Shire is a tick free area but lice can cause considerableproblems during poor winters if cattle are in backward condition. Internal parasites whichoccur are mainly summer species with the Barbers pole worm being the main offender. Cattleare usually drenched as weaners or before going on to crop. Some riparian properties alsoexperience fluke problems, particularly along the Dumaresq.
7.6 SHEEP
Table 7.21 shows sheep numbers and wool production in Inglewood Shire for thelast seven years and for selected years prior to 1969-70. Table 7.22 shows lambingperformance in Inglewood Shire for the same years.
Table 7.21
Inglewood Shire - Sheep Numbers and Wool Production
Year(31 March)
1945
1955
1960
1965
19 7019711972197319 7419751976
Sheep •NumbersNo.
401 592
325 968
419 716
447 217
411 989356 691323 010310 833275 707280 640292 302
SheepShornNo.
414 700
326 -843
437 469
453 402
416 080383 644329 987302 908278 146268 000273 000
WoolObtainedhi
1 189 366
1 055 249
1 486 520
1 733 565
1 657 6921 485 0771 389 0001 288 0001 15 7 0001 078 0001 233 000
FleeceWeight*g
2.87
3.23
3.40
3.82
3.983.874.204.254.164.034.51
HoldingsWith SheepNo.
184
216
236
228
215206198184176169166
Table 7.22
Inglewood Shire - Lambing Percentages
Year
1944-45
1954-55
1959-60
1964-65
1969-701970-711971-721972-731973-741974-751975-76
Ewes Mated
No.
96 054
70 086
112 469
114 655
103 23296 75967 23069 17969 64561 65764 198
Lambs Marked
No.
46 583
43 035
67 687
82 75 2
76 5525 7 02643 54943 77849 89238 07944 686
Lambs Markedto Ewes Mated%
48.5
61.4
60.2
72.2
74.258.964.863.371.661.869.6

.72.
The traprock soils generally produce lighter wool weights but of good qualitytending towards fineness in comparison with the better class soils where wool is inclinedto be heavier, bulkier and carrying vegetation faults and dust.
Lamb marking percentages are approximately 85 percent on the developed traprockand 60 to 65 percent on the undeveloped country. Rams are joined in the autumn and spring,but autumn is favoured where lamb production is important. Lambs are turned off between14 and 16 weeks where possible.
Factors affecting wool and lamb production are either as a- direct or indirectresult of seasonal conditions. External parasites, both lice and blowflies, and internalworm parasites, can prove troublesome most seasons.
Diseases and natural predators are only of very minor economic importance.
Lambing problems do occur, particularly where sheep are on good feed, but are ofno greater economic importance in this Shire than elsewhere.
Stocking rates are quite varied throughout the Shire, but on average are asfollows:
Dry Sheep Equivalents(DSE)
Undeveloped traprock 1:0.8 hectareDeveloped traprock 1:0.6 hectareImproved brigalow and alluvials 1:0.4 hectare
The location and nature of wool production systems in Inglewood Shire arediscussed in Section 6.4.3. Table 6.6 shows rural holdings in Inglewood Shire classifiedaccording to size of sheep flock and size of meat cattle herds at 31 March 1976. It is ofinterest that only 12 holdings in the Shire ran sheep without cattle at that date, and mostof these had less than 4000 sheep.
7.7 PIGS
The pig population of 2600 suggests that about 5000 pigs would be sold per year.These would have a farm gate value of approximately $300 000 at current values.
Pigs are sold on a dressed weight basis in Toowoomba, Brisbane and Casino and byauction in Warwick, Toowoomba and Brisbane. The majority are sold as baconers but some aresold as porkers and stores.
Thirty holdings have pigs. This is 10 percent of the total holdings in the Shire.Table 7.23 sets out pig numbers in Inglewood Shire in recent years and for selected yearsprior to 1969-70. In most cases the pig unit is a rather insignificant sideline. On theseholdings the pigs are fed on homegrown grain of feed quality, with some grazing andpurchased protein meals, and are reared outdoors.
On 12 holdings in Inglewood Shire in 1975-76 the pig enterprise contributed asignificant proportion of the total income. These units produce 70 percent of the totalpig production of the Shire.
In the large pig production units pigs are housed intensively and fed on homegrownor locally produced grain and purchased protein meals.
The motivation for keeping pigs usually springs from a desire to increase incomethrough intensification and often represents a particular interest on the part of onemember of the family.
The largest unit in the Shire is the 'Raby Park' Landrace and Large White stud ofP. & N. Batterham running approximately 100 sows at Limevale.
There is no indication of a marked change in the role of pig keeping in InglewoodShire in the near future.

.73.
The efficiency of production is reduced in many sideline units in which pigs arereared outdoors. These limitations are listed below:
(a) Feral boars disrupting planned breeding programmes;
(b) Foxes and crows attacking newborn piglets;
(c) Sunburn reducing the reproductive efficiency of sows;
(d) Food wastage - especially in wet weather;
(e) Dust irritating respiratory systems and harbouring mange mites;
(f) Impracticability of intensive husbandry techniques.
Indoor units overcome most of these factors but cost upwards of $1000 per sow toconstruct in a unit designed to produce baconers.
Housing needs to be designed to overcome high summer temperatures, especially forbreeding stock and low winter temperatures, especially for piglets.
Intensive baconer producing units require a minimum of 30 gallons of water persow per day.
The following levels of productive efficiency should be obtainable or exceeded inwell managed intensive units:
Pigs weaned per litter 8Litters per year 2Dressed weight at 26 weeks 60 kgFeed used per kilogram of carcass produced 5.5 kgPrime carcass gradings 90%
Table 7.23
Inglewood Shire - Pig Production
Year
1945
1955
1960
1965
1970197119721973197419751976
Number of Pigs
1476
1506
1049
1715
2080239926642783263521272526
Holdings with Pigs
79
62
39
34
37355046373131
Source: Australian Bureau of Statistics
7.8 BEEKEEPING
Eight beekeepers live in the Shire and operate about 1300 hives with a totalaverage annual production of about 100 tonnes of honey. The major producers are threecommercial apiarists who operate 1100 hives in partnership.
In years of blue-top and broadleaved ironbark honey flows the area is utilized byas many as 60 migratory beekeepers from south-east Queensland and from northern and centralNew South Wales. The areas mainly utilized are in the State forests, but private propertyis widely utilized as well. During these peak periods the area may support 25 000 beehives.Heavy honey flows from these two species occurs about each third year. During the interven-ing years the sandy areas are utilized during winter to maintain colonies, many of the shrubsand small bushes forming the ironbark and cypress pine forest undergrowth are importantpollen producers.

.74.
The agricultural and cleared areas are often utilized by beekeepers during springand early summer to obtain a build-up in colony strength. Important pollen producersflowering at this time are wild turnip, wild radish and blue heliotrope.
Mallee box is a useful autumn flowering species which produces a crop of honey insome years. Many beekeepers treat this species with caution as it has the reputation ofoccasionally causing dwindling in apiaries. That is, bee numbers in hives drop dramaticallyand apiaries are weakened to the extent that they are commercially useless for the numberof months it takes them to recover.
Narrow-leaved ironbark is a species that Is common in most areas of south-eastQueensland but is generally considered to be of minor importance as a honey producer. Largestands of narrow-leaved ironbark occur in Inglewood Shire and in this area the tree has thereputation of being of medium to major importance as a honey and pollen producer.
The two species of greatest importance to beekeepers in the Inglewood Shire arebluetop ironbark and broadleaved ironbark. These two species flower regularly and producelarge crops of first grade honey.
A number of species utilized by beekeepers for honey production occur in the Shire,The species are set out in Table 7.24. These species are used from year to year, dependingon budding, etc.
Table 7.24
Inglewood Shire - Useful Honey Flora
blue gumblue heliotropebluetop ironbarkbroadleaved ironbarkbrown boxcaley's ironbarklucernemallee boxnarrow-leaved ironbarktumble-down gumwat tieswhite boxwild radishturnip weedyellow box
E. tereticornisHeliotropium amplexicauleE. nubilisE. siderophloiaE. microcarpaE. caleyiMedicago sativaE. pillagaensisE. crebraE. dealhataAcacia spp.E. albensRaphanus raphanistrumRapi strum rugosumE. melliodora
Sources of Information
Agricultural Crops
1. Inglewood Field Station (trials results)
2. State Wheat Board (storage capacities)
'3. Australian Bureau of Statistics. Queensland Bulletins.(i) Part B - Rural Production (several years to 1973-74)(ii) Agricultural Industry, Sections 1 and 2, 1974-75(iii) Winter Growing Grains and Seeds, 1975-76(iv) Summer Growing Grains and Seeds, 19 75-76(v) Miscellaneous Crops, 1975-76(vi) Hay and Green Fodder, 1975-76
Horticultural Crops
1. Department of Primary Industries, Stanthorpe
2. Australian Bureau of Statistics. Queensland Bulletins,(i) Fruit Crops, 1975-76(ii) Vegetables, 1975-76

. 7 5 .
Pastures
1. Lee, G.R. and Rothwell, W.E.M. (1966) - Queensland Journal of Agriculture and AnimalSciences. 23(2):287
2. Swann, I . (1976) - 'Native Pasture' and 'Improved Pasture' in Wills, A.K. (ed) Graniteand Traprock Area of South-East Queensland
3. Malcolmson, G.H. (1976) - 'Irrigated Lucerne for Hay' in Wills, A.K. (ed) Granite andTraprock Area of South-East Queensland
4. Australian Bureau of Statistics. Queensland Bulletins,(i) Hay and Green Fodder, 1974-75 and 1975-76
(ii) Part B - Rural Production (several years to 1973-74)
Beef Cattle
1. Department of Primary Industries, Warwick2. Llewelyn, D. (1975) - Winter Supplementation of Grazing Cattle with N.P.N. or Protein
Final Report of Beef Cattle Husbandry Branch Tria l No. WRK-CH444-BF
3. Nolan, et a l . (1974) - reported by Leng, R.A., Kempton, T.J. and Nolan, J.V. inA.M.R.C. Review (in press 1977)
4. Stanthorpe Beef School (1975) - Papers. Available at D.P.I . , Warwick
5. Australian Bureau of S t a t i s t i c s , Queensland Bul le t ins .(i) Part B - Rural Production (several years to 1973-74)( i i ) Agricultural Industry, Section 3, 1974-75( i i i ) Livestock on Rural Holdings, 1975-76(iv) Beef Cattle Breeds, Queensland, as at 31 March 1973
Sheep
1. Department of Primary Industries, Warwick
2. Australian Bureau of Statistics, Queensland Bulletins.(i) Part B - Rural Production (several years to 1973-74)(ii) Agricultural Industry, Section 3, 1974-75(ii i) Sheep and Wool Production, 1975-76
Pigs
1. Department of Primary Industries, Warwick
2. Australian Bureau of Statistics, Queensland Bulletins.(i) Part B - Rural Production (several years to 1973-74)(ii) Agricultural Industry, Section 3, 1974-75(iii) Livestock on Rural Holdings, 1975-76
Beekeeping
1. Queensland Department of Primary Industries, Entomology Branch, Brisbane
2. Blake, S.T. and Roff, C. (1958) - The Honey Flora of South-Eastern Queensland. Dept.Agric. and Stock. Qld Gov. Printer, Brisbane

.76.
8. REGISTER OF RESEARCH PROJECTS
8.1 INGLEWOOD FIELD STATION
This property was purchased ir. 195 3 as an existing tobacco farm, by the tobaccoindustry. Under the administration of the Department of Primary Industries, it was namedInglewood Tobacco Experimental Station and developed and staffed 'to undertake research intotobacco production problems'. The property of 29 hectares is located at Whetstone,
Following the decrease in district tobacco production from 1961 to 1964, activityon the Station remained static until 1968 when the Agriculture Branch of the Department ofPrimary Industries assumed full responsibility for the Station whereafter it was renamed,Inglewood Field Station. Activities were reorientated into general agriculture withinvestigational work being carried out in soil problems and irrigation techniques, andcrops such as navy beans, soybeans, wheat, barley, etc. Horticulture Branch have alsoestablished a Wine Grape Variety Trial and are investigating processing tomatoes. A smallorchard has been established to demonstrate varieties of stone fruit and systems of trickleirrigation.
The Station provides office facilities for district extension staff in generalagriculture and tobacco. Laboratory space is also available for visiting experimentalists.Quarterly meetings of the Macintyre-Duinaresq Irrigation Advisory Committee (convened jointlyby the Department of Primary Industries and Irrigation and Water Supply Commission) andother Departmental meetings are held in a conference room at the Station.
Inglewood Field Station is an official climate recording station for the Bureauof Meteorology. Instruments presently in operation at the Station include temperaturerecording equipment for both screen and earth temperatures, a rain gauge, a wind recorder,an evaporimeter and a sunshine recorder. Measurements are taken daily by Station staff.
8.2 DEPARTMENT OF PRIMARY INDUSTRIES
8.2.1 Inglewood Field Station
Project No. Project Officer in Charge
Tobacco
Wheat
INW-C24-ABINW-C24-ABINW-C30-ABINW-C30-ABHRS-C117-ABHRS-C117-AB
Barley
INW-C32-ABINW-C32-ABINW-C32-ABHRS-C117-ABHRS-C117-ABHRS-C99-AB
Varietal t r i a lBlue mould resistant strain t r i a lNitrogen and Potassium interaction t r i a lHail reclamation t r ia lPhosphate time of application t r i a lPotash time of application t r i a lNitrogen time of application t r i a lDesuckering t r i a lWeedicide t r i a l
Varietal t r i a lPopulation studyVarietal t r i a lVarietal t r i a lVarietaJ.' t r i a lVarietal t r i a l
Varietal t r i a lVarietal t r i a lVarietal t r i a lVarietal t r i a lVarietal t r i a lVarietal t r i a l
1960-611961-621962-631962-6 3196 3-64196 3-641963-641964-651965-66
1966-67196 7-681969-701970-711971-721972-73
J. Kerr
G.H. Malcolmson
196819711972197319741975
J
G
. KerrIE
.H. Malcomson!|II
II

.77.
Project No. Project Officer in Charge
Navy Beans
INW-C2 3-ABINW-C23-ABINW-C29-ABTBA-C156-ABTBA-C156-ABINW-C29-ABINW-C29-ABINW-C23-ABTBA-C156-AB
TBA-C200-ABTBA-C221-ABINW-C23-ABINW-C23-AB
Soybeans
WRK-C104-ABWRK-C104-ABWRK-C104-AB
Grain Sorghum
Maize
Varietal trialVarietal trialNitrogen fertilizer trialIrrigation frequency trialIrrigation frequency trialNitrogen fertilizer trialNitrogen fertilizer trialVarietal trialIrrigation frequency trialPlant population trialNitrogen time of application trialType of nitrogen trialVarietal trialVarietal trial
Varietal trialVarietal trialVarietal trial
Varietal trial
196819691969196919 70197019711971197119721973197419761976-77
1971-721973-741975-76
J
J
J
J
G
G
G
. Kerri t
i t
. Gunton
. Kerri i
i i
. Gunton""II
.H. Malcomson
.H. MalcomsonII
. Gibson
1968-69 J. Kerr
Cotton
HORTICULTURE
No II
PATHOLOGY
PPTVIIIPPTVIII
Fertilizer trial
Varietal trialVarietal trialFertilizer trial
Wine grape varietal trialTomato (processing) varietal trial
Ascoohyta avida control of tobaccoAscoohyta arida control of tobacco
1964-65
1958-591959-601961-62
19701975
1970-711971-72
B
KR
I
.A. RoddaII
. Winks
. McMahon
. HughesII
SPECIAL PROJECTS - 1967-7?
Crops (Studies at Ingtewood Field Station)
1. Characteristics of irrigable soils on Macintyre Brook
2. Soil properties correlation in the Macintyre Brook area3. Emergence of various summer and winter crops on crusting Inglewood soils4. Navy bean emergence on crusting soils of Macintyre Brook5. Navy bean emergence with various planting methods6. Navy bean emergence with chemical ameliorants7. Measurements of crust strength on Inglewood soils8. Soil amelioration under irrigation on Macintyre Brook9. Ageing in lucerne stands on Macintyre Brook10. Chemical amelioration effects on emergence on crusting Inglewood soils11. Infiltration study of different furrow shapes

.78.
Project No. Project Officer in Charge
Pastures
1. Grazing trial - supplementary lucerne for wool production (Texas)2. Barrel medic management and regeneration trial (Texas)3. Special testing (Karara)4. Lucerne fertilizer trial on traprock (Texas)5. Grazing trial - pasture (Rhodes grass) fattening - simmer and winter grain
cropping (Inglewood Field Station)
6. White Fringed Weevil (larvae) control x chemicals (Beebo)
8.2.2 Trials on District Properties in Inglewood Shire
Wheat
Fertilizer trialFertilizer trialPhosphate prediction trialVarietal trialPhosphate prediction trial
INW-C6-AB Phosphate, Nitrogen predic t ion t r i a lINW-C7-AB Phosphate residue t r i a lINW-C16-AB Phosphate, Nitrogen t r i a lINW-C20-AB Phosphate fertilizer residue trialINW-C30-AB Varietal t r ia lQWRI-C12-AB Nutrient screening tr ial (2)
Residual effect (2)Barley
QWRI-C12-AB
Navy Beans
INW-C23-AB
Soybeans
WRK-C104-AB
Nutrient screening t r i a l
Varietal t r i a l
1962-631963-641963-641964-651965-661965-661965-661966-6 71967-68196 7-6819741975
1974
D.
J .
M.
M.
Smith"
i t
1 1
i t
t i
"
Kerri t
Grundon
Grundon
1974-75
1974-75
G.H. Malcolmson
G.H. MalcolmsonVarietal t r i a l
8.3 C.S.I.R.O.
Nutrient studies of soils from Terrica Station (196 7-68)
8.4 LANDS DEPARTMENT
Timber control trials
8.5 FORESTRY DEPARTMENT
1. Timber control trials2. Cypress growth rate and production trials3. Introduced species (slash pine, etc.) adaptation and production trial
Sources of Information
1. Inglewood Field Station records
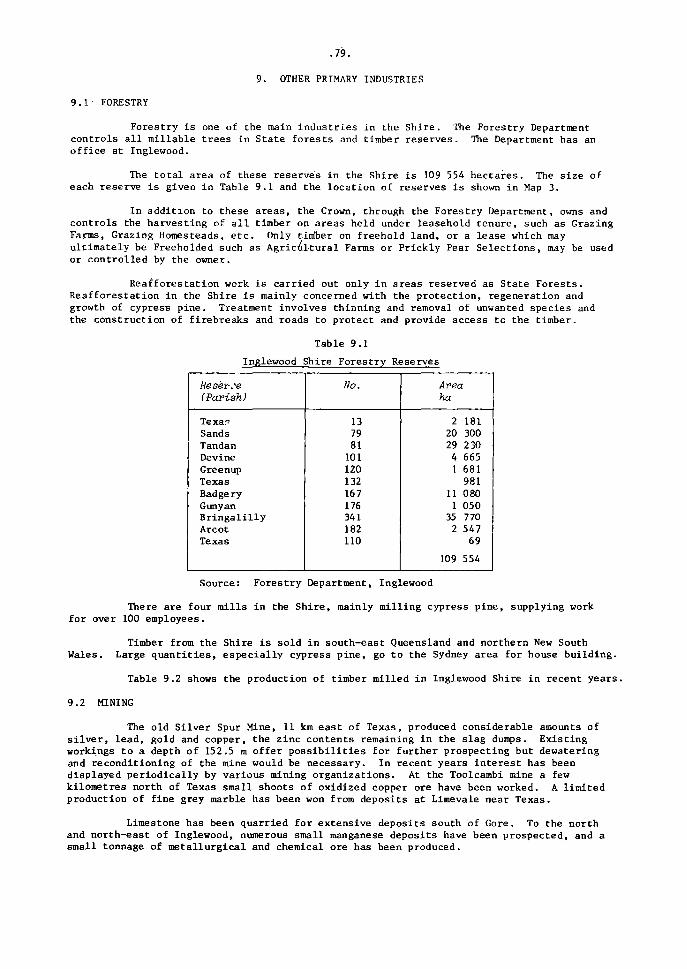
.79.
9. OTHER PRIMARY INDUSTRIES
9.1 FORESTRY
Forestry is one of the main industries in the Shire. The Forestry Departmentcontrols all millable trees in State forests and timber reserves. The Department has anoffice at Inglewood.
The total area of these reserves in the Shire is 109 554 hectares. The size ofeach reserve is given in Table 9.1 and the location of reserves is shown in Map 3.
In addition to these areas, the Crown, through the Forestry Department, owns andcontrols the harvesting of all timber on areas held under leasehold tenure, such as GrazingFarms, Grazing Homesteads, etc. Only timber on freehold land, or a lease which mayultimately be Freeholded such as Agricultural Farms or Prickly Pear Selections, may be usedor controlled by the owner.
Reafforestation work is carried out only in areas reserved as State Forests.Reafforestation in the Shire is mainly concerned with the protection, regeneration andgrowth of cypress pine. Treatment involves thinning and removal of unwanted species andthe construction of firebreaks and roads to protect and provide access to the timber.
Table 9.1
Inglewood Shire Forestry Reserves
fleser-.-e(Parish)
Texa<5SandsTandanDevineGreenupTexasBadgeryGunyanBringalillyArcotTexas
No.
137981
10112013216 71763A1182110
Areaha
2 18120 30029 2304 6651 681
98111 0801 050
35 7702 547
69
109 554
Source: Forestry Department, Inglewood
There are four mills in the Shire, mainly milling cypress pine, supplying workfor over 100 employees.
Timber from the Shire is sold in south-east Queensland and northern New SouthWales. Large quantities, especially cypress pine, go to the Sydney area for house building.
Table 9.2 shows the production of timber milled in Inglewood Shire in recent years.
9.2 MINING
The old Silver Spur Mine, 11 km east of Texas, produced considerable amounts ofsilver, lead, gold and copper, the zinc contents remaining in the slag dumps. Existingworkings to a depth of 152.5 m offer possibilities for further prospecting but dewateringand reconditioning of the mine would be necessary. In recent years interest has beendisplayed periodically by various mining organizations. At the Toolcambi mine a fewkilometres north of Texas small shoots of oxidized copper ore have been worked. A limitedproduction of fine grey marble has been won from deposits at Limevale near Texas.
Limestone has been quarried for extensive deposits south of Gore. To the northand north-east of Inglewood, numerous small manganese deposits have been prospected, and asmall tonnage of metallurgical and chemical ore has been produced.

.80.
Table 9.2
Inglewood Shire - Timber Milled1
(Crown supplies only)
Year
1969-701970-711971-721972-731973-741974-751975-76
Cypress Vine
16 25212 56514 45815 45214 91711 1008 948
Hardwood
n i l855
1 0321 5231 482
5691 178
SleepersNo.
30 39135 91647 20440 745n i l
3192 775
1 True volume. For the years to 1973-74 volumes have been converted from 'hoppus' usingfactor of 1.27 units true volume to 1 unit 'hoppus'.
Source: Department of Forestry, Inglewood
Sources of Information
1. Queensland Department of Forestry, Inglewood
2. Department of Mines, Queensland (1976) - Queensland Mining Guide. Consolidated Print.Co., Brisbane

.81.
10. OTHER SHIRE STATISTICS AND GENERAL INFORMATION
10.1 OTHER RURAL INDUSTRY STATISTICS
Table 10.1
Inglewood Shire - Area and Production of Major Crops
Crop
Total area usedfor crops
Total area oflucerne
Total area of othersown pastures
Grains and seeds -
Wheat
Barley
Grain sorghum
Sunflower
Navy beans
Soybeans
Millets
Tobacco
Annual Hay Crops
Green Fodder Crops -
Oats
Wheat
Barley
Sorghums
Other
Pastures for Hay -
Lucerne
Other
Total area ofvegetables
Total area oforchards
Total area of grapes
1971-72
Areaha
20
3
5
9
1
2
3
1
000
558
719
07-".
994
0?2
474
36
68
301
6
490
265
770
823
325
130
106
23
13
13
Prod,t
10
1
2
9
064
868
305
220
21
25
382
43
296
494
1972-73
Areaha
20
3
6
7
1
1
1
5
1
000
416
481
307
111
713
117
52
113
273
303
279
021
298
623
879
405
080
122
10
9
14i
Prod,t
5
2
9
033
781
304
372
48
105
54
461
447
774
467
1373-74
Areaha
17
1
10
5
1
3
1
000
657
256
291
458
961
393
111
103
255
254
28
800
496
992
454
495
936
56
6
10
18
Prod,t
5
1
6
039
140
714
105
114
146
36
364
112
255
178
1974-75
Areaha
18
1
10
4
2
3
3
1
1
000
880
597
645
416
192
266
161
135
465
252
33
354
486
374
065
407
118
92
94
7
15
Prod,t
3
2
2
9
618
613
784
103
151
238
15 7
338
76
6 39
262
1975-76
Areaha
17
1
5
5
4
2
2
000
517
048
803
073
012
141
315
91
227
262
154
210
386
255
495
137
898
46
67
11
16
Prod.t
7
5
3
6
734
191
003
133
152
128
104
351
426
1|
889
140
Source: Australian Bureau of /Statistics

.82.
Table 10.2
Inglewood Shire - Application of Artificial Fertilizer to Crops 1975-76
Pasturesand CrapsFertilised
LucerneOther pasturesWheatOatsBarleyGrain sorghumOther cerealsVegetablesFruitGrape vinesOther crops
Total
AreaFertilized
ha
106106229208952218
7237
26
380
2316
(
Super.
t
15252229941713611
53
2 76
luantity and Type of Fertilizer Used
Straight Nitrogenous Type
Urea
t
115
101650
915
140
148
Sulphateof Ammoniat
15
3
18
Other
t
3
8
11
Othert i>nc u.
Potash)
t
2
22
1105
112
Source: Aus t r a l i an Bureau of S t a t i s t i c s (unpublished data)
10.2 DEMOGRAPHY STATISTICS
Table 10.3
Inglewood Shire - Population Trends(Population at Census dates)
Census(30 June)
19331947195419611966197119 76
Inglewood
631800
1026105895 3974
10942
Texas
756858939
1266123010969172
Yelarbon*(part)
n .a .n.a .n .a .n .a .n . a .292 I2
Balance
29102399247625442954154611972
TotalShire
4297405 744414868418436453229
Source: Australian Bureau of Statistics1 Portion of Yelarbon within Inglewood Shire. Total population of Yelarbon at 30 June1976 was 286 (preliminary)
2 Preliminary figures
10.3 STATE GOVERNMENT SERVICES TO PRIMARY PRODUCERS
10.3.1 Department of Primary Industries
Service Location
Agriculture Inglewood Field Station
Apiculture Entomology Branch,
Brisbane
Beef Cattle Husbandry Warwick
Economist Warwick & Goondiwindi
Engineering Toowoomba
Entomology Toowoomba
Horticulture Stanthorpe
Service
Pathology
Pig Husbandry
Research(irrigated crops)
Sheep Husbandry
Soil Conservation Warwick
Standards Toowoomba
Stock Inspector Inglewood
Location
Toowoomba
Warwick
Inglewood Field Station
Warwick
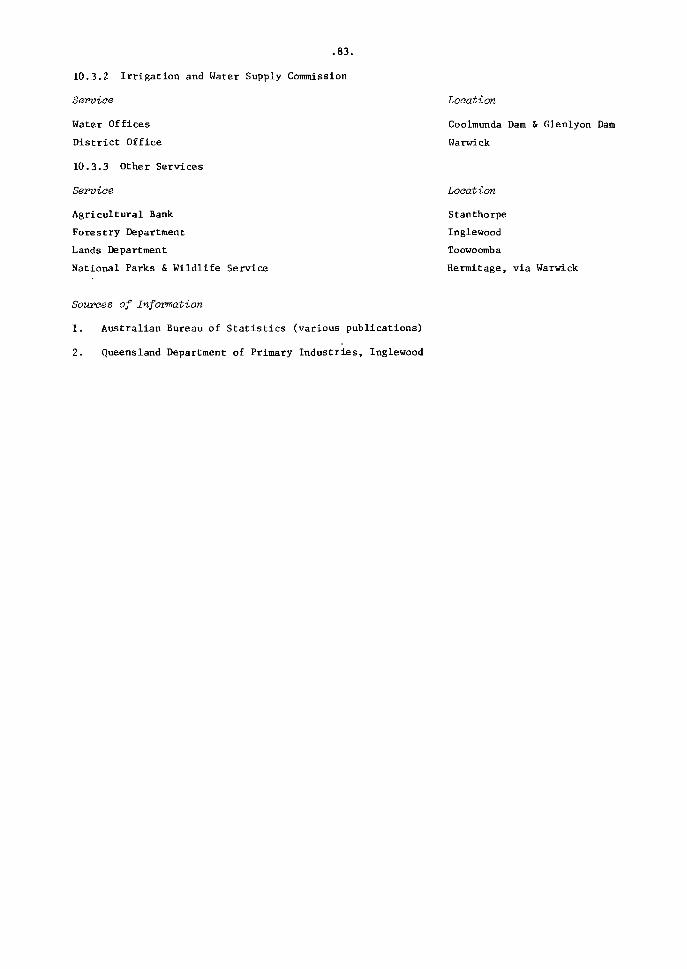
.83.
10.3.2 Irrigation and Water Supply Commission
Service
Water Offices
District Office
10.3.3 Other Services
Service
Agricultural Bank
Forestry Department
Lands Department
National Parks & Wildlife Service
Sources of Information
1. Australian Bureau of Statistics (various publications)
2. Queensland Department of Primary Industries, Inglewood
Location
Coolmunda Dam & Glenlyon Dam
Warwick
Location
Stanthorpe
Inglewood
Toowoomba
Hermitage, via Warwick

.84.
11. ECONOMICS1
11.1 INTRODUCTION
11.1.1 Present Situation in Inglewood Shire
Farming is by far the most important activity in the Inglewood Shire. In recentyears the gross value of crop production has exceeded the gross value fcr livestock andlivestock products. The last five years has seen the gross value of crop productionsteadily increase while the gross value for livestock products and especially livestock hasfluctuated markedly.
The area under cultivation appears stable at around 20 000 hectares while the areasown to lucerne has halved over the last five years. The area sown to other pasture hasfluctuated; influenced raainly by the recent low returns to livestock and the high returnsto crop, especially the winter grain crop. The area used for vegetables, orchards andgrapes has more than doubled in recent years.
Some 3300 hectares are irrigated in the Ir.glewood Shire. Cereals, lucerne andtobacco are the main crops (in terms of area) irrigated. Spray irrigation is the mostcommon method of application and in particular, travelling irrigators are the most popularas they require a lower labour input.
The high capital costs and the high production costs associated with irrigationa-e forcing many irrigators to look for crops with high returns. As a result increasedplantings of navy beans, soybeans and vegetables have occurred at the expense of the lowerreturn crops of winter cereal and summer sorghum.
In the early 1970s (up tc 1973) there was a marked swing out of sheep and intocattle. This trend reflected the prices received for cattle and wool at that time. 1974saw a decline in both sheep and cattle numbers while smaller incraasas have occurred incattle numbers since 1974, It is thought that this latter Increase is mainly due toproducers holding cattle in anticipation of better prices. Ho«e\-er, 1977 figures indicatethat producers have changed this attitude of holding cattle back from sale.
Sheep numbers have increased over the last three years. However, this increaseis expected to level off as the effects of overseas purchases of live sheep, especiallywethers, become evident.
The number of rural holdings with cattle, first increased froir. 1970 onwards butis now decreasing, while the number of rural holdings with sheep have been decliningsteadily since 1970 - a reflection of increasing production costs, especially labour.
Table 11.1
Inglewood Shire - Estimated Gross Value of Rural Production($'000)
iear
1971-721972-731973-741974-751975-76
Crops
22022378234228363700
Livestock
16192504309813631564
LivestockProducts
12482325204216991918
Total
51487207748358997182
Source: Australian Bureau of Statistics(Note: The estimated gross value in local authority areas is derived by applying the
State average unit value of production for each commodity or livestock item tothe physical volume of production originating in the area, and aggregating tomajor industry groups. While the figures provide an indication of the trends inrural production for Shires, the degree of accuracy for specific areas depends onthe deviation of actual local prices from State averages.)
1 As at September 1977

.85.
11.1.2 Gross Margin Analysis
When comparing alternative uses for cropland and pasture, a technique known as'Gross Margin Analysis' can be employed. A gross margin is simply a measure of profit andprovides a common basis for comparing and choosing between alternative activities. In thissection, the activities examined are crops, sheep and cattle in the Inglewood Shire.
The gross margin for an activity is given by the gross income (yield times pricesreceived) less those costs incurred in production (variable or direct costs). Variablecosts are those costs which vary directly with the size and/or level of production, andinclude such items as: fuel, fertilizer, chemical sprays, machinery repairs, seed anddirect labour costs. Not included are the Overhead and Fixed Costs which occur whetherproduction takes place or not. These include rates and rent, interest and loan repayments.The gross margin for an activity indicates the contribution which that activity will maketowards meeting overhead expenses and providing a profit.
To enable comparisons to be made between activities all gross margins should beexpressed in the same units (e.g. dollars per hectare) and preferably in terms of a commonlimiting resource such as land, labour or capital.
Direct comparisons should not be made between the gross margins of differentactivities without first taking into consideration other controlling factors such as theavailability of suitable labour, the capital requirements and the management level necessaryfor good performance.
The gross margins in this section are based on current and average values for suchparameters as commodity prices and yields. With changing prices and production conditionsthese gross margins will need to be recalculated before any decision can be made withrespect to the most profitable activity.
11.2 AGRICULTURAL CROPS
A wide range of summer and winter grain crops, lucerne and tobacco are grown inthe Inglewood Shire. Barley, wheat and sorghum are grown under both irrigation and drylandconditions while sunflower, french white millet, navy beans, soybeans, french beans, lucerneand tobacco are only grown under irrigation.
The gross margins for the grain crops are set out in Table 11.2 (irrigation) andTable 11.3 (dryland). The gross margins for lucerne and tobacco are dealt with separately.
11.2.1 Production and Cost Data for Grain Crops
Yields
Yields are based on district- averages.
Prices
Prices are grain prices obtained from the Queensland Graingrowers' Association,the Navy Bean Marketing Board and various seed merchants.
Land Preparation Costs
Land preparation costs will vary according to the operation, soil conditions andsize of plant. For this exercise, the costs are based on a 45 kW drawbar power (60 D.B.H.P.)tractor and include fuel and oil, repairs and maintenance. The operations are:
Cost $/ha
1 plough 51 scarify 31 scarify or 1 disc + pre-emergent spray 31 plant _3
U_2 interred cultivations for row crops _£
20
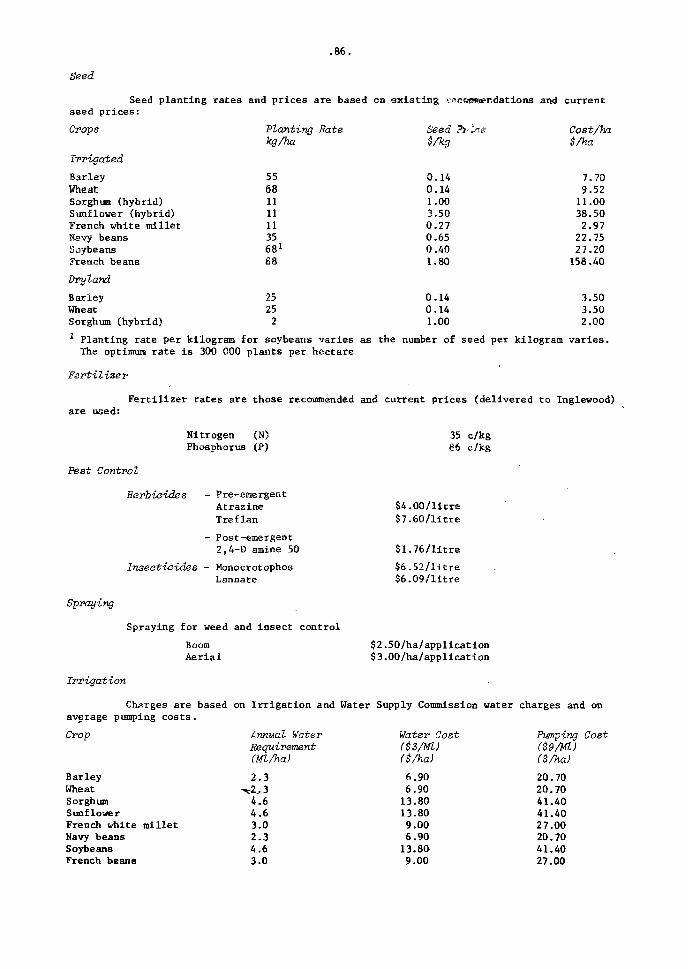
.86.
Seed
Seed planting rates and prices are based on existing \-acecfsendations and currentseed prices:
Planting Ratekg/ha
Crops
Irrigated
BarleyWheatSorghum (hybrid)Sunflower (hybrid)French white milletNavy beansSoybeans?rench beans
55681]111135681
88
Dryland
Barley 25Wheat 25Sorghum (hybrid) 21 Planting rate per kilogram for soybeans varies as the number of seed per kilogram varies.The optimum rate is 300 000 plants per hectare
Seea Fi-^te$/kg
0.140.141.003.500.270.650.401.80
0.140.141.00
Cost/ha$/ka
7.709.52
11.0038.502.97
22.7527.20
158.40
3.503.502.00
Fertilizer
are used:Fertilizer rates are those recommended and current prices (delivered to Inglewood)
NitrogenPhosphorus
(N)(P)
35 c/kg86 c/kg
Vest Control
Spraying
Herbicides - Pre-emergentAtrazineTreflan
- Post-emergent2,4-D amine 50
Insecticides - MonocrotophosLannate
Spraying for weed and insect control
BoomAerial
S4.00/litre$7.60/litre
$1.76/litre
$6.52/litre$6.09/litre
$2.50/ha/application$3.00/ha/application
Irrigation
Charges are based on I r r iga t ion and Water Supply Commission water charges and onaverage pumping cos ts .
Crop Annual Water Water Cost Pumping CostRequirement ($3/Ml) C$9/Ml)(Ml/ha) ($/ha) ($/ha)
BarleyWheatSorghumSunflowerFrench white mil le tNavy beansSoybeansFrench beana
2 . 3-«^.3
4.64.63.02 .34.63.0
6.906.90
13.8013.809.006.90
13.809.00
20.7020.7041.4041.4027.0020.7041.4027.00

.87.
Harvesting
Charges are based on local control rates which vary from crop to crop.of french beans is the responsibility of the processing firm.
Dryland cereals $15.00/haIrrigated cereals $18.00/haSunflower $30.00/haNavy and Soybeans $38.00/ha
Harvesting
Freight
Rail
Road
Barley from Inglewood to Warwick $ 3.60/tWheat from Inglewood to Brisbane $12.35/t
Sorghum, millet, sunflower, soybeans $12.00/tfrom Inglewood to Toowoomba
Navy beans from Inglewood to Kingaroy $10.00/t($18.00/t less rebate $8.00/t)
Levies
Levies for hail damage insurance.
Barley $ 2.00/tWheat $ 1.50/t
11.2.1 Gross Margins for Irrigated Crops
Table 11.2
Gross Margins for Irrigated Crops
GPOSS Margin/Cpop
Yield t/haPrice $/tGROSS REVENUE $/haLand preparat ionSeedFerti l izer N
PHerbicide
AtrazineTreflan2,4-D
InsecticideMonocrotophosLannate (3)
Boom sprayIrrigationWaterPumping
HarvestingFreight Rail
RoadLeviesVARIABLE COSTS
$/ha
GROSS MARGIN $/ha
Barley
3.575.0
262.5014.007.70
28.00
2.99
2.50
6.9020.7018.0012.60
7.00120.39
142.00
Wheat
2.5105.0262.50
14.009.52
28.00
2.99
2.50
6.9020.7018.0030.88
3.75137.24
125.00
Sorghum
5.070.0
350.0020.0011.0035.00
13'.44
1.94
4.56
5.00
13.8041.4018.00
60.00
224.14
126.00
Sunflower
2.0160.0320.0020.0038.5021.00
10.72
13.8041.4030.00
24.00
199.42
121.00
FrenchWhiteMillet
2.090.0
180.0014.002.97
29.75
1.94
2.50
9.0027.0018.0024.70
129.86
50.00
Navy Beans
1500 kg/ha46.0 c/kg
690.0020.0022.7535.008.60
10.72
25.587.50
6.9020.7038.00
15.00
210.75
479.00
Soybeans
2.5160.0400.0020.0027.20
6.60
10.72
25.587.50
13.8041.4038.00
30.00
222.80
177.00
FrenchBeans
5200 kg/ha14.5 c/kg
754.0020.00
158.4035.008.60
10.72
25.58>.50
9.0027.00
-
301.80
452.00
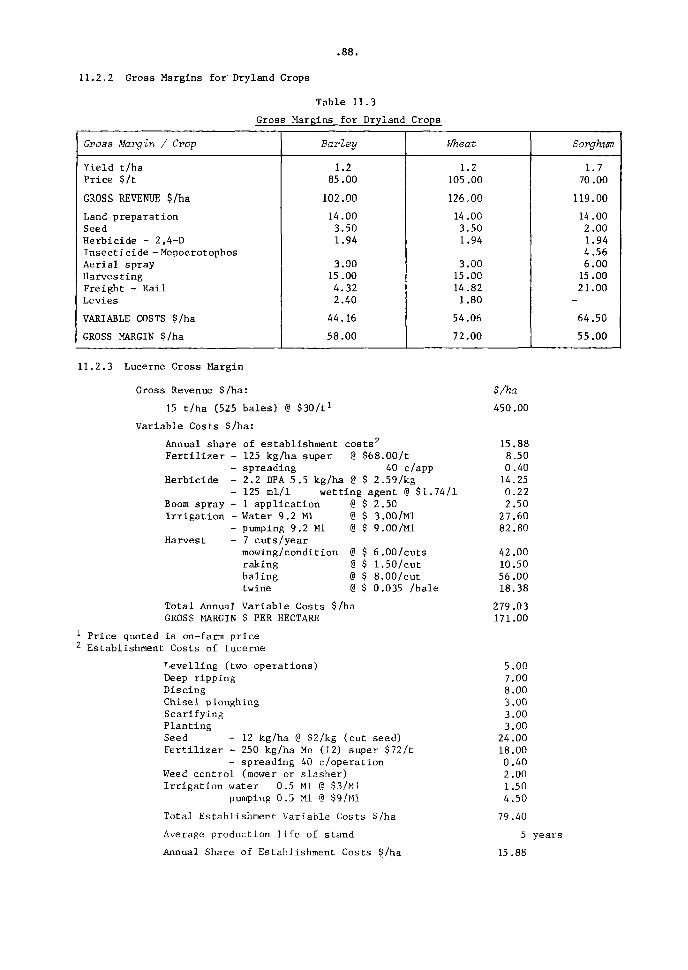
.88.
11.2.2 Gross Margins for' Dryland Crops
Table 11.3
Gross Margins for Dryland Crops
Gross Margin / Crop
Yield t/haPrice $/t
GROSS REVENUE $ / h a
Land prepara t ionSeedHerbicide - 2,4-DI n s e c t i c i d e -MonocrotophosAer ia l sprayHarvest ingFreight - Rai lLevies
VARIABLE COSTS $/ha
GROSS MARGIN $/ha
Barley
1.285.00
102.0014.003.501.94
3.0015.004.322.40
44.16
58.00
Wheat
1.2105.00
126.00
14.003.501.94
3.0015.0014.821.80
54.06
72.00
Sorghvm
1.770.00
119.0014.002.001.944.566.00
15.0021.00
-
64.50
55.00
11.2.3 Lucerne Gross Margin
Gross Revenue $/ha:
15 t /ha (525 bales) @ $30/t !
Variable Costs $/ha:
Annual share of establishment costs 2
Fer t i l i z e r - 125 kg/ha super @ $68.00/t- spreading 40 c/app
Herbicide - 2.2 DPA 5.5 kg/ha @ $ 2.59/kg- 125 ml/1 wetting agent @ $1.74/1
Boom sprayIrrigation
Harvest
1 applicationWater 9.2 Mlpumping 9.2 Ml7 cuts/yearmowing/conditionrakingbalingtwine
@ $ 2.50@ $ 3.00/M1@ $ 9.00/Ml
@ $ 6.00/cuts@ $@ $
1.50/cut8.00/cut
$ 0.035 /bale
Total Annual Variable Costs $/haGROSS MARGIN $ PER HECTARE
Price quoted i s on-farm p r i ceEstablishment Costs of lucerne
Level l ing (two opera t ions)Deep r ipp ingDiscingChisel ploughingScarifyingPlantingSeed - 12 kg/ha @ $2/kg (cut seed)Fer t i l i ze r - 250 kg/ha Mo (12) super $72/t
- spreading 40 c/operationWeed control (mower or slasher)I r r iga t ion water 0.5 Ml @ $3/Ml
pumping 0.5 Ml @ $9/Ml
Total Establishment Variable Costs $/ha
Average production l i f e of stand
Annual Share of Establishment Costs $/ha
$/ha450.00
15.888.500.40
14.250.222.50
27.6082.80
42.0010.5056.0018.38
279.03171.00
5.007.008.003.003.003.00
24.0018.000.402.001.504.50
79.40
5 years
15.88
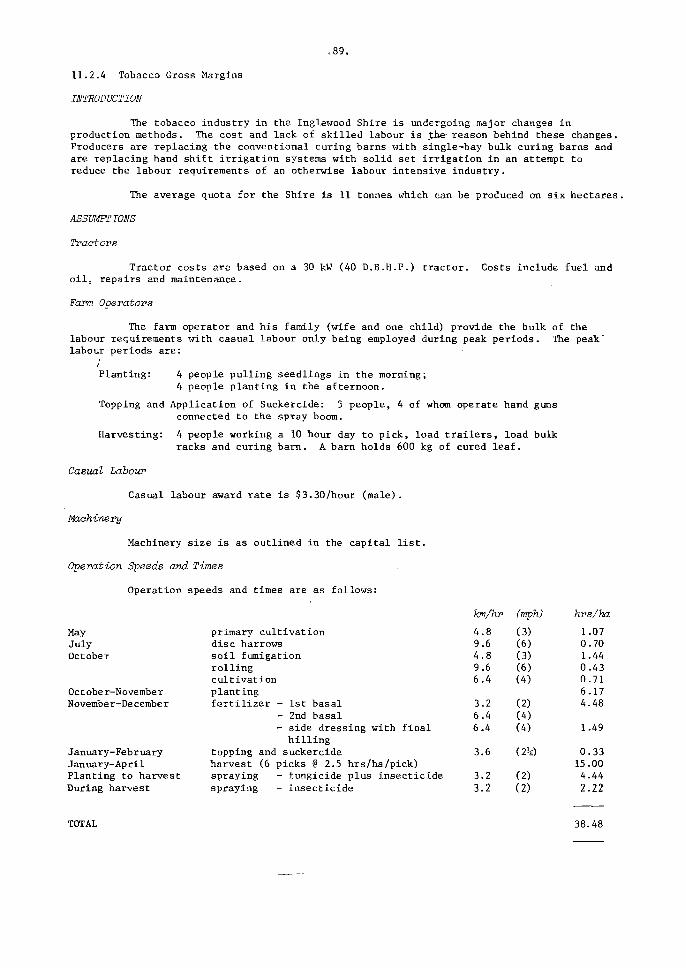
.89.
11.2.4 Tobacco Gross Margins
INTRODUCTION
The tobacco industry in the Inglewood Shire is undergoing major changes inproduction methods. The cost and lack of skilled labour is %h& reason behind these changes.Producers are replacing the conventional curing barns with single-bay bulk curing barns andare replacing hand shift irrigation systems with solid set irrigation in an attempt toreduce the labour requirements of an otherwise labour intensive industry.
The average quota for the Shire is 11 tonnes which can be produced on six hectares.
ASSUMPTIONS
Tractors
Tractor costs are based on a 30 kW (40 D.B.H.P.) tractor. Costs include fuel andoil, repairs and maintenance.
Farm Operators
The farm operator and his family (wife and one child) provide the bulk of thelabour requirements with casual labour only being employed during peak periods. The peak'labour periods are:
Planting: 4 people pulling seedlings in the morning;4 people planting in the afternoon.
Topping and Application of Suckercide: 5 people, 4 of whom operate hand gunsconnected to the spray boom.
Harvesting: 4 people working a 10 hour day to pick, load trailers, load bulkracks and curing barn. A barn holds 600 kg of cured leaf.
Casual Labour
Casual labour award rate is $3.30/hour (male).
Machinery
Machinery size is as outlined in the capital list.
Operation Speeds and Times
Operation speeds and times are as follows:
May primary cultivationJuly disc harrowsOctober soil fumigation
rollingcultivation
October-November plantingNovember-December fertilizer - 1st basal
- 2nd basal- side dressing with finalhilling
January-February topping and suckercide 3.6 (2h) 0.33January-April harvest (6 picks @ 2.5 hrs/ha/pick) 15.00Planting to harvest spraying - fungicide plus insecticide 3.2 (2) 4.44During harvest spraying - insecticide 3.2 (2) 2.22
TOTAL 38.48
km/hr4 .89.64 .89.66.4
3.26.46.4
(mph)(3)(6)(3)(6)(4)
(2)(4)(4)
hrs/h1.070.701.440.430.716.174.48
1.49

.90.
Yield
Yield, in kilograms of cured leaf per hectare, and price in dollars per kilogram,vary; however for the purpose of this exercise average values have been used.
GROSS MARGIN
Gross Revenue $/ha
YieldPriceGROSS REVENUE
kg cured leaf/ha$/kg$/ha
18003.10
5580
Variable Costs $/ha
Seedbed Costs - for a seedbed area to plant one hectare:
Tractor running expensesSoil fumigation - methyl bromideFertil izer - tobacco mix 315SeedMulch - peatmossInsecticide - lannateFumigicide - benzol
TOTAL SEEDBED COSTS
Field Costs:
Tractor running expensesSoil fumigation - 15% EDBPreemergent weedicide - nitralinFertilizer - basal - Tobacco mix 315
- sidedressing - potassiumnitrate
Insecticide - methomyl, 9 spraysFungicide - maneb et al., 12 spraysSuckercide - dodecanol alcohols et al.Spray irrigation - water ""*"*
- pumpingLabour - planting
- application of suckercide- topping
TOTAL FIELD COSTS
Harvesting and Marketing Costs:
Labour - 40 manhours (10 hours casual)are required to pick, load cartand load barn (3 barnloads perhectare)
- bulking, grading and packing isdone with family labour
Fuel for curing - 360 litre of distillateper barnload of 600 kg3 barnloads per hectare
Hessian bales with stringFreightResearch levyWarehouse levyTobacco Leaf Marketing Board levyCommissionInsurance
0.7 hrs2.8 kg7.0 kg4.4 g0.3 bales
100 gm50 1
38.48 hrs225 l i t r e /h r
1 kg/ha1 t/ha
124 kg/ha
0.25 kg/ha2.25 kg/ha
28 l i t re /ha6.3 Ml/ha6.3 Ml/ha
26 hr/ha16 hr/ha10 hr/ha
@ $@ $
1.93/hr2.94/kg
@ $ 1 6 5 . 0 0 / t o n n e
@@ $@ $@
@ $@@ $
3.6 c/g13.80/bale27.50/kg13.9 c/ l i t re
1.93/hr44.1 c / l i t re16.09/kg
@ 5 1 6 5 . 0 0 / t@ $ 2 8 1 . 6 0 / t
. s p r a y @ $ 27 .50
. s p r a y @ $ 3 . 2 1 / k g
@ $@ $@ $@ $@ $@ $
1.76/litre3.00/Ml9.00/Ml3.30/hr3.30/hr3.30/hr
1.358.241.160.164.142.756.95
$24.75
74.2799.2316.09
165 .0034.92
51.9886.6749.2818.9056.7085.8052.8033.00
$824.64
30 hrs/ha @ $ 3.30/hr
1080 litre/ha@ 10.78 c / l i t re
26 bales/ha @ $ 1.00/bale1.8 tonne @ $ 20.00/t
1800 kg/ha @ 1.1 c/kg1800 kg/ha @ 0.45 c/kg1800 kg/ha @ 2.0 c/kg2.5% of gross proceeds $55800.5% of gross proceeds $5580
99.00
116.42
26.0036.0019.808.10
36.00139.5027.90

509
1359
$4221
.98
.37
.00
.91.
Association levy for members of the South Queensland Tobacco Growers Cooperativeis not included since this is placed in a revolving fund and the grower receives paymentplus interest at the end of this period.
$Leaf and shed fumigation - 18 tablets/ha @ 7 c/tablet 1.26phosphine tablets (10 tablets/t)
TOTAL HARVESTING AND MARKETING COSTS
TOTAL VARIABLE COSTS $/ha
GROSS MARGIN PER HECTARE
CAPITAL ITEMS
Quota Size - 11 tonnes cured leaf from six hectares
30 kW (40 D.B.H.P.) tractorPlanter (one row)Disc harrows (1.8 metre)Soil fumigation equipmentRoller (two metre)Tool bar cultivator (1.8 m) - scarifier with fertilizer box
- rolling cultivators8 row offset spray system (boom tank trailer)Herbicide spray boom2 trailers3 single bay curing barns (15 racks, 600 kg)Baling press (hydraulic)Bulk shedIrrigation equipment (solid set)Sundry
TOTAL CAPITAL INVESTMENT (excluding land)
11.3 HORTICULTURAL CROPS
Apricots and grapes are the main horticultural crops grown in the Inglewood Shire.
In calculating the gross margins the costs have been divided into three categories:
Growing Costs
These costs vary with area but are not affected by yield or price received.
Harvesting, Freight, Levies and Handling Charges
These costs vary with yield and are calculated on a case or carton basis.
Marketing Costs
These vary with gross income and include commission and sales promotion levy.
11.3.1 Apricots
Growing costs • $300/ha
Harvesting, etc. 80 c/caseMarketing costs - commission 11% of gross sales
1 c/$2 gross sales
See also table 11.4.
7
2
120
11215
1
$63
000.00700.00800 .00300.00200.00700.00500.00000.00
30.00600.00000.00200.00000 .00024.00500.00
554.00

.92.
Table 11.4
Gross Margin - Apricots($/ha and $/case)
Price per Case
$
2
3
4
Unit
hacasehacasehacase
Yield per Hectare(10 kg oases)
250$
- 57.50- 0.23
1640.66
3851.54
500$
1850.37
6281.26
10702.14
750$
4280.57
10911.46
17552.34
1000$
6700.67
15551.56
24402.44
1250$
9130.73
20191.62
31252.50
11.3.2 Grapes
Growing costs (includes irrigation)Harvesting, etc..Marketing costs - commission
Table 11.5
Gross Margin - Grapes($/ha and $/case)
$716.00/ha$ 1.94/case11.5% of gross sales
Price pev Case
$
4
5
6
7
8
9
Unit
hacasehacasehacase.hacasehacasehacase
1000$
8840.88
17691.77
26542.65
35 393.54
44244.42
53095.31
Yield per Hectare(10 kg cases)
1250$
12841.03
23901.91
34962.80
46033.68
5 7094.57
68155.45
1500$
16841.12
30112.01
43392.89
56663.78
69944.66
83215.55
1750$
20841.19
36332.08
51812.96
67303.85
82794.73
98285.62
11.4 SHEEP
Merino breeding and, to a lesser extent, wether flocks dominate the sheep scene inthe Inglewood Shire. Very few property owners run crossbreed sheep for fat lamb production.
11.4.1 Merino Breeding Flock on Native Pasture
Flock Parameters
Wool Production
' Stook
EwesLambs (six months)Maiden ewesRams
Number Shorn
95070032528
Wool Cut /Head1
kg
4246
Total Wool/Classkg
380014001300168
* Includes crutchings

.93.
Stock Flow Diagram
|- 200 Replacement Ewes -
- 8 Replacement Rams -
1000 Ewes
30 Rams
50"Deaths"*"
150 CFA Ewes1
Sold
80% Lambing
800 Lambs
100 Deaths
350 Ewes 700 Weaners350 Wethers
Sold
25 Deaths
325 Maiden Ewes
125 Culls
Sold
Joining
5 months
Lambing
5 months
Weaning
12 months
Replacements
1 CFA - Cast for Age
Gross Margin - 1000 ewes and followers
6668 kg @ 5 1.10/kg1
150 hd @ § 3.00/hd2
125 hd @ $ 6.00/hd350 hd @ $ 6.00/hd
WoolCFA EwesCull maidensWether weaners
GROSS REVENUE
Replacement ramsWool selling expensesStock commissionShearingCrutchingLamb marking
MulsingJettingDrenching
DippingStock assessment
VARIABLE COSTS
GROSS MARGIN per 1000 ewes and followersGROSS MARGIN per ewe and followerGROSS MARGIN per hectare3
1 $1.10/kg is the average wool price including skirtings, crutchings, etc.
Stock prices quoted are on-farm prices3 Stocking rate of one ewe and follower per hectare
334.80450.00750.00100.00
810%4%
20031030
800400
1380138020031380
hd @grossgrosshd @hd @hd @hd @hd @hd @hd @hd @
$70.00/hdsales + 6 c/kgsales$ 1.20/hd20c/hd$20.00/100 hd$20.00/100 hd5 c/hd
25 c/hd5 c/hd2 c/hd
$10
1
2
$ 5
5
634.80
560.00133.56132.00403.60206.00160.0080.0069.00
345.00100.1527.60
216.91
417.895.425.42

.94.
11.4.2 Merino Wether Flock on Native Pastures
Flock Parameters
Wool Production
Stock
Wethers
Number
970
Wool Cut/Head1
5.4
Total Wool/Class
Kg
5238
1 Includes crutchings
Stock Flow Diagram
200 Replacements
Purchased1000 Wethers
30 Deaths
Replacements
12 months
170 CFA
Sold
Gross Margin - 1000 wethers
WoolCFA wethers
GROSS REVENUE
970 Wethers
5238 kg @ $1.10/kg1
170 hd @ $3.00/hd2
20010%4%97010001000100010001000
hd @grossgrosshd @hd @hd @hd @hd @hd @
$6.00/hdincome + 6sales$1.2052552
,20/hdc/hdc/hdc/hdc/hdc/hd
ReplacementsWool selling expenses 10% gross income + 6 c/kgStock commissionShearingCrutchingJettingDrenchingDippingStock assessment
VARIABLE COSTS
GROSS MARGIN per 1000 wethersGROSS MARGIN per wetherGROSS MARGIN per hectare3
1 $1.10/kg is the average wool price including skirtings, crutchings, etc.2 Stock prices quoted are on-farm prices3 Stocking rate is a wether to %
11.5 BEEF CATTLE
hectare
Shearing
5761.80510.00
$6271.80
1200.00890.4620.40
1164.00200 .0050.00250.0050.0020.00
$3844.86
2426.942.434.05
In this section the economics of a breeding herd turning off store weaners iscompared with one turning off store yearlings. In addition, the economics of crop fatteningon dryland and irrigated oats is investigated.

.95.
11.5.1 Store Weaner (6-10 months) Activity
Herd Parameters
Stock Flow Diagram
1 Death
1 Bull
100 Cows
3 Bulls3 Deaths•
17 Cull Cows
Sold
Mating(NovemberDecemberJanuary)
9 months
80 CalvesCalving
(AugustSeptemberOctober)
1 Death
21 HeiferReplacements
10 months
Weaning(May)
4 months
18 PrimeHeifers
Sold
39 PrimeSteers
Sold
Crop Fattened(SeptemberOctober)
Gross Margin - 100 breeders and followers (stores)
17 hd @ $ 50.00 ($30-$70)1
39 hd @ $ 60.00 ($30-$95)18 hd @ $ 50.00 ($25-$75)
$
850.002340.00900.00
Cull cowsStore weaner steersStore weaner heifers
GROSS REVENUE
Bull replacementVet costsSupplementary feedStock assessmentCommissionYardageFreight2
VARIABLE COSTS
GROSS MARGIN per 100 breeders and followers (stores)GROSS MARGIN per breeder and follower (store)GROSS MARGIN per hectare3
1 The figures in brackets, e.g. ($30-$70) are the range over which prices can vary for thatclass of stock. A simple average is used
2 Freight costs vary from property to property, depending on distance from markets. Freightcharges at the time of writing are - 3.5 c/hd/km for weaner stock; and 4.5 c/hd/km foradult stock
3 Stocking rate is one breeder and follower to eight hectares
11001201004%
74
s t o
hd @ $200.00 ($100-$500)hd @ $ 2.00hd @ $ 5.00hd @ 2 c
on gross saleshd @ 25 c
res)
$4090.00
200.00200.00600.00
2.00163.60
18.50
$1184.00
2906.0029.003.63

.96.
11.5.2 Prime Yearlings (10-14 months) Activity (Finishing Weaners)
The decision to crop fatten stock will depend on several factors, one of whichwill be the difference in price per kilogram between store and fat cattle.
Crop fattening assumptions for dryland and irrigated oats:
Dryland Oats
(a) Selling Price - Steers- Heifers
60 c/kg55 c/kg
Irrigated Oats
66 c/kg61 c/kg
(It is difficult to finish stock on dryland oats and the prices quoted are for forward stores)
(b) Stocking rate -
(c) Weight gain - Rate - Steers- Heifers
- No . of days- Total gain - Steers
- Heifers
3 weaners/ha57 weaners/19 ha
0.57 kg/hd/day0.55 kg/hd/day
100 days28.5 kg dressed wt27.5 kg dressed wt
6 weaners/ha57 weaners/9.5 ha
0.91 kg/hd/day0.81 kg/hd/day
140 days64 kg dressed wt5 7 kg dressed wt
The weight gain in kilograms per head per day is an average rate for all soiltypes in the Inglewood Shire.
Also an allowance has been made for those years (four years out of 10) whendryland oat production fails due to adverse climatic conditions.
(d) Value added
(e) Crop costs
- Steers- Heifers
- 1 plough- 1 scarify- 1 plant
Seed 25 kg/ha @ 17 c/kg
Total Costs Dryland
Water 4.6 Ml @ $3.00/MlPumping 4.6 Ml @ $9.00/Ml
Total Costs Irrigation
Gross Margin for Dryland Oats
SteersHeifers
GROSS REVENUE
CropDrenchCommission
VARIABLE COSTS
$17.10/hd$15.13/hd
$ 5.00$ 3.00$ 3.00$ 4.25
$13.80$41.40
39 hd @ $ 17.10/hd18 hd @ $ 15 .13/hd
19 ha @ $ 15.25/ha5 7 hd @ 50 c/hd4% of $939.24
$42.24/hd$34.77/hd
GROSS MARGIN per 57 store weanersGROSS MARGIN per hectare of dryland oatsGROSS MARGIN per 100 breeders and followers (fats)GROSS MARGIN per breeder and follower (fats)
Gross Margin for Irrigated Oats
SteersHeifers
GROSS REVENUE
39 hd @ $42.24/hd18 hd @ $34.77/hd
$15.25/ha
$70.45/ha
$
$
$
666272
939
2892837
356
58330
348934
1647625
$2273
.90
.34
.00
.75
.50
.57
.00
.00
.68/h.00.89
.36
.86
.00
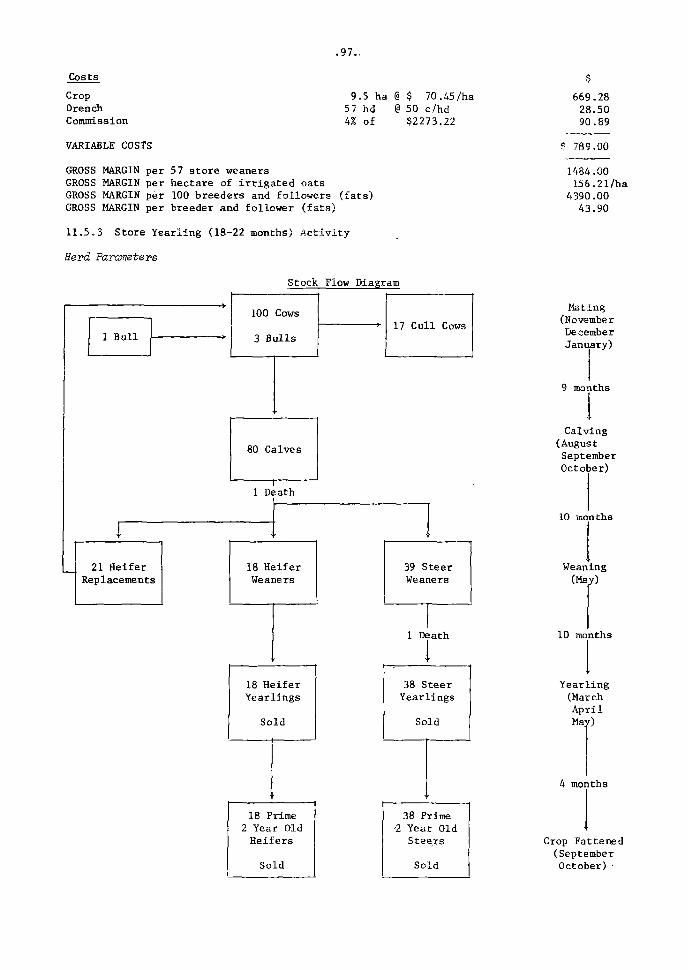
.97..
Costs
CropDrenchCommission
VARIABLE COSTS
9.5 ha57 hd4% of
@ $ 70.45/ha@ 50 c/hd$2273.22
GROSS MARGIN per 57 store weanersGROSS MARGIN per hectare of irrigated oatsGROSS MARGIN per 100 breeders and followers (fats)
GROSS MARGIN per breeder and follower (fsts)
11.5.3 Store Yearling (18-22 months) Activity
Herd Parameters
Stock Flow Diagram
$
669.2828.5090.89
$ 789.00
1484.00156.21 /ha
4390.0043.90
1 1
1 Bull
100 Cows
3 Bulls17 Cull Cows
80 Calves
1 Death
1 <21 Heifer
Replacements
I118 HeiferWeaners
39 SteerWeaners
l a
18 HeiferYearlings
Sold
:ath
38 SteerYearlings
Sold
18 Prime2 Year OldHeifers
Sold
38 Prime-2 Year Old
Steers
Sold
Hat(NoveDeceJam
9 mo
ingmbermberary)
nths
1Calving
(AugustSeptemberOctober)
10 mo
Wean(Ma
10 mo
nths
ingy)
nths
IYearling(MarchAprilMa;
4 mor
0
iths
Crop Fattene(SeptemberOctober) •

.98.
Gross Margin - 100 Breeders and Followers (stores)
17 hd @ $ 50 WO-STO) 1
38 hd @ $ 60 ($30-$95)18 hd @ $ 50 ($25-$75)
850.002280.00900.00
Cull cowsStore yearling steersStore yearling heifers
GROSS REVENUE
Bull replacementVet costsSupplementary feedStock assessmentCommissionYardageFre ight 2
VARIABLE COSTS
GROSS MARGIN per 100 breeders and followers ( s tores )GROSS MARGIN per breeder and follower ( s tores )GROSS MARGIN per hec t a r e 3
1 The figures in bracke t s , e . g . ($3O-$7O) are the range over which pr ices can vary for thatc lass of stock
2 Freight costs vary from property to property depending on the dis tance from markets.Freight charges at the time of wri t ing a re : 4.5 c/hd/km for adult stock
3 Stocking r a t e i s one breeder arid follower to 12 hectares
11.5.4 Prime Two-Year-Old (22-26 months) Act iv i ty (Finishing Yearlings)
Crop fa t tening assumption for dryland and i r r i g a t e d oa t s :
11001201004%
73
s t o)
hdhdhdhd
ofhd
r e s
@@@@
$200.00 ($100-$500)$ 2.25$ 5.002 c
gross salesQ
)
25 c
$4030.00
200.00225.00600.00
2.00161.2018.25
$1206.00
2824.0028.242.35
(a) Selling price - Steers- Heifers
Dryland Oats60 c/kg55 c/kg
Irrigated Oats
62 c/kg57 c/kg
It is difficult to finish stock on dryland oats and the prices quoted are forforward stores. There is a greater demand for younger stock, therefore the price for primetwo-year-olds is slightly lower than the price for prime yearlings.
(b) Stocking rate
(c) Weight gain - Rate - Steers- Heifers
- No. of days- Total gain - Steers
- Heifers
(d) Value added - Steers
- Heifers
(e) Crops costs
(See Section 11.5.2)
Gross Margin for Dryland OatsSteersHeifers
GROSS REVENUE
2.5 yearlings/ha56 yearlings/22.4 ha
0.64 kg/hd/day0.62 kg/hd/day
100 days32 kg dressed wt31 kg dressed wt
$19.20/hd$17.O5/hd
$15.25/ha
5 yearlings/ha56 yearlings/11.2 ha
1.0 kg/hd/day0.9 kg/hd/day
140 days70 kg dressed wt63 kg dressed wt
$43.30/hd$35.91/hd
$70.45/ha
38 hd @ $ 19.20/hd (for wt added)18 hd @ $ 17.05/hd (for wt added)
729.60306.90
$1037.00

.99.
Costs
CropDrenchCommission
VARIABLE COSTS
22.4 ha @ $ 15.25/ha56 hd @ 50 c/hd4% of @ $1036.50
GROSS MARGIN per 56 f a t y e a r l i n g sGROSS MARGIN per h e c t a r e of dry land o a t sGROSS MARGIN p e r 100 b r e e d e r s and fo l lowers ( f a t s )GROSS MARGIN pe r b reede r and fo l lower ( f a t )
341.6028.0041.46
$ 411.00
626.0027.95
3450.0034.50
Gross Margin for Irrigated Oats
SteersHeifers
GROSS REVENUE
CropDrenchCommission
VARIABLE COSTS
38 hd18 hd
@ $ 43.40@ $ 35.91
11.2 ha @ $ 70 .45/ha56 hd (3.50 c/hd4% of $2295.58
GROSS MARGIN pe r 56 f a t y e a r l i n g sGROSS MARGIN per h e c t a r e of i r r i g a t e d oa t sGROSS MARGIN per 100 b r e e d e r s and fo l lowers ( f a t s )GROSS MARGIN per b reede r and fo l lower ( f a t )
1649.20646.38
$2296.00
789.0428.0091.82
$ 909.00
1387.00123.84
4211.0042.11

. 9 9 .
Costs
CropDrenchCommission
VARIABLE COSTS
22.4 ha @ $ 15.25/ha56 hd @ SO c/hd4% of @ $1036.50
GROSS MARGIN per 56 fat yearlingsGROSS MARGIN per hectare of dryland oatsGROSS MARGIN per 100 breeders and followers (fats)GROSS MARGIN per breeder and follower (fat)
$
341.6028.0041.46
$ 411.00
626.0027.95
3450.0034.50
Gross Margin for Irrigated Oats
SteersHeifers
GROSS REVENUE
CropDrenchCommission
VARIABLE COSTS
3818
hdhd
@@
$$
4335
.40
.91
11.2 ha @ $ 70 .45/ha56 hd @ 50 c/hda of $2295.58
GROSS MARGIN per 56 fat yearlingsGROSS MARGIN per hectare of i r r iga ted oatsGROSS MARGIN per 100 breeders and followers (fats)GROSS MARGIN per breeder and follower (fat)
1649.20646.38
$2 296.00
789.0428.0091.82
$ 909.00
1387.00123.84
4211.0042.11

.100.
12. REFERENCES AND FURTHER READING
Anon, (n.d.) -Material on Texas (typescript and photocopies). Held in Oxley Library, Brisbane
Anon. (1901) - Tropical Industries. Tobacco growing at Texas. Queensland AgriculturalJournal Nov. 1901:485-6
Anon. (1913) -Tobacco at Texas and Inglewood. Queensland Agricultural Journal 30:148, March1913
Anon. (1975) -Resources and Industry of Southern Inland Queensland. A report for theQueensland Department of Commercial and Industrial Development by the School ofBusiness Studies, Darling Downs Institute of Advanced Education
Alcock, B.S. (1968) - Economic Returns from Irrigated Grape and Apricot Production in theMaaintyre Brook Area. (Mimeo.) Department of Primary Industries, Warwick
Alcock, B.S. (1973) - A survey of drought-affected properties in the traprock-granite area.Department of Primary Industries, Warwick
Alcock, B.S. (1975) - An economic study of major enterprises in the traprock-granite area.Department of Primary Industries, Economic Services Branch, Warwick
Australia Bureau of Meteorology (1961) - Climatologiaal Survey Region 6 - Western Downs,Queensland. Department of Supply, Central Drawing Office, Melbourne
Australia Post Master General (1971) - An Australian Post Office History, Inglewood. PostOffice Historical Society. Brisbane
Buchanan, M.E. (1973) - Immigrant tobacco growers in southern Queensland. Paper to 45thANZAAS Congress, Perth
Buchanan, M.E. (1973) - Agricultural change and adjustment : A study of tobacco growing insouthern Queensland and northern New South Wales. Unpublished PhD Thesis.University of New England. Armidale
Buchanan, M.E. (1974) - Tobacco growing in southern Queensland and northern New South Wales.Australian Tobacco Growers' Bulletin. 21:12
Cassidy, G.J. (1967) - Supplementary lucerne grazing for wool production in south-eastQueensland. Tropical Grasslands. 1(2):196
Cassidy, G.J., Lee, G.R. and Nation, J.G. (1973) - Effects of grazing lucerne supplementationand stocking rate on sheep and native pasture productivity in the Queenslandtraprock region - a final report. Queensland Journal of Agricultural and AnimalSciences. 30:281
Clarke, N.T. (1970) - Development alternatives (Traprock). Tropical Grasslands. 4(2):174
Clarkson, N.M. (1970) - Pasture research in the granite and traprock areas of south-eastQueensland. Tropical Grasslands. 4(2): 171
De Boer, A.J. (1973) - 'An economic assessment of the Dumaresq Valley Irrigation Project'in The Case Against the Pike Creek Dam, Queensland Conservation Council 16-34
Gibson, G. (1976) - Tobacco growing in south-west Queensland, (mimeographed pamphlets forsouth-west to-bacco growers). Queensland Department of Primary Industries,Inglawood
Glavimans, E.J.H. (1976) - Good traprock pastures need proper grazing management.Queensland Agricultural Journal. 102(5):468
Gunton, J.L. and Kerr, J.C. (1972) - Crusting hampers seedling emergence at Inglewood.Queensland Agricultural Journal. 98:60?

.101.
Isbell, R.F. (1957) - The soils of the Inglewood-Talwood-Tara-Glenmorgan region, Queensland.Queensland Bureau of Investigation Technical Bulletin Ho. 5
Isbell, R.F. (1957) - The occurrence of highly alkaline solonetz soil in southernQueensland (A description of the Yelarbon 'desert'). Queensland Journal ofAgricultural Science. 15(1): 15
Kerr, J.C. (1971) - Irrigation on the Macintyre Brook. Agriculture Branch TechnicalBulletin Ho. 10. Queensland Department of Primary Industries, Brisbane
Kerr, J.C. (1972) - Nitrogen fertilizer trials on irrigated navy beans. Queensland Journalof Agricultural and Animal Sciences. 29(4):281-7
Lawrence, M.J. (1975) - The financial situation of Australian tobacco growers : some resultsof an economic survey. Australian Tobacco Growers' Bulletin. 23:2-13
Lee, G.R. (1961) - To improve pastures in the traprock and granite soils of south-eastQueensland. Queensland Agricultural Journal. 87:149-58
Lee, G.R. and Rothwell, N.E.M. (1966) - Effects of grazing lucerne supplementation andstocking rate on sheep and native pasture productivity in the Queensland traprockregion. Progress report 1962-65. Queensland Journal of Agricultural and AnimalSciences. 23(2): 287
Lucas, K.G. (195 7) - The geology of the Terrica-Macintyre Brook Area. Unpublished HonoursThesis. University of Queensland, Brisbane
Lucas, K.G. (1958) - The sedimentary petrology of the Paleozoic rocks of the Border Riversarea, with a review of structure. Unpublished M.Sc. Thesis. University ofQueensland, Brisbane
Lucas, K.G. (1959) - New names in Queensland stratigraphy. Queensland-New South WalesBorder Rivers Area. Australian Oil and Gas Journal. 5(12):28-31
Lucas, K.G. (1960) - 'Border Rivers' (pp 139-140), 'The Border Rivers Area' (pp 142-143),'The Border Rivers Area' (pp 165-166), 'The Texas Area' (pp 229-235) in Hill, D.and Denmead, A.K. (ed.). The Geology of Queensland. Journal of GeologicalSociety of Australia. Vol. 7
McCosker, M. (1977) - Feature on Coolmunda Irrigation Area. Queensland Country Life.August 4, 1977
McNee, D.A.K. and Skerman, P.J. (1965) - Distribution of chlorides in the waters of thecatchment of the Macintyre Brook, southern Queensland, and their effect ontobacco production. Queensland Journal of Agricultural and Animal Sciences.22:39
McNee, P., McNee, D.A.K.and Rodda, B.A.T. (1969) - Tobacco reclamation after hail damage.Queensland Journal of Agricultural and Animal Sciences. 26:285-288
Murray, R.M. and Purcell, D.L. (1967) - Pastures in the sheep country. QueenslandAgricultural Journal. 93:284
Olgers, F., Flood, P.G. and Robertson, A.D. (1974) -Paleozoic geology of the Warwick andGoondiwindi .1:250 000 sheet areas, Queensland and New South Wales. AustraliaBureau of Mineral Resources, Geology and Geophysics Report 164
Pollard, D. and Kerr, J.C. (1970) - Enterprises involving cattle in conjunction withirrigated feeds on the Macintyre Brook (mimeo.) Queensland Department of PrimaryIndustries
Queensland Department of Primary Industries (1961) - Tobacco growing in Queensland.Courier Mail Printing Service, Brisbane
Queensland Department of Primary Industries (1976) - Tobacco growing in Queensland

.102.
Queensland Department of Primary Industries and Irrigation and Water Supply Commission(1963) - Joint report on water conservation and irrigation : Maointyre Brook
Queensland Department of Primary Industries and Irrigation and Water Supply Commission(1967) - Irrigation farming in the Maointyre Brook Area. Talks presented at theFarmers' Irrigation School. Inglewood
Queensland Department of Primary Industries and Irrigation and Water Supply Commission(1969) - Report on Proposed Dumaresq Valley Irrigation Project
Queensland Department of Primary Industries and Irrigation and Water Supply Commission(1976) - Irrigation in the Inglewood Shire. (Mimeo.) Department of PrimaryIndistries. Inglewood
Saint-Smith, E.C. (1974) - Geology and mineral resources of the Stanthorpe, Ballandean andWallangarra Districts, with notes on the Silver Spur Mine, Texas. Publicationsof the Geology Survey of Queensland No. 243
Siemon, J.E. (1973) - Limestone resources of the Warwick-Texas Area. Report of theGeological Survey of Queensland No. 80
Smith, D.W. (1967) - Irrigated farming along Macintyre Brook. Queensland AgriculturalJournal. 93:596
Thompson, J.K. (1972-73) - Costs of producing wool on traprock properties. Report No. 4,Economic Services Branch, Department of Primary Industries, Brisbane
Walsh, S.R. and Van Haeringen, J. (1967) - A survey of the Coolmunda Dam Irrigation Area -a review of present agricultural practices and aspects of future development.Queensland Department of Primary Industries, Brisbane
Waterson, D.B. (1968) - Squatter, selector and storekeeper. A history of the Darling Downs1859-1893. Sydney University Press, Sydney
Weston, E.J., Nason, C.N. and Armstrong, R.D.H. (1975) - Resources study and problemanalysis for primary industries in the Condamine-Maranoa Basin of southernQueensland. Queensland Journal of Agricultural and Animal Sciences. 32(2)
Wills, A.K. (1976) - The Granite and Traprock Area of south-east Queensland - A LandInventory and Land Utilization Study. Division of Land Utilization TechnicalBulletin No. 13. Queensland Department of Primary Industries, Brisbane
103
ACKNOWLEDGEMENTS
Officers Contributing Major Sections.
B. Powell, Agricultural Chemistry Branch, Brisbane Sections 4.1 and 4.2 and Map 4
E.A.H. Heijnen, Development Planning Branch, Warwick Section 4.3 and Map 5L.S. Pedley, Botany Branch, Brisbane Section 5 and Vegetation MapG. Gibson, Inglewood Field Station Section 6.3S.N. Ledger, Horticulture Branch, Stanthorpe Section 7.3D. Llewelyn, Beef Cattle Husbandry Branch, Warwick Section 7.5S. Mill, Economic Services Branch, Goondiwindl Section 11
Officers Providing Technical Advice and Editorial Assistance.
A.S. Greasley, Agriculture Branch, BrisbaneG.R. Lee, Agriculture Branch, BrisbaneD.K. Ward, Division of Plant Industry, BrisbaneA.K. Wills, Development Planning Branch, BrisbaneOfficers of Economic Services Branch, Brisbane
Other Departments.
The assistance provided by Warwick and Brisbane based officers of theIrrigation and Water Supply Commission in the compilation and editing of Section 3 isgratefully appreciated. Appreciation is also extended to the Queensland Department ofForestry, The Australian Bureau of Statistics and the Australian Bureau of Meteorology fordata used in this Handbook.
Handbook Preparation.
The text was typed by Miss Georgina Damon, Division of Plant Industry,Brisbane, and the maps were drafted by Drafting Section, Division of LandBrisbane.

S. R. HAMPSON, Government Printer, Brisbane