Analysis of infrastructure and logistics requirements for ...

February 19, 2021 2
Infrastructure/Cement/Logistics/Building materialMixed Q3 for infra; other segments outperform
Se
cto
r U
pd
ate
Q3FY2021 Results Review
Sector: Infra/Cement/ Logistics /Building material
Sector View: Positive
Our coverage universeCompanies CMP
(Rs)Reco. PT
(Rs)
Cement
Shree Cement 27500 Buy 31610
Ultratech Cement 6207 Buy 7200
Grasim Industries 1220 Buy 1430
The Ramco Cement
960 Buy 1000
JK Lakshmi Cement
376 Buy 410
Infrastructure
Sadbhav Engineering
77 Buy 100
KNR Constructions
213 Buy 270
Ashoka Buildcon 111 Buy 125
PNC Infratech 263 Buy 300
Building Materials
Supreme Industries
1971 Buy 2330
Century Plyboards
317 Buy 340
Greenlam Industries
939 Buy 1100
Kajaria Ceramics 969 Buy UR
Astral Poly Technik
2012 Hold 2100
Pidilite Industries 1782 Buy 1915
Logistics
Gateway Distrparks
174 Buy 210
Mahindra Logistics
487 Buy 562
TCI Express 954 Buy 1150Source: Company, Sharekhan Research, UR : Under Review
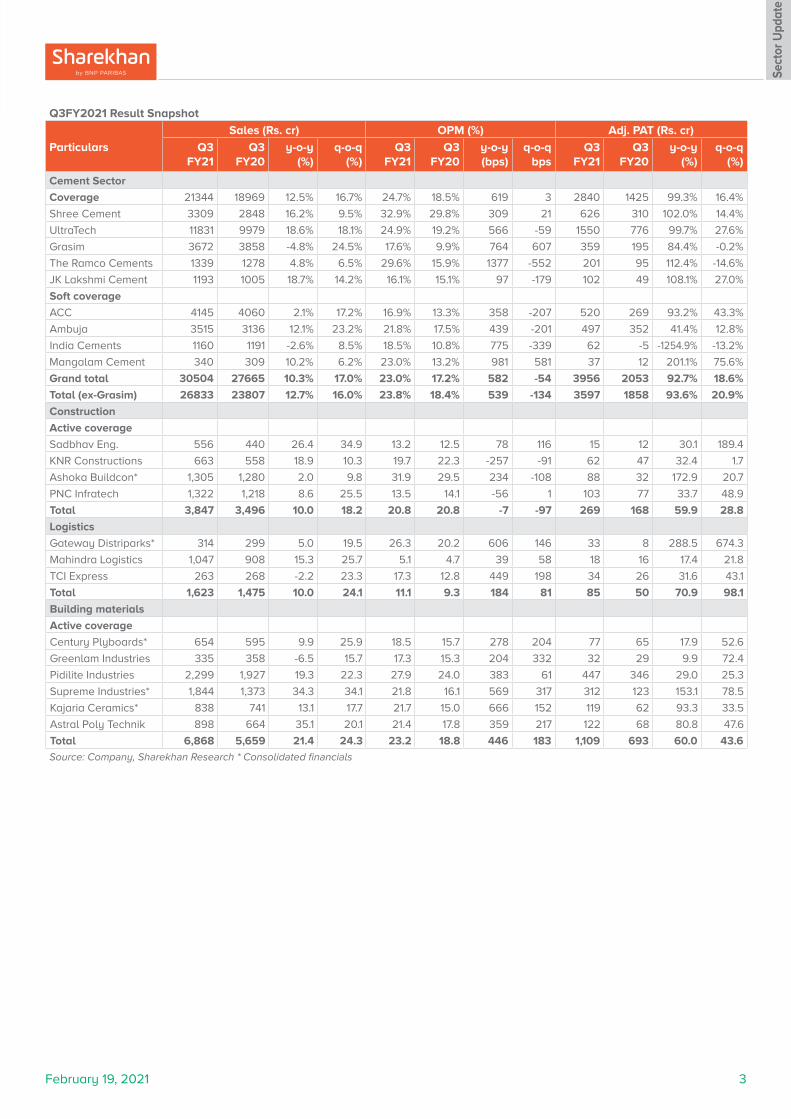
For Q3FY2021, the cement sector (ex-Grasim) reported a 12.7% y-o-y growth (+16.0% q-o-q) in net revenues, led by a 7.7% y-o-y rise (16.6% q-o-q) in volumes and a 4.7% y-o-y (-0.5% q-o-q) growth in realisations. Sustained demand from Individual builders and a pick-up in infrastructure demand led to a healthy uptick in demand. Further, the cement sector’s profitability strongly beat estimates, with weighted average EBITDA/tonne rising by 35.4% y-o-y (-4.7% q-o-q) to Rs. 1,206. The strong rise in realisations and a steep fall in other expenses (down 9.1% y-o-y per tonne) led to beat in EBITDA/tonne. The power and fuel cost declined by 1.8% y-o-y and freight costs up 3.3% y-o-y). Higher OPM (up 539 bps y-o-y) led to a beat in net profit (up 93.6% y-o-y). Barring The Ramco Cements and ACC, all the companies in our universe posted a strong beat on net earnings. The infrastructure sector reported mixed numbers, where KNR reported outperformance, Ashoka Buildcon under-performed, Sadbhav Engineering and PNC Infratech reported in-line numbers. Infrastructure players reported revenue/OPM/PAT growth of 10.0%/flat/up 59.9% y-o-y, respectively. A strong rise in net profitability for the infrastructure sector is attributable to a fall in depreciation (down 18.8% y-o-y), lower interest expense (down 19.6% y-o-y) and lower effective tax rate (31.9% versus 54.6% in Q3FY2020). In logistics, companies benefitted from the uptick in revenues, which led to better absorption of fixed costs driving operating margins and net profitability. Gateway Distriparks and TCI Express reported strong expansion in OPM while Mahindra logistics reported in-line numbers. Our set of logistics companies reported y-o-y growth in revenue/OPM/PAT of 10.0%/184 bps/70.9%. In the building materials space, all companies reported strong outperformance led by a higher-than-expected pick-up in demand (revenues up 21.4% y-o-y) coupled with higher absorption of fixed costs (OPM expansion of 446 bps y-o-y). Net earnings growth of 60% y-o-y was also supported by a decline in interest expense (down 70% y-o-y). Overall, during Q3FY2021, we saw strong outperformance in net earnings especially driven by operating margins expansion for cement, logistics and building materials players. Infrastructure players reported net earnings outperformance driven by improving execution and below the operating line items.
Outlook
Infra push and affordable housing led demand to sustain the momentum: We expect the cement and infrastructure segments to benefit from continued demand emanating from the rural sector along with government’s envisaged infrastructure investments over the next five years (also reiterated during the recent budget). The building materials space is expected to benefit from demand from individual home-builders, upcoming affordable housing projects and continued home improvement demand. The overall pick-up in economic activity and automobile demand has also led to strong demand for logistics sector. Improving EXIM and domestic volumes are expected to generate strong demand for the logistics sector. The strong growth in consumer sectors like FMCG, Pharma, Consumer Durables provide further growth opportunities for the logistics sector.
Valuation
Selective preference in each sector: We stay Positive on the cement space, as we see non-trade demand contributing to the strong trade demand growth going ahead. We have revised our price target for UltraTech to Rs. 7,200 and Shree Cement to Rs. 31,610 retaining a Buy on both of them. In the infrastructure space, we prefer quality managed companies having a strong order backlog and execution capabilities like KNR Construction, PNC Infratech, Sadbhav Engineering, Ashoka Buildcon. In logistics, we prefer companies with asset-light business models such as Mahindra Logistics and TCI Express. We have revised our price target for Gateway Distriparks to Rs. 210 and retained a Buy rating. In the building materials space, we prefer companies having inherent capabilities of strong cash generation and maintaining their leadership positioning in the sub-segments. We have revised our price target for Supreme Industries to Rs. 2,330 retaining a Buy rating.
Key Risks
Sustained macroeconomic weakness would lead to lowering of estimates and valuation multiples of companies.
Leaders in Q3FY2021 – UltraTech, Shree Cement, JK Lakshmi Cement, Grasim Industries, India Cements, Mangalam Cement, Ambuja Cements, KNR Constructions, PNC Infratech, Sadbhav Engineering, Gateway Distriparks, Mahindra Logistics, TCI Express, Century Plyboard, Greenlam Industries, Kajaria Ceramics, Astral Poly, and Supreme Industries.
Laggards in Q3FY2021 – The Ramco Cements, ACC, Ashoka Buildcon
Preferred Picks – UltraTech, Shree Cements, The Ramco Cements, JK Lakshmi Cement, KNR Construction, PNC Infratech, TCI Express, Pidilite Industries, Greenlam Industries and Supreme Industries.
Price chart
1500200025003000350040004500
25000300003500040000450005000055000
Feb-
20
Apr-
20
Jun-
20
Aug-
20
Oct
-20
Dec-
20
Feb-
21
BSE Sensex S&P BSE Basic Materials
February 19, 2021 3
Sect
or U
pdat
e
Q3FY2021 Result Snapshot
Particulars
Sales (Rs. cr) OPM (%) Adj. PAT (Rs. cr)
Q3 FY21
Q3 FY20
y-o-y (%)
q-o-q (%)
Q3 FY21
Q3 FY20
y-o-y (bps)
q-o-q bps
Q3 FY21
Q3 FY20
y-o-y (%)
q-o-q (%)
Cement Sector
Coverage 21344 18969 12.5% 16.7% 24.7% 18.5% 619 3 2840 1425 99.3% 16.4%
Shree Cement 3309 2848 16.2% 9.5% 32.9% 29.8% 309 21 626 310 102.0% 14.4%
UltraTech 11831 9979 18.6% 18.1% 24.9% 19.2% 566 -59 1550 776 99.7% 27.6%
Grasim 3672 3858 -4.8% 24.5% 17.6% 9.9% 764 607 359 195 84.4% -0.2%
The Ramco Cements 1339 1278 4.8% 6.5% 29.6% 15.9% 1377 -552 201 95 112.4% -14.6%
JK Lakshmi Cement 1193 1005 18.7% 14.2% 16.1% 15.1% 97 -179 102 49 108.1% 27.0%
Soft coverage
ACC 4145 4060 2.1% 17.2% 16.9% 13.3% 358 -207 520 269 93.2% 43.3%
Ambuja 3515 3136 12.1% 23.2% 21.8% 17.5% 439 -201 497 352 41.4% 12.8%
India Cements 1160 1191 -2.6% 8.5% 18.5% 10.8% 775 -339 62 -5 -1254.9% -13.2%
Mangalam Cement 340 309 10.2% 6.2% 23.0% 13.2% 981 581 37 12 201.1% 75.6%
Grand total 30504 27665 10.3% 17.0% 23.0% 17.2% 582 -54 3956 2053 92.7% 18.6%
Total (ex-Grasim) 26833 23807 12.7% 16.0% 23.8% 18.4% 539 -134 3597 1858 93.6% 20.9%
Construction
Active coverage
Sadbhav Eng. 556 440 26.4 34.9 13.2 12.5 78 116 15 12 30.1 189.4
KNR Constructions 663 558 18.9 10.3 19.7 22.3 -257 -91 62 47 32.4 1.7
Ashoka Buildcon* 1,305 1,280 2.0 9.8 31.9 29.5 234 -108 88 32 172.9 20.7
PNC Infratech 1,322 1,218 8.6 25.5 13.5 14.1 -56 1 103 77 33.7 48.9
Total 3,847 3,496 10.0 18.2 20.8 20.8 -7 -97 269 168 59.9 28.8
Logistics
Gateway Distriparks* 314 299 5.0 19.5 26.3 20.2 606 146 33 8 288.5 674.3
Mahindra Logistics 1,047 908 15.3 25.7 5.1 4.7 39 58 18 16 17.4 21.8
TCI Express 263 268 -2.2 23.3 17.3 12.8 449 198 34 26 31.6 43.1
Total 1,623 1,475 10.0 24.1 11.1 9.3 184 81 85 50 70.9 98.1
Building materials
Active coverage
Century Plyboards* 654 595 9.9 25.9 18.5 15.7 278 204 77 65 17.9 52.6
Greenlam Industries 335 358 -6.5 15.7 17.3 15.3 204 332 32 29 9.9 72.4
Pidilite Industries 2,299 1,927 19.3 22.3 27.9 24.0 383 61 447 346 29.0 25.3
Supreme Industries* 1,844 1,373 34.3 34.1 21.8 16.1 569 317 312 123 153.1 78.5
Kajaria Ceramics* 838 741 13.1 17.7 21.7 15.0 666 152 119 62 93.3 33.5
Astral Poly Technik 898 664 35.1 20.1 21.4 17.8 359 217 122 68 80.8 47.6
Total 6,868 5,659 21.4 24.3 23.2 18.8 446 183 1,109 693 60.0 43.6
Source: Company, Sharekhan Research * Consolidated financials

February 19, 2021 4
Sect
or U
pdat
e
Valuation
Company RecoPrice
target(Rs)
CMP (Rs)EV/EBITDA (x) P/E (x)
FY21E FY22E FY23E FY21E FY22E FY23E
Cement
Shree Cement Buy 31610 27500 19.4 17.0 14.7 39.9 36.3 31.9
Ultratech Cement* Buy 7200 6207 16.1 14.2 11.9 33.2 28.8 24.2
Grasim Industries* Buy 1430 1220 23.2 18.2 14.1 75.4 54.4 40.3
The Ramco Cement Buy 1000 960 15.3 13.8 12.0 24.6 22.9 20.2
JK Lakshmi Cement Buy 410 376 5.2 5.1 4.3 12.6 12.7 10.3
Soft coverage
India Cements Not Rated 165 9.9 9.6 8.6 34.9 33.7 25.9
Mangalam Cement Not Rated 273 6.4 4.8 3.8 14.0 9.0 7.3
Infrastructure
Sadbhav Engineering* Buy 100 77 10.0 5.6 5.2 124.8 9.9 8.9
KNR Constructions Buy 270 213 11.2 9.5 8.0 26.6 18.4 15.1
Ashoka Buildcon Buy 125 111 3.9 2.7 1.9 12.2 11.8 8.8
PNC Infratech Buy 300 263 10.8 8.4 7.2 20.0 15.6 12.9
Logistics
Gateway Distriparks Buy 210 174 9.4 9.0 7.8 30.8 25.6 19.5
Mahindra Logistics Buy 562 487 23.6 17.6 14.6 97.2 51.7 38.9
TCI Express Buy 1150 954 28.2 22.5 18.6 38.5 30.8 25.5
Building Materials
Century Plyboards Buy 340 317 23.3 19.5 16.1 34.6 29.0 24.2
Greenlam Industries Buy 1,100 939 15.7 11.7 10.1 33.4 21.3 17.0
Pidilite Industries Buy 1,915 1,782 52.7 42.7 35.7 82.5 65.6 54.5
Supreme Industries Buy 2,330 1,971 22.5 20.7 17.9 35.1 32.9 28.2
Kajaria Ceramics Buy UR 969 31.9 23.6 19.9 55.1 40.3 33.9
Astral Poly Technik Hold 2,100 2,012 53.5 47.4 37.7 85.6 74.8 57.4Source: Company, Sharekhan Research * Standalone financials
Upward/Downward revision in earnings estimate
Companies Change in Estimates
Reason Reco.Target Price
(Rs.)
Cement Active Coverage Stocks
Shree Cement Upwards We have revised our net earnings estimates upwards for FY2021E-FY2023E factoring in higher volume considering a sharp improvement in demand environment and healthy outlook going forward.
Buy 31,610
Ultratech Upwards We have increased our estimates for FY2021-FY2023E, factoring higher volume offtake considering strong pick up in cement demand to sustain going ahead.
Buy 7,200
Grasim Upwards We have increased our standalone net earnings estimates for FY2021-FY2023E factoring higher OPM for Viscose business.
Buy 1,430
The Ramco Cements Fine-tuned We have fine-tuned our estimates factoring lower volume offtake and higher EBITDA/tonne for FY2021-FY2023E.
Buy 1,000
JK Lakshmi Cement Upwards We have improved volume estimates for FY2021E-FY2023E leading to an upward revision in standalone net earnings.
Buy 410
Infrastructure Active Coverage Stocks
Sadbhav Engineering Fine-tuned We have lowered our estimates for FY2021, factoring in lower-than-expected pick up in execution. We have fine-tuned our estimates for FY2022-FY2023
Buy 100
KNR Constructions Upwards We have raised our earnings estimates for FY2021-FY2023, factoring higher execution run-rate and better OPM.
Buy 270
Ashoka Buildcon Upwards We have revised our earnings estimates upwards for FY2021E-FY2022E factoring strong improvement in toll revenues.
Buy 125
PNC Infratech Upwards We have revised our estimates for FY2021-FY2023E factoring higher execution run-rate and higher order intake.
Buy 300

February 19, 2021 5
Sect
or U
pdat
e
Upward/Downward revision in earnings estimate
Companies Change in Estimates
Reason Reco.Target Price
(Rs.)
Logistics Active Coverage Stocks
Gateway Distriparks Fine-tuned We have fine-tuned our estimates for FY2021E-FY2023E factoring improved profitability in both CFS and Rail verticals
Buy 210
Mahindra Logistics Fine-tuned We have fine-tuned our estimates for FY2021-FY2023E. We continue to remain optimistic on the strong growth potential that lies ahead for MLL.
Buy 562
TCI Express Upwards We have raised our estimates for FY2021-FY2023E factoring higher gross and operating margins.
Buy 1150
Building Materials Active Coverage Stocks
Century Plyboards Upwards We have revised our earnings estimates upwards for FY2021E-FY2023E factoring improved demand outlook coupled with better OPM.
Buy 340
Pidilite Industries Fine-tuned We have fine-tuned our earnings estimates to factor in higher VAM prices, double-digit growth in C&B segment, recovery in some of the international and domestic subsidiaries and consolidation of HAMSPL acquisition.
Buy 1915
Supreme Industries Upwards We have increased our earnings estimates for FY2021E-FY2023E, as we factor in higher-than-expected volume growth and OPM due to improved growth outlook going ahead.
Buy 2,330
Kajaria Ceramics Upwards We have increased our net earnings estimates for FY2021E-FY2023E, factoring higher volume and OPM.
Buy UR
Astral Poly Technik Upwards We have revised our estimates for FY2021-FY2023E factoring improved growth outlook along with better OPMs.
Hold 2100
Source: Company, Sharekhan Research
Company-wise volume (lakh tonne)
Companies Q3FY21 Q3FY20 y-o-y (%) Q2FY21 q-o-q (%)
Coverage 349.8 314.2 11.3% 303.4 15.3%
Shree Cement 71.6 62.5 14.7% 65.3 9.6%
UltraTech 228.2 200.0 14.1% 192.1 18.8%
The Ramco Cements 26.1 28.4 -8.1% 22.1 18.1%
JK Lakshmi Cement 23.9 23.3 2.5% 23.9 0.0%
Soft coverage 178.6 176.6 1.1% 149.7 19.3%
ACC 77.1 77.6 -0.6% 64.9 18.8%
Ambuja 70.1 65.4 7.2% 56.7 23.6%
India Cements 24.0 26.7 -10.0% 21.1 13.9%
Mangalam Cement 7.4 6.9 7.0% 7.0 5.9%
Grand total 528.4 490.8 7.7% 453.1 16.6%
Source: Company, Sharekhan Research
Company-wise realisation (Rs. per tonne)
Companies Q3FY21 Q3FY20 y-o-y (%) Q2FY21 q-o-q (%)
Coverage 5,052 4,810 5.0% 5,057 -0.1%
Shree Cement 4,622 4,561 1.3% 4,628 -0.1%
UltraTech 5,184 4,990 3.9% 5,215 -0.6%
The Ramco Cements 5,036 4,469 12.7% 5,368 -6.2%
JK Lakshmi Cement 4,426 4,319 2.5% 4,381 1.0%
Soft coverage 5,129 4,924 4.1% 5,198 -1.3%
ACC 5,376 5,232 2.7% 5,450 -1.4%
Ambuja 5,014 4,795 4.6% 5,031 -0.3%
India Cements 4,966 4,442 11.8% 5,016 -1.0%
Mangalam Cement 4,530 4,453 1.7% 4,575 -1.0%
Grand total 5,078 4,851 4.7% 5,104 -0.5%Source: Company, Sharekhan Research

February 19, 2021 6
Sect
or U
pdat
e
Power and fuel cost (Rs. per tonne)
Companies Q3FY21 Q3FY20 y-o-y (%) Q2FY21 q-o-q (%)
Coverage
Shree Cement 777 768 1.2% 728 6.7%
UltraTech 955 921 3.8% 875 9.2%
The Ramco Cements 818 911 -10.3% 823 -0.7%
JK Lakshmi Cement 799 907 -11.9% 863 -7.4%
Soft coverage
ACC 975 954 2.3% 970 0.6%
Ambuja 1000 1023 -2.3% 1014 -1.4%
India Cements 1242 1150 8.0% 1100 12.9%
Mangalam Cement 1201 1280 -6.2% 1078 11.4%
Grand Total 971 989 -1.8% 931 4.2%Source: Company, Sharekhan Research
Freight cost (Rs. per tonne)
Companies Q3FY21 Q3FY20 y-o-y (%) Q2FY21 q-o-q (%)
Coverage
Shree Cement 1138 1031 10.4% 1087 4.7%
UltraTech 1234 1170 5.5% 1185 4.1%
The Ramco Cements 1007 996 1.2% 977 3.1%
JK Lakshmi Cement 901 886 1.7% 852 5.8%
Soft coverage
ACC 1322 1275 3.6% 1331 -0.7%
Ambuja 1240 1281 -3.2% 1306 -5.1%
India Cements 1075 1024 5.0% 1007 6.8%
Mangalam Cement 1279 1240 3.2% 1268 0.9%
Grand Total 1149 1113 3.3% 1126 2.0%Source: Company, Sharekhan Research
Sharekhan Limited, its analyst or dependant(s) of the analyst might be holding or having a position in the companies mentioned in the article.
February 19, 2021 7
Valuation (Standalone) Rs cr
Particulars FY20 FY21E FY22E FY23E
Revenue 40,649 41,131 46,484 52,492
OPM (%) 23.1% 26.1% 25.5% 25.7%
Adjusted PAT 3,652 4,687 5,413 6,449
% YoY growth 44.6% 28.3% 15.5% 19.1%
Adjusted EPS (Rs.) 126.5 162.4 187.5 223.4
P/E (x) 49.1 38.2 33.1 27.8
P/B (x) 4.7 4.2 3.8 3.3
EV/EBITDA (x) 21.6 18.5 16.3 13.7
RoNW (%) 10.2% 11.6% 12.0% 12.7%
RoCE (%) 8.8% 9.5% 10.2% 11.1%Source: Company; Sharekhan estimates
Cement Sharekhan code: ULTRACEMCO Company Update
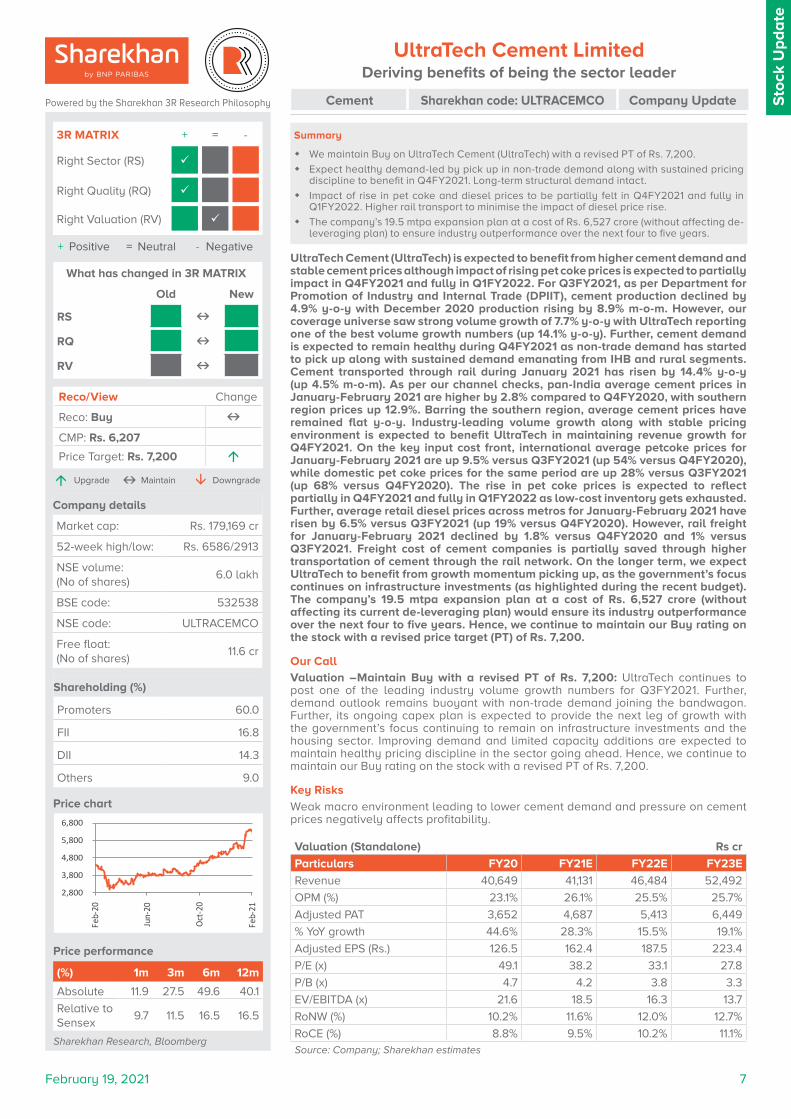
UltraTech Cement LimitedDeriving benefits of being the sector leader
UltraTech Cement (UltraTech) is expected to benefit from higher cement demand and stable cement prices although impact of rising pet coke prices is expected to partially impact in Q4FY2021 and fully in Q1FY2022. For Q3FY2021, as per Department for Promotion of Industry and Internal Trade (DPIIT), cement production declined by 4.9% y-o-y with December 2020 production rising by 8.9% m-o-m. However, our coverage universe saw strong volume growth of 7.7% y-o-y with UltraTech reporting one of the best volume growth numbers (up 14.1% y-o-y). Further, cement demand is expected to remain healthy during Q4FY2021 as non-trade demand has started to pick up along with sustained demand emanating from IHB and rural segments. Cement transported through rail during January 2021 has risen by 14.4% y-o-y (up 4.5% m-o-m). As per our channel checks, pan-India average cement prices in January-February 2021 are higher by 2.8% compared to Q4FY2020, with southern region prices up 12.9%. Barring the southern region, average cement prices have remained flat y-o-y. Industry-leading volume growth along with stable pricing environment is expected to benefit UltraTech in maintaining revenue growth for Q4FY2021. On the key input cost front, international average petcoke prices for January-February 2021 are up 9.5% versus Q3FY2021 (up 54% versus Q4FY2020), while domestic pet coke prices for the same period are up 28% versus Q3FY2021 (up 68% versus Q4FY2020). The rise in pet coke prices is expected to reflect partially in Q4FY2021 and fully in Q1FY2022 as low-cost inventory gets exhausted. Further, average retail diesel prices across metros for January-February 2021 have risen by 6.5% versus Q3FY2021 (up 19% versus Q4FY2020). However, rail freight for January-February 2021 declined by 1.8% versus Q4FY2020 and 1% versus Q3FY2021. Freight cost of cement companies is partially saved through higher transportation of cement through the rail network. On the longer term, we expect UltraTech to benefit from growth momentum picking up, as the government’s focus continues on infrastructure investments (as highlighted during the recent budget). The company’s 19.5 mtpa expansion plan at a cost of Rs. 6,527 crore (without affecting its current de-leveraging plan) would ensure its industry outperformance over the next four to five years. Hence, we continue to maintain our Buy rating on the stock with a revised price target (PT) of Rs. 7,200.
Our CallValuation –Maintain Buy with a revised PT of Rs. 7,200: UltraTech continues to post one of the leading industry volume growth numbers for Q3FY2021. Further, demand outlook remains buoyant with non-trade demand joining the bandwagon. Further, its ongoing capex plan is expected to provide the next leg of growth with the government’s focus continuing to remain on infrastructure investments and the housing sector. Improving demand and limited capacity additions are expected to maintain healthy pricing discipline in the sector going ahead. Hence, we continue to maintain our Buy rating on the stock with a revised PT of Rs. 7,200.
Key Risks
Weak macro environment leading to lower cement demand and pressure on cement prices negatively affects profitability.
Summary
� We maintain Buy on UltraTech Cement (UltraTech) with a revised PT of Rs. 7,200.
� Expect healthy demand-led by pick up in non-trade demand along with sustained pricing discipline to benefit in Q4FY2021. Long-term structural demand intact.
� Impact of rise in pet coke and diesel prices to be partially felt in Q4FY2021 and fully in Q1FY2022. Higher rail transport to minimise the impact of diesel price rise.
� The company’s 19.5 mtpa expansion plan at a cost of Rs. 6,527 crore (without affecting de-leveraging plan) to ensure industry outperformance over the next four to five years.
Sto
ck U
pd
ate
+ Positive = Neutral - Negative
3R MATRIX + = -
Right Sector (RS) ü
Right Quality (RQ) ü
Right Valuation (RV) ü
Powered by the Sharekhan 3R Research Philosophy
Company details
Market cap: Rs. 179,169 cr
52-week high/low: Rs. 6586/2913
NSE volume: (No of shares)
6.0 lakh
BSE code: 532538
NSE code: ULTRACEMCO
Free float: (No of shares)
11.6 cr
Shareholding (%)
Promoters 60.0
FII 16.8
DII 14.3
Others 9.0
Price performance
(%) 1m 3m 6m 12m
Absolute 11.9 27.5 49.6 40.1
Relative to Sensex
9.7 11.5 16.5 16.5
Sharekhan Research, Bloomberg
Reco/View Change
Reco: Buy CMP: Rs. 6,207
Price Target: Rs. 7,200 á
á Upgrade Maintain â Downgrade
Price chart
What has changed in 3R MATRIX
Old New
RS RQ RV
2,800
3,800
4,800
5,800
6,800
Feb-
20
Jun-
20
Oct-2
0
Feb-
21

February 19, 2021 8
Sto
ck U
pd
ate
Powered by the Sharekhan3R Research Philosophy
UltraTech to benefit from industry-leading growth and stable cement pricing environment
For Q3FY2021, as per DPIIT, cement production declined by 4.9% y-o-y with December 2020 production rising by 8.9% m-o-m. However, our coverage universe saw strong volume growth of 7.7% y-o-y with UltraTech reporting one of the best volume growth numbers (up 14.1% y-o-y). Further, cement demand is expected to remain healthy during Q4FY2021, as non-trade demand has started to pick up along with sustained demand emanating from IHB and rural segments. Cement transported through rail during January 2021 has risen by 14.4% y-o-y (up 4.5% m-o-m). As per our channel checks, pan-India average cement prices in January-February 2021 are higher by 2.8% compared to Q4FY2020 with southern region prices up 12.9%. Barring the southern region, average cement prices have remained flat y-o-y. Industry-leading volume growth along with stable pricing environment is expected to benefit UltraTech in maintaining revenue growth for Q4FY2021.
Pan-India cement price trend
Domestic petcoke price trends
Railways cement lead distance and freight trend
Source: Industry; Sharekhan Research
Source: Industry; Sharekhan Research
Source: Ministry of Railways; Sharekhan Research
Cement Production Trend
International petcoke price trend
Retail Diesel Price Trend
Source: DIPP; Sharekhan Research
Source: Industry; Sharekhan Research
Source: Ministry of Petroleum; Sharekhan Research
Rise in pet coke prices to fully reflect in Q1FY2022; Freight costs partially saved through rail transport
International average petcoke prices for January-February 2021 are up 9.5% versus Q3FY2021 (up 54% versus Q4FY2020), while domestic pet coke prices for the same period are up 28% versus Q3FY2021 (up 68% versus Q4FY2020). Rise in pet coke prices is expected to reflect partially in Q4FY2021 and fully in Q1FY2022 as low-cost inventory gets exhausted. Further, average retail diesel prices across metros for January-February 2021 have risen by 6.5% versus Q3FY2021 (up 19% versus Q4FY2020). However, rail freight for January-February 2021 declined by 1.8% versus Q4FY2020 and 1% versus Q3FY2021. Freight costs of cement companies is partially saved through higher transportation of cement through the rail network.
300
320
340
360
380
Jan-
19
Mar
-19
May
-19
Jul-1
9
Sep-
19
Nov-
19
Jan-
20
Mar
-20
May
-20
Jul-2
0
Sep-
20
Nov-
20
Jan-
21
Pan India Average Cement Price (Rs/bag)
50
70
90
110
130
Apr-1
9
Jun-
19
Aug-
19
Oct-1
9
Dec-
19
Feb-
20
Apr-2
0
Jun-
20
Aug-
20
Oct-2
0
Dec-
20
Feb-
21
US pet coke prices (CFR basis) ($/ton)
5000
7000
9000
11000
13000
Apr-1
9
Jun-
19
Aug-
19
Dec-
19
Feb-
20
Apr-2
0
Jun-
20
Aug-
20
Oct-2
0
Dec-
20
Feb-
21
RIL Petcoke price ex-yard Jamnagar (Rs/MT)
60
65
70
75
80
85
Apr-
19
Jun-
19
Aug-
19
Oct
-19
Dec-
19
Feb-
20
Apr-
20
Jun-
20
Aug-
20
Oct
-20
Dec-
20
Feb-
21
Retail diesel price (Rs/ltr)
1.2
1.3
1.4
1.5
1.6
1.7
460480500520540560580600
Apr-
19
Jun-
19
Aug-
19
Oct
-19
Dec-
19
Feb-
20
Apr-
20
Jun-
20
Aug-
20
Oct
-20
Dec-
20
Rail Lead Distance (km) Rail Freight (Rs/ton km)
-100.0-80.0-60.0-40.0-20.00.020.0
0.05.0
10.015.020.025.030.035.0
Apr-1
9
Jun-
19
Aug-
19
Oct-1
9
Dec-
19
Feb-
20
Apr-2
0
Jun-
20
Aug-
20
Oct-2
0
Dec-
20
Cement Production (mn tonnes) YoY growth (%)

February 19, 2021 9
Valuation (Standalone) Rs cr
Particulars FY20 FY21E FY22E FY23E
Revenue 11,904.0 12,442.9 13,862.3 15,355.8
OPM (%) 30.9 32.6 32.8 33.1
Adjusted PAT 1,570.2 2,264.5 2,482.9 2,828.2
% YoY growth 27.4 44.2 9.6 13.9
Adjusted EPS (Rs.) 435.2 627.6 688.1 783.8
P/E (x) 63.2 43.8 40.0 35.1
P/B (x) 7.7 6.7 5.8 5.1
EV/EBITDA (x) 25.2 22.4 19.6 17.1
RoNW (%) 13.9% 16.3% 15.6% 15.5%
RoCE (%) 13.0% 15.2% 14.7% 14.8%Source: Company; Sharekhan estimates
Cement Sharekhan code: SHREECEM Company Update
Shree CementPresence in key markets to drive growth
Shree Cement Limited (Shree Cement) is expected to benefit from a strong cement pricing environment in the northern region along with high cement demand from the eastern region. Cement price in the northern region during January-February 2021 increased by 1% versus Q4FY2020 (down 2% versus Q3FY2021). The northern region has witnessed high capacity utilisation, led by strong demand from infrastructure projects. Average cement prices in the eastern region during January-February 2021 are lower 2.2% versus Q4FY2020 (down 0.5% versus Q3FY2021). Cement prices in the eastern region have remained under pressure, although the region has continued to outperform on the demand front, led by strong trade demand. Shree Cement would be embarking on long-term capacity expansion plan to reach 57 mtpa and 80 mtpa over three year and six-seven year period, respectively. Consequently, the company has applied for mining approvals at various locations in Rajasthan, Gujarat, and Andhra Pradesh. In the near term, standalone capacity is slated to increase to 46.4 mtpa by FY2021E from 40.4 mtpa in FY2020. The company is undertaking 10,000-12,000 TPD clinker capacity at Chhattisgarh, which will be completed over 18-20 months. Shree Cement is currently trading at an EV/EBITDA of 17.1x its FY2023E earnings, which is at a premium to its peers owing to its strong operational efficiencies, presence in key regional markets, low absolute free float, and strong headroom for growth, led by its aggressive capacity expansion plans. We continue to maintain Buy on the stock with a revised PT of Rs. 31,610.
Benefits from cement pricing in north and demand in east: Shree Cement is expected to benefit from strong demand in east, led by high growth in the trade segment, driven by individual home builders’ segment. Demand in the northern region is driven by infrastructure projects, which is expected to maintain the growth momentum with increased government spending on the infrastructure sector over the next five years. Cement price in the northern region during January-February 2021 increased by 1% versus Q4FY2020 (down 2% versus Q3FY2021). Average cement prices in the eastern region during January-February 2021 are lower 2.2% versus Q4FY2020 (down 0.5% versus Q3FY2021). Shree Cement is expected to benefit from strong demand in the eastern region and stable pricing environment in the northern region going ahead.
Our CallValuation – Retain Buy with a revised PT of Rs. 31,610: Shree Cement continues to report industry-leading volume growth due to its presence in key regional markets viz. north and east. The company’s long-term capacity expansion plans are expected to capture the strong demand for the cement sector over the next five years, led by government spending on the infrastructure sector. Shree Cement is currently trading at an EV/EBITDA of 17.1x its FY2023E earnings, which is at a premium to its peers owing to its strong operational efficiencies, presence in key regional markets, low absolute free float, and strong headroom for growth led by its aggressive capacity expansion plans. We continue to maintain Buy on the stock with a revised PT of Rs. 31,610.
Key RisksWeak demand and pricing environment in north and east regions in India can negatively affect profitability.
Summary
� We retain our Buy rating on Shree Cement Limited (Shree Cement) with a revised PT of Rs. 31,610, as we expect it to report industry-leading growth led by rising capacity utilisation.
� Shree Cement is expected to benefit from strong cement pricing environment in north and high cement demand in east.
� Expect to continue to report industry-leading volume growth, driven by its presence in key regional markets viz. north and east.
� Capacity expansion plans to reach 57 mtpa over three years and 80 mtpa over six-seven years would provide sustainable long-term growth.
Sto
ck U
pd
ate
+ Positive = Neutral - Negative
3R MATRIX + = -
Right Sector (RS) ü
Right Quality (RQ) ü
Right Valuation (RV) ü
Powered by the Sharekhan 3R Research Philosophy
Company details
Market cap: Rs. 99,221 cr
52-week high/low: Rs. 29098/15500
NSE volume: (No of shares)
0.3 lakh
BSE code: 500387
NSE code: SHREECEM
Free float: (No of shares)
1.4 cr
Shareholding (%)
Promoters 62.6
FII 12.2
DII 11.1
Others 14.2
Price performance
(%) 1m 3m 6m 12m
Absolute 15.1 15.0 24.6 12.9
Relative to Sensex
12.8 -1.0 -8.5 -10.7
Sharekhan Research, Bloomberg
Reco/View Change
Reco: Buy CMP: Rs. 27,500
Price Target: Rs. 31,610 á
á Upgrade Maintain â Downgrade
Price chart
What has changed in 3R MATRIX
Old New
RS RQ RV
13,000
18,000
23,000
28,000
33,000
Feb-
20
Apr-2
0
Jun-
20
Aug-
20
Oct-2
0
Dec-
20
Feb-
21

February 19, 2021 10
Sto
ck U
pd
ate
Powered by the Sharekhan3R Research Philosophy
Healthy pricing discipline in north coupled with strong demand in east
Cement price in the northern region during January-February 2021 increased by 1% versus Q4FY2020 (down 2% versus Q3FY2021). The northern region has witnessed high capacity utilisation, led by strong demand from infrastructure projects. Average cement prices in the eastern region during January-February 2021 are lower 2.2% versus Q4FY2020 (down 0.5% versus Q3FY2021). Cement prices in the eastern region have remained under pressure, although the region has continued to outperform on the demand front led by strong trade demand. Shree Cement is expected to benefit from strong demand in the eastern region and stable pricing environment in the northern region going ahead.
North Cement Price Trend East Cement Price Trend
Source: Industry; Sharekhan Research Source: Industry; Sharekhan Research
250270290310330350370390
Jan-
19
Mar
-19
May
-19
Jul-1
9
Sep-
19
Nov
-19
Jan-
20
Mar
-20
May
-20
Jul-2
0
Sep-
20
Nov
-20
Jan-
21
Northern Region Avg Cement Price (Rs/bag)
250270290310330350370390
Jan-
19
Mar
-19
May
-19
Jul-1
9
Sep-
19
Nov
-19
Jan-
20
Mar
-20
May
-20
Jul-2
0
Sep-
20
Nov
-20
Jan-
21
Eastern Region Avg Cement Price (Rs/bag)

February 19, 2021 11
Valuation (Consolidated) Rs cr
Particulars FY20 FY21E FY22E FY23E
Revenue 1,237.2 1,138.8 1,187.1 1,301.1
OPM (%) 21.1 26.0 25.1 25.1
Adjusted PAT 50.7 70.7 85.0 111.5
% YoY growth (40.2) 39.5 20.3 31.1
Adjusted EPS (Rs.) 4.1 5.7 6.8 8.9
P/E (x) 43.0 30.8 25.6 19.5
P/B (x) 1.7 1.5 1.5 1.5
EV/EBITDA (x) 11.5 9.4 9.0 7.8
RoNW (%) 3.8 5.1 5.8 7.5
RoCE (%) 6.8 7.9 8.4 9.9Source: Company; Sharekhan estimates
Logistics Sharekhan code: GDL Company Update
+ Positive = Neutral - Negative
3R MATRIX + = -
Right Sector (RS) ü
Right Quality (RQ) ü
Right Valuation (RV) ü
Powered by the Sharekhan 3R Research Philosophy
Gateway Distriparks Limited Trade environment gaining momentum
Gateway Distriparks Limited (GDL) is expected to benefit from improving trade volumes since September 2020, with January 2021 maintaining the growth momentum. Major ports container volumes for January 2021 rose by 6.5% y-o-y to 13,746 tonne. Indian railways container volumes have risen by 16.7% y-o-y to 6.3 million tonne, where domestic volumes surged by 23.1% y-o-y to 1.3 million tonne and EXIM volumes grew by 15.1% y-o-y to 4.9 million tonne. Non-petroleum and non-gems and jewellery exports witnessed strong growth of 14.1% y-o-y for January 2021 at $22.44 billion. Non-oil and non-gold imports registered 5.8% y-o-y rise to $26.34 billion. The improving trade environment both domestically and EXIM bode well for GDL for both its rail and CFS business. The company expects early two-digit volume growth (combined CFS and Rail) for FY2023, while FY2024 is expected to be a blockbuster year with strong volume offtake expected from the commissioning of DFC corridor and fourth terminal at JNPT. GDL has also deleveraged its balance sheet, bringing down its consolidated net debt from Rs. 681 crore in FY2020 to Rs. 494 crore as of Q3FY2021. Its net debt/equity has come down from 0.51x to 0.34x over the same period. The company would be incurring capex of Rs. 120 crore over the next two years for setting up two satellite terminals in the rail division. GDL’s current valuation of 7.8x its EV/EBITDA and 1.5x P/B over FY2023E earnings leaves further room for upside, considering its improving operational profitability, focus on deleveraging, and revival of capex plans. Hence, we retain a Buy rating on the stock with a revised PT of Rs. 210.
Trade environment gaining momentum: GDL is expected to benefit from improving EXIM and domestic trade environment along with healthy profitability in both its CFS and rail verticals. The profitability in CFS in terms of EBITDA/TEU is expected to be Rs. 2,900-3,000/TEU as industry volume picks up and due to the company’s increasing value-added services such as last mile transportation. Rail EBITDA/TEU may correct to Rs. 8,000/TEU, as it may have to pass on some part of improved margins to customers with the commissioning of DFC.
Our Call
Valuation – Retain Buy with a revised PT of Rs. 210: GDL has been able to maintain strong operational profitability in CFS and has been improving rail profitability over the trailing three quarters. The company has also been benefitting from improved EXIM trade environment and reducing trade imbalance. The outlook for the company stays positive with commissioning of DFC and fourth terminal at JNPT, which should aid in strong volume offtake and sustained healthy margins. Further, its deleveraged balance sheet followed by a revival in capex plans is likely to aid in reviving net earnings going ahead. GDL’s current valuation of 7.8x its EV/EBITDA and 1.5x P/B over FY2023E earnings leaves further room for upside, considering its improving operational profitability, focus on deleveraging, and revival of capex plans. Hence, we retain a Buy rating on the stock with a revised PT of Rs. 210.
Key Risks
Erosion in rail and CFS segments’ profitability owing to elongated weakness in the trade environment.
Summary
� We retain Buy on Gateway Distriparks Limited (GDL) with a revised SOTP-based PT of Rs. 210, as we see further room for upside considering improving growth and profitability outlook for its key verticals.
� Container volumes at ports and railways see growth momentum picking up during January 2021. Merchandise exports and imports trade show an improving trend.
� Strong volume growth outlook during FY2023 and FY2024 led by improving EXIM trade environment, commissioning of western DFC line, and phase II JNPT expansion.
� Capex of Rs. 120 crore over the next two years for setting up two satellite rail terminals. Consolidated net debt reduced to Rs. 494 crore from Rs. 681 crore in FY2020.
Sto
ck U
pd
ate
Company details
Market cap: Rs. 2,177 cr
52-week high/low: Rs. 182/71
NSE volume: (No of shares)
1.3 lakh
BSE code: 532622
NSE code: GDL
Free float: (No of shares)
8.5 cr
Shareholding (%)
Promoters 32.1
FII 25.5
DII 28.6
Others 13.8
Price performance
(%) 1m 3m 6m 12m
Absolute 23.7 73.7 90.7 37.3
Relative to Sensex
21.4 57.7 57.5 13.7
Sharekhan Research, Bloomberg
Reco/View Change
Reco: Buy CMP: Rs. 174
Price Target: Rs. 210 á
á Upgrade Maintain â Downgrade
Price chart
What has changed in 3R MATRIX
Old New
RS RQ RV
60 80
100 120 140 160 180 200
Feb-
20
Jun-
20
Oct-2
0
Feb-
21

February 19, 2021 12
Sto
ck U
pd
ate
Powered by the Sharekhan3R Research Philosophy
Source: Industry; Sharekhan Research
Railways domestic container volume trend
Source: Industry; Sharekhan Research
Railways container volume trend
Railways EXIM container volume trend
Source: Industry; Sharekhan Research
Major ports container volume trend
Source: Industry; Sharekhan Research
Merchandise export (Non-oil, GJ) trend
Source: Industry; Sharekhan Research
Merchandise import (Non-oil, GJ) trend
Source: Industry; Sharekhan Research
-40
-30
-20
-10
0
10
20
02000400060008000
10000120001400016000
Jan-
20Fe
b-20
Mar
-20
Apr-2
0M
ay-2
0Ju
n-20
Jul-2
0Au
g-20
Sep-
20Oc
t-20
Nov-
20De
c-20
Jan-
21Port container volume (tonne) YoY growth (%)
-30
-20
-10
0
10
20
01234567
Jan-
20
Feb-
20
Mar
-20
Apr-2
0
May
-20
Jun-
20
Jul-2
0
Aug-
20
Sep-
20
Oct-2
0
Nov-
20
Dec-
20
Jan-
21
Total Rail container vol (mn tonnes) YoY growth (%)
-60
-40
-20
0
20
40
00.20.40.60.8
11.21.4
Jan-
20
Feb-
20
Mar
-20
Apr-2
0
May
-20
Jun-
20
Jul-2
0
Aug-
20
Sep-
20
Oct-2
0
Nov-
20
Dec-
20
Jan-
21
Domestic Rail container vol (mn tonnes)YoY growth (%)
-30
-20
-10
0
10
20
0
1
2
3
4
5
6
Jan-
20
Feb-
20
Mar
-20
Apr-2
0
May
-20
Jun-
20
Jul-2
0
Aug-
20
Sep-
20
Oct-2
0
Nov-
20
Dec-
20
Jan-
21
EXIM Rail container vol (mn tonnes) YoY growth (%)
-60
-40
-20
0
20
0
5
10
15
20
25
Jan-
20
Feb-
20
Mar
-20
Apr-2
0
May
-20
Jun-
20
Jul-2
0
Aug-
20
Sep-
20
Oct-2
0
Nov-
20
Dec-
20
Jan-
21
Non-petroleum and non-GJ exports ($bn)YoY growth (%)
-60-50-40-30-20-1001020
0
5
10
15
20
25
30
Jan-
20
Feb-
20
Mar
-20
Apr-2
0
May
-20
Jun-
20
Jul-2
0
Aug-
20
Sep-
20
Oct-2
0
Nov-
20
Dec-
20
Jan-
21
Non-oil, non-GJ imports ($bn) YoY growth (%)

February 19, 2021 13
Valuation (Consolidated) Rs cr
Particulars FY20 FY21E FY22E FY23E
Revenue 5,512 6,027 6,985 7,984
OPM (%) 15.1 18.5 17.3 17.5
Adjusted PAT 467 713 760 887
% YoY growth 22.5 52.5 6.6 16.8
Adjusted EPS (Rs.) 36.8 56.1 59.8 69.9
P/E (x) 53.6 35.1 32.9 28.2
P/B (x) 10.2 8.6 7.3 6.3
EV/EBITDA (x) 29.9 22.5 20.7 17.9
RoNW (%) 19.0 24.4 22.3 22.2
RoCE (%) 23.4 28.6 26.3 26.5
Source: Company; Sharekhan estimates
Building Materials Sharekhan code: SUPREMEIND Company Update
+ Positive = Neutral - Negative
3R MATRIX + = -
Right Sector (RS) ü
Right Quality (RQ) ü
Right Valuation (RV) ü
Powered by the Sharekhan 3R Research Philosophy
Supreme Industries LimitedFirm PVC price to sustain elevated OPM; Long-term growth levers intact
Supreme Industries Limited (SIL) has seen a strong run up of over 2x over YTD, led by steep rise in PVC prices. Since May 2020, PVC prices have continued their upward journey with prices as on date being up 88.8% (up Rs. 58/kg) to Rs. 123.6/kg. In the latest hike, PVC prices have increased by Rs. 2/kg (+1.6%) with effect from February 18, 2021, to Rs. 123.6/kg. PVC prices surged by 18.9% in Q2FY2021 (versus Q1FY2021 end), while they were up 28.6% in Q3FY2021 (versus Q2FY2021 end) and are further rising by 5.5% for Q4FY2021 till date (versus Q3FY2021 end). The tight supply-side issues globally have led to sharp run-up in PVC prices. The same had led to inventory gain of Rs. 94 crore and Rs. 80 crore for SIL during Q2FY2021 and Q3FY2021, respectively, leading to 501bps and 569bps y-o-y jump in OPM. The unabated rise in PVC prices may lead to further inventory gain for SIL in Q4FY2021, leading to higher OPM. The company is witnessing pickup in demand from metro cities in the housing sector. Demand for all its products remains strong, except in the agriculture sector. The company has gained market share during 9MFY2021 in both PVC and CPVC segments. Management expects Q4FY2021 to be better than Q4FY2020. Management expects 10%-12% sustainable volume growth in piping, although it is unable to ascertain value-led growth. The company also improved cash surplus to Rs. 432 crore from Rs. 215 crore in Q2FY2021. The company would be investing around Rs. 400 crore during this year, including carried forward commitment of Rs. 182 crore. The company is undertaking Brownfield expansion at seven sites and Greenfield expansion at three new sites. SIL aims to put these new plants in production in FY2022. On the long-term demand side, the company remains quite optimistic on rural, tier III, tier IV economies along with demand being generated for affordable housing pan-India. The stock is currently trading at 32.9x/28.2x its P/E on FY2022E/FY2023E earnings, which we believe leaves further room for upside, considering favourable outlook over FY2021E-FY2023E. Hence, we retain our Buy rating on the stock with a revised PT of Rs. 2,330.
Firm PVC prices to aid in healthy OPM: SIL reported 501 bps and 569 bps y-o-y jump in OPM during Q2FY2021 and Q3FY2021, led by strong rise in PVC prices. PVC prices were expected to decline during January 2021 with easing of demand supply issues globally. However, PVC prices continued to remain firm during January and February 2021 with Rs. 6.4/kg hike in price from Q3FY2021 exit prices. Hence, we expect SIL to further benefit from inventory gain during Q4FY2021, leading to sustained higher OPM for the third consecutive quarter.
Our Call
Valuation – Maintain Buy with a revised PT of Rs. 2,330: SIL has been one of the fastest to recover in the post unlock era in the building material sector, as it continued to benefit from rising PVC prices. The company’s growth outlook remains healthy going ahead, with PVC prices trending upwards during Q4FY2021 till date along with better volume offtake expected due to higher channel filling. On the long-term demand side, the company remains quite optimistic on rural, tier III, tier IV economies along with demand being generated for affordable housing pan-India. The stock is currently trading at 32.9x/28.2x P/E on FY2022E/FY2023E earnings, which we believe leaves further room for upside, considering favourable outlook over FY2021E-FY2023E. Hence, we retain our Buy rating on the stock with a revised PT of Rs. 2,330.
Key Risks
Slowdown in demand offtake could impact revenue growth rates. Adverse commodity price fluctuation might impact the margin profile.
Summary
� We retain Buy on Supreme Industries Limited (SIL) with a revised PT of Rs. 2,330, led by positive medium-term outlook along with strong net earnings growth over FY2021E-FY2023E.
� PVC prices continued their upward trajectory for Q4FY2021 till date, which may lead to elevated OPM for Q4FY2021.
� The company’s long-term growth levers in terms of demand generation from rural, tier III, tier IV economies along with demand generation from the affordable housing segment remain intact.
� The company will focus on appointing distributors, addition of products, and deeper penetration. Capex of Rs. 400 crore has been earmarked for this year.
Sto
ck U
pd
ate
Company details
Market cap: Rs. 25,038 cr
52-week high/low: Rs. 1,998/791
NSE volume: (No of shares)
4.3 lakh
BSE code: 509930
NSE code: SUPREMEIND
Free float: (No of shares)
6.5 cr
Shareholding (%)
FII 9
Institutions 25
Public & others 18
Promoters 49
Price performance
(%) 1m 3m 6m 12m
Absolute 16.3 21.1 51.8 42.0
Relative to Sensex
14.1 5.1 18.6 18.4
Sharekhan Research, Bloomberg
Reco/View Change
Reco: Buy CMP: Rs. 1,971
Price Target: Rs. 2,330 á
á Upgrade Maintain â Downgrade
Price chart
What has changed in 3R MATRIX
Old New
RS RQ RV
700 900
1,100 1,300 1,500 1,700 1,900 2,100
Feb-
20
Jun-
20
Oct-2
0
Feb-
21

February 19, 2021 14
Sto
ck U
pd
ate
Powered by the Sharekhan3R Research Philosophy
PVC prices continue to remain firm
PVC prices have since May 2020 continued their upward journey with prices as on date being up 88.8% (up Rs. 58/kg) to Rs. 123.6/kg. In the latest hike, PVC prices have increased by Rs. 2/kg (+1.6%) with effect from February 18, 2021, to Rs. 123.6/kg. PVC prices surged by 18.9% in Q2FY2021 (versus Q1FY2021 end), while they were up 28.6% in Q3FY2021 (versus Q2FY2021 end) and are further rising by 5.5% for Q4FY2021 till date (versus Q3FY2021 end). The tight supply-side issues globally have led to sharp run-up in PVC prices. The same had led to inventory gain of Rs. 94 crore and Rs. 80 crore for SIL during Q2FY2021 and Q3FY2021, respectively, leading to 501 bps and 569 bps y-o-y jump in OPM. The unabated rise in PVC prices may lead to further inventory gain for SIL in Q4FY2021, leading to higher OPM.
PVC Price Trend
Source: Industry; Sharekhan Research
60
70
80
90
100
110
120
130
Jan-
20
Feb-
20
Mar
-20
Mar
-20
Apr-2
0
Apr-2
0
Apr-2
0
May
-20
May
-20
May
-20
May
-20
Jun-
20
Jul-2
0
Jul-2
0
Aug-
20
Aug-
20
Sep-
20
Sep-
20
Nov-
20
Nov-
20
Dec-
20
Dec-
20
Jan-
21
Feb-
21
Feb-
21
PVC Prices (Rs/kg)

Understanding the Sharekhan 3R Matrix
Right Sector
Positive Strong industry fundamentals (favorable demand-supply scenario, consistent
industry growth), increasing investments, higher entry barrier, and favorable
government policies
Neutral Stagnancy in the industry growth due to macro factors and lower incremental
investments by Government/private companies
Negative Unable to recover from low in the stable economic environment, adverse
government policies affecting the business fundamentals and global challenges
(currency headwinds and unfavorable policies implemented by global industrial
institutions) and any significant increase in commodity prices affecting profitability.
Right Quality
Positive Sector leader, Strong management bandwidth, Strong financial track-record,
Healthy Balance sheet/cash flows, differentiated product/service portfolio and
Good corporate governance.
Neutral Macro slowdown affecting near term growth profile, Untoward events such as
natural calamities resulting in near term uncertainty, Company specific events
such as factory shutdown, lack of positive triggers/events in near term, raw
material price movement turning unfavourable
Negative Weakening growth trend led by led by external/internal factors, reshuffling of
key management personal, questionable corporate governance, high commodity
prices/weak realisation environment resulting in margin pressure and detoriating
balance sheet
Right Valuation
Positive Strong earnings growth expectation and improving return ratios but valuations
are trading at discount to industry leaders/historical average multiples, Expansion
in valuation multiple due to expected outperformance amongst its peers and
Industry up-cycle with conducive business environment.
Neutral Trading at par to historical valuations and having limited scope of expansion in
valuation multiples.
Negative Trading at premium valuations but earnings outlook are weak; Emergence of
roadblocks such as corporate governance issue, adverse government policies
and bleak global macro environment etc warranting for lower than historical
valuation multiple.Source: Sharekhan Research

Disclaimer: This document has been prepared by Sharekhan Ltd. (SHAREKHAN) and is intended for use only by the person or entity to which it is addressed to. This Document may contain confidential and/or privileged material and is not for any type of circulation and any review, retransmission, or any other use is strictly prohibited. This Document is subject to changes without prior notice. This document does not constitute an offer to sell or solicitation for the purchase or sale of any financial instrument or as an official confirmation of any transaction. Though disseminated to all customers who are due to receive the same, not all customers may receive this report at the same time. SHAREKHAN will not treat recipients as customers by virtue of their receiving this report.
The information contained herein is obtained from publicly available data or other sources believed to be reliable and SHAREKHAN has not independently verified the accuracy and completeness of the said data and hence it should not be relied upon as such. While we would endeavour to update the information herein on reasonable basis, SHAREKHAN, its subsidiaries and associated companies, their directors and employees (“SHAREKHAN and affiliates”) are under no obligation to update or keep the information current. Also, there may be regulatory, compliance, or other reasons that may prevent SHAREKHAN and affiliates from doing so. This document is prepared for assistance only and is not intended to be and must not alone be taken as the basis for an investment decision. Recipients of this report should also be aware that past performance is not necessarily a guide to future performance and value of investments can go down as well. The user assumes the entire risk of any use made of this information. Each recipient of this document should make such investigations as it deems necessary to arrive at an independent evaluation of an investment in the securities of companies referred to in this document (including the merits and risks involved), and should consult its own advisors to determine the merits and risks of such an investment. The investment discussed or views expressed may not be suitable for all investors. We do not undertake to advise you as to any change of our views. Affiliates of Sharekhan may have issued other reports that are inconsistent with and reach different conclusions from the information presented in this report.
This report is not directed or intended for distribution to, or use by, any person or entity who is a citizen or resident of or located in any locality, state, country or other jurisdiction, where such distribution, publication, availability or use would be contrary to law, regulation or which would subject SHAREKHAN and affiliates to any registration or licensing requirement within such jurisdiction. The securities described herein may or may not be eligible for sale in all jurisdictions or to certain category of investors. Persons in whose possession this document may come are required to inform themselves of and to observe such restriction.
The analyst certifies that the analyst has not dealt or traded directly or indirectly in securities of the company and that all of the views expressed in this document accurately reflect his or her personal views about the subject company or companies and its or their securities and do not necessarily reflect those of SHAREKHAN. The analyst further certifies that neither he or its associates or his relatives has any direct or indirect financial interest nor have actual or beneficial ownership of 1% or more in the securities of the company at the end of the month immediately preceding the date of publication of the research report nor have any material conflict of interest nor has served as officer, director or employee or engaged in market making activity of the company. Further, the analyst has also not been a part of the team which has managed or co-managed the public offerings of the company and no part of the analyst’s compensation was, is or will be, directly or indirectly related to specific recommendations or views expressed in this document. Sharekhan Limited or its associates or analysts have not received any compensation for investment banking, merchant banking, brokerage services or any compensation or other benefits from the subject company or from third party in the past twelve months in connection with the research report.
Either SHAREKHAN or its affiliates or its directors or employees / representatives / clients or their relatives may have position(s), make market, act as principal or engage in transactions of purchase or sell of securities, from time to time or may be materially interested in any of the securities or related securities referred to in this report and they may have used the information set forth herein before publication. SHAREKHAN may from time to time solicit from, or perform investment banking, or other services for, any company mentioned herein. Without limiting any of the foregoing, in no event shall SHAREKHAN, any of its affiliates or any third party involved in, or related to, computing or compiling the information have any liability for any damages of any kind.
Compliance Officer: Mr. Joby John Meledan; Tel: 022-61150000; email id: [email protected];
For any queries or grievances kindly email [email protected] or contact: [email protected]
Registered Office: Sharekhan Limited, 10th Floor, Beta Building, Lodha iThink Techno Campus, Off. JVLR, Opp. Kanjurmarg Railway Station, Kanjurmarg (East), Mumbai – 400042, Maharashtra. Tel: 022 - 61150000. Sharekhan Ltd.: SEBI Regn. Nos.: BSE / NSE / MSEI (CASH / F&O / CD) / MCX - Commodity: INZ000171337; DP: NSDL/CDSL-IN-DP-365-2018; PMS: INP000005786; Mutual Fund: ARN 20669; Research Analyst: INH000006183;
Disclaimer: Client should read the Risk Disclosure Document issued by SEBI & relevant exchanges and the T&C on www.sharekhan.com; Investment in securities market are subject to market risks, read all the related documents carefully before investing.
Know more about our products and services
For Private Circulation only