Infrastructure craze to bolster Africa's cement industry growth
24
1 © 2013 Frost & Sullivan. All rights reserved. This document contains confidential information and is the sole property of Frost & Sullivan. Strategic Outlook of sub-Saharan Africa’s Cement Industry Manufacturing Unit November, 2013
-
Upload
frost-sullivan -
Category
Business
-
view
1.413 -
download
0
Transcript of Infrastructure craze to bolster Africa's cement industry growth
1
© 2013 Frost & Sullivan. All rights reserved. This document contains confidential information
and is the sole property of Frost & Sullivan.
Strategic Outlook of sub-Saharan
Africa’s Cement Industry
Manufacturing Unit
November, 2013
2
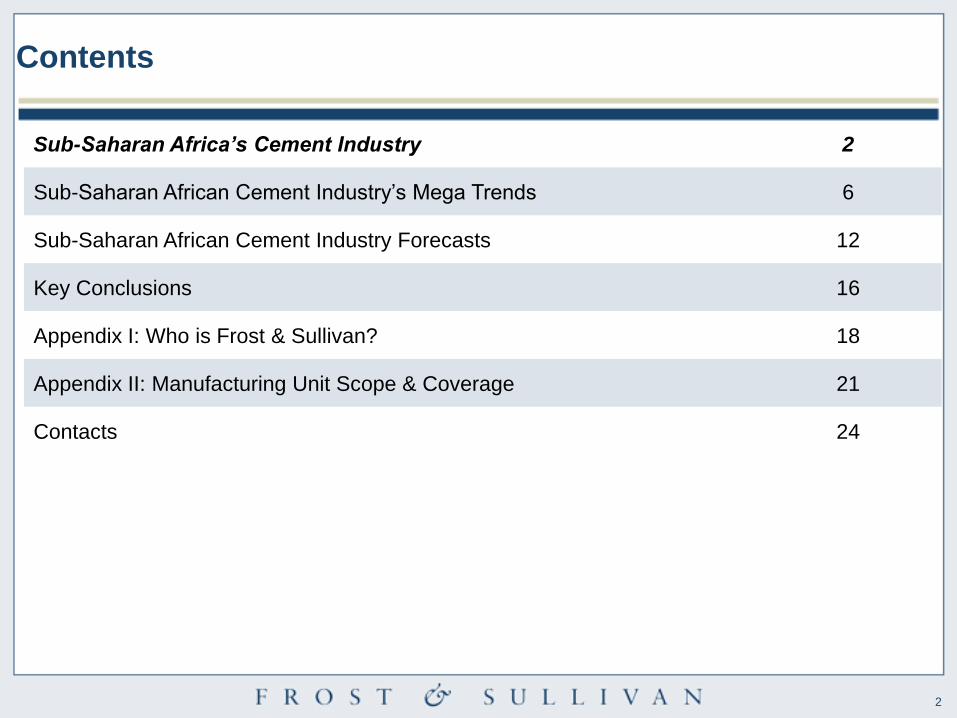
Contents
Sub-Saharan Africa’s Cement Industry 2
Sub-Saharan African Cement Industry’s Mega Trends 6
Sub-Saharan African Cement Industry Forecasts 12
Key Conclusions 16
Appendix I: Who is Frost & Sullivan? 18
Appendix II: Manufacturing Unit Scope & Coverage 21
Contacts 24
3
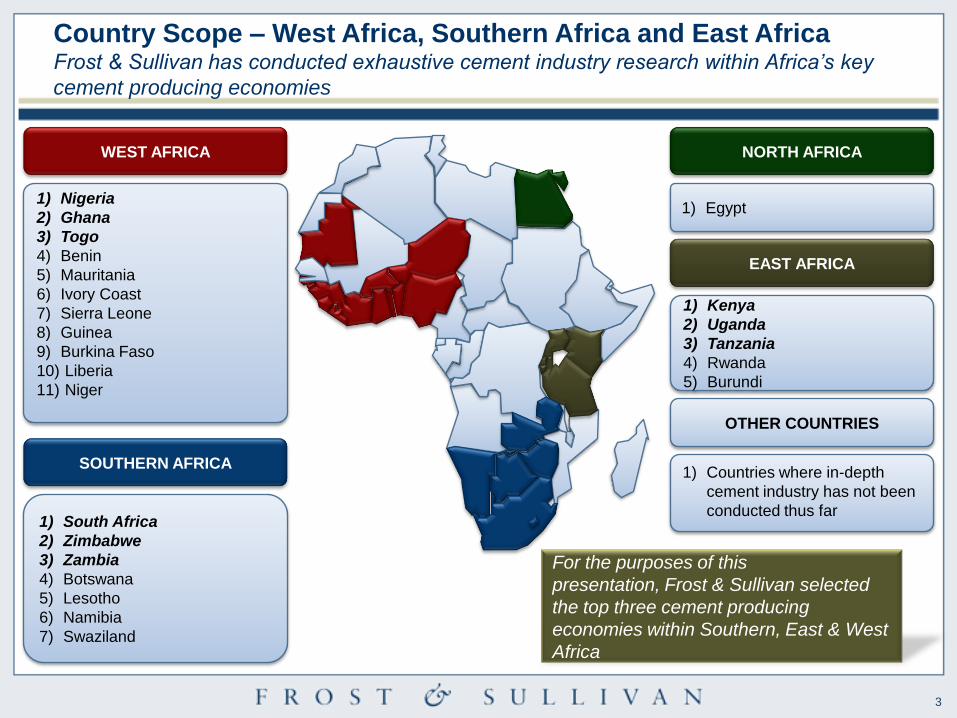
Country Scope – West Africa, Southern Africa and East AfricaFrost & Sullivan has conducted exhaustive cement industry research within Africa’s key
cement producing economies
EAST AFRICA
NORTH AFRICA
1) Egypt
1) Kenya
2) Uganda
3) Tanzania
4) Rwanda
5) Burundi
SOUTHERN AFRICA
1) South Africa
2) Zimbabwe
3) Zambia
4) Botswana
5) Lesotho
6) Namibia
7) Swaziland
WEST AFRICA
1) Nigeria
2) Ghana
3) Togo
4) Benin
5) Mauritania
6) Ivory Coast
7) Sierra Leone
8) Guinea
9) Burkina Faso
10) Liberia
11) Niger
OTHER COUNTRIES
1) Countries where in-depth
cement industry has not been
conducted thus far
For the purposes of this
presentation, Frost & Sullivan selected
the top three cement producing
economies within Southern, East & West
Africa

4
Sub-Saharan Africa’s Cement IndustryWest Africa’s cement industry has witnessed strong output growth driven by the Dangote
Cement Group’s aggressive local and regional expansion initiatives
West Africa47%
East Africa21%
Southern Africa32%
*SOUTHERN AFRICA
(2012 base year information)
South Africa 13.1 Mt
Zimbabwe 1.5 Mt
Zambia 1.4 Mt
TOTAL 15.9 Mt
* WEST AFRICA
(2011 base year information)
Nigeria 18.5 Mt
Ghana 3.3 Mt
Benin 1.1 Mt
TOTAL 22.9 Mt
*EAST AFRICA
(2010 base year information)
Kenya 4.3 Mt
Tanzania 3.6 Mt
Uganda 2.2 Mt
TOTAL 10.1 Mt
2012 Output = 48.9 Mt
COMMON THEMES ACROSS THE PROFILED REGIONS
1) Leading cement producers are ramping up capacity
2) Top two (2) cement producing countries within each of the
profiled regions plan to export more over the next 10
years
3) Local cement producers impacted by lower priced Asian
imports
Cement Industry: Supply in Million Tons (Sub-Saharan Africa), 2012
5
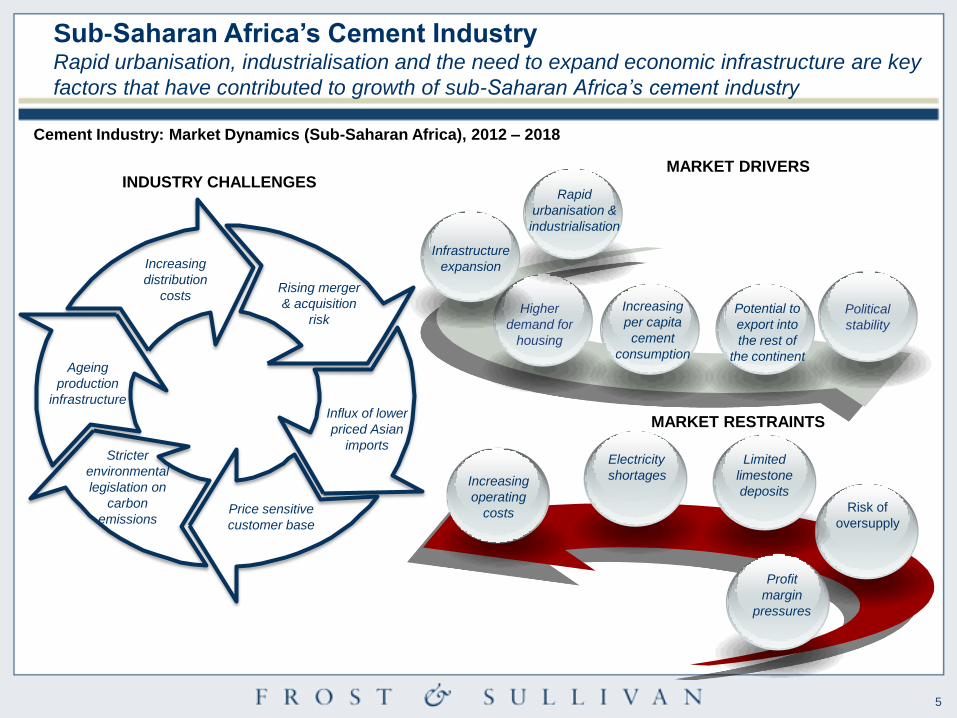
Sub-Saharan Africa’s Cement IndustryRapid urbanisation, industrialisation and the need to expand economic infrastructure are key
factors that have contributed to growth of sub-Saharan Africa’s cement industry
Cement Industry: Market Dynamics (Sub-Saharan Africa), 2012 – 2018
Political
stability
Higher
demand for
housing
Potential to
export into
the rest of
the continent
Rapid
urbanisation &
industrialisation
Infrastructure
expansion
Increasing
per capita
cement
consumption
Risk of
oversupply
Increasing
operating
costs
Electricity
shortages
Limited
limestone
deposits
Profit
margin
pressures
Rising merger
& acquisition
risk
Influx of lower
priced Asian
imports
Price sensitive
customer base
Stricter
environmental
legislation on
carbon
emissions
Ageing
production
infrastructure
Increasing
distribution
costs
INDUSTRY CHALLENGESMARKET DRIVERS
MARKET RESTRAINTS
6
Contents
Sub-Saharan Africa’s Cement Industry 2
Sub-Saharan African Cement Industry’s Mega Trends 6
Sub-Saharan African Cement Industry Forecasts 12
Key Conclusions 16
Appendix I: Who is Frost & Sullivan? 18
Appendix II: Manufacturing Unit Scope & Coverage 21
Contacts 24
7
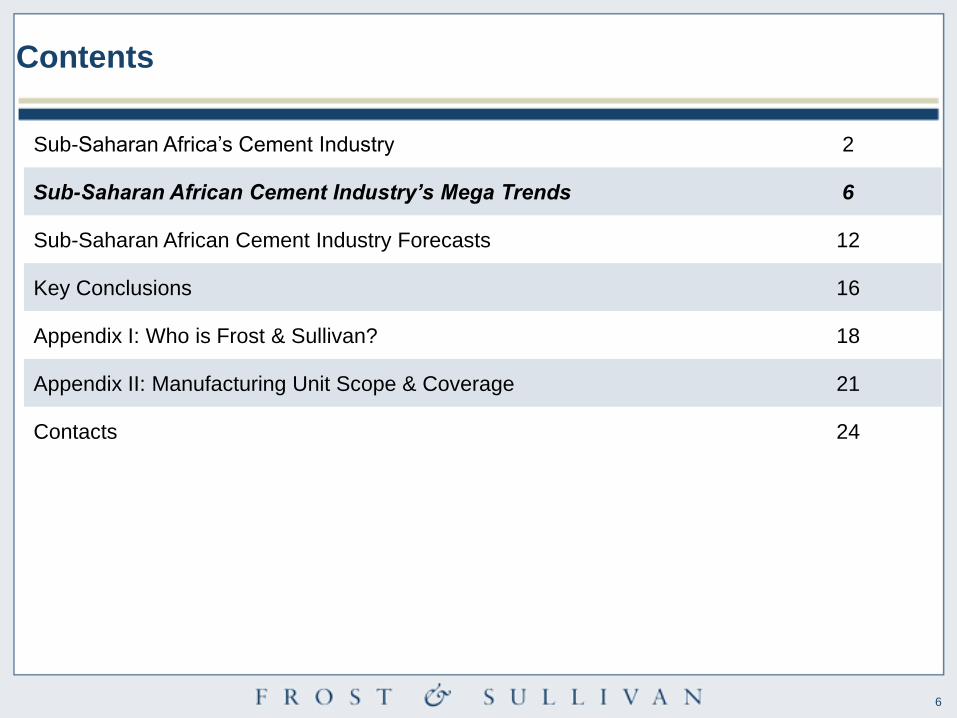
Top 4 Mega Trends Impacting sub-Saharan Africa’s cement industryFuture infrastructure & urbanisation will sustain the long-term growth of the region’s cement
industry
Urbanisation
Regional
Integration
New Business
Models
Future
Infrastructure
Source: Frost & Sullivan analysis.Photo Credits: Dreamstime
8
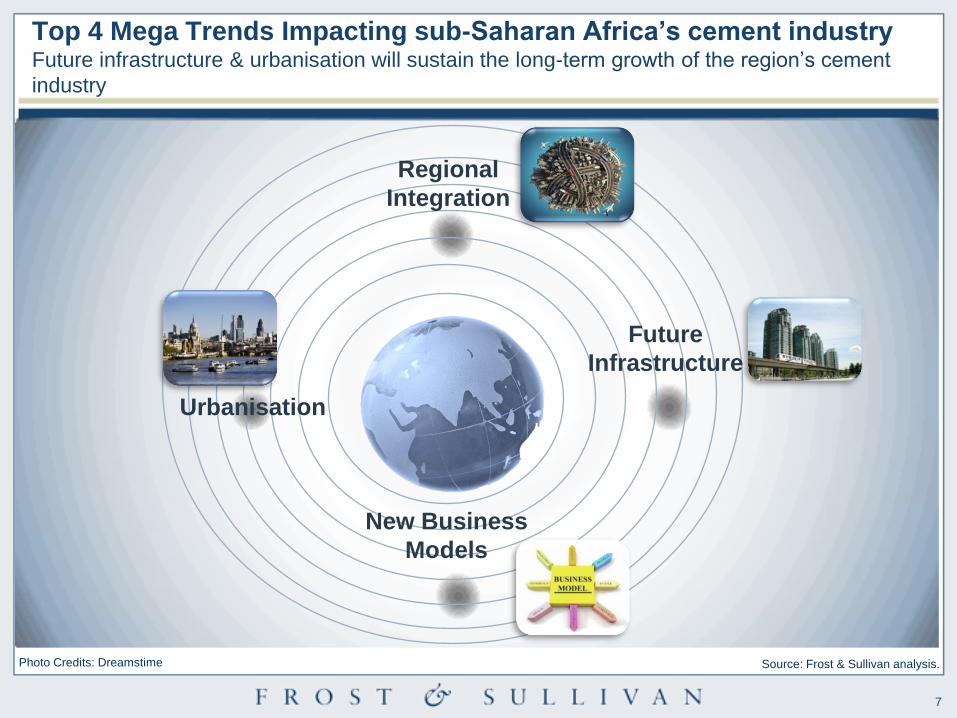
Source: Africa Progress Report, 2010;
Frost & Sullivan analysis.Migration Urban Population, 2025
City with population > 5.0
million, 2025
Dakar4.3 million
6.3 million
3.8 million3.2 million
6.2 million
Algiers
Dares Salaam
Alexandria
Nairobi
Casablanca
Accra
Abidjan
Addis
Ababa
Ibadan
Douala
Cape TownDurban
5.6 million
3.6 million
4.1 million
3.2 million
3.1 million
4.7 million
6.2 million
3.5 million
Luanda8.0 million
Johannesburg/
Pretoria/
Ekurhuleni
8.0 million
Urban Populations, Africa, 2025
Regions with Key Cities
Top Mega Trends in Africa: UrbanisationWith an Annual Average Growth of 3.4%, Population in Several Sub-Saharan African Cities
Will Rise by 25% by 2025. By 2050, 60% of Africa’s Population Will be Urbanised
0
25,000
50,000
75,000
100,000
125,000
150,000
175,000
200,000
225,000
250,000
1995 2000 2005 2010 2015 2020 2025
Eastern Africa Middle Africa Northern Africa
Southern Africa Western Africa
Urb
an
Po
pu
lati
on
(‘0
00)
Urban Population Forecast by Region, 1995-2025
9
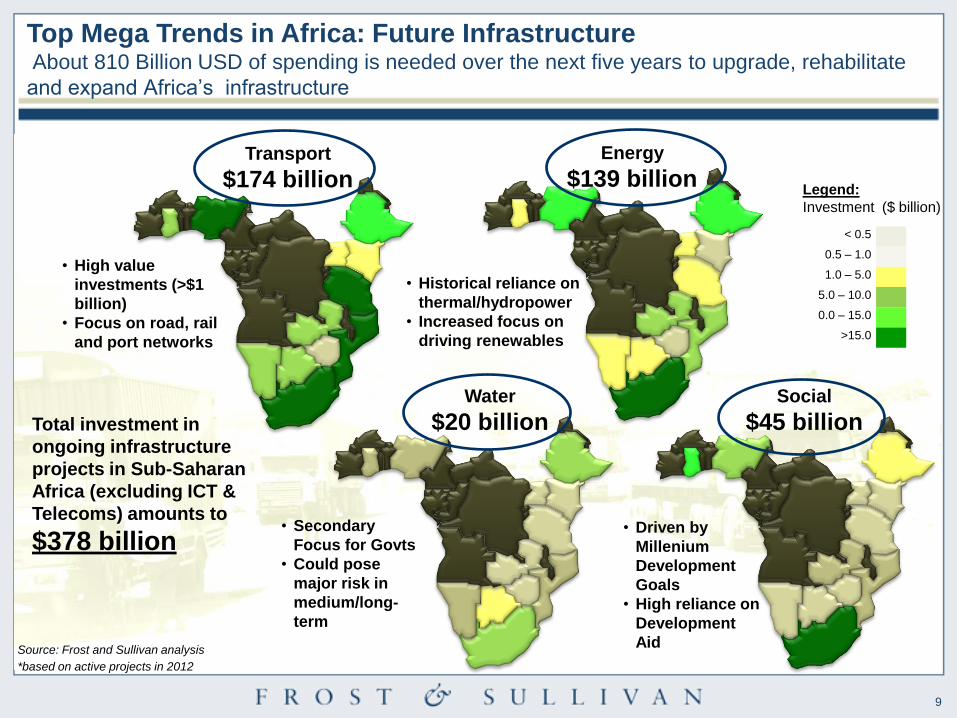
< 0.5
0.5 – 1.0
1.0 – 5.0
5.0 – 10.0
0.0 – 15.0
>15.0
Legend:
Investment ($ billion)
Transport
$174 billion
• High value
investments (>$1
billion)
• Focus on road, rail
and port networks
Energy
$139 billion
• Historical reliance on
thermal/hydropower
• Increased focus on
driving renewables
*based on active projects in 2012
Source: Frost and Sullivan analysis
Total investment in
ongoing infrastructure
projects in Sub-Saharan
Africa (excluding ICT &
Telecoms) amounts to
$378 billion
Water
$20 billionSocial
$45 billion
• Secondary
Focus for Govts
• Could pose
major risk in
medium/long-
term
• Driven by
Millenium
Development
Goals
• High reliance on
Development
Aid
Top Mega Trends in Africa: Future InfrastructureAbout 810 Billion USD of spending is needed over the next five years to upgrade, rehabilitate
and expand Africa’s infrastructure
10
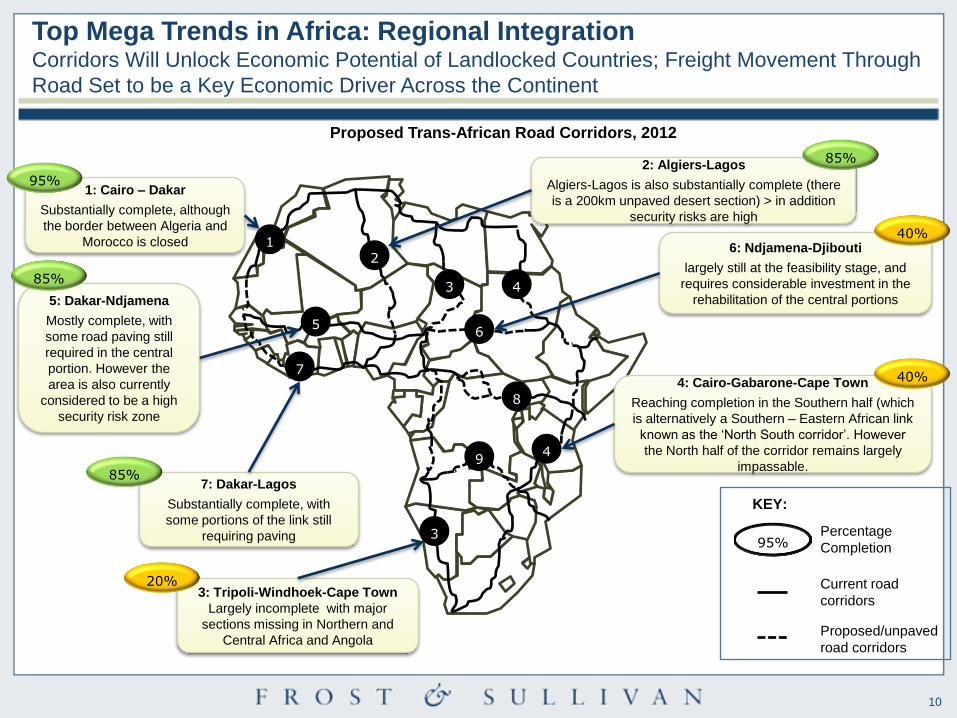
Top Mega Trends in Africa: Regional IntegrationCorridors Will Unlock Economic Potential of Landlocked Countries; Freight Movement Through
Road Set to be a Key Economic Driver Across the Continent
Current road
corridors
KEY:
12
3 4
4
3
9
8
6
7
5
Proposed/unpaved
road corridors
4: Cairo-Gabarone-Cape Town
Reaching completion in the Southern half (which
is alternatively a Southern – Eastern African link
known as the ‘North South corridor’. However
the North half of the corridor remains largely
impassable.
1: Cairo – Dakar
Substantially complete, although
the border between Algeria and
Morocco is closed
95%Percentage
Completion
95%
3: Tripoli-Windhoek-Cape Town
Largely incomplete with major
sections missing in Northern and
Central Africa and Angola
20%
40%
5: Dakar-Ndjamena
Mostly complete, with
some road paving still
required in the central
portion. However the
area is also currently
considered to be a high
security risk zone
85%
6: Ndjamena-Djibouti
largely still at the feasibility stage, and
requires considerable investment in the
rehabilitation of the central portions
40%
2: Algiers-Lagos
Algiers-Lagos is also substantially complete (there
is a 200km unpaved desert section) > in addition
security risks are high
85%
7: Dakar-Lagos
Substantially complete, with
some portions of the link still
requiring paving
85%
Proposed Trans-African Road Corridors, 2012
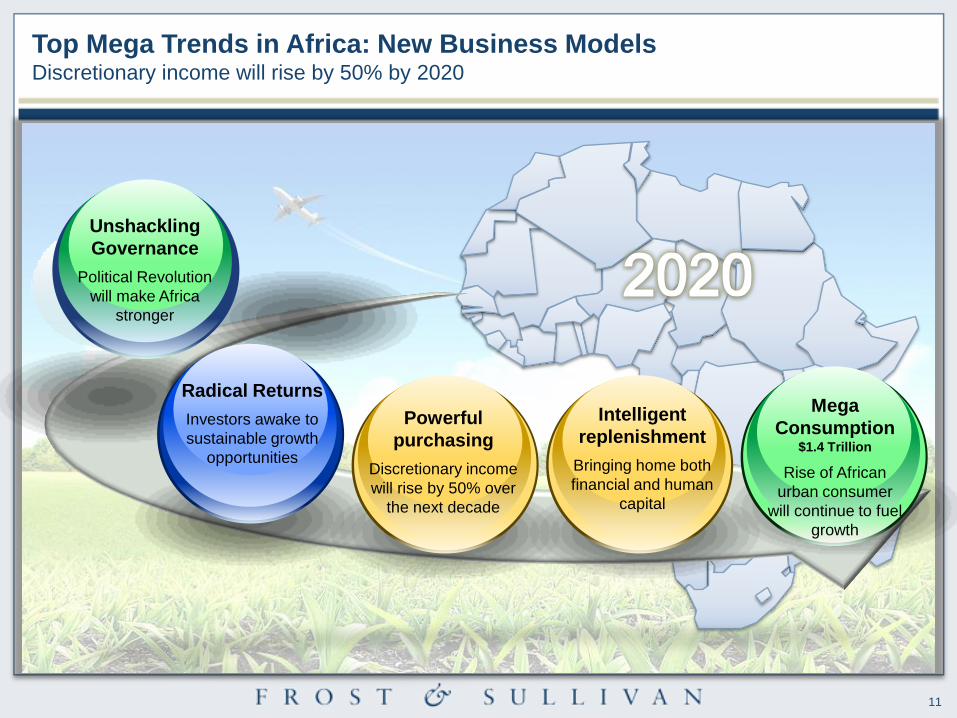
11
`
Mega
Consumption$1.4 Trillion
Rise of African
urban consumer
will continue to fuel
growth
Radical Returns
Investors awake to
sustainable growth
opportunities
Unshackling
Governance
Political Revolution
will make Africa
stronger
Powerful
purchasing
Discretionary income
will rise by 50% over
the next decade
Intelligent
replenishment
Bringing home both
financial and human
capital
Top Mega Trends in Africa: New Business ModelsDiscretionary income will rise by 50% by 2020
12
Contents
Sub-Saharan Africa’s Cement Industry 2
Sub-Saharan African Cement Industry’s Mega Trends 6
Sub-Saharan African Cement Industry Forecasts 12
Key Conclusions 16
Appendix I: Who is Frost & Sullivan? 18
Appendix II: Manufacturing Unit Scope & Coverage 21
Contacts 24
13
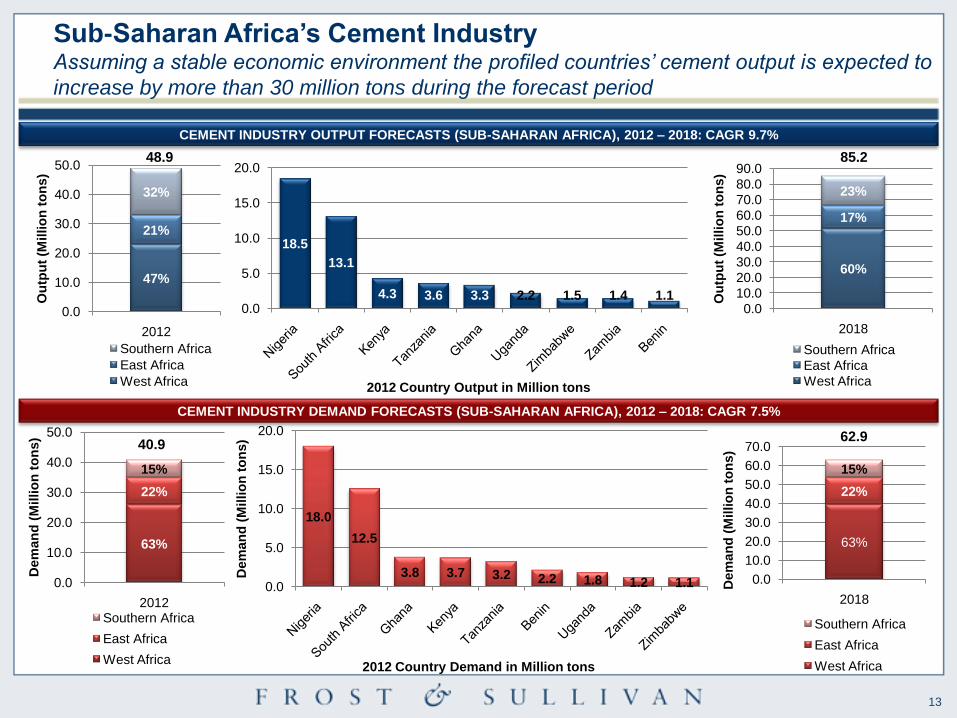
63%
22%
15%
0.0
10.0
20.0
30.0
40.0
50.0
60.0
70.0
2018
Dem
an
d (
Millio
n t
on
s)
Southern Africa
East Africa
West Africa
18.0
12.5
3.8 3.7 3.2 2.2 1.8 1.2 1.10.0
5.0
10.0
15.0
20.0
Dem
an
d (
Millio
n t
on
s)
63%
22%
15%
0.0
10.0
20.0
30.0
40.0
50.0
2012
Dem
an
d (
Mil
lio
n t
on
s)
Southern Africa
East Africa
West Africa
Sub-Saharan Africa’s Cement Industry Assuming a stable economic environment the profiled countries’ cement output is expected to
increase by more than 30 million tons during the forecast period
47%
21%
32%
0.0
10.0
20.0
30.0
40.0
50.0
2012
Ou
tpu
t (M
illio
n t
on
s)
Southern Africa
East Africa
West Africa
18.5
13.1
4.3 3.6 3.3 2.2 1.5 1.4 1.10.0
5.0
10.0
15.0
20.0
60%
17%
23%
0.0
10.0
20.0
30.0
40.0
50.0
60.0
70.0
80.0
90.0
2018
Ou
tpu
t (M
illio
n t
on
s)
Southern Africa
East Africa
West Africa
48.9 85.2
40.962.9
2012 Country Output in Million tons
CEMENT INDUSTRY OUTPUT FORECASTS (SUB-SAHARAN AFRICA), 2012 – 2018: CAGR 9.7%
CEMENT INDUSTRY DEMAND FORECASTS (SUB-SAHARAN AFRICA), 2012 – 2018: CAGR 7.5%
2012 Country Demand in Million tons
14
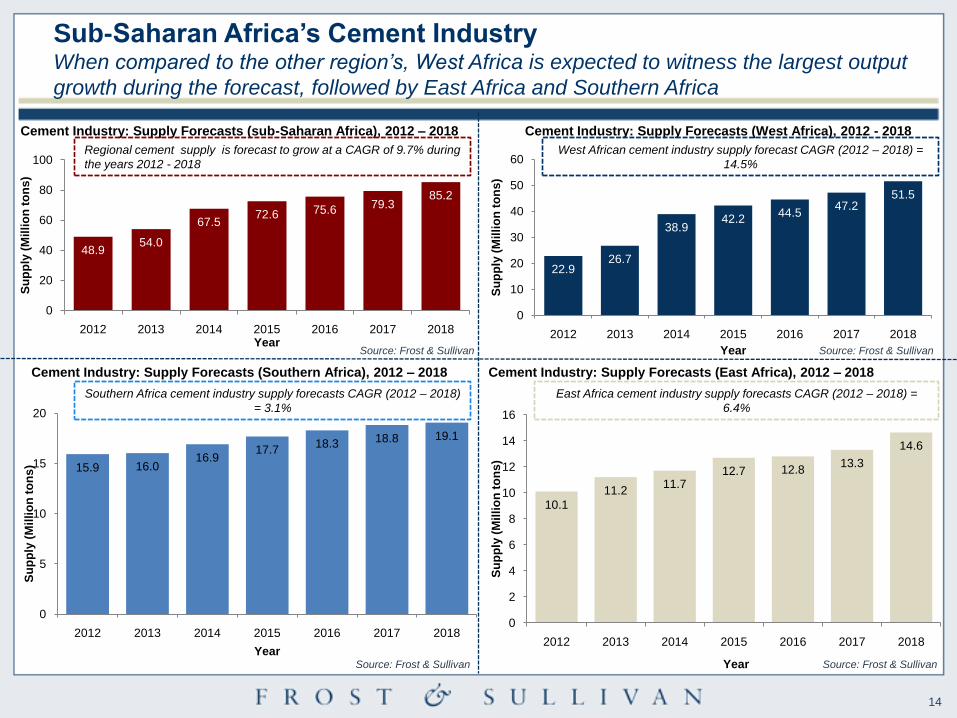
10.1
11.211.7
12.7 12.813.3
14.6
0
2
4
6
8
10
12
14
16
2012 2013 2014 2015 2016 2017 2018
Su
pp
ly (
Mil
lio
n t
on
s)
Year
22.926.7
38.942.2
44.547.2
51.5
0
10
20
30
40
50
60
2012 2013 2014 2015 2016 2017 2018
Su
pp
ly (
Mil
lio
n t
on
s)
Year
15.9 16.016.9
17.718.3 18.8 19.1
0
5
10
15
20
2012 2013 2014 2015 2016 2017 2018
Su
pp
ly (
Mil
lio
n t
on
s)
Year
48.954.0
67.572.6 75.6 79.3
85.2
0
20
40
60
80
100
2012 2013 2014 2015 2016 2017 2018
Su
pp
ly (
Mil
lio
n t
on
s)
Year
Cement Industry: Supply Forecasts (East Africa), 2012 – 2018
Source: Frost & Sullivan
Source: Frost & Sullivan
Cement Industry: Supply Forecasts (West Africa), 2012 - 2018Cement Industry: Supply Forecasts (sub-Saharan Africa), 2012 – 2018
Cement Industry: Supply Forecasts (Southern Africa), 2012 – 2018
Source: Frost & Sullivan
Regional cement supply is forecast to grow at a CAGR of 9.7% during
the years 2012 - 2018
West African cement industry supply forecast CAGR (2012 – 2018) =
14.5%
Source: Frost & Sullivan
Southern Africa cement industry supply forecasts CAGR (2012 – 2018)
= 3.1%
East Africa cement industry supply forecasts CAGR (2012 – 2018) =
6.4%
Sub-Saharan Africa’s Cement Industry When compared to the other region’s, West Africa is expected to witness the largest output
growth during the forecast, followed by East Africa and Southern Africa
15
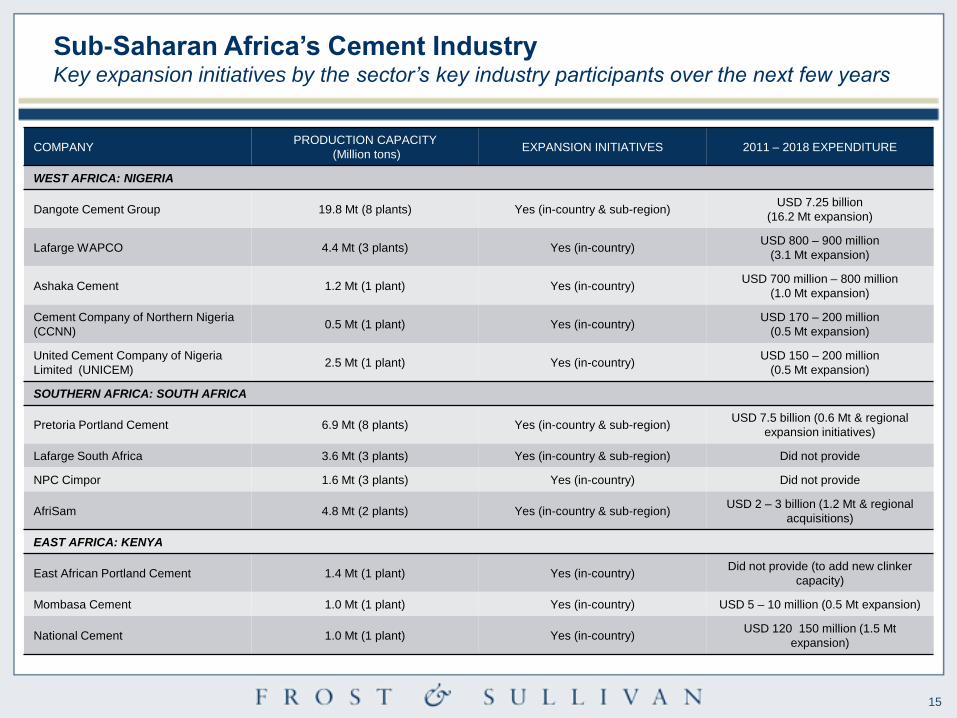
Sub-Saharan Africa’s Cement Industry Key expansion initiatives by the sector’s key industry participants over the next few years
COMPANYPRODUCTION CAPACITY
(Million tons)EXPANSION INITIATIVES 2011 – 2018 EXPENDITURE
WEST AFRICA: NIGERIA
Dangote Cement Group 19.8 Mt (8 plants) Yes (in-country & sub-region)USD 7.25 billion
(16.2 Mt expansion)
Lafarge WAPCO 4.4 Mt (3 plants) Yes (in-country)USD 800 – 900 million
(3.1 Mt expansion)
Ashaka Cement 1.2 Mt (1 plant) Yes (in-country)USD 700 million – 800 million
(1.0 Mt expansion)
Cement Company of Northern Nigeria
(CCNN)0.5 Mt (1 plant) Yes (in-country)
USD 170 – 200 million
(0.5 Mt expansion)
United Cement Company of Nigeria
Limited (UNICEM)2.5 Mt (1 plant) Yes (in-country)
USD 150 – 200 million
(0.5 Mt expansion)
SOUTHERN AFRICA: SOUTH AFRICA
Pretoria Portland Cement 6.9 Mt (8 plants) Yes (in-country & sub-region)USD 7.5 billion (0.6 Mt & regional
expansion initiatives)
Lafarge South Africa 3.6 Mt (3 plants) Yes (in-country & sub-region) Did not provide
NPC Cimpor 1.6 Mt (3 plants) Yes (in-country) Did not provide
AfriSam 4.8 Mt (2 plants) Yes (in-country & sub-region)USD 2 – 3 billion (1.2 Mt & regional
acquisitions)
EAST AFRICA: KENYA
East African Portland Cement 1.4 Mt (1 plant) Yes (in-country)Did not provide (to add new clinker
capacity)
Mombasa Cement 1.0 Mt (1 plant) Yes (in-country) USD 5 – 10 million (0.5 Mt expansion)
National Cement 1.0 Mt (1 plant) Yes (in-country) USD 120 150 million (1.5 Mt
expansion)
16
Contents
Sub-Saharan Africa’s Cement Industry 2
Sub-Saharan African Cement Industry’s Mega Trends 6
Sub-Saharan African Cement Industry Forecasts 12
Key Conclusions 16
Appendix I: Who is Frost & Sullivan? 18
Appendix II: Manufacturing Unit Scope & Coverage 21
Contacts 24
17
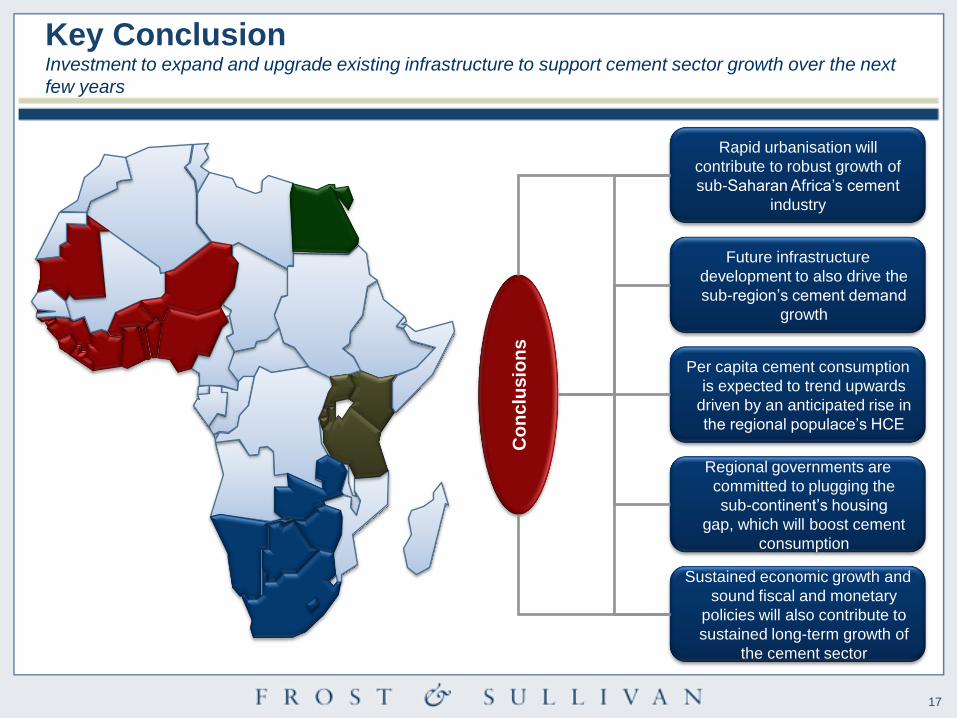
Key ConclusionInvestment to expand and upgrade existing infrastructure to support cement sector growth over the next
few years
Rapid urbanisation will
contribute to robust growth of
sub-Saharan Africa’s cement
industry
Future infrastructure
development to also drive the
sub-region’s cement demand
growth
Per capita cement consumption
is expected to trend upwards
driven by an anticipated rise in
the regional populace’s HCE
Sustained economic growth and
sound fiscal and monetary
policies will also contribute to
sustained long-term growth of
the cement sector
Regional governments are
committed to plugging the
sub-continent’s housing
gap, which will boost cement
consumption
Co
nc
lus
ion
s
18
Contents
Sub-Saharan Africa’s Cement Industry 2
Sub-Saharan African Cement Industry’s Mega Trends 6
Sub-Saharan African Cement Industry Forecasts 12
Key Conclusions 16
Appendix I: Who is Frost & Sullivan? 18
Appendix II: Manufacturing Unit Scope & Coverage 21
Contacts 24
19
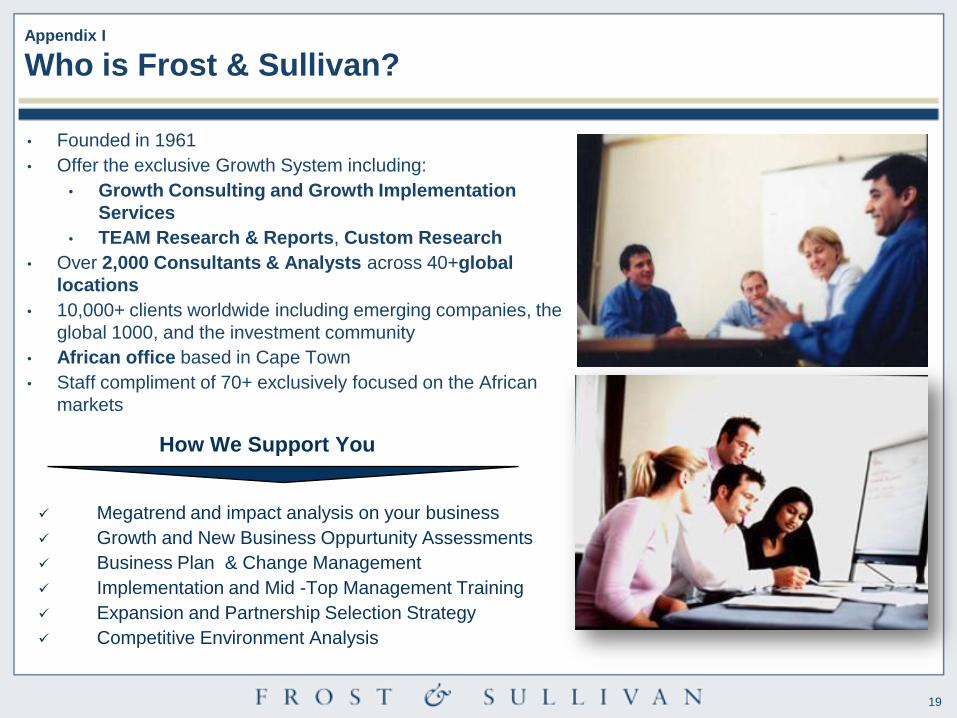
Appendix I
Who is Frost & Sullivan?
• Founded in 1961
• Offer the exclusive Growth System including:
• Growth Consulting and Growth Implementation
Services
• TEAM Research & Reports, Custom Research
• Over 2,000 Consultants & Analysts across 40+global
locations
• 10,000+ clients worldwide including emerging companies, the
global 1000, and the investment community
• African office based in Cape Town
• Staff compliment of 70+ exclusively focused on the African
markets
How We Support You
Megatrend and impact analysis on your business
Growth and New Business Oppurtunity Assessments
Business Plan & Change Management
Implementation and Mid -Top Management Training
Expansion and Partnership Selection Strategy
Competitive Environment Analysis
20
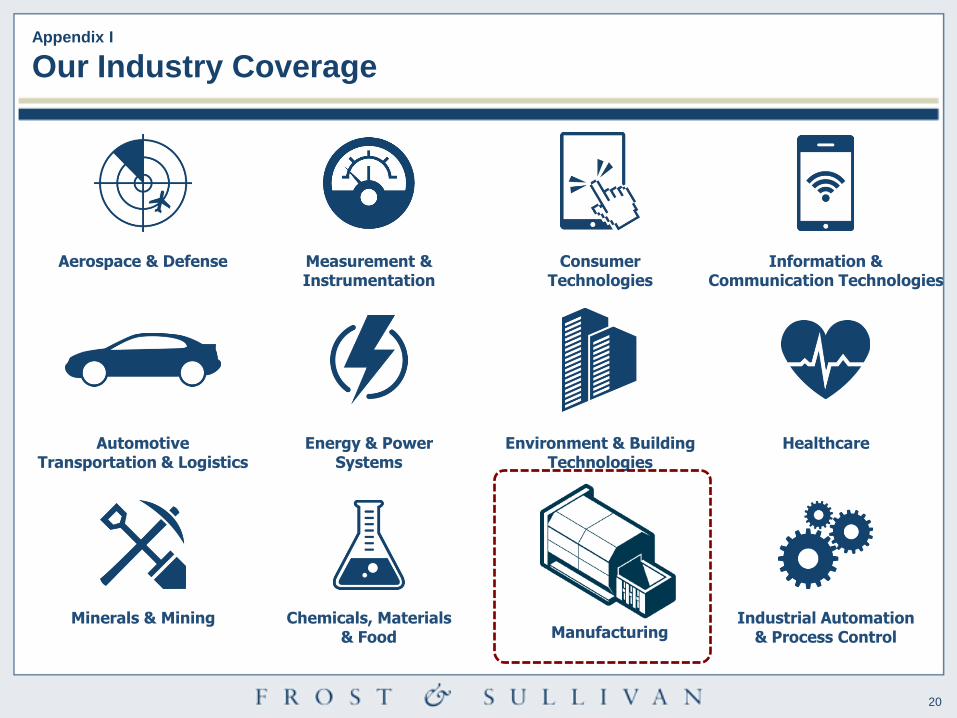
Appendix I
Our Industry Coverage
Automotive&
Transportation
Aerospace & Defense Measurement &Instrumentation
Information &Communication Technologies
HealthcareEnvironment & BuildingTechnologies
Energy & PowerSystems
Chemicals, Materials& Food Manufacturing
Industrial Automation& Process Control
AutomotiveTransportation & Logistics
ConsumerTechnologies
Minerals & Mining
21
Contents
Sub-Saharan Africa’s Cement Industry 2
Sub-Saharan African Cement Industry’s Mega Trends 6
Sub-Saharan African Cement Industry Forecasts 12
Key Conclusions 16
Appendix I: Who is Frost & Sullivan? 18
Appendix II: Manufacturing Unit Scope & Coverage 21
Contacts 24
22
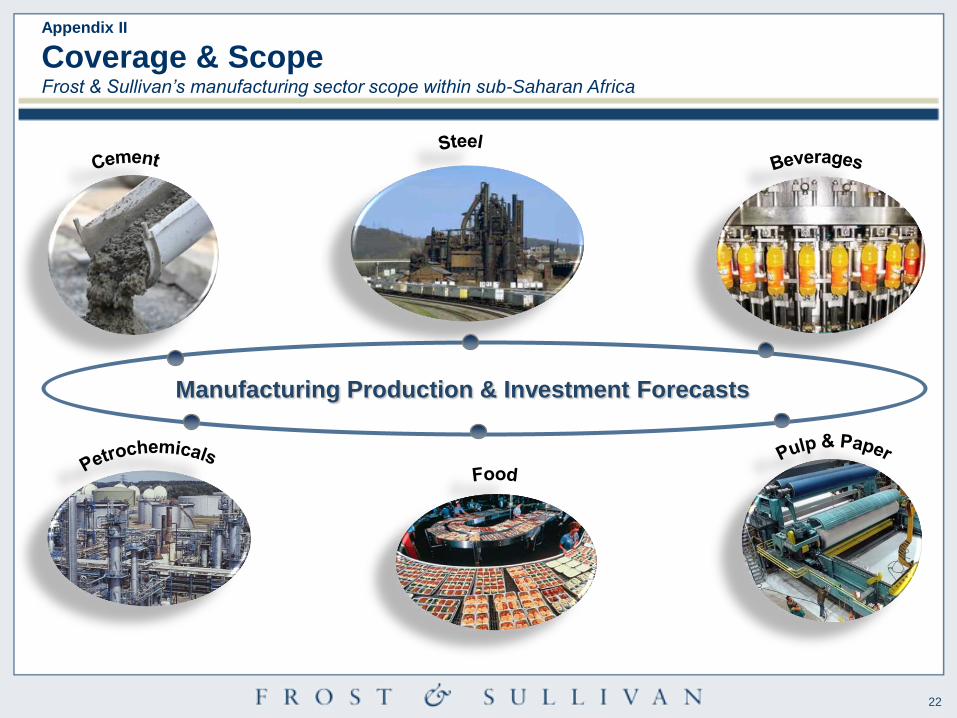
Manufacturing Production & Investment Forecasts
Appendix II
Coverage & ScopeFrost & Sullivan’s manufacturing sector scope within sub-Saharan Africa
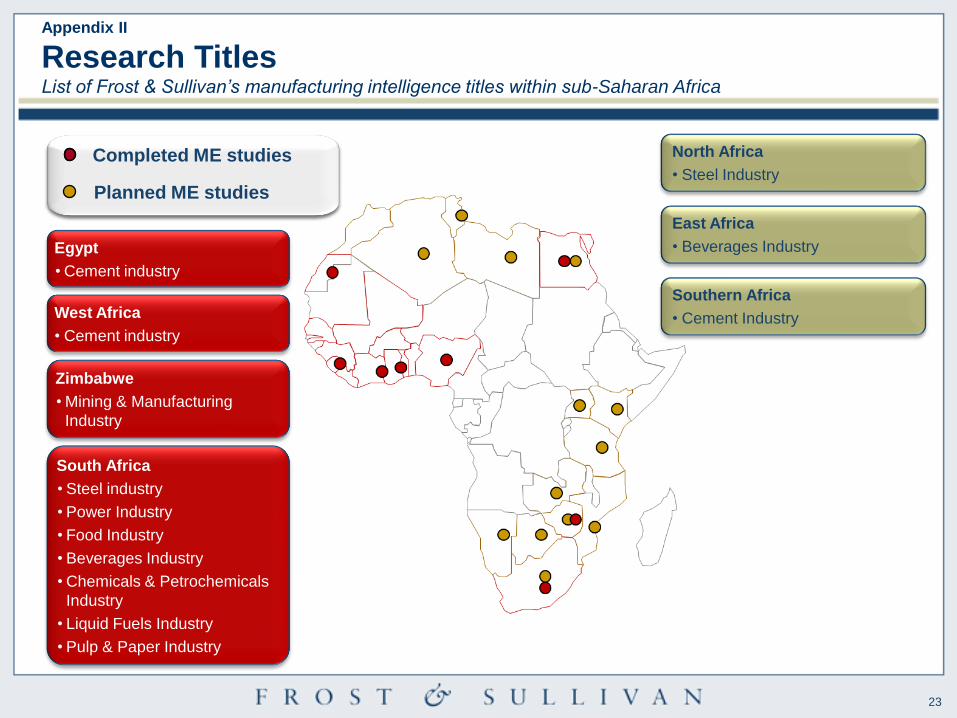
23
Zimbabwe
• Mining & Manufacturing
Industry
South Africa
• Steel industry
• Power Industry
• Food Industry
• Beverages Industry
• Chemicals & Petrochemicals
Industry
• Liquid Fuels Industry
• Pulp & Paper Industry
West Africa
• Cement industry
North Africa
• Steel Industry
East Africa
• Beverages Industry Egypt
• Cement industry
Southern Africa
• Cement Industry
Completed ME studies
Planned ME studies
Appendix II
Research TitlesList of Frost & Sullivan’s manufacturing intelligence titles within sub-Saharan Africa
24
For further information please contact:
James Fungai Maposa
Consulting Manager – Industrial
Tel: 0027 21 680 3203
E-mail: [email protected]
Guillaume de Bassompierre
Director of Business Development – Africa
Tel: 0027 21 680 3582
Mobile: 0027 71 684 0011
Email: [email protected]