Influence of wheel and rail profile shape on the ...
17
Vehicle System Dynamics: International Journal of Vehicle Mechanics and Mobility Influence of wheel and rail profile shape on the initiation of rolling contact fatigue cracks at high axle loads U. Spangenberg a* , R.D. Fröhling a and P.S. Els b a Mechanical Technology, Transnet Freight Rail, Pretoria, Gauteng, South Africa; b Vehicle Dynamics Group, University of Pretoria, Pretoria, Gauteng, South Africa The influence of wheel and rail profile shape features on the initiation of rolling contact fatigue (RCF) cracks is evaluated based on the results of multi-body vehicle dynamics simulations. The damage in- dex and surface fatigue index are used as two damage parameters to assess the influence of the differ- ent features. The damage parameters showed good agreement to one another and to in-field observa- tions. The wheel and rail profile shape features showed a correlation to the predicted RCF damage. The RCF damage proved to be most sensitive to the position of hollow wear and thus bogie tracking. RCF initiation and crack growth can be reduced by eliminating unwanted shape features through maintenance and design and by improving bogie tracking. Keywords: Wheel-Rail interaction, Wheel-rail profiles, Rolling contact fatigue 1 INTRODUCTION Heavy haul railways allow cost-effective operations when the system is performing harmoni- ously. The system has many factors that determine the cost of operation. Some of the largest costs are associated with maintenance and/or replacement of wheels and rails. Two damage mechanisms driving the maintenance and replacement of wheels and rails are wear and rolling contact fatigue (RCF). Excessive wear and surface initiated RCF may result when the wheel-rail interface is not properly managed or maintained. Scheffel [1] designed a self-steering, high-stability freight bogie to reduce wheel flange wear. This type of freight bogie has been used on Transnet Freight Rail’s iron ore export line since April 1976 [2]. Following the introduction of the self-steering bogie, together with straighter track and tight gauge control, concentrated hollow wheel wear started occurring with the charac- teristic gauge side and field side false flanges. These hollow worn wheel profiles caused sur- face-initiated RCF damage on the gauge side of high rails and field side of low rails because of the adverse contact conditions (Figure 1). Consequently, a hollow wear limit of 2mm was intro- duced. Strict adherence to this limit brought about a reduction in the occurrence of RCF [3]. Surface-initiated RCF on the gauge corner of the high rail and field side of the low rail re- emerged after the iron ore export line was upgraded from an axle load of 26 ton to an axle load of 30 ton in 2001. Fröhling et al. [4] examined the risk of hollow worn wheel profiles initiating surface RCF at the rail gauge corner. The high contact pressures and tangential forces arising from hollow wheel contact showed a high propensity towards RCF development. Fröhling et al. [4] suggest- ed that the impact of false flange contact could be restricted by means of limiting the wheels’ hollow wear. The effect of the hollow worn wheel profile shape on the initiation of RCF was further investigated by Fröhling et al. [5] and Karttunen et al. [6]. Wu et al. [7] noted that high energy in the wheel-rail contact patch leading to RCF initiation or wear is generally caused by poor vehicle curving performance and poor wheel-rail contact conditions. Visual inspections of the iron ore export line were carried out before the start of every grind- ing cycle since April 2010. The RCF damage was classified according to Transnet Freight Rail’s internal classification chart [8]. The RCF on the gauge corner (head checks) was classi- fied from class 1 to 5 ranging from none, light, moderate, heavy to severe damage, respectively. These inspections have shown that some rails experience more damage than others do. Although track quality, curve radii and super-elevation play a significant role in the initiation of RCF (see [9,10]), it was observed that measured rail profiles with gauge corners lower than the target rail * Corresponding author. Email: [email protected] 1
Transcript of Influence of wheel and rail profile shape on the ...

Vehicle System Dynamics: International Journal of Vehicle Mechanics and Mobility
Influence of wheel and rail profile shape on the initiation of rolling contact fatigue cracks at high axle loads
U. Spangenberga*
, R.D. Fröhlinga and P.S. Els
b
aMechanical Technology, Transnet Freight Rail, Pretoria, Gauteng, South Africa;
bVehicle Dynamics
Group, University of Pretoria, Pretoria, Gauteng, South Africa
The influence of wheel and rail profile shape features on the initiation of rolling contact fatigue (RCF)
cracks is evaluated based on the results of multi-body vehicle dynamics simulations. The damage in-
dex and surface fatigue index are used as two damage parameters to assess the influence of the differ-
ent features. The damage parameters showed good agreement to one another and to in-field observa-
tions. The wheel and rail profile shape features showed a correlation to the predicted RCF damage.
The RCF damage proved to be most sensitive to the position of hollow wear and thus bogie tracking.
RCF initiation and crack growth can be reduced by eliminating unwanted shape features through
maintenance and design and by improving bogie tracking.
Keywords:
Wheel-Rail interaction, Wheel-rail profiles, Rolling contact fatigue
1 INTRODUCTION
Heavy haul railways allow cost-effective operations when the system is performing harmoni-ously. The system has many factors that determine the cost of operation. Some of the largest costs are associated with maintenance and/or replacement of wheels and rails. Two damage mechanisms driving the maintenance and replacement of wheels and rails are wear and rolling contact fatigue (RCF). Excessive wear and surface initiated RCF may result when the wheel-rail interface is not properly managed or maintained.
Scheffel [1] designed a self-steering, high-stability freight bogie to reduce wheel flange wear. This type of freight bogie has been used on Transnet Freight Rail’s iron ore export line since April 1976 [2]. Following the introduction of the self-steering bogie, together with straighter track and tight gauge control, concentrated hollow wheel wear started occurring with the charac-teristic gauge side and field side false flanges. These hollow worn wheel profiles caused sur-face-initiated RCF damage on the gauge side of high rails and field side of low rails because of the adverse contact conditions (Figure 1). Consequently, a hollow wear limit of 2mm was intro-duced. Strict adherence to this limit brought about a reduction in the occurrence of RCF [3]. Surface-initiated RCF on the gauge corner of the high rail and field side of the low rail re-emerged after the iron ore export line was upgraded from an axle load of 26 ton to an axle load of 30 ton in 2001.
Fröhling et al. [4] examined the risk of hollow worn wheel profiles initiating surface RCF at the rail gauge corner. The high contact pressures and tangential forces arising from hollow wheel contact showed a high propensity towards RCF development. Fröhling et al. [4] suggest-ed that the impact of false flange contact could be restricted by means of limiting the wheels’ hollow wear. The effect of the hollow worn wheel profile shape on the initiation of RCF was further investigated by Fröhling et al. [5] and Karttunen et al. [6]. Wu et al. [7] noted that high energy in the wheel-rail contact patch leading to RCF initiation or wear is generally caused by poor vehicle curving performance and poor wheel-rail contact conditions.
Visual inspections of the iron ore export line were carried out before the start of every grind-ing cycle since April 2010. The RCF damage was classified according to Transnet Freight Rail’s internal classification chart [8]. The RCF on the gauge corner (head checks) was classi-fied from class 1 to 5 ranging from none, light, moderate, heavy to severe damage, respectively. These inspections have shown that some rails experience more damage than others do. Although track quality, curve radii and super-elevation play a significant role in the initiation of RCF (see [9,10]), it was observed that measured rail profiles with gauge corners lower than the target rail
* Corresponding author. Email: [email protected]
1

U. Spangenberg et al.
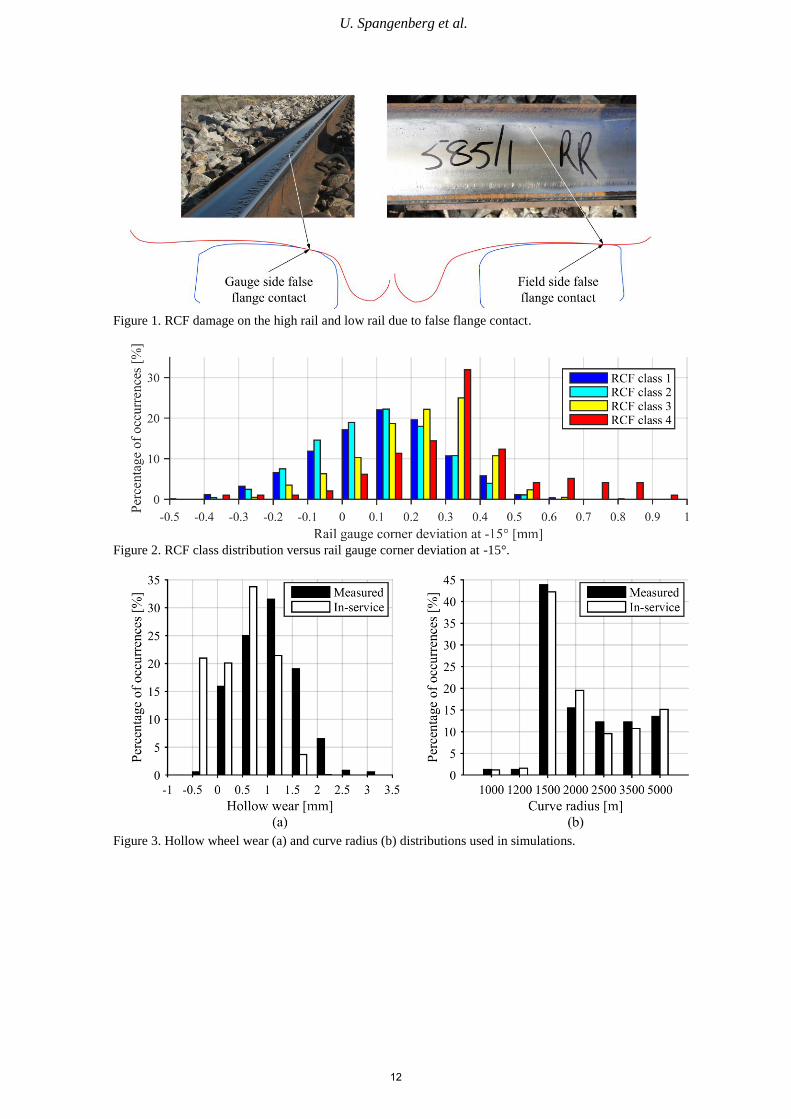
profile were more prone to severe RCF damage. Distributions of RCF class versus rail gauge corner deviation at -15° as measured from April 2010 to January 2015 support this observation (Figure 2). The term rail gauge corner deviation is used to describe the distance from the target rail profile to the measured rail profile at a given tangent angle. Thus, the amount the measured profile deviates from the target profile. A negative deviation indicates that the measured rail profile is higher than the target profile and a positive deviation indicates the opposite.
The shapes of worn wheels and rails have an effect on the initiation and growth of surface RCF cracks. Features defining the worn shape of wheels and rails are investigated to understand how these profile shapes contribute to the initiation and growth of RCF cracks.
2 VEHICLE DYNAMICS
The study of the wheel and rail profile shape features that contributes to RCF damage is per-formed through multi-body vehicle dynamics simulations. Measured worn wheel and rail pro-files are used during simulations and the results are post-processed to calculate RCF damage pa-rameters. These RCF damage parameters are analysed together with the profile features to find those features that cause the highest and most occurrences of RCF damage.
2.1 Vehicle dynamics modelling
The vehicle dynamics modelling and simulations were carried out in VI-Rail [11]. The vehicle model consisted of a CR-13 type wagon body and two of Scheffel’s MkV self-steering freight bogies [1,2]. This is the main wagon type running on the iron ore export line. The bogie model included non-linear friction elements to model the side bearers, the friction wedges and the cen-tre bowl interface. These elements are standard in the VI-Rail Freight Toolkit add-on.
The wagon model was validated against on-track tests that were conducted on a section of track with three consecutive 400m radius curves and a 600m radius curve. The validation of the simulation model was carried out on a similar track section using measured rail and wheel pro-files. Various responses and forces were measured including the leading and trailing wheelset forces of the leading bogie, wagon body roll, the bogie rotation relative to the wagon body, the side bearer clearances, as well as the secondary suspension and primary suspension displace-ments. The results were compared visually and statistically using the correlation coefficient as suggested by Cole [12]. The results of the statistical comparison are given in Table 1. From Ta-ble 1 it is clear that the vehicle model is reliable since most of the correlation coefficients are close to or above 90%. The four exceptions are at the lateral forces of the leading wheelset and the secondary suspension displacements. Here the values are small and any deviation thus result in a low correlation coefficient.
2.2 Vehicle dynamics simulations
Multi-body vehicle dynamics simulations were carried out to calculate the wheel-rail contact pa-rameters required to calculate the damage parameter values. A single wagon was simulated run-ning over seven different track sections in both the forward and reverse directions.
In-service wheel profiles were measured during May 2011 on 44 different CR-13 wagons, to-talling 352 wheel profiles. The wagon was simulated to have measured wheel profiles in the same position as measured on the wagon. Different profiles on both left and right wheels as well as between the various axles were used. The spectrum of worn wheels that were considered dur-ing the analysis is comparable to the spectrum of the entire fleet as shown in Figure 3a.
The seven different tracks were modelled as constant radius curves varying from 1000 to 5000m. The track gauge was kept constant at 1065mm and the super-elevation (cant) was as-sumed constant within a curve. The relevant super-elevation was selected from Transnet Freight Rail’s maintenance manual [13]. The wagon was simulated to run at a constant speed of 60km/h which is representative of the average operating speed of the production trains. The speed and chosen super-elevation resulted in the 1000 and 1500m curves having 0 cant deficiency, the 1200, 2000, 3500 and 5000m curves having a 5mm cant deficiency and the 2500m curves a 2mm cant deficiency. The cant deficiency is relatively small and therefore cant deficiency or
2

Vehicle System Dynamics: International Journal of Vehicle Mechanics and Mobility
excess should have little effect on the initiation of RCF. The wheel and rail profile features are the main subject of interest and therefore track irregularities were not included in the track defi-nition to limit the number of variables considered to initiate RCF cracks. The maximum coeffi-cient of friction allowed between wheel and rail was set to 0.4.
The rail profiles used for this analysis were measured at 2km intervals through the total length of all curves on the iron ore line. In total 155 rail profiles were measured on UIC60 CrMn rails during April 2011. The curve distribution is shown in Figure 3b. These rail profiles were then used to simulate wheel/rail contact conditions as a function of the measured rail pro-files within a particular curve radius. Rail profiles within a particular curve were changed every 100m to allow the vehicle to reach a steady state condition before entering the next 100m rail section. The resulting wheel-rail combinations that were simulated equalled 54,560.
3 PROCESSING OF SIMULATION RESULTS
3.1 Shakedown values and wear number extraction
The shakedown values and wear numbers were calculated directly from the simulation results at each contact patch on the high rail. The shakedown values were determined using Equations 1 and 2 [14].
𝜈 = 3𝐹𝑧 (2𝜋𝑎𝑏𝑘𝑒)⁄ (1)
𝜇 = √𝐹𝑥2 + 𝐹𝑦
2 𝐹𝑧⁄ (2)
where 𝜈 is the normalised vertical load, 𝐹𝑧 is the normal load at the contact patch, 𝑎 and 𝑏 are the semi-axes of the elliptical contact patch, 𝑘𝑒 is the material’s shear yield strength, 𝜇 is the uti-lised traction coefficient and 𝐹𝑥 and 𝐹𝑦 are the longitudinal and lateral tangential contact forces, respectively. The minimum of the material’s shear yield strength of 553 MPa (Table 2) was used during the calculation of the normalised vertical load.
The wear number was calculated using Equation 3 [15].
𝑇𝛾 = 𝐹𝑥𝛾𝑥 + 𝐹𝑦𝛾𝑦 (3)
where 𝑇𝛾 is the wear number and 𝛾𝑥 and 𝛾𝑦 are the creepages in the longitudinal and lateral di-rection, respectively.
The shakedown values and wear numbers were averaged over 30m of track ending 10m be-fore the rail profile was changed. The shakedown values and wear numbers were only consid-ered when the contact position on the rail was more than 8.75mm from the rail profile centre towards the gauge corner. Any contact positions closer to the rail profile centre were deemed not to contribute to gauge side RCF damage in the area of interest as confirmed by field obser-vations. An example of this averaging is shown for a single wheelset of a vehicle as it ran over a section of track in Figure 4.
3.2 RCF modelling
RCF failure is usually confined to the gauge corner of the high rail or the field side of the low rail in curves. RCF cracks may grow, unite or branch across the railhead causing spalling of the rail surface or a complete fracture of the rail [16]. Plastic deformation and crack initiation are predominantly caused by high contact stresses and tractive steering forces. Ekberg & Kabo [17] and Tunna et al. [18] review the mechanisms of wear and RCF.
Predictive models that are currently applied in literature are focussed either on the shakedown map as developed by Johnson [16] or on the energy dissipated in the contact patch [15]. Both these models have been shown to predict the initiation of RCF cracks, although there are differ-ences between the models and their assumptions.
The results obtained from the above-mentioned vehicle dynamics simulations were post-processed to calculate both the surface fatigue index [14] and the damage index [15]. All creep forces, lateral and longitudinal, were considered to contribute to RCF initiation. The surface fa-tigue index (FISurf) was calculated as the shortest distance from the working point on the shake-
3

U. Spangenberg et al.
down diagram to the shakedown limit. The true distance was calculated to avoid the limitation of the horizontal projection surface fatigue index, which becomes inaccurate at very high uti-lised traction values and low normalised vertical loads [14]. RCF initiation is predicted when the FISurf value exceeds zero. The damage index (DI) was calculated from the wear number (𝑇𝛾) and the damage function shown in Figure 5. The FISurf values and DI values greater than zero were finally summed per wheel or rail profile to indicate the total RCF damage that the profile will cause or undergo.
The turning points of the damage function in Figure 5 were calculated using Equation 4 [19].
𝑇𝛾𝑇𝑃 =1
2√3(𝜎𝑦 + 𝜎𝑢𝑡)𝐴𝛾𝑇𝑃 (4)
where 𝑇𝛾𝑇𝑃 is the wear number value at the turning point or zero damage crossing point of the damage function, 𝜎𝑦 is the yield strength, 𝜎𝑢𝑡 is the ultimate tensile strength of the material, 𝐴 is the assumed area of contact and 𝛾𝑇𝑃 is the creepage at the turning point. The median of the con-tact areas calculated during the various simulations was 183mm
2 and was used in Equation 4.
The three turning points were calculated at creepages of 0.1%, 0.3% and 1%, with a peak dam-age of 10×10
-6/axle at 0.3% creepage. The locations of the turning points were calculated at 89,
267 and 890N (see Figure 5) from the rail strength values listed in Table 2.
3.3 Comparison of damage parameters with and without track irregularities
The simulations did not include the effects of track geometry or irregularities to reduce simula-tion time and reduce the number of factors influencing RCF development. However, it is well known that track irregularities have a significant influence on RCF damage [9]. The number of external factors such as macro geometry, cant and super-elevation was minimised to facilitate the evaluation of RCF damage as a function of the wheel and rail profile shape.
In order to quantify the exclusion of track irregularities, the peak-valley surface fatigue index (FISurf) values are compared with the averaged values over the same section for a simulation in-cluding track irregularities in Figure 6a. The peak-valley values appeared to lie on a line with a constant FISurf value. It therefore appears that irregularities do not significantly influence the av-eraged FISurf values. The averaged FISurf values from simulations with and without the inclusion of track irregularities are shown in Figure 6b. The averaged values are similar and the values ex-tracted from simulations without irregularities provide a good estimation of the fatigue damage caused by real track including irregularities for the current simulation conditions and data pro-cessing technique. The wear number extraction with and without geometry showed similar re-sults.
The influence of irregularities may cause a local over prediction of fatigue damage by a wheel-rail combination. The influence of the wheel and rail profile shape on RCF development might become inaccurately assessed when the results are skewed by too many external factors. Track irregularities were therefore excluded from the current analysis, since the results with and without its inclusion are similar; the simulation time is greatly reduced and the number of exter-nal factors possibly influencing the results is reduced.
3.4 Wheel and rail profile shape features
All the calculated FISurf values are plotted as a function of the contact positions on the rail and wheel (Figure 7). Figure 7 shows that the largest collection of wheel-rail contact points occurs between -30 and -17.5mm on the wheel profile and between -8.75 and -20mm on the rail pro-file. The contact is mainly towards the wheel taping line and centre of the rail. The formation of hollow wear and associated false flanges can be linked to these concentrated contact points. As the contact position moves closer to the either the rail gauge corner or the wheel flange, the probability of a wheel-rail combination producing a high FISurf value increases. The rail and wheel profile shapes thus have a definite influence on the contact position and predicted fatigue damage. Most of the FISurf values greater than zero occur close to the gauge corner or the wheel flange. The selected wheel-rail contact area, excluding rail contact positions greater than -8.75mm, focuses on this area of predicted RCF initiation.
4

Vehicle System Dynamics: International Journal of Vehicle Mechanics and Mobility
The features used to describe the worn wheel and rail profile shape included hollow wear, gauge side false flange height, gauge side false flange gradient, hollow wear position relative to the taping line and the rail gauge corner deviation at -15° (Figure 8). These features are con-sistent with those defined by Fröhling et al. [5], except for the maximum hollow wear position. When a bogie is well aligned and runs true, with only small differences in wheel diameters, it will result in a maximum hollow wear position close to the taping line. The maximum hollow wear position is considered since it indicates the health of a bogie and its tracking. The gauge side false flange height and gradient are calculated as the largest difference in height or gradient between a new and worn wheel profile between 35 and 60mm from the back of the wheel flange.
4 SENSITIVITY OF RCF DAMAGE PARAMETERS TO PROFILE SHAPE FEATURES
The cumulative RCF damage parameters (ΣDI and ΣFISurf) calculated from the simulation re-sults were used to examine the potential of the profile shape features to promote the initiation of surface RCF. Box plots were used to examine the damage parameters’ sensitivities to the ob-served head check classes (Figure 9). The bottom, centre and top lines of the boxplot correspond to the 25
th, 50
th or median and 75
th percentile values. The whiskers correspond to ±2.7 times the
standard deviation providing a 99.3% coverage of the data, assuming it as normally distributed. Values beyond the whiskers are included as crosses.
The medians, 75th percentiles and outer whiskers increase as the observed RCF damage in-
creases. Both damage parameters show that the rails that were visually classified with more fa-tigue damage show higher predicted RCF damage.
4.1 Wheel features
It is known from [3-5] that hollow wear is an effective feature to monitor and limit the initiation and growth of RCF cracks. The hollow wear is compared to the DI and FISurf values in Figure 10. Figure 10 clearly shows that both damage parameters are sensitive to hollow wear. Wheel profiles with more hollow wear causes more RCF damage in general.
Fröhling et al. [5] suggested that RCF initiation might be more sensitive to the gauge side false flange gradient than the hollow wear. From Figure 11 it can be seen that both damage pa-rameters show sensitivity to the gauge side false flange height and gradient. These features prove that the hollow wear shape has an influence on RCF initiation.
There are however, outliers to these relationships, of which three are indicated by stars in Figures 10, 11 and 12. The profiles of these three outliers showed distinctive signs of skew run-ning bogies. The wheel profiles do not show significantly high false flange heights, gradients or even hollow wear, but these profiles produce contact conditions promoting fatigue damage on many rail profiles. The outliers prove the reality of in-service wheel profiles that react outside the norm. There are wheel profiles that are flagged by the limits imposed on them, that is, limit-ing hollow wear to 2mm reduces the fatigue impact of these wheel profiles. However, there are underperforming wheel profiles that cannot accurately be identified by the wheel features of Figures 10 and 11.
The hollow wear position shown in Figure 12 was investigated to be able to segregate the outliers. From Figure 12 it can be seen that both the damage parameters are the most sensitive to the hollow wear position. The hollow wear position shows the best correlation compared with the other wheel features. As the hollow wear positions become increasingly negative and thus move closer to the wheel flange, the probability of severe RCF increases. The importance of good vehicle tracking is thus highlighted. Bogies running true with low wheelset diameter dif-ferences will yield hollow wear positions closer to the taping line. The fatigue impact of wheels can thus be limited by reducing skew running bogies.
It should be noted that the y-axes of Figures 10 to 12 are shown as a non-linear log scales. Any linear relationship on this log scale will produce a non-linear increase on a linear scale. The four wheel features show that an increase in their values produce a non-linear increase in the predicted damage. By limiting any of these features, it is possible to limit damage produced at their extreme values.
5

U. Spangenberg et al.
4.2 Rail features
Visual inspections and in-field observations have shown that rail profiles with lower than target gauge corners are more prone to severe RCF damage (see Figure 2). Although Fröhling et al. [5] were unable to prove any relationship between the gauge corner deviation and the amount of RCF damage, the gauge corner deviation at -15° was once again studied to determine its poten-tial contribution to RCF initiation and crack growth.
DI and FISurf values are compared with the gauge corner deviation at -15° in Figures 13a and b, respectively. The damage parameters show an increase as the gauge corners become increas-ingly lower than the target rail profile. This indicates that rail profiles with low gauge corners are more prone to RCF damage. These rail profiles do not have sufficient material to establish the required rolling radius difference and promote wheelset steering. Higher tangential curving forces are generated during inadequate steering. The as-ground shape of the rail should therefore be tightly controlled to reduce the fatigue impact of the rail profile shape. The limit imposed by Transnet Freight Rail is a maximum deviation of ±0.3mm. The rail profiles contributing the most to RCF damage lie beyond 0.3mm and therefore RCF damage can be limited by adhering to this limit.
4.3 Reduction in rail RCF damage by eliminating damaging features
The analysis of the different wheel and rail profile shape features proved that the RCF on the high rails is caused by its profile deviation as well as underperforming wheel profiles. If the wheel features that proved to contribute to RCF initiation are eliminated, the damage caused to the high rails should reduce. The effect of applying various feature limits to the wheel profiles can be evaluated based on the total damage caused to the rails. This evaluation is performed by summing all the damage parameter values for all the rails after applying a limit to the wheels and dividing it by the total original accumulated damage. This provides a percentage value of the total amount of damage remaining once the limit has been applied. The significance of ap-plying limits to each wheel feature can then be assessed. The various limits were chosen to eliminate the same number of wheel profiles as a 2mm hollow wear limit would. The same wheels are not necessarily flagged by the different limits, although there may be some repeating wheels. The results as well as the various limits are shown in Table 3.
By applying these limits independently each feature effectively removes 8% of wheels from the total wheel population. Therefore, by removing a small number of wheels it is possible to achieve a great reduction in RCF damage. By placing a limit on the hollow wear position the highest amount of damage is removed and approximately 50% of the initial damage remains. This result stresses the importance of good vehicle tracking. By reducing skew running bogies the hollow wear position can be limited to the taping line and the initiation of RCF can be re-duced.
The limit that provides the next best performance is the hollow wear limit, followed by the gauge side false flange gradient and finally the gauge side false flange height. When all the lim-its are applied in combination 64 wheels are removed, which is equivalent to 20% of the total wheel population. The reduction in damage parameter values due to the application of all the limits are shown as a comparison in Figure 14. However, this results in only removing some of the damage. The remaining wheels contribute 45% of the initial RCF damage. This is not a sig-nificant improvement over the hollow wear position limit and requires a large amount of wheels to be removed. The hollow wear position appears to provide the best feature to limit and moni-tor.
The purpose of this study was not intended to establish new limits to wheel and rail profile shapes, but rather to understand the influence of the various shapes on RCF initiation. Should the most damaging shapes be avoided or eliminated through maintenance and/or through an im-provement in the system, it will result in a reduction of RCF damage.
The features that were studied prove that wheel profiles with concentrated hollow wear re-sulting in gauge and field side false flanges are prone to initiate RCF damage. Rail profiles with their gauge corners lower than target afford the underperforming wheels the opportunity to con-tact the gauge corner and promote RCF initiation. These features should be reduced or eliminat-ed through better designs and maintenance. Such designs could spread the wear across the
6

Vehicle System Dynamics: International Journal of Vehicle Mechanics and Mobility
wheel tread, reducing the formation of concentrated hollow wear. Grinding maintenance of rails should be aimed at improving the rail profile’s compliance to the specified target rail profile.
However, the biggest improvement related to RCF initiation could come from improving bo-gie tracking. The bogie tracking and subsequently the position of the hollow wear is greatly in-fluenced by bogie maintenance and diametrical equivalence of wheelsets. Should the bogie tracking be improved, the position of the hollow wear can be constrained to the wheel taping line and the probability of RCF initiation will be greatly reduced.
5 CONCLUSION
The influence of wheel and rail profile shape features on the initiation of RCF cracks was evalu-ated using multi-body vehicle dynamics simulations. The damage index and surface fatigue in-dex were used to assess the influence of the different features.
The damage parameters showed sensitivity to all the wheel features. The hollow wear posi-tion proved to be the most sensitive wheel feature. However, measuring and controlling hollow wear depth remains the most practical method to control RCF initiation. It was also shown that the probability of RCF increases as the gauge corner at -15° drops below the target rail profile.
According to Ekberg et al. [20] RCF can be limited if the wheel-rail system as a whole is maintained to suppress the worst operating conditions. Only some of the operating conditions were considered in this study and other contributing factors such as track irregularities should receive attention in an effort to reduce RCF initiation.
REFERENCES
[1] Scheffel, H. A new design approach for railway vehicle suspension. Rail Int. 1974; 638: 638-651. [2] Scheffel, H. Experience gained by South African Railways with the diagonally stabilised (cross-
anchor) bogies having self-steering wheelsets. Paper presented at: Heavy Haul Railways Confer-ence. 1978; Perth: Australia.
[3] Tournay, H.M. & Mulder, J.M. The transition from the wear to the stress regime, Wear. 1996; 191: 107-112.
[4] Fröhling, R.D., Ekberg, A. & Kabo, E. The detrimental effects of hollow wear -- field experiences and numerical simulations. Wear. 2008; 265: 1283-1291.
[5] Fröhling, R.D., Spangenberg, U. & Hettasch, G. Wheel/rail contact geometry assessment to limit rolling contact fatigue initiation at high axle loads. Vehicle System Dynamics: International Journal of Vehicle Mechanics and Mobility. 2012; 50(Suppl. 1): 319-334.
[6] Karttunen, K., Kabo, E. and Ekberg, A. Numerical Assessment of the influence of worn wheel tread geometry on rail and wheel deterioration. Wear. 2014; 317: 77-91.
[7] Wu, H., Kalay, S. and Tournay, H. Development of the wheel–rail interface management model and its applications in heavy haul operations. Proceedings of the Institute of Mechanical Engineers Part F: Journal of Rail and Rapid transport. 2010; 225: 38-47.
[8] Fröhling, R.D., Mistry, K.C. & Maree, H. BBB8324 – Rail Surface Fatigue Classification Chart (Head Checks and Field Side Surface Cracks). Pretoria: Transnet Freight Rail; 2005.
[9] Karttunen, K., Kabo, E. and Ekberg, A. The influence of track geometry irregularities on rolling contact fatigue. Wear, 2014; 314: 78-86.
[10] Tunna, J. and Urban, C. A parametric study of the effects of freight vehicles on rolling contact fa-tigue of rail. Proceedings of the Institution of Mechanical Engineers, Part F: Journal of Rail and Rapid Transit. 2009; 223: 141-151.
[11] VI-Rail version 16.0.23615. Computer software. Marburg: VI-grade GmbH; 2014. [12] Cole, C. How Accurate is Your Train Simulator? A Discussion of Simulation and Validation Tech-
niques. In: Oghanna, Wardina (Editor). Conference on Railway Engineering Proceedings: Engi-neering Innovation for a Competitive Edge. 1998; Rockhampton, Qld: Central Queensland Univer-sity: 167-171.
[13] Marutla, M.A., Mistry, K., Van Aardt, J.H.P. & Mtetwa, C.Q. BBB0481 ver. 2 – Manual for track maintenance. Johannesburg: Transnet Freight Rail; 2012.
[14] Ekberg, A., Kabo, E. & Andersson, H. An engineering model for prediction of rolling contact fa-tigue of railway wheels. Fatigue & Fracture of Engineering Materials & Structures. 2002; 25: 899-909.
7

U. Spangenberg et al.
[15] Burstow, M.C. Whole Life Rail Model Application and Development for RSSB: Development of an RCF Damage Parameter. Derby: Rail Safety & Standards Board; 2003.
[16] Johnson, K.L.. The strength of surfaces in rolling contact. Journal of Mechanical Engineering Sci-ence. 1989; 203: 151-163.
[17] Ekberg, A. & Kabo, E. Rolling contact fatigue of railway wheels and rails - an overview. Proceed-ings of Rolling Contact Fatigue: Applications and Development. 2002; Brescia: Italy.
[18] Tunna, J., Sinclair, J. & Perez, J. A review of wheel wear and rolling contact fatigue. Proceedings of the Institute of Mechanical Engineers, Part F: Journal of Rail and Rapid Transit. 2007; 221: 271-289.
[19] Burstow, M.C. Whole Life Rail Model Application and Development for RSSB (T115) - Continued Development of and RCF Damage Parameter. Derby: Rail Safety & Standards Board; 2004.
[20] Ekberg, A., Åkesson, B. & Kabo, E. Wheel/rail rolling contact fatigue – Probe, predict, prevent. Wear. 2014; 314: 2-12.
8

Vehicle System Dynamics: International Journal of Vehicle Mechanics and Mobility
Table 1. Correlation coefficients for measured and simulated results.
Result name Correlation coefficients
Leading wheelset or vehicle responses
Trailing wheelset
% %
Longitudinal force – Left wheel 97 93 Longitudinal force – Right wheel 97 93 Lateral force – Left wheel 56 96 Lateral force – Right wheel 77 98 Vertical force – Left wheel 91 94 Vertical force – Right wheel 92 94 Wheel contact position– Left wheel 97 97 Wheel contact position– Right wheel 97 96 Wagon body roll 97 Bogie rotation – Left 97 Bogie rotation – Right 98 Side bearer clearance – Left 92 Side bearer clearance – Right 90 Secondary suspension displacement – Left 82 Secondary suspension displacement – Right 35 Lateral primary suspension displacement – Left 97 Lateral primary suspension displacement – Right 94 Longitudinal primary suspension displacement – Left 87 Longitudinal primary suspension displacement – Right 93
9

U. Spangenberg et al.
Table 2. UIC60 CrMn rail strength parameters [5].
Rail strength parameter Value
MPa
Tensile yield strength 590 Ultimate tensile strength 1080 Yield strength in shear 553-621
10

Vehicle System Dynamics: International Journal of Vehicle Mechanics and Mobility
Table 3. Remaining damage after the application of wheel feature limits.
Feature to limit Limiting value Remaining damage based on DI
Remaining damage based on FISurf
Number of wheels eliminated
Percentage of total wheel population
% % %
Hollow wear 2mm 75.00 70.60 28 7.95 Gauge side false flange height 1.85mm 94.40 90.60 28 7.95 Gauge side false flange gradient 0.129mm/mm 91.10 88.50 28 7.95 Hollow wear position -8.1mm 48.40 55.20 28 7.95 All wheel features All limits 42.80 45.40 64 18.18
11
U. Spangenberg et al.
Figure 1. RCF damage on the high rail and low rail due to false flange contact.
Figure 2. RCF class distribution versus rail gauge corner deviation at -15°.
Figure 3. Hollow wheel wear (a) and curve radius (b) distributions used in simulations.
12

Vehicle System Dynamics: International Journal of Vehicle Mechanics and Mobility
Figure 4. Illustration of (a) shakedown value and (b) wear number extraction.
Figure 5. Rolling contact fatigue damage function.
13

U. Spangenberg et al.
Figure 6. Comparison of (a) peak-valley and averaged shakedown values and (b) shakedown values with
and without the inclusion of track irregularities.
Figure 7. FISurf as a function of the contact position on (a) the rail and (b) the wheel.
14

Vehicle System Dynamics: International Journal of Vehicle Mechanics and Mobility
Figure 8. Graphic representation of (a) wheel and (b) rail features.
Figure 9. In-field observed RCF class and its correlation to (a) the damage index and (b) the surface fa-tigue index.
Figure 10. The influence of hollow wear on (a) the damage index and (b) the surface fatigue index (outli-ers shown with *).
15

U. Spangenberg et al.
Figure 11. The influence of the gauge side false flange height and gradient on (a), (b) the damage index and (c), (d) the surface fatigue index (outliers shown with *).
Figure 12. The influence of hollow wear position on (a) the damage index and (b) the surface fatigue in-dex (outliers shown with *).
Figure 13. The influence of the gauge corner deviation at -15° on (a) the damage index and (b) the surface fatigue index.
16

Vehicle System Dynamics: International Journal of Vehicle Mechanics and Mobility
Figure 14. Comparison of damage index values before and after application of all the wheel feature limits.
17