Influence of abiotic factors on growth and …...solo e nas populações endémicas. No entanto,...
63
2019 UNIVERSIDADE DE LISBOA FACULDADE DE CIÊNCIAS DEPARTAMENTO DE BIOLOGIA ANIMAL Influence of abiotic factors on growth and nodulation of Acacia longifolia Carolina Vidal Ribeiro da Silva Sampaio Mestrado em Biologia Humana e Ambiente Dissertação orientada por: Professora Doutora Maria Helena Machado Trindade de Donato e Professora Doutora Cristina Maria Filipe Máguas da Silva Hanson
Transcript of Influence of abiotic factors on growth and …...solo e nas populações endémicas. No entanto,...

2019
UNIVERSIDADE DE LISBOA
FACULDADE DE CIÊNCIAS
DEPARTAMENTO DE BIOLOGIA ANIMAL
Influence of abiotic factors on growth and nodulation of
Acacia longifolia
Carolina Vidal Ribeiro da Silva Sampaio
Mestrado em Biologia Humana e Ambiente
Dissertação orientada por:
Professora Doutora Maria Helena Machado Trindade de Donato e Professora Doutora
Cristina Maria Filipe Máguas da Silva Hanson

ii
Acknowledgements
A realização deste projecto não teria sido possível sem a contribuição e apoio de várias pessoas, as
quais não poderia deixar de mencionar.
Em primeiro lugar gostaria de agradecer às minhas orientadoras, as Professoras Doutoras Helena
Trindade e Cristina Máguas. À professora Helena Trindade, obrigada pela disponibilidade paciência e
compreensão ao longo de todo este projecto. À professora Cristina Máguas, obrigada pela orientação e
pelo conhecimento transmitido.
Aos Professores Doutores Rogério Tenreiro e Margarida Ramos, muito obrigada pela disponibilidade
e interesse para com o meu projecto.
À Cristina Antunes, Catarina Costa e Andreia Anjos, agradeço a disponibilidade com que
esclareceram questões que me foram surgindo ao longo deste trabalho.
Muito obrigada aos meus colegas do gabinete 2.1.49, em particular à Sara Vicente, por todo apoio,
ajuda e disponibilidade, sem os quais não seria possível a realização deste projecto.
Por último, e acima de tudo, queria agradecer aos meus pais e à minha irmã, a quem gostaria de
dedicar esta dissertação. Obrigada pelo apoio incondicional, não só agora, como sempre.

iii
Resumo
O género Acacia está entre os invasores mais agressivos em todo o mundo. Este grupo de
plantas leguminosas causa sérios problemas nos habitats em que é introduzido, uma vez que modifica
drasticamente as comunidades nativas, provoca alterações no solo, nomeadamente nos reservatórios de
carbono e azoto, e ainda no ciclo da água. Uma vantagem competitiva importante da maioria das
acácias em relação às plantas nativas resulta da possibilidade de crescer e prosperar em solos muito
pobres, por terem a capacidade de desenvolver nódulos fixadores de azoto, que promovem a sua
nutrição e desenvolvimento. Portanto, a introdução de Acacia diminui a diversidade biológica e altera
o funcionamento dos ecossistemas.
Em Portugal, uma das espécies mais problemática é a Acacia longifolia. Esta espécie foi
introduzida no nosso país pelos serviços florestais como forma de preservar e fixar dunas de algumas
zonas costeiras. Desde a sua introdução nos séculos XIX e XX, a espécie colonizou os ecossistemas
agro-florestais e dunares, perturbando o seu funcionamento e alterando o equilíbrio nas comunidades
de flora nativa. O potencial invasor e a capacidade de colonização desta espécie exótica deve-se, em
parte, à sua capacidade de estabelecer relações simbióticas com bactérias fixadoras de azoto presentes
no solo. A fixação de azoto ocorre dentro dos órgãos recém-formados nas raízes da planta, designados
por nódulos, como resultado de uma simbiose estabelecida entre a planta e bactérias colectivamente
designadas por rizóbio. Vários estudos têm sido realizados, relativamente ao processo de fixação
biológica de azoto e no impacto que Acacia spp. tem sobre os habitats que invade, especialmente no
solo e nas populações endémicas. No entanto, sabe-se pouco sobre a forma como os factores abióticos,
por exemplo, as características do próprio solo, podem influenciar e condicionar o desenvolvimento
das plantas.
Neste trabalho temos como objectivo compreender como as condições abióticas podem
potenciar ou limitar o desenvolvimento de A. longifolia. Nesse sentido pretendemos comparar o
desenvolvimento de acácias germinadas em tipos três solos – agrícola, florestal e dunar, submetidas a
diferentes condições de nutrição e irrigação. Pretende-se assim compreender, e como estes factores
vão condicionar a formação de nódulos radiculares, bem como o estabelecimento de relações de
simbiose entre a planta e microorganismos fixadores de azoto presentes no solo.
Para tal, foram recolhidas amostras de sementes e solo da região de Vila Nova de Mil Fontes.
As sementes foram germinadas e, posteriormente, desenvolvidas em estufa, em três tipos diferentes de
solos - agrícola, florestal e dunar. Adicionalmente as plantas foram sujeitas à conjugação de quatro
tratamentos – irrigação a 30% ou 70% da capacidade de campo, presença ou ausência de solução
nutritiva. As plantas tiveram um período de crescimento de vinte semanas e ao fim desse período
foram avaliadas, através da medição, em cada planta, dos seguintes parâmetros: (1) comprimento
aéreo e radicular; (2) área total da folha; (3) número e peso fresco dos nódulos, filódios e raízes e (4)
níveis relativos de clorofila, medidos com SPAD-502. Adicionalmente três discos de filódios foram
removidos de algumas das plantas em estudo, não só de modo a avaliar o conteúdo absoluto de
pigmentos fotossintéticos, como também numa tentativa de estabelecer uma curva de calibração com
as leituras de SPAD. O processo de fixação de azoto foi avaliado tendo por base a composição
isotópica de carbono e azoto, tanto nos nódulos, como nos filódios.
Adicionalmente, as comunidades bacterianas presentes nos nódulos radiculares foram
isoladas. Primeiramente, os nódulos de cada solo e respectivo tratamento foram agrupados e
desinfectados. Após confirmação da sua desinfecção por impressão em caixa de Petri, os mesmos
foram macerados e suspendidos em NaCl 0.85% . Posteriormente, esta suspensão foi inoculada em
meio de manitol e incubada durante 48 a 72 horas. Por repicagens sucessivas, foram obtidas colónias
puras, procedendo-se à lise das células, através do boiling method, seguido da análise molecular por
fingerprinting. A análise foi realizada através da técnica de Rep-PCR, tendo sido testados três primers

iv
– M13, PH e GTG5. Os produtos obtidos por amplificação foram separados por electroforese em gel
de agarose e as imagens resultantes foram capturadas com UV transiluminador Alliance 4.7 (Uvitec,
Cambridge) e analisadas com o software BioNumerics, de forma a avaliar a diversidade bacteriana
presente.
A análise de dados realizada após levantamento do ensaio, revelou que o desenvolvimento dos
exemplares de A. longifolia foi principalmente afectado pelo solo e pelo regime nutritivo. As acácias
desenvolveram-se mais em solo florestal e agrícola, traduzindo pelo maior crescimento da parte aérea
e pelo maior número de filódios. No entanto, as plantas desenvolvidas neste último tipo solo,
apresentaram um menor número de nódulos. Em contraste, no solo dunar registou-se um menor
desenvolvimento, particularmente em termos de crescimento, número e área dos filódios. Estas
diferenças deveram-se principalmente às características do solo, regime nutritivo e à sua interacção.
O solo agrícola foi um solo artificialmente alterado, sujeito a fertilização, com elevada
disponibilidade nutritiva. O solo florestal teve uma elevada quantidade de matéria orgânica. O solo
dunar apresentou uma composição intermédia, em termos de disponibilidade de matéria orgânica e de
nutrientes. Logo, uma maior disponibilidade nutritiva levou por um lado a um maior desenvolvimento
e por outro, a uma menor nodulação e fixação de azoto. De forma análoga, considerando o regime de
solução nutritiva, os exemplares às quais esta foi adicionada tiveram um maior crescimento, resultante
da maior disponibilidade de nutrientes, que tende a promover o desenvolvimento das plantas. Houve,
tendencialmente, um maior incremento (aéreo e radicular) na presença de solução nutritiva e conforto
hídrico (W+N+), particularmente nos solos florestal e agrícola. Em suma, a acção simultânea dos
diferentes factores abióticos influenciou o desenvolvimento da planta. No entanto, a influência dos
diferentes factores e conjugações de tratamentos foi diferente consoante o solo em que foram
aplicados. As plantas que se desenvolveram em solo agrícola, por ser rico em nutrientes e com grande
capacidade de retenção de água, foram de modo geral pouco afectadas por alterações nos tratamentos,
enquanto que as que se desenvolveram em solo dunar (poroso e pobre em nutrientes), viram
desenvolvimento condicionado pelos diferentes regimes de nutrição e irrigação. Os nossos resultados
evidenciaram ainda que em situação de menor disponibilidade nutritiva houve uma maior fixação de
azoto atmosférico, o que se traduziu em menor conteúdo δ15
N. Esta tendência foi transversal aos
vários tipos de solo, mas foi particularmente evidente no solo dunar, onde foram registados os valores
mais baixos. Quanto às concentrações de pigmentos fotossintéticos, houve uma tendência para que
fossem mais baixas em solo agrícola, resultantes de filódios com maior área e maior conteúdo hídrico.
Quanto à análise da diversidade bacteriana, foram obtidos 111 colónias a partir dos nódulos
radiculares. O fingerprinting obtido com os primers PH e GTG5 evidenciou não só a diversidade e
heterogeneidade bacteriana associada a A. longifolia, como também o caracter generalista da espécie.
No entanto não foi possível estabelecer qualquer correlação entre as colónias obtidas e as combinações
de tratamentos aplicadas durante o ensaio experimental, o que indica que estes tratamentos não
influenciaram o número de bactérias em simbiose com A. longifolia. Não foi também possível
correlacionar o desenvolvimento das acácias com a diversidade bacteriana obtida em cada solo e
respectivo tratamento. Estes resultados são, no entanto, preliminares, pelo que será necessária a
realização de mais estudos que permitam a identificação das bactérias, e deste modo melhor
compreender se há uma correlação entre o desenvolvimento da planta e as estirpes bacterianas
presentes nos nódulos radiculares.
Relativamente à calibração entre as leituras de SPAD e os níveis absolutos de pigmentos
fotossintéticos, foram obtidos baixos coeficientes de ajustamento, entre 0.1 e 0.3, para os modelos
calculados. Apesar destes valores, a relação entre as leituras espectrofotométricos e de SPAD-502, de

v
clorofila e de carotenóides, foram estatisticamente significativa. Logo, as equações de calibração
obtidas possuem capacidade preditiva, sendo, no entanto, necessário a análise de mais amostras para
validar o modelo.
Como conclusão deste trabalho, e considerando a Acacia longifolia uma espécie invasora
extremamente agressiva que perturba e modifica habitats e comunidades tanto em Portugal como
noutras regiões do mundo, o estudo dos factores que influenciam o desenvolvimento da espécie é
essencial. Uma vez que o sucesso de A. longifolia resulta da conjugação e interacção de vários
factores, serão necessários mais estudos que sigam uma perspectiva integrativa.
Com este trabalho, pretendeu-se dar-se uma contribuição para o melhor entendimento dos
processos subjacentes ao sucesso de A. longifolia como invasora, tais como o papel dos factores
abióticos na modulação do desenvolvimento da planta e a importância da fixação biológica de azoto,
particularmente em situações de escassez de nutrientes, de forma a encontrar estratégias para evitar o
seu estabelecimento e controlar a sua dispersão.
Palavras-chave: Acacia longifolia, factores abióticos, nódulos, fixação de azoto

vi
Abstract
The genus Acacia is amongst the most aggressive invaders worldwide. This group of leguminous
woody plants causes severe problems in habitats in which it is introduced since it drastically changes
communities. In Portugal, Acacia spp. is one of the most prolific plant invaders, specifically the
species Acacia longifolia, introduced in the country’s coastal areas in the late 19th century, early 20
th
century. Since their introduction, the species has colonized agroflorestal and dune ecosystems,
disrupting their functioning, altering the balance in native flora community. One of the key functional
traits of invasive potential and colonizing capacity of these alien species lies in their ability to perform
biological atmospheric nitrogen fixation. The nitrogen fixation occurs inside of newly formed organs,
the nodules, as a result of a symbiosis established between the plant and legume nodulating bacteria,
the rhizobia. The process of biological nitrogen fixation and the impact that Acacia spp. have on the
habitats it invades, specially concerning the soil and the above and belowground communities is well
documented. However, not much is known about how the characteristics of the soil itself, as well as
other abiotic factors, might affect plant development and its influence on the process underlying the
species invasive ability. This study intends (1) to access how abiotic factors modulate A. longifolia
development, using seedlings grown in three different types of soil – forest, agricultural and dune, and
submitted to different conditions of irrigation and nutrition. We set out to evaluate the effect of these
factors on overall plant development, and (2) to correlate also plant development with the plant
capacity to nodulate. Furthermore, we intent (3) to better understand the symbiosis between nitrogen-
fixing microorganisms, as well as, (4) to find the correlation between SPAD readings and
photosynthetic pigments content, through the determination of the calibration equation. Seedlings of
A. longifolia were germinated in the different types of soil (forest, agricultural and dune) under four
treatments – hydric comfort vs hydric stress, in combination with presence vs absence of nutritive
solution. After twenty weeks of growth, performance of the plants was evaluated by measuring (1)
shoot and root length; (2) total leaf area; (3) number and fresh weight of nodules, phyllode and roots
and (4) relative levels of chlorophyll through SPAD. Later, absolute photosynthetic pigments content
was determined, while the nitrogen fixation process was evaluated based on the isotopic composition
of carbon and nitrogen, both in nodules and phyllodes. The results demonstrate that specimens
germinated in forest and agricultural soil grew more, but the ones in the latter had fewer nodules. In
turn, A. longifolia seedlings developed in dune soil had a lower growth and a greater development of
root nodules. Furthermore, a higher nutrient availability led to a greater plant development,
accompanied by less nodulation and nitrogen fixation. Though, with the reduction of nutrient
reinforcement, there was a greater fixation of atmospheric nitrogen, since phyllode δ15
N values were
closer to zero in the absence of nutrient solution. This trend, transversal to soil type, was particularly
evident in the dune soil. Thus, our results indicate not only the preponderance of abiotic factors such
as soil and nutrition in the promotion and hinder of growth and nodulation of Acacia longifolia, but
also that this conditioning is a result of their interaction. Regarding the calibration between the SPAD
readings and the absolute levels of photosynthetic pigments, despite the low adjustment coefficients,
the calibration equations obtained had predictive capacity. However it’s necessary to analyse more
samples to validate the model. Rhizobia analysis indicated not only, the varied and heterogeneous
bacterial community associated with A. longifolia, but also the species status as a generalist. However,
it was not possible to establish a correlation between the number and diversity of isolates and the
treatments applied, since strains from the same soil and treatment combinations grouped into different
clusters. Additional studies are necessary in order to identify the isolated bacteria and better
understand the rhizobial community associated with A. longifolia and its influence on plant fitness.In
conclusion, Acacia longifolia is an extremely aggressive invasive species that disturbs and modifies
habitats and communities both in Portugal and in other regions of the world, rendering it essential the
study of the factors that influence the development of the species.
Key words: Acacia longifolia, abiotic factors, nodules, bacteria, nitrogen fixation

vii
Table of Content Acknowledgements ........................................................................................................................ i
Resumo ......................................................................................................................................... iii
Abstract ........................................................................................................................................ vi
1.Introduction ................................................................................................................................ 1
1.1 Acacia longifolia – functional traits .................................................................................... 1
1.2 Stable isotopes ..................................................................................................................... 3
1.3 SPAD ................................................................................................................................... 3
1.4 Aims .................................................................................................................................... 4
2. Materials and Methods .............................................................................................................. 5
2.1 Seed collection and germination ......................................................................................... 5
2.2 Soil collection and analysis ................................................................................................. 5
2.3 Experimental set-up ............................................................................................................. 5
2.4 Data Collection .................................................................................................................... 7
2.4.1 Physiological performance evaluation ......................................................................... 7
2.4.2 Photosynthetic pigment determination ......................................................................... 7
2.4.3 Carbon and Nitrogen Isotopic Analysis ....................................................................... 8
2.5 Nodules and Bacteria........................................................................................................... 8
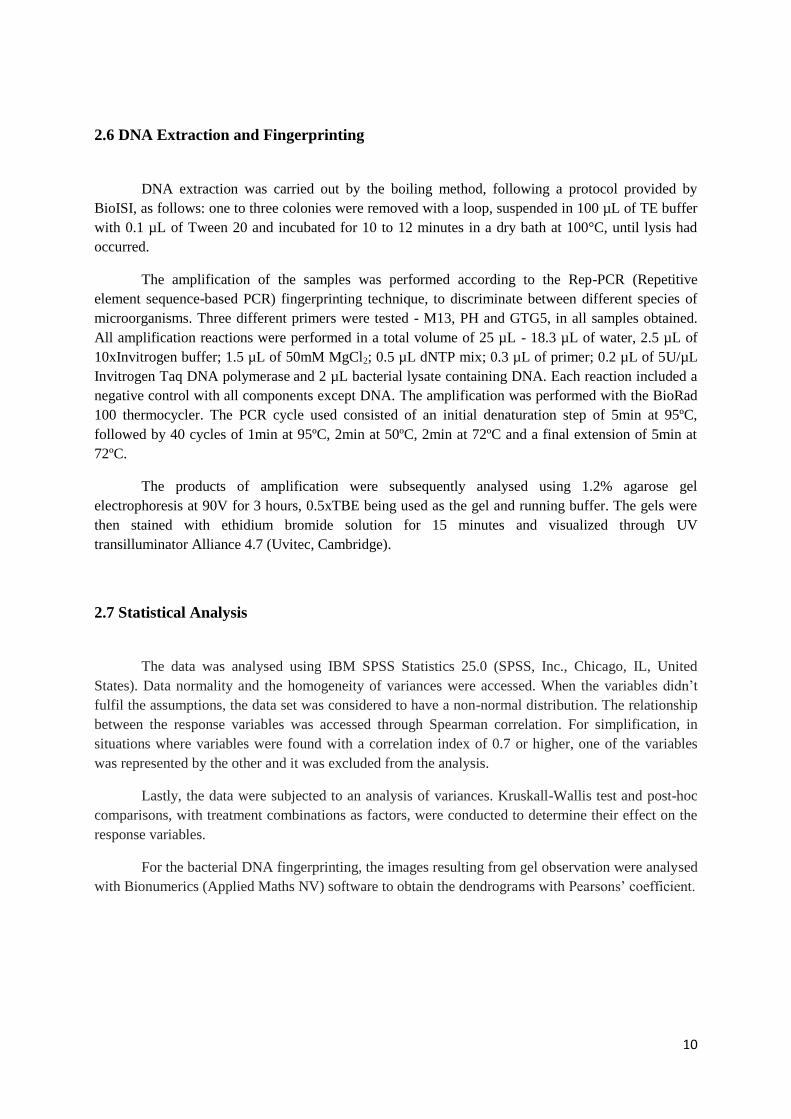
2.6 DNA Extraction and Fingerprinting .................................................................................. 10
2.7 Statistical Analysis ............................................................................................................ 10
3. Results ..................................................................................................................................... 12
3.1 Soil Analysis ..................................................................................................................... 12
3.2 Overall assessment of treatment combinations on plant development .............................. 13
3.2.1 Increment, roots and root/shoot ratio .......................................................................... 13
3.2.2 Phyllodes .................................................................................................................... 16
3.2.3 Nodules ....................................................................................................................... 18
3.2.4 Photosynthetic Pigments Content Analysis ................................................................ 20
3.2.5 Isotopic Analysis ........................................................................................................ 23
3.3 Photosynthetic pigments analysis ...................................................................................... 26
3.4 Bacteria Analysis ............................................................................................................... 28
4. Discussion ............................................................................................................................... 31
4.1 Do abiotic factors influence Acacia longifolia growth and development?........................ 31
4.2 What type of interactions are established between Acacia longifolia and nitrogen fixing
bacteria? .................................................................................................................................. 34
4.3 Can SPAD be correlated with photosynthetic pigment quantification? ............................ 36
5. Conclusion and Future Perspectives ........................................................................................ 37

viii
6. References ............................................................................................................................... 38
6. Appendices .............................................................................................................................. 42
6.1 Appendix I- Formulations ................................................................................................. 43
6.2 Appendix II- Significance Levels ...................................................................................... 44
6.3 Appendix III- Values for absolute chlorophyll content in Acacia longifolia phyllode ..... 46
6.4 Appendix IV- Significance Analysis of Calibration Models............................................. 48

ix
List of Figures
Figure 1.1: Acacia longifolia close-up and distribution. ........................................................................ 1
Figure 1.2: Stages of root nodule formation in a leguminous plant. ...................................................... 2
Figure 2.1: Experimental Design. .......................................................................................................... 6
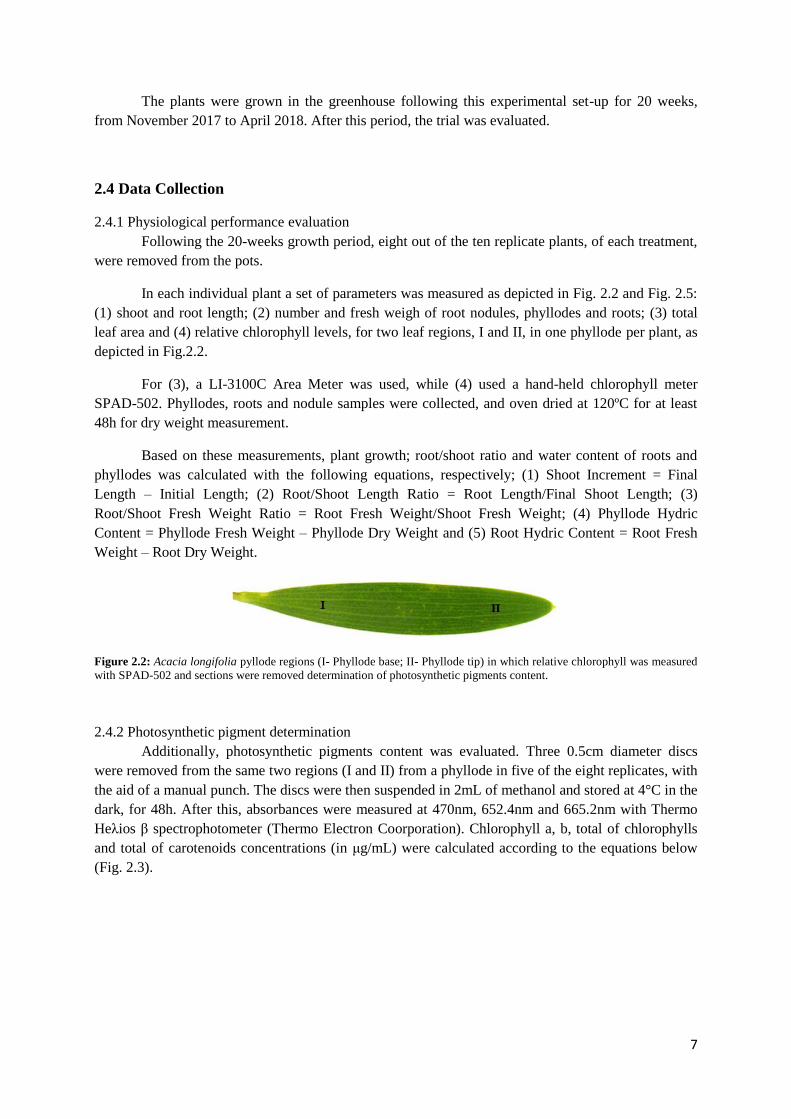
Figure 2.2: Acacia longifolia pyllode regions in which relative chlorophyll was measured with
SPAD-502. .............................................................................................................................................. 7
Figure 2.3:Equations for the determinations of the concentrations of chlorophyll a (Ca), chlorophyll b
(Cb), total chlorophylls (Ca+b) and total carotenoids (Cχ+c). ..................................................................... 8
Figure 2.4: Nodule sterilization protocol.. ............................................................................................. 9
Figure 2.5: Data collection. ................................................................................................................ ..11
Figure 3.1: Acacia longifolia growth at the end of the experimental period of 20 weeks…….…..…13
Figure 3.2: Variance analysis box-plot of shoot increment. ...................................................... ………14
Figure 3.3: Root length diversity found in A. longifolia plants. ............................................................ 14
Figure 3.4: Variance analysis box-plot of root length. .......................................................................... 15
Figure 3.5: Average distribution of root/shoot length ratio. .................................................................. 15
Figure 3. 6: Variance analysis box -plot of root/shoot fresh weight ratio in plants of A. longifolia. .... 16
Figure 3.7: Variance analysis box-plot of root hydric content in plants of A. longifolia. ..................... 16
Figure 3.8: Examples of phyllode diversity. ......................................................................................... 17
Figure 3.9: Variance analysis box-plot of number of phyllodes in plants of A. longifolia. .................. 17
Figure 3.10: Variance analysis box-plot of phyllodes hydric content A. longifolia. ............................. 18
Figure 3.11: Nodules found in A. longifolia grown in forest, agricultural and dune soils showing the
variation in size. ..................................................................................................................................... 19
Figure 3.12: Variance analysis box-plot of nodule weight/number ratio in plants A. longifolia. ......... 19
Figure 3.13: Variance analysis box-plot of number of nodules in roots of A. longifolia. ..................... 20
Figure 3.14: Average distribution of nodule weight. ............................................................................ 20

x
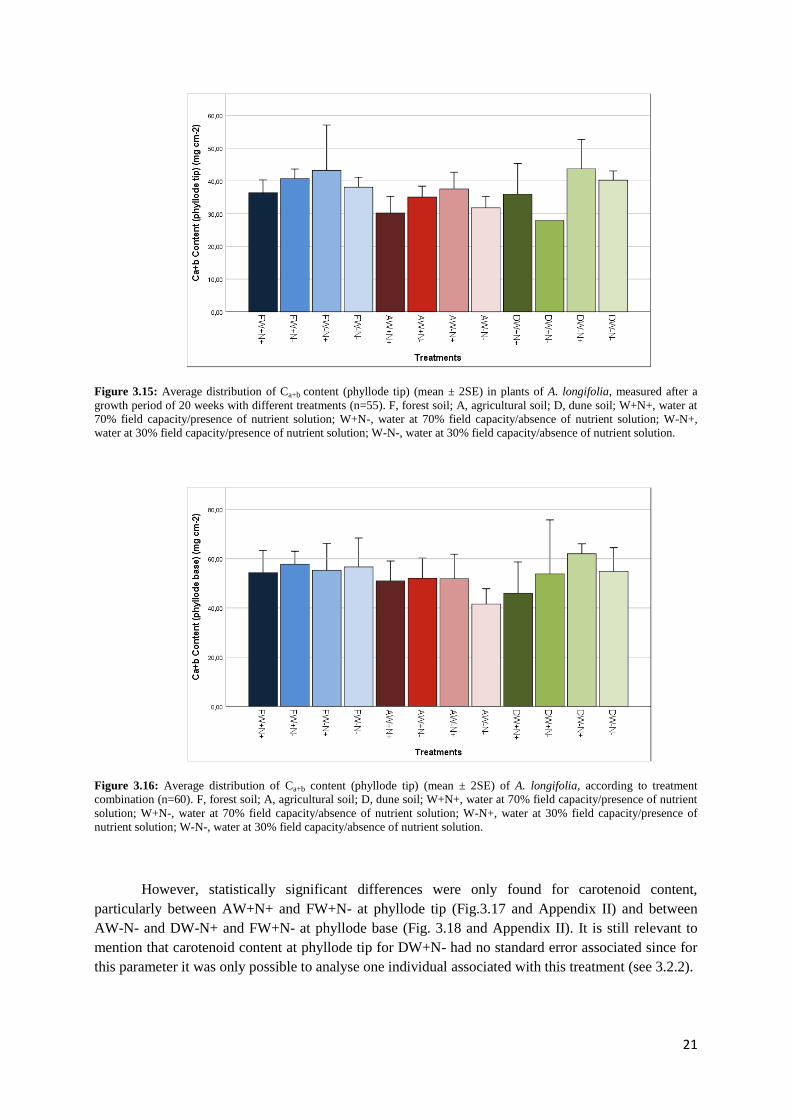
Figure 3.15: Average distribution of Ca+b content (phyllode tip). ......................................................... 21
Figure 3.16: Average distribution of Ca+b content (phyllode tip). ......................................................... 21
Figure 3.17: Variance analysis box-plot of carotenoid content (phyllode tip) in A. longifolia. ............ 22
Figure 3.18: Variance analysis box-plot of carotenoid content (phyllode base) in A. longifolia. ........ 22
Figure 3. 19: Variance analysis box-plot of δ15
N (phyllode) in A. longifolia. ...................................... 24
Figure 3.20: Calibration models relating SPAD-502 readings and chlorophyll a, chlorophyll b, total
chlorophyll and carotenoids content, in phyllode base........................................................................... 27
Figure 3.21: Calibration models relating SPAD-502 readings and (a) chlorophyll a (b) chlorophyll b
(c) total chlorophyll and (d) carotenoids content, in phyllode tip. ......................................................... 27
Figure 3.22: Observation of bacteria. .................................................................................................... 29
Figure 3.23: Dendogram combining GTG5 and PH fingerprinting results of bacteria isolated from A.
longifolia root nodules.………………………………………………………………..........................30
Figure 6.1: Average distribution of Ca content (phyllode tip). .............................................................. 46
Figure 6.2: Average distribution of Ca content (phyllode base).. .......................................................... 46
Figure 6.3: Average distribution of Cb content (phyllode tip). .............................................................. 47
Figure 6.4: Average distribution of Cb content (phyllode base).. .......................................................... 47

xi
List of Tables
Table 2.1: Treatment description and abbreviations applied in all three soils. ....................................... 6
Table 3.1: Soil characterization according to texture, pH in water, organic matter content, electric
conductivity and nutrient availability. .................................................................................................... 12
Table 3.2: Phyllode δ15
N, δ13
C, nitrogen (N) and carbon (C) content (mean ± SE) according to
treatment combinations. ......................................................................................................................... 23
Table 3.3: Nodules δ15
N, δ13
C, nitrogen (N) and carbon (C) content (mean ± SE) according to
treatment combinations. ......................................................................................................................... 24
Table 3.4: Equations and R2 values of calibration curves for SPAD-502 readings and
photosynthetic pigments content in phyllode base and tip. .................................................................... 26
Table 3.5: Number of bacterial isolates found in root nodules in plants of each soil and treatment,
before and after purification process. ..................................................................................................... 28
Table 6.1: Modified Hoagland Solution with final concentrations. ...................................................... 43
Table 6.2: Yeast Mannitol Medium ....................................................................................................... 43
Table 6.3: Kruskall-Wallis hypothesis test summary, according to treatment combinations. ............... 44
Table 6.4: Pairwise comparisons summary of statistical significant variables, according to treatment
combinations. ......................................................................................................................................... 45
Table 6.5: F-test two samples for variance between SPAD-502 readings and absolute chlorophyll a
(Ca) content at phyllode base. ................................................................................................................. 48
Table 6.6: F-test two samples for variance between SPAD-502 readings and absolute chlorophyll b
(Cb) content at phyllode base. ................................................................................................................. 48
Table 6.7: F-test two samples for variance between SPAD-502 readings and absolute total chlorophyll
(Ca+b) content at phyllode base. .............................................................................................................. 48
Table 6.8: F-test two samples for variance between SPAD-502 readings and absolute carotenoids
content at phyllode base. ........................................................................................................................ 49
Table 6.9: F-test two samples for variance between SPAD-502 readings and absolute chlorophyll a
(Ca) content at phyllode tip. .................................................................................................................... 49

xii
Table 6.10: F-test two samples for variance between SPAD-502 readings and absolute chlorophyll b
(Cb) content at phyllode tip. ................................................................................................................... 50
Table 6.11: F-test two samples for variance between SPAD-502 readings and absolute total
chlorophyll (Ca+b) content at phyllode tip. .............................................................................................. 50
Table 6.12: F-test two samples for variance between SPAD-502 readings and absolute carotenoids
content at phyllode tip.. .......................................................................................................................... 51

1
1.Introduction
The introduction of exotic plants is one of the major problems for local biodiversity as it
threatens the existence of endemic species as well as the integrity of flora and ecosystem communities.
Invasion by alien plant species can additionally have human and economic impacts, since the
biological invader might also affect agriculture and forestry (e.g. Brockwell et al. 2005; Richardson et
al. 2011).
1.1 Acacia longifolia – functional traits
The genus Acacia is amongst the most aggressive invaders worldwide (Brockwell et al. 2005).
This group of leguminous woody plants causes severe problems in habitats in which it is introduced
since it drastically changes communities, both above and belowground, causing changes in soil,
notably in the carbon and nitrogen reservoirs, as well as in the water cycle (Brokwell et al. 2005;
Marchante et al. 2015; Duarte et al. 2016). An important competitive advantage of most acacias in
relation to native plants results from the possibility of establishing mutualism with nitrogen fixing
bacteria present in the soil that promote their nutrition and growth (Brokwell et al. 2005). Therefore,
the introduction of the genus Acacia diminishes biological diversity and alters the functioning of
ecosystems, decreasing their value and causing severe damage to their functionality (Ulm et al. 2017;
Marchante et al. 2015; Rascher et al. 2011b; Hellman et al. 2011).
In Portugal, Acacia spp. is one of the most prolific plant invaders, specifically the species
Acacia longifolia (Duarte et al. 2016). A. longifolia (Andrews) Wild., is a shrub (or small tree)
belonging to the subfamily Mimosoideae, included in the family Fabaceae (Leguminosae). This
species is original from southeast Australia and it was introduced in Portugal, in coastal areas, in the
late 19th century, early 20
th century by the forestry services with the aim of stabilizing the dunes and
controlling its erosion (Marchante et al. 2008). Later, it was introduced in Vila Nova de Milfontes in
the late 60’s, early 70’s (Vicente, 2016) and currently it is present in most of the Portuguese coast
(Fig. 1.1).
Figure 1.1: Left- Close up of A. longifolia phyllodes and inflorescences; Right- A. longifolia distribution in Portugal.
Retrieved from: http://invasoras.pt/en/gallery/acacia-longifolia-en/ (22/03/2019).

2
This species can be considered as an ecosystem engineer (Richardson et al. 2000; Marchante et
al. 2011). Following introduction, A. longifolia alters nutrient cycles, water availability, community
composition and might even disrupt fire regimes (Marchante et al. 2008; Racher et al. 2009; Hellman
et al. 2011; Le Maitre et al. 2011). Its high growth rate and the presence of evergreen phyllodes, lead
to the formation of dense canopies (Le Maitre et al. 2011), which limits the availability of light to
understory plants (Rascher et al. 2011b; Souza-Alonso et al. 2017). This decrease in illumination will
affect under canopy species and thus reduce species diversity. In addition, this invasive species also
has shape plasticity, adapting to available height class niches, adopting shrub or small tree forms
(Rascher et al. 2011a, b). The species invasive success is also due to the strategies adopted by the
plant during periods of drought. These consist in morphological adaptations of the phyllodes and
adjustments in the water uptake to reduce water losses, as well as the use of alternative water sources
and root systems to the native flora (Antunes et al. 2018).
Acacia longifolia is also characterized by producing a large number of seeds that can
accumulate under the canopy, to be dispersed by other living beings, thus having the growth and
reproduction facilitated in comparison with the native species of the habitat in which it is introduced
(Marchante et al. 2015; Rascher et al. 2011b; Marchante et al. 2008).The seeds of A. longifolia have
characteristics that favour their invasive capacity, namely they have a hard integument, persist in the
soil, suffer less pre-dispersion predation, are of a large size and are heat tolerant (Correia et al. 2015,
2016). Its germination is even stimulated by heat and / or smoke (Marchante et al. 2008). Therefore,
the fires, which have a high occurrence in Portuguese soils, are an important factor for the dispersal
and growth of A. longifolia.
Additionally, we frequently observe an accumulation of litter, which contributes to the
alteration of soil characteristics and nutrient cycles. Biomass accumulation increases organic matter
content, as well as nitrogen and carbon pools, which at first could seem to benefit native species.
However, local flora cannot compete with A. longifolia growth rates and furthermore the species
phosphorus requirements disrupt N / P balance (Hellman et al. 2011; Souza-Alonso et al. 2017; Ulm et
al. 2017).
One of the key functional traits that ensure Acacia spp. invasive success is their ability to
perform biological atmospheric nitrogen fixation, which consists in the conversion of gaseous
atmospheric nitrogen into ammonia by the action of an enzyme (nitrogenase) (Dupont et al. 2012).
The nitrogen fixation occurs inside of newly formed organs, the nodules, primarily in the roots of the
plant, again, as a result of a symbiosis established between the plant and legume nodulating bacteria,
collectively called rhizobia.
Figure 1.2: Stages of root nodule formation in a leguminous plant, adapted from Sadava et al. 2014.

3
This is a mutual beneficial relation since the bacteria receive from the plant dicarboxylic acids
as a source of carbon and in return the plant receives ammonium form the rhizobia (Brockwell et al.
2005). The nodulating bacteria might belong to at least eight different genera Rhizobium,
Bradyrhizobium, particularly Bradyrhizobium japonicum, Sinorhizobium, Mesorhizobium,
Azorhizobium and Allorhizobium, as well as Ochrobactrum and Ensifer melitoti (Brockwell et al.
2005; Rodríguez-Echeverría et al. 2011; Souza-Alonso et al. 2017) and the same species and
eventually the same tree are able to form nodules with bacteria of several taxonomic groups
(Brockwell et al. 2005). The origin of these symbionts is still debated. Some studies indicate that
Acacia spp. establish symbiotic relationships with co- introduced microbes, while others suggest that
new mutualisms are established in the invaded locations (Rodríguez-Echeverría et al. 2011; Souza-
Alonso et al. 2017).
Moreover, there are indications, still little explored, that new symbiotic relations might occur
due to the horizontal transfer of symbiotic genes (responsible for nodulation and nitrogen fixation),
since they are present in plasmids and other transposable elements (De Meyer et al. 2015), to bacteria
present in the soil (Rodríguez-Echeverría et al. 2003, 2010; Ndlovu et al. 2013; Rout et al. 2012).
Also, there are indications, that not all bacteria present in nodules effectively perform nitrogen
fixation, non-symbiotic endophytic bacteria, which function is still uncertain, seem to promote growth
(Fteich at al. 2012; Ndlouv et al. 2013; De Meyer et al. 2015). Thus, biological fixation of nitrogen is
one of the most important functional traits of this group of woody legumes, as is the ability to nodulate
profusely (Rascher et al. 2011b, 2012).
1.2 Stable isotopes
Isotopic analysis is a powerful tool in understanding the original source of nitrogen in the plant,
and to what extent fixation is an important contribution to the nitrogen pool in plant cells. Stable
isotopes are tracers of ecological processes, resulting from the interaction between plants and
environment. It’s an empirical tool to better comprehend how plants are conditioned, and how several
processes are mediated by biotic and abiotic factors. For instance, determination of N2 source and
contribution of nitrogen fixation in several plant tissues can be achieved through δ15
N index analysis.
Atmospheric nitrogen δ15
N is considered the standard in terms of mass spectrometry, with a value of
0‰. Since soil 15
N content is higher than atmospheric content, when comparing plant tissue samples
with atmospheric N2, lower, near zero or negative, values are indicative of nitrogen fixation
(Rodríguez-Echeverría et al. 2007; Dawson et al. 2002).
Moreover, 13
C signature is another useful tracer of ecological processes. The analysis of δ13
C is
a valuable indicative of parameters such as water use efficiency, and also of carbon distribution to
different plant organs, being also instrumental in its quantification (Dawson et al. 2002).
1.3 SPAD
Another indicator of plant health and physiological status are photosynthetic pigments content,
which are affected by both biotic and abiotic factors, commonly used in plant ecological studies
(Udling et al. 2007; Ling et al. 2011). However, determination of photosynthetic pigments content is a
time consuming and laborious process, involving the destruction of plant material. An alternative

4
method is the use of SPAD (soil plant analysis development) meter. This portable reader determines
relative leaf pigment concentrations through measurements performed using two wavelengths, 650 nm
and 940 nm, respectively in the red and infrared regions of the electromagnetic spectrum. However,
these measurements are species specific and so to convert relative readings to absolute pigment
concentrations, there is the need to establish a calibration curve, significantly representing this
correlation (Ling et al. 2011). This method has been successfully established for other species, such as
Arabidopsis thaliana (Ling et al. 2011). A calibration curve was also determined for birch, wheat and
potato (Uddling et al. 2007).
The process of biological nitrogen fixation and the impact that Acacia spp. have on the
habitats it invades, specially concerning the soil and the above and belowground communities is well
documented (Souza-Alonzo et al. 2014; Marchante et al. 2008; Hellman et al. 2011). A. longifolia
alters soil properties, namely pH and nitrogen and carbon pools. Furthermore, this species
progressively disrupts nutrient dynamics, water cycle and soil microbial communities (idem).
However, not much is known about how the characteristics of the soil itself, as well as other
abiotic factors, might affect plant development and its influence on the process underlying the species
invasive ability.
1.4 Aims
Considering this, our study intended (1) to access how abiotic factors modulate A. longifolia
development, using seedlings grown in three different types of soil – forest, agricultural and dune, and
submitted to different conditions of irrigation and nutrition. We set out to evaluate the effect of these
factors on overall plant development, and (2) to correlate also plant development with the plant
capacity to nodulate. Furthermore, we propose (3) to better understand the symbiosis between
nitrogen-fixing microorganisms, such as Rhizobium and others, and A. longifolia, not only in terms of
bacterial diversity, but also how the factors previously mentioned might affect the establishment and
growth of nodules. In this study, we also intent (4) to find the correlation between SPAD readings and
photosynthetic pigments content, through the determination of the calibration equation.

5
2. Materials and Methods
2.1 Seed collection and germination
Matured pods of Acacia longifolia were collected in Vila Nova de Milfontes (Odemira,
Portugal), from trees growing in agricultural, forest and dune soil, in July 2017.
After collection, the seeds were manually removed from the pods and stored at room
temperature until germination. The seeds were surface sterilized with pure commercial bleach
(containing sodium hypochlorite) for 5 min, rinsed with distilled water and subjected to a water bath,
at 100ºC, for 1 min. Seeds were then placed in Petri dishes and incubated for 48h in darkness followed
by a 16h light photoperiod for two weeks, before being transferred to the greenhouse.
2.2 Soil collection and analysis
Soil samples from agricultural, forest and dune soils were collected in the vicinity of the
acacias, in September of 2017. The samples were sieved with a 40mm sieve, manually homogenized
and sent for analysis for texture, pH, organic matter, nitrate-N, ammonium-N, potassium, sodium,
calcium, magnesium and phosphorus at Laboratório de Análises de Solos e Plantas,
UTAD – Universidade de Trás-os-Montes e Alto Douro. Analyses were performed in triplicate. The
obtained results are summarized in the table 3.1.
2.3 Experimental set-up
After germination, the growing seedlings were individually transplanted to plastic dark pots
containing one of the three soils (forest, agricultural and dune) and transferred to the greenhouse,
where they were maintained under natural photoperiod. Temperature was not controlled, but the
ventilation system assured it was never above 25°C.
Following a two weeks acclimation, where all plants in the 3 types of soil were maintained at
optimal hydric conditions, the length of the plants was measured and the experimental period was
initiated. For each soil type (forest, agricultural and dune), four treatments were applied – hydric
comfort vs hydric stress, in combination with presence vs absence of nutritive solution (Fig. 2.1). In
the experiment, each treatment had 10 replicates, in a total of 40 plants in each type of soil, in a
randomized design.

6
Figure 2.1: Experimental Design. All treatments were applied to the three types of soil, each with ten replicates.
The hydric comfort is related to the amount of water added, which was determined according
to field capacity. The plants in a water comfort regime were maintained at 70% field capacity,
corresponding to 35 mL of tap water (or nutrient solution, depending on the treatment applied). Hydric
stress was applied by reducing the water to 30% of the field capacity, corresponding to 15 mL.
Regardless of the treatment all plants were watered twice a week. Nutrient solution composition when
added was based on the Hoagland Solution (in Appendix I, Table 6.1).
For easier reading and understanding, the treatments will be referred as described in Table 2.1.
Table 2.1: Treatment description and abbreviations applied in all three soils. W+ represents hydric comfort; W-, hydric
stress; N+, presence of nutrient solution and N-, absence of nutrient solution.
Treatment Abbreviation Treatment Composition
W+N+
Water at 70% field
capacity/Presence of nutrient
solution
35 mL of nutrient solution
W+N- Water at 70% field capacity
/Absence of nutrient solution 35 mL of water
W-N+ Water at 30% field capacity
/Presence of nutrient solution 15 mL of nutrient solution
W-N- Water at 30% field capacity
/Absence of nutrient solution 15 mL of water
7
The plants were grown in the greenhouse following this experimental set-up for 20 weeks,
from November 2017 to April 2018. After this period, the trial was evaluated.
2.4 Data Collection
2.4.1 Physiological performance evaluation
Following the 20-weeks growth period, eight out of the ten replicate plants, of each treatment,
were removed from the pots.
In each individual plant a set of parameters was measured as depicted in Fig. 2.2 and Fig. 2.5:
(1) shoot and root length; (2) number and fresh weigh of root nodules, phyllodes and roots; (3) total
leaf area and (4) relative chlorophyll levels, for two leaf regions, I and II, in one phyllode per plant, as
depicted in Fig.2.2.
For (3), a LI-3100C Area Meter was used, while (4) used a hand-held chlorophyll meter
SPAD-502. Phyllodes, roots and nodule samples were collected, and oven dried at 120ºC for at least
48h for dry weight measurement.
Based on these measurements, plant growth; root/shoot ratio and water content of roots and
phyllodes was calculated with the following equations, respectively; (1) Shoot Increment = Final
Length – Initial Length; (2) Root/Shoot Length Ratio = Root Length/Final Shoot Length; (3)
Root/Shoot Fresh Weight Ratio = Root Fresh Weight/Shoot Fresh Weight; (4) Phyllode Hydric
Content = Phyllode Fresh Weight – Phyllode Dry Weight and (5) Root Hydric Content = Root Fresh
Weight – Root Dry Weight.
Figure 2.2: Acacia longifolia pyllode regions (I- Phyllode base; II- Phyllode tip) in which relative chlorophyll was measured
with SPAD-502 and sections were removed determination of photosynthetic pigments content.
2.4.2 Photosynthetic pigment determination
Additionally, photosynthetic pigments content was evaluated. Three 0.5cm diameter discs
were removed from the same two regions (I and II) from a phyllode in five of the eight replicates, with
the aid of a manual punch. The discs were then suspended in 2mL of methanol and stored at 4°C in the
dark, for 48h. After this, absorbances were measured at 470nm, 652.4nm and 665.2nm with Thermo
Heλios β spectrophotometer (Thermo Electron Coorporation). Chlorophyll a, b, total of chlorophylls
and total of carotenoids concentrations (in μg/mL) were calculated according to the equations below
(Fig. 2.3).

8
Figure 2.3:Equations for the determinations of the concentrations of chlorophyll a (Ca), chlorophyll b (Cb), total chlorophylls
(Ca+b) and total carotenoids (Cχ+c) (Lichtenthater, 1987).
Correlation between values obtained through SPAD and chlorophyll determination was
calculated for A. longifolia phyllodes.
2.4.3 Carbon and Nitrogen Isotopic Analysis
Isotopic studies were performed, using an average of two phyllodes and five nodules of three
plants selected of each soil and treatment. The samples were oven dried at 120ºC for 48h. Following
mechanical maceration with a ball mill (Retsch, Haan, Germany), 5mg of phyllodes and 1mg of
nodules of the resulting fine powder were weighed and encapsulated into tin capsules. The samples
were then sent for analysis for δ15
N, δ13
C, nitrogen (%N) and carbon (%C) content at LIE-SIIAF
(Stable Isotopes and Instrumental Analysis Facility, at Faculdade de Ciências, Universidade de
Lisboa).
2.5 Nodules and Bacteria
The nodules were collected from the roots for microbiological diversity analysis. Nodules
from the same treatment and soil were grouped and kept in a microtube with distilled water.
The first step of the analysis consisted in the disinfection of the nodules (Fig.2.4) to prevent
contamination from soil bacteria, ensuring that the isolated organisms were from the nodule (inside).
All the culture media used for bacterial isolation was previously sterilized by autoclaving at 121°C for
20 minutes, before pouring it to sterile Petri dishes.
To confirm that the nodule surface was in fact disinfected, prints of the nodules were made in
fresh plates of Yeast Mannitol medium (in Appendix I, Table 6.2), followed by incubation at 28 °C for
72 h. If no growth was observed, the nodules were macerated using a sterile mortar and pestle and
resuspended in 300µL NaCl 0.85%.

9
Figure 2.4: Nodule sterilization protocol, adapted from Hungria et al. (2016).
Of those, 250 µL were inoculated in YMA (Yeast Mannitol Agar) medium (in Appendix I,
Table 6.2) with 0.02 gL-1
of cycloheximide to avoid fungal contaminations. The Petri dishes were
incubated at 28 ° C, and growth was observed after 48 to 72 hours.
The resulting single colonies were restreaked three times to achieve purification. The colonies
were then observed macroscopically and with a magnifier to discern shape and overall appearance.
Microscopic observation, followed by Gram staining, allowed the characterization and differentiation
of the isolates according to type of bacteria and Gram staining, as well as the verification of colony
purity.
The Gram staining procedure followed consisted in (1) the smear of a culture scoop in a water
drop over a slide; (2) heat fixing; (3) addition of crystal violet for 1 min; (4) rinse with tap water; (5)
addition of iodine solution for 1 min; (6) rinse with tap water; (7) addition of alcohol for 20 sec; (8)
addition of safranin for 1 min; (9) rinse with tap water (Bartholomew et al. 1952).
The non-pure colonies were suspended in 100 ml of distilled water, pasteurized at 80ºC for 15
minutes and inoculated again, according to the previously stated method.
Lastly, biochemical analyses were performed for oxidase, KOH and catalase reactions, to
further characterize the isolates. For oxidase, an isolated colony was removed and smeared over
filtered paper soaked in 1% tetramethyl-p-phenylenediamine, over a slide, while for KOH test a
colony was removed with a loop and mixed with a drop of 3% KOH, over a slide. As for catalase test,
a loop of isolated colony was mixed with a drop of commercial hydrogen peroxide over a slide
(Madigan et al. 2017).
10
2.6 DNA Extraction and Fingerprinting
DNA extraction was carried out by the boiling method, following a protocol provided by
BioISI, as follows: one to three colonies were removed with a loop, suspended in 100 µL of TE buffer
with 0.1 µL of Tween 20 and incubated for 10 to 12 minutes in a dry bath at 100°C, until lysis had
occurred.
The amplification of the samples was performed according to the Rep-PCR (Repetitive
element sequence-based PCR) fingerprinting technique, to discriminate between different species of
microorganisms. Three different primers were tested - M13, PH and GTG5, in all samples obtained.
All amplification reactions were performed in a total volume of 25 µL - 18.3 µL of water, 2.5 µL of
10xInvitrogen buffer; 1.5 µL of 50mM MgCl2; 0.5 µL dNTP mix; 0.3 µL of primer; 0.2 µL of 5U/µL
Invitrogen Taq DNA polymerase and 2 µL bacterial lysate containing DNA. Each reaction included a
negative control with all components except DNA. The amplification was performed with the BioRad
100 thermocycler. The PCR cycle used consisted of an initial denaturation step of 5min at 95ºC,
followed by 40 cycles of 1min at 95ºC, 2min at 50ºC, 2min at 72ºC and a final extension of 5min at
72ºC.
The products of amplification were subsequently analysed using 1.2% agarose gel
electrophoresis at 90V for 3 hours, 0.5xTBE being used as the gel and running buffer. The gels were
then stained with ethidium bromide solution for 15 minutes and visualized through UV
transilluminator Alliance 4.7 (Uvitec, Cambridge).
2.7 Statistical Analysis
The data was analysed using IBM SPSS Statistics 25.0 (SPSS, Inc., Chicago, IL, United
States). Data normality and the homogeneity of variances were accessed. When the variables didn’t
fulfil the assumptions, the data set was considered to have a non-normal distribution. The relationship
between the response variables was accessed through Spearman correlation. For simplification, in
situations where variables were found with a correlation index of 0.7 or higher, one of the variables
was represented by the other and it was excluded from the analysis.
Lastly, the data were subjected to an analysis of variances. Kruskall-Wallis test and post-hoc
comparisons, with treatment combinations as factors, were conducted to determine their effect on the
response variables.
For the bacterial DNA fingerprinting, the images resulting from gel observation were analysed
with Bionumerics (Applied Maths NV) software to obtain the dendrograms with Pearsons’ coefficient.

11
Figure 2.5: Data collection. (a) Experimental set-up at the end of the 20-week experimental period; (b, c) Removal of plants
from the pots; (d) Measurement of chlorophyll relative content with SPAD-502; (e) Leaf Area Meter; (f) Removal of
phyllode discs for photosynthetic pigments content determination; (g) Measurement of plant components; (h) Removal of
root nodules; (i) Examples of root nodules.
a b c
d e f
g h i

12
3. Results
3.1 Soil Analysis
The soils were characterized by texture, pH, organic matter percentage, electric conductivity
and nutrient availability (Table 3.1). While all three soils had similar coarse texture, forest soil was
more acidic, with a pH=4.8, whereas agricultural and dune soils were more moderately acidic, with pH
values around 6. The highest organic matter content (2.16%) was obtained in forest soil, while
agricultural and dune soils showed a percentage of approximately 0.4 and 1 percent, respectively. In
contrast, forest soil presented the lowest electric conductivity, around 0,05dS m−1
, compared with dune
and agricultural soils, with values of 0.26 and 0.12 dS m−1
, respectively.
A pattern could be discerned among the soils regarding nitrate-N (64.27 mg element
kg-1
), potassium (141.31 mg element kg-1
), sodium (58.97 mg element kg-1
), calcium (782.95 mg
element kg-1
) and magnesium (385.7 mg element kg-1
) availability, where the highest values were
found in agricultural soil and decreased in dune and forest soil. However, ammonium-N and
phosphorus were exceptions to this pattern. The availability of N-NO4 was the lowest in agricultural
soil (0.33 mg element kg-1
), followed by forest and dune soils with similar nutrient content,
respectively, 1.57 and 1.27 mg element kg-1
, while the highest values of available phosphorus were
measured in agricultural soil (12.5 mg element kg-1
), while forest and dune soils had lower values,
0.72 and 0.22 mg element kg-1
, respectively.
Table 3.1: Soil characterization according to texture, pH in water, organic matter content, electric conductivity and nutrient
availability.
.

13
3.2 Overall assessment of treatment combinations on plant development
In what concerns data analysis, the conducted exploratory analysis of normality conducted,
considering as factors the treatments and as dependent variables the parameters measured following
the experimental period, concluded that the data did not have a normal distribution. Additionally,
Spearman's correlation found significance between number of phyllodes and leaf area; phyllode fresh
and dry weight; Ca+b content and Ca and Cb content both from the base and from the tip of the phyllode.
Therefore the parameters number of phyllodes, phyllode fresh weight, Ca+b content from the base and
tip of the phyllodes became representatives of the variables with which they were correlated, when
statistical analysis was concerned.
3.2.1 Increment, roots and root/shoot ratio
When considering all the treatments (Fig. 3.1), analysis showed that plants grown in the
combination forest soil (F), water at 70% field capacity (W+) and nutrient solution (N+), (FW+N+)
had on average a higher increment in shoot size, of 57 cm after 20 weeks, although, similar growth
values were registered in treatments in conjunction with agricultural soil. Statistically significant
differences were found between FW+N+ and the treatment combinations dune soil (D), water at 70%
field capacity (W+) and absence of nutrient solution (N-) (DW+N-), in which the lowest mean
increment was registered, with 32.34 cm. (Fig. 3.2 and Appendix II).
Figure 3.1: Acacia longifolia growth at the end of the experimental period of 20 weeks, before removal from pot.

14
Figure 3.2: Variance analysis box-plot of shoot increment (cm) in plants of A. longifolia, measured after a growth period of
20 weeks with different treatments (n=96). F, forest soil; A, agricultural soil; D, dune soil; W+N+, water at 70% field
capacity/presence of nutrient solution; W+N-, water at 70% field capacity/absence of nutrient solution; W-N+, water at 30%
field capacity/presence of nutrient solution; W-N-, water at 30% field capacity/absence of nutrient solution.
In what concerns root length (Fig. 3.3), similar results were found. Plants grown in the
treatment combination FW+N+ presented longer roots, while lower values were registered in the
combination DW+N- (Fig. 3.4). In spite the of the Kruskall-Wallis test finding significance regarding
root length, post-hoc comparisons indicated that there were no significant differences between the
treatments (in Appendix II).
Figure 3.3: Root length diversity found in A. longifolia plants, after a growth period of 20 weeks. Roots from A. longifolia
grown in agricultural soil at 30% field capacity, without nutrient solution (Left); Roots from A. longifolia grown in
agricultural soil at 70% field capacity, without nutrient solution (Right).

15
Figure 3.4: Variance analysis box-plot of root length (cm) in plants of A. longifolia, measured after a growth period of 20
weeks in plants of A. longifolia, measured after a growth period of 20 weeks with different treatments (n=96). F, forest soil;
A, agricultural soil; D, dune soil; W+N+, water at 70% field capacity/presence of nutrient solution; W+N-, water at 70% field
capacity/absence of nutrient solution; W-N+, water at 30% field capacity/presence of nutrient solution; W-N-, water at 30%
field capacity/absence of nutrient solution.
Furthermore, the root/shoot length ratio had similar values with little variance and no
statistical significance (Fig. 3.5 and Appendix II), while root/shoot fresh weight ratio registered
highest values in DW+N-, with an average of 2.09, with statistically significant differences being
found between DW+N- and DW-N+ and FW+N+ (Fig. 3.6 and Appendix II). The roots hydric
content, had lower values associated with dune soil, particularly the treatment combination DW+N- ,
with mean values 0.34. However statistical significance was only found for hydric content, with
differences being found between the treatment combinations DW+N- and AW-N-, AW-N+ and
AW+N+ (Fig 3.7 and Appendix II).
Figure 3.5: Average distribution of root/shoot length ratio (cm) (mean ± 2SE) in plants of A. longifolia, measured after a
growth period of 20 weeks, according to treatment combination (n= 96). F, forest soil; A, agricultural soil; D, dune soil;
W+N+, water at 70% field capacity/presence of nutrient solution; W+N-, water at 70% field capacity/absence of nutrient
solution; W-N+, water at 30% field capacity/presence of nutrient solution; W-N-, water at 30% field capacity/absence of
nutrient solution.

16
Figure 3.6: Variance analysis box -plot of root/shoot fresh weight ratio in plants of A. longifolia, measured after a growth
period of 20 weeks (n= 96). F, forest soil; A, agricultural soil; D, dune soil; W+N+, water at 70% field capacity/presence of
nutrient solution; W+N-, water at 70% field capacity/absence of nutrient solution; W-N+, water at 30% field
capacity/presence of nutrient solution; W-N-, water at 30% field capacity/absence of nutrient solution. The symbols represent
outliers.
Figure 3.7: Variance analysis box-plot of root hydric content in plants of A. longifolia, measured after a growth period of 20
weeks (n= 77). F, forest soil; A, agricultural soil; D, dune soil; W+N+, water at 70% field capacity/presence of nutrient
solution; W+N-, water at 70% field capacity/absence of nutrient solution; W-N+, water at 30% field capacity/presence of
nutrient solution; W-N-, water at 30% field capacity/absence of nutrient solution. The symbols represent outliers.
3.2.2 Phyllodes
Plants grown in forest soil in conjugation with water at 70% field capacity and nutrient
solution (FW+N+) had a higher number of phyllodes (Fig. 3.8), approximately 6 per plant, contrasting
with the treatment combination DW+N- which had fewer phyllodes, approximately 1 per plant.
Statistically significant differences were found between the combination dune soil (D), water at 70%
field capacity (W+) and absence of nutrient solution (N-) (DW+N-) and the treatments AW+N+,
FW+N+ and DW-N+ ; and the combination forest soil (F), water at 70% field capacity (W+) and
presence of nutrient solution (N+) (FW+N+) and the treatments DW-N- and FW+N- (Fig. 3.9 and
Appendix II).

17
Figure 3. 8: Examples of phyllode diversity (a,b,c,d) found in plants. (a) A. longifolia shoot with leaves (small arrow) and
phyllodes (large arrow).
Figure 3.9: Variance analysis box-plot of number of phyllodes in plants of A. longifolia, measured after a growth period of
20 weeks (n= 96). F, forest soil; A, agricultural soil; D, dune soil; W+N+, water at 70% field capacity/presence of nutrient
solution; W+N-, water at 70% field capacity/absence of nutrient solution; W-N+, water at 30% field capacity/presence of
nutrient solution; W-N-, water at 30% field capacity/absence of nutrient solution.
Higher phyllode hydric content was associated with acacias grown with the combination
FW-N-, on average 2.8. Statistical analysis revealed significant differences between the combination
DW+N- , in which the lowest hydric content was registered, on average 0.20, and the treatments AW-
N+, AW-N-, AW+N+, DW-N+ and FW+N+; as well as between the combinations DW-N- and
FW+N+ and AW+N+ (Fig. 3.10 and Appendix II).
a b
d c

18
Figure 3.10: Variance analysis box-plot of phyllodes hydric content A. longifolia, measured after a growth period of 20
weeks (n= 96). F, forest soil; A, agricultural soil; D, dune soil; W+N+, water at 70% field capacity/presence of nutrient
solution; W+N-, water at 70% field capacity/absence of nutrient solution; W-N+, water at 30% field capacity/presence of
nutrient solution; W-N-, water at 30% field capacity/absence of nutrient solution. Symbols represent outliers.
3.2.3 Nodules
In what regards nodules (Fig. 3.11), a higher number of nodules was registered for the
combination dune soil (D), water at 30% field capacity (W-) and presence of nutrient solution (N+)
(DW-N+), on average 61 nodules per plant, while the lowest number was registered in plants grown in
agricultural soil in association with the combination W+N+, on average 11 nodules per plant.
Furthermore, the combination agricultural soil (A), water at 70% field capacity (W+) and
absence of nutrient solution (N-) (AW+N-) registered a higher nodule weight/number ratio with an
average of 0.028 (Fig. 3.12). In spite of the Kruskall-Wallis test finding significance in the variables
regarding nodule weight/number ratio, post-hoc comparisons indicated that there were no significant
differences between the treatments (in Appendix II).

19
Figure 3.11: Nodules (arrows) found in A. longifolia grown in forest (a), agricultural (b) and dune (c) soils showing the
variation in size. It is evident that nodules developed in plants in agricultural soils were larger, while present in lower
number.
Figure 3.12: Variance analysis box-plot of nodule weight/number ratio in plants A. longifolia, measured after a growth
period of 20 weeks (n= 96). F, forest soil; A, agricultural soil; D, dune soil; W+N+, water at 70% field capacity/presence of
nutrient solution; W+N-, water at 70% field capacity/absence of nutrient solution; W-N+, water at 30% field
capacity/presence of nutrient solution; W-N-, water at 30% field capacity/absence of nutrient solution. Symbols represent
outliers.
Regarding number of nodules, pairwise comparisons showed differences between the
treatment combinations FW+N+ and Agricultural soil (A), watering at 70% field capacity, nutrient
solution (AW+N+) and agricultural soil, watering at 70% field capacity, absence of nutrients
(AW+N-) (Fig. 3.13 and Appendix II).
a b
c

20
Figure 3.13: Variance analysis box-plot of number of nodules in roots of A. longifolia, measured after a growth period of 20
weeks (n= 96). F, forest soil; A, agricultural soil; D, dune soil; W+N+, water at 70% field capacity/presence of nutrient
solution; W+N-, water at 70% field capacity/absence of nutrient solution; W-N+, water at 30% field capacity/presence of
nutrient solution; W-N-, water at 30% field capacity/absence of nutrient solution. Symbols represent outliers.
It was in the agricultural soil, that higher mean nodule weight was registered, in the treatment
combination AW+N-, with values of 0.28g. Though, the variable was not statistically significant
(Fig. 3.14 and Appendix II).
Figure 3.14: Average distribution of nodule weight (mean ± 2SE) of A. longifolia, measured after a growth period of 20
weeks, according to treatment combination (n= 96). F, forest soil; A, agricultural soil; D, dune soil; W+N+, water at 70%
field capacity/presence of nutrient solution; W+N-, water at 70% field capacity/absence of nutrient solution; W-N+, water at
30% field capacity/presence of nutrient solution; W-N-, water at 30% field capacity/absence of nutrient solution.
3.2.4 Photosynthetic Pigments Content Analysis
The photosynthetic component was assessed through photosynthetic pigment concentration
analysis. The majority of parameters had higher values for DW-N+, namely chlorophyll a (Ca) both at
phyllode tip and base, chlorophyll b (Cb) at phyllode base (Appendix III), total chlorophyll (Ca+b) both
at phyllode base and tip (Fig 3.15; 3.16) and Carotenoids at phyllode base, with mean values of 32.9,
45.3, 16.6, 43.6, 62.0 and 10.0 mg cm-2
respectively.
21
Figure 3.15: Average distribution of Ca+b content (phyllode tip) (mean ± 2SE) in plants of A. longifolia, measured after a
growth period of 20 weeks with different treatments (n=55). F, forest soil; A, agricultural soil; D, dune soil; W+N+, water at
70% field capacity/presence of nutrient solution; W+N-, water at 70% field capacity/absence of nutrient solution; W-N+,
water at 30% field capacity/presence of nutrient solution; W-N-, water at 30% field capacity/absence of nutrient solution.
Figure 3.16: Average distribution of Ca+b content (phyllode tip) (mean ± 2SE) of A. longifolia, according to treatment
combination (n=60). F, forest soil; A, agricultural soil; D, dune soil; W+N+, water at 70% field capacity/presence of nutrient
solution; W+N-, water at 70% field capacity/absence of nutrient solution; W-N+, water at 30% field capacity/presence of
nutrient solution; W-N-, water at 30% field capacity/absence of nutrient solution.
However, statistically significant differences were only found for carotenoid content,
particularly between AW+N+ and FW+N- at phyllode tip (Fig.3.17 and Appendix II) and between
AW-N- and DW-N+ and FW+N- at phyllode base (Fig. 3.18 and Appendix II). It is still relevant to
mention that carotenoid content at phyllode tip for DW+N- had no standard error associated since for
this parameter it was only possible to analyse one individual associated with this treatment (see 3.2.2).

22
Figure 3.17: Variance analysis box-plot of carotenoid content (phyllode tip) in A. longifolia, measured after a growth period
of 20 weeks, according to treatment combination (n=55). F, forest soil; A, agricultural soil; D, dune soil; W+N+, water at
70% field capacity/presence of nutrient solution; W+N-, water at 70% field capacity/absence of nutrient solution; W-N+,
water at 30% field capacity/presence of nutrient solution; W-N-, water at 30% field capacity/absence of nutrient solution.
Symbols represent outliers. Treatment DW+N- has no standard error associated, see text for explanation.
Figure 3.18: Variance analysis box-plot of carotenoid content (phyllode base) in A. longifolia, measured after a growth
period of 20 weeks, according to treatment combination (n=60). F, forest soil; A, agricultural soil; D, dune soil; W+N+, water
at 70% field capacity/presence of nutrient solution; W+N-, water at 70% field capacity/absence of nutrient solution; W-N+,
water at 30% field capacity/presence of nutrient solution; W-N-, water at 30% field capacity/absence of nutrient solution.
Symbols represent outliers.

23
3.2.5 Isotopic Analysis
The acacias grown with the treatment combination DW-N- registered a lower mean phyllode
δ15
N content with values of -1.5‰, still it is important to note that in all three soils δ15
N content was
lower whenever there was no addition of nutrient solution. Phyllode δ13
C content ranged between -32
and -31‰, with lowest mean values being registered in the treatment DW+N-, with average of -32.6
(Table 3.2). In spite the of the Kruskall-Wallis test finding significance regarding phyllode δ15
N
content, post-hoc comparisons indicated that there were no significant differences between the
treatments (Fig. 3.19 and Appendix II). The phyllode nitrogen (N) and carbon (C) content was on
average higher with the treatment combination DW+N-, with values of 3.3% and 44.6%, despite all
treatment combinations having similar N content, of about 3%. Additionally, C/N ratio registered
higher values with the treatment combination FW-N+, on average 14.4 (Table 3.2).
Table 3.2: Phyllode δ15N, δ13C, nitrogen (N) and carbon (C) content (mean ± SE) according to treatment combinations. F,
forest soil; A, agricultural soil; D, dune soil; W+N+, water at 70% field capacity/presence of nutrient solution; W+N-, water
at 70% field capacity/absence of nutrient solution; W-N+, water at 30% field capacity/presence of nutrient solution; W-N-,
water at 30% field capacity/absence of nutrient solution.
Treatments Phyllodes
δ15
N δ13
C N% C% CN Ratio
FW+N+ Mean 4.03 -31.90 3.54 43.85 12.66
SE 4.32 0.17 0.65 0.66 2.35
FW+N- Mean 1.03 -32.10 3.68 43.84 12.37
SE 2.42 0.53 0.82 0.29 3.11
FW-N+ Mean 7.70 -31.60 3.02 43.64 14.47
SE 4.70 0.72 0.11 1.02 0.77
FW-N- Mean 2.90 -31.93 3.29 44.07 13.42
SE 4.77 0.38 0.15 0.71 0.55
AW+N+ Mean 8.13 -32.47 3.61 44.03 12.27
SE 0.46 0.93 0.32 0.13 1.11
AW+N- Mean 2.90 -32.33 3.41 44.08 13.89
SE 4.59 0.32 1.07 0.03 4.72
AW-N+ Mean 8.77 -31.73 3.38 43.95 13.12
SE 2.60 1.36 0.37 1.38 1.80
AW-N- Mean 4.30 -31.27 3.27 44.58 13.84
SE 3.21 1.16 0.50 0.08 2.25
DW+N+ Mean 5.17 -31.67 3.33 43.53 13.23
SE 2.48 0.97 0.44 0.36 1.96
DW+N- Mean -0.13 -32.63 3.34 44.62 13.49
SE 0.59 0.49 0.40 0.79 1.72
DW-N+ Mean 1.23 -31.83 3.76 43.63 11.60
SE 0.80 0.60 0.10 0.45 0.36
DW-N- Mean -1.50 -31.93 3.66 43.84 12.29
SE 0.66 1.01 0.71 0.34 2.38

24
Figure 3.19: Variance analysis box-plot of δ15N (phyllode) in A. longifolia, measured after a growth period of 20 weeks,
according to treatment combination (n= 36). F, forest soil; A, agricultural soil; D, dune soil; W+N+, water at 70% field
capacity/presence of nutrient solution; W+N-, water at 70% field capacity/absence of nutrient solution; W-N+, water at 30%
field capacity/presence of nutrient solution; W-N-, water at 30% field capacity/absence of nutrient solution.
When considering the same parameters in root nodules, δ15
N, δ13
C, C% and C/N ratio had
lower mean values with the treatment combination FW-N-, with an average of 5.4‰,
-53.2‰, 28.2% and 5.9. Whereas nodule N content had the lowest mean values with AW-N+, with
3.7% and, the highest with FW+N+, with 5.6% (Table 3.3). Though, none of these parameters was
statistically significant (Appendix II).
Table 3.3: Nodules δ15N, δ13C, nitrogen (N) and carbon (C) content (mean ± SE) according to treatment combinations. F,
forest soil; A, agricultural soil; D, dune soil; W+N+, water at 70% field capacity/presence of nutrient solution; W+N-, water
at 70% field capacity/absence of nutrient solution; W-N+, water at 30% field capacity/presence of nutrient solution; W-N-,
water at 30% field capacity/absence of nutrient solution.
Treatments Nodules
δ15
N δ13
C N% C% CN Ratio
FW+N+ Mean 7.80 -30.93 5.68 40.04 7.13
SE 1.44 0.35 0.90 1.87 0.82
FW+N- Mean 7.20 -30.47 5.86 40.93 7.01
SE 2.91 1.01 0.49 1.21 0.57
FW-N+ Mean 7.97 -30.33 4.97 35.03 7.03
SE 0.58 0.93 0.43 4.39 0.29
FW-N- Mean 5.43 -33.27 4.71 28.26 5.59
SE 5.42 4.97 0.88 19.26 3.47
AW+N+ Mean 9.67 -30.93 4.21 33.00 7.99
SE 0.60 0.55 1.11 5.65 0.91
AW+N- Mean 7.73 -30.60 4.84 38.73 8.12
SE 1.82 0.30 0.79 1.00 1.07
AW-N+ Mean 10.33 -29.67 3.79 38.42 10.31
SE 1.46 0.68 0.67 0.54 1.54
AW-N- Mean 6.60 -29.60 5.21 38.11 7.34
SE 1.61 1.15 0.28 3.02 0.93

25
DW+N+ Mean 6.87 -30.67 3.64 30.87 8.52
SE 2.71 1.17 0.96 7.87 0.65
DW+N- Mean 6.43 -31.77 4.85 37.38 7.80
SE 1.01 0.42 1.03 5.42 0.74
DW-N+ Mean 7.37 -30.93 5.00 38.60 7.82
SE 0.45 1.15 0.88 2.85 0.85
DW-N- Mean 5.67 -31.03 4.78 38.22 8.14
SE 2.67 0.70 1.18 5.88 0.92

26
3.3 Photosynthetic pigments analysis
Based on the measurements of photosynthetic pigments concentration and SPAD-502
readings, linear regressions were calculated with the purpose of establishing a calibration model for A.
longifolia that correlates SPAD data and pigment concentrations.
The resulting linear regressions models (Figure 3.20, Figure 3.21) displayed a very low
correlation between pigment concentrations and their corresponding SPAD readings. The predictive
capacity of the calibration equations was evaluated by the adjustment coefficient (R2) and in, both
phyllode base and tip, as in all pigments evaluated – Ca; Cb; Ca+b and Carotenoids, R2
value was never
above 0.3 (Table 3.4).
Table 3.4: Equations and R2 values of calibration curves for SPAD-502 readings and photosynthetic pigments content in
phyllode base and tip.
Pigments Equation R2
Phyllode Base
Ca y=0.5935x+6.7257 0.3057
Cb y=0.3059x-2.069 0.3615
Ca+b y=0.8894x+4.6568 0.3381
Carotenoids y=0.1152x+2.2352 0.2197
Phyllode Tip
Ca y=0.2857x+15.901 0.2617
Cb y=0.1368x+3.6514 0.3780
Ca+b y=0.42255x+19.552 0.3075
Carotenoids y=0.052x+4.9031 0.1526
However, the adjustment coefficient values aren’t an indicative of the models adequacy,
providing solely an estimate of the strength of the correlation. Thus, to evaluate the statistical
significance of the models overall F tests were performed (in Appendix IV). All the models, with the
exception of the one referring to Ca+b (phyllode base), are statistically significant since F critical values
were lower than the F values. Therefore, the majority equations obtained allow to predict pigment
content based on SPAD-502 measurements. However, for the method to be confirmed further samples
are required.
a b

27
Figure 3. 20: Calibration models relating SPAD-502 readings and (a) chlorophyll a (b) chlorophyll b (c) total chlorophyll
and (d) carotenoids content, in phyllode base.
Figure 3.21: Calibration models relating SPAD-502 readings and (a) chlorophyll a (b) chlorophyll b (c) total chlorophyll and
(d) carotenoids content, in phyllode tip.
a b
c d
c d

28
3.4 Bacteria Analysis
A total of 150 colonies were initially obtained after maceration of root nodules, removed from
plants grown under different soils: 40 colonies from forest soil, 61 from agricultural soil and 49 from
dune soil. However, some bacteria were lost in the purification process, due to the absence of growth
after being restreaked. Thus, after purification, a decrease of isolates occurred. A total of 35 isolates
were obtained from forest soil nodules, 45 from agricultural soil nodules and 31 from dune soil
nodules (Table 3.5). Further analysis showed no evident relationship between the different treatments
and the microbial community diversity.
Table 3.5: Number of bacterial isolates found in root nodules in plants of each soil and treatment, before and after
purification process.
Forest Agricultural Dune
W+
N+
W+
N-
W-
N+
W-
N-
W+
N+
W+
N-
W-
N+
W-
N- W+N+
W+
N-
W-
N+
W-
N-
Before
Purification 22 13 3 2 11 8 26 16 13 8 10 18
After
Purification 18 12 3 2 10 6 24 5 1 7 8 15
The analysis of the bacterial community present in the nodules was carried out considering the
applied treatments, as well as soil type. Still, upon analysis, there was no evident relationship between
the different treatments and the microbial community diversity.
As for macroscopic observations, while all colonies observed presented white to yellow tones,
in terms of morphology, most isolates could be divided into three major types of colony morphology
1) bands with reticulated edges; 2) viscose bands with smooth edges; 3) small and sparse dots, with
slight variations within each group. Microscopic observations determined that most of the isolates
consisted of bacillus, almost all endospore forming, except for five isolates from forest soil nodules,
which were classified as coccus. Additionally, the Gram staining and biochemical analysis, oxidase,
KOH and catalase, tests results were not conclusive.
Regarding molecular analysis, of the three primers initially tested, M13, PH and GTG5, good
amplification was only obtained with PH and GTG5. The dendrogram obtained (Fig.3.21) combines
the PCR fingerprinting results from both PH and GTG5. Cluster analysis indicated that bacterial
isolates grouped in four main clusters and all were distinct, with varying degrees of similarity. This
might be because Pearson coefficient considers not only the pattern but also the intensity of the bands
of each profile, thus seemingly identical profiles were deemed different by the software. Additionally,
the bacterial strains did not cluster according to soil or treatment. Instead, it displayed a heterogeneous
distribution, thus indicating that the microbial community might not be conditioned by soil type or
treatment.
At last, in order to further understand the bacterial community obtained from root nodules,
Shannon-Wiener and Simpson indexes were calculated. Considering a cut-off of 50% and a total of 51
groups and 111 strains, Simpson index (D) of 0.9768 was obtained. As for Shannon-Winer index a
score of H’=0.1399.

29
Figure 3.22: Observation of bacteria. (a, b, c) Macroscopic observation of isolated colonies; (a) example of small and sparse
dots morphology; (b) example of viscous band with smooth edges morphology; (c) example of band with reticulated edges
morphology; (d, e, f) Magnified view of previous colonies; (d) small and sparse dots morphology; (e) viscous band with
smooth edges morphology;; (f) band with reticulated edges morphology; (g, h, i) Microscopic observation with 1000x
magnification; (g) endospore forming bacillus; (h) non-endospore forming bacillus; (i) coccus.
a
f e d
c b
i h g

30
GTG5+PH
10
0
95
90
85
80
75
70
65
60
55
50
45
40
35
30
25
20
15
GTG5+PHPH GTG5
.
.
.
.
.
.
.
.
.
.
.
.
.
.
.
.
.
.
.
.
.
.
.
.
.
.
.
.
.
.
.
.
.
.
.
.
.
.
.
.
.
.
.
.
.
.
.
.
.
.
.
.
.
.
.
.
.
.
.
.
.
.
.
.
.
.
.
.
.
.
.
.
.
.
.
.
.
.
.
.
.
.
.
.
.
.
.
.
.
.
.
.
.
.
.
.
.
.
.
.
.
.
.
.
.
.
.
.
.
.
.
.
DSÑ6
DSÑ3
ASN17
ASN21
FSN4
ACÑ4
ACÑ5
ACÑ3
ACN8
ASN25
DSÑ11
ASN8
DCÑ3
ASN26
ASN7
ASN1
ASN18
ASN22
FCN17
ASN2
ACN5
FCÑ5
FCÑ12
FCN18
DSÑ12
FCÑ6
FCÑ8
FCN15
DSÑ14
DCÑ2
FCN2
ASN9
DSN7
ASÑ5
ASN24
ASN19
DSÑ16
ACN11
ACN10
ACÑ1
DCN1
FCN8
FCN9
ASN20
FCN21
ACN3
ASN13
ACN2
ASN16
ASN12
ASN14
DSÑ5
ACÑ6
DSÑ10
FSÑ1
DSÑ1
DSÑ2
FCÑ11
ASÑ3
ASÑ1
ASÑ2
ASÑ4
ACN7
ACN9
ACÑ2
DSN4
FCN19
DSÑ7
FCN11
FSN3
FCN14
FCN22
DSN1
FCÑ13
FCN13
FCN5
FCN7
FCN6
FCN3
FCN16
ASN10
ASN15
ASN5
ASN11
ASN4
ASN6
FCÑ1
FCÑ4
FCN12
DCÑ7
DCÑ4
FSÑ2
ACN1
ACN4
ACN6
DSN8
DSN9
FCÑ7
DSN10
DCÑ1
FSN5
DCÑ5
DSÑ15
DSÑ8
DSÑ4
DSN2
DSÑ9
FCÑ10
DCÑ6
DSN3
FCÑ3
FCÑ9
D
D
A
A
F
A
A
A
A
A
D
A
D
A
A
A
A
A
F
A
A
F
F
F
D
F
F
F
D
D
F
A
D
A
A
A
D
A
A
A
D
F
F
A
F
A
A
A
A
A
A
D
A
D
F
D
D
F
A
A
A
A
A
A
A
D
F
D
F
F
F
F
D
F
F
F
F
F
F
F
A
A
A
A
A
A
F
F
F
D
D
F
A
A
A
D
D
F
D
D
F
D
D
D
D
D
D
F
D
D
F
F
Sim
Sim
Sim
Sim
Sim
Sim
Não
Não
Sim
Sim
Sim
Sim
Não
Sim
Sim
Sim
Sim
Sim
Não
Sim
Não
Não
Não
Não
Sim
Não
Não
Não
Sim
Sim
Não
Sim
Sim
Sim
Sim
Sim
Sim
Não
Não
Não
Sim
Não
Não
Sim
Sim
Não
Não
Não
Não
Sim
Sim
Sim
Não
Sim
Não
Não
Sim
Não
Sim
Sim
Sim
Sim
Não
Não
Não
Sim
Não
Não
Não
Sim
Não
Não
Não
Não
Não
Não
Não
Não
Não
Não
Sim
Sim
Sim
Sim
Não
Sim
Não
Não
Não
Não
Não
Sim
Sim
Não
Não
Sim
Sim
Não
Sim
Não
Sim
Sim
Sim
Sim
Não
Sim
Sim
Não
Não
Sim
Não
Não
Não
Não
Sim
Sim
Sim
Não
Não
Sim
Sim
Sim
Não
Não
Não
Sim
Sim
Sim
Sim
Não
Sim
Sim
Sim
Não
Não
Não
Não
Sim
Não
Sim
Não
Não
Sim
Sim
Sim
Sim
Sim
Sim
Não
Sim
Sim
Não
Não
Sim
Sim
Sim
Sim
Sim
Não
Sim
Sim
Sim
Sim
Não
Não
Não
Sim
Não
Não
Não
Sim
Não
Não
Sim
Sim
Sim
Não
Sim
Sim
Sim
Sim
Sim
Sim
Sim
Não
Sim
Sim
Sim
Sim
Sim
Sim
Sim
Sim
Sim
Sim
Sim
Não
Sim
Não
Não
Sim
Não
Não
Não
Sim
Sim
Sim
Sim
Sim
Não
Sim
Não
Sim
Não
Não
Não
Não
Sim
Sim
Não
Não
Sim
Não
Não
B
B
B
B
B
B
B
B
B
B
B
B
B
B
B
B
B
B
B
B
B
B
B
B
B
B
B
B
B
B
B
B
B
B
B
B
B
B
B
B
B
C
B
B
B
B
B
B
B
B
B
B
B
B
B
B
B
B
B
B
B
B
B
B
B
B
B
B
C
B
C
C
B
C
C
B
B
B
B
B
B
B
C
B
B
B
B
B
B
B
B
B
B
B
C
B
B
B
B
B
B
B
B
B
B
B
B
B
B
B
B
B
P
P
N
P
N
P
N
P
P
N
N
P
P
P
P
N
P
P
N
P
P
N
P
N
N
P
P
N
N
P
P
N
N
P
N
N
N
P
P
P
P
P
P
P
P
P
P
N
N
P
P
P
P
P
P
P
N
P
N
P
P
P
N
N
P
P
N
P
P
N
P
N
P
P
P
P
N
P
P
P
N
N
N
P
P
N
P
P
P
N
N
N
N
N
N
P
N
N
N
P
N
N
N
N
P
N
N
N
P
N
N
N
N
N
N
P
P
N
P
P
N
P
N
N
N
N
N
P
P
N
N
N
N
N
P
N
N
N
N
N
N
N
N
N
N
N
N
N
N
N
N
N
P
P
N
N
P
N
N
N
N
P
N
N
N
N
N
N
P
N
P
N
N
N
N
N
N
N
N
P
P
N
N
N
N
N
N
N
P
P
N
N
N
N
N
N
N
N
N
N
P
N
N
N
P
P
P
N
N
N
N
N
N
N
N
N
N
N
N
N
N
N
N
N
N
N
N
N
N
N
N
N
N
P
N
P
P
N
P
N
N
N
N
N
N
N
N
N
N
N
N
N
N
N
N
N
N
N
N
N
N
N
N
N
N
N
P
P
N
N
N
N
N
N
N
N
N
N
N
N
N
N
N
N
N
N
N
N
N
N
N
N
N
N
N
N
N
P
N
N
N
N
N
N
N
N
N
N
P
N
N
N
N
P
N
P
N
N
N
N
P
Figure 3.23. Dendogram combining GTG5 and PH fingerprinting results of bacteria isolated form A. longifolia root nodules.
Ia
II
Ic
Ib

31
4. Discussion
4.1 Do abiotic factors influence Acacia longifolia growth and development?
Our study aimed to understand how abiotic factors influenced the growth and development of
A. longifolia. There is still little information available regarding this topic, since most studies focus on
the species impact on the ecosystem, rather than the inverse. Furthermore, most studies differ in the
methodology used or in data analysis, rendering it difficult to establish comparisons.
Overall, it was possible to observe a pattern transversal to the analysed parameters. Higher
shoot and root increment in length and number of phyllodes were recorded when water was at 70%
field capacity and nutrient solution was present (W+N+). A clear decrease was registered with the
absence of nutrient solution (W+N-), whereas the values registered for the combinations W-N+ and
W-N- had similar distributions or few differences. This pattern was more pronounced in forest and
dune soils than in agricultural soil, which had a much more homogeneous distribution of values in the
majority of the analysed parameters.
Plant development was mainly affected by soil type, nutrition regime and their interaction.
Watering regime had little preponderance in plant development, particularly in forest and agricultural
soils (see below). This is not in accordance with findings from other studies, particularly the one
conducted by Morais et al. (2012), in which A. longifolia seedlings were submitted to water stress,
which hindered overall plant development. In the study reported here, one particular indicator was the
fact that leaf δ13
C content was unaffected by changes in irrigation. This lack of impact may be due to
the fact that our greenhouse experiments were conducted during winter, and conditions tested
(watering limited to 30% field capacity) were not sufficient to induce water stress in plants.
In what regards the influence of the different nutrition regimes, there was a tendency for
acacias grown in the presence of the nutrient solution to have a greater development. This was
expected, since a better nutrition is likely to promote growth and promote overall plant fitness.
Moreover, it is important to note that in the absence of nutrient solution there was a greater nitrogen
fixation, indicated by phyllode δ15
N signature, comparatively, closer to zero. The δ15
N signature is
used as an indicator of the nitrogen source used by the plant. This technique of isotope analysis has
been previously used in studies concerning A. longifolia (Hellman et al. 2011; Rascher et al. 2012), as
well as other nitrogen fixing species, such as Stauracanthus spectabilis, Ulex europaeus and Cytisus
grandiflorus (Hellman et al. 2011; Rodríguez-Echeverría et al. 2009), not only to determine the
plant’s main source of nitrogen and evaluate the contribution of biological nitrogen fixation, but also
as a tool for a better understanding of the nitrogen cycle.
When considering the influence of soil, plants grown in forest and agricultural soil had a
greater development, particularly in forest soils with 70% field capacity and nutrient solution
(FW+N+), and presented longer shoots and roots, as well as more phyllodes, with a higher hydric
content. The results seem to indicate that a higher growth (increment) was accompanied by a greater
amount of biomass, particularly in terms of phyllodes and roots. The photosynthetic pigment
concentrations were, however, tendentiously lower in forest agricultural soils, which could be
explained by the larger phyllode size and higher hydric content, since the cells were more hydrated,
and the pigments were more distributed. As for nodules, plants grown in agricultural soils registered a
drastically lower number, but with a higher weight, possibly due to the roots being more hydrated. A
lower overall development was registered in acacias grown in dune soil, both in terms of increment

32
and biomass, particularly in the absence of nutrient solution (DW+N-). Additionally, lower phyllode
δ15
N content was registered, indicative, as previously mentioned, of higher N2 fixation.
We hypothesize that these differences in plant development are due to soil characteristics,
since the impact of the treatment combinations was different depending on the type of soil. Recent
findings indicate the role of soil abiotic factors as a conditioning factor, especially in the early stages
of invasion. Acacias notoriously alter soil conditions in the invaded sites, creating favourable
conditions which potentiate their development and the establishment of symbiotic relationships with
soil bacteria. But firstly they have to overcome soils limiting influence, particularly when soils are
poor in nutrients (Le Roux et al. 2018). Opposite findings are however referred on a previous study,
which found no effect of soil on plant development, including A. longifolia (Birnbaum et al. 2014).
One important difference is that in the mentioned study, the soil of origin did not compose the entirety
of the seedlings' growth substrate, while in the present study the acacia seedlings were grown in soil
originally collected from the different locations. Several differences exist among the three soil types
tested. Forest soil was more acidic, with a higher organic matter content and ammonium-N
concentration, since its collection site was a heavily invaded location. Forest soils have been referred
as being altered by litter accumulation, with increases in soil organic matter and reduced pH
(Rodríguez-Echeverría et al. 2009; Souza-Alonso et al. 2014). Agricultural soil had the lowest organic
matter content, but a higher nutrient concentration, namely nitrate-N and phosphorus, since it was an
artificially altered soil, subjected to fertilization. In turn, dune soil had an intermediate composition
between forest soil and agricultural soil, both considering organic matter and nutrient availability.
Therefore, we can conclude from the present study that a higher nutrient availability led to a
greater plant development, which is in accordance with previous results (Rodríguez-Echeverría et al.
2009). This growth, however, wasn’t always accompanied by a larger number of nodules contrary to
that same study (idem). Our results showed a correlation between more nutrition and greater plant
development, accompanied by less nodulation and nitrogen fixation, which is particularly evident in
agricultural soil, despite the higher nodule weight registered. It should be stressed that nodulation is a
high energy demanding process, and in environments where there is a high nutrient availability, it
becomes less or even unnecessary (Stephens and Neyra, 1983). Moreover, it has been reported that the
presence of a high NO3- content lead to nodule senescence, or even, inhibited its formation (Dupont et
al. 2012). These may be other conditioning factors that explain the low number of nodules in plants
grown in agricultural soil.
In sum, there are several abiotic factors acting simultaneously that influence plant
development. The impact of the different treatments will differ depending on which type of soil they
are applied. For instance, agricultural soil , which, was richer in nutrients and had higher water
retention capacity, was generally little affected by changes in treatment combinations regarding the
more prevalent parameters for the assessment of plant development (with the expectation of the
number of nodules and phyllode δ15
N). This was evident by the more homogeneous distribution of
values in the various treatment combinations associated with agricultural soil.
Evidence of this intricate correlation of factors is also indicated by the lower development of
acacias grown in dune soil. This soil has a low organic matter and nutrients content, rendering dune
soil not only a poor soil, but also a more porous soil, with a lesser capacity for retaining water, and
consequently, nutrient solution. Possible indicators of nutrient deficiency were higher root/shoot fresh
weight ratio found in the present study. Such an adaptation has been previously identified in other
species (Rodríguez-Echeverría et al. 2009). Phosphorus deficit has been associated with less phyllode
number and a lower leaf area, as well as a lower nodule weight (Leidi et al. 2000; Divito et al. 2014).

33
However, in the present study differences in the latter parameter was not statically significant. It is
important to mention that effects of phosphorus are still little understood and not always consensual
(Divito et al. 2014). Though, there might be an indication that plants grown in dune soil we able to
surpass the nutrition limitations. While phyllode δ15
N content was lowest in dune soil, the phyllode
nitrogen content was similar in acacias from all three soils, that is, despite having different origins, the
amount of nitrogen was similar. Thus, acacias in dune soil might have overcome nutrient deficiency,
but didn’t have a higher growth due to water limitations.
Additionally, our findings showed that, as previously mentioned, with the reduction of nutrient
reinforcement, there was a greater fixation of atmospheric nitrogen, since values were closer to zero in
the absence of nutrient solution. This trend, though transversal to soil type, was particularly evident in
the treatments in dune soil in the absence of nutrient solution, in both watering regimes (DW+N- and
DW-N-), in which phyllode δ15
N content was negative.
Thus, our results demonstrate not only the preponderance of abiotic factors such as soil and
nutrition in the promotion and hinder of the development of A. longifolia, but also that this
conditioning is a result of their interaction. That is, abiotic factors have particular effects, for example,
nutrition as a growth enhancer and soil as development modulator. However, abiotic factors have to be
considered in an integrative perspective, since their influence is not isolated, but act in concert to
shape plant development.

34
4.2 What type of interactions are established between Acacia longifolia and nitrogen
fixing bacteria?
A total of 111 isolated colonies were obtained in the present study, demonstrating a high
diversity of bacteria associated with A. longifolia root nodules, highlighting A. longifolia’s status as a
generalist species (Birnbaum et al. 2012; Rodríguez-Echeverría et al. 2011). Previous studies indicate,
that legumes, such as A. longifolia, are mainly nodulated by bacteria from the genera Bradrhizobium,
particularly Bradrhizobium japonicum, Rhizobium, Mesorhizobium and Sinorhizobium, as well as
Ensifer and Acinetobacter (Rodríguez-Echeverría et al. 2003; Fterich et al. 2012; De Meyer et al.
2015; Souza-Alonso et al. 2017; Kamutando et al. 2019). Although the bacterial community
associated with Acacia spp. seems to vary, the genus Bradrhizobium appears to be shared across most
locations, and is in association with several species of acacia. The importance of this genus relates to
the fact that this is one of the main rhizobial taxa to express genes associated with plants promoting
traits, such as the metabolism of nutrients, vitamins and nitrogen (Kamutando et al. 2017, 2019).
Therefore, the genus will play an essential role in plant development and in the processes underlying
invasiveness success.
This bacterial diversity, associated with A. longifolia grown in different soils, can be explained
by several reasons. Firstly, the bacteria community in the soil sampling sites might be distinctive or
have different abundances of specific bacteria involved in nodulation. A study conducted with A.
dealbata demonstrates that biogeography and soil characteristics, particularly nutrients content,
influence which bacteria associate with Acacia (Kamutando et al. 2017). Secondly, some of the
isolates might be, on one hand, non-symbiotic endophytic bacteria. The presence of these
microorganisms has been reported not only in other Acacia species (Fteich et al. 2012; Ndlouv et al.
2013), but also in other legumes (Senthilkumar et al. 2009; Li et al. 2008).
Some of the genera of non rhizobial endophytes identified in previous reports (De Meyer et al.
2015), in association with root nodules of other legume species, are Gammaproteobacteria,
particularly Enterobacter and Pseudomonas, Ochrobactrum and Fimobacteria, particularly, Bacillus
and Staphiloccocus. One the other hand, there might be the result of horizontal transfer of rhizobial
nodulating genes between bacteria associated with Acacia and bacteria already present in the soil
(Rodríguez-Echeverría et al. 2003, 2010; Rout et al., 2012; Ndlouv et al. 2013) and so increasing the
number of bacteria associated with the plant. The genes, responsible for nitrogen fixation and
nodulation, particularly, nifD and nodA genes, are present in symbiotic plasmids or islands. These can
be laterally transferred to bacteria present in the soil, conferring them the capacity to not only to form
and enter nodules, but also to biologically fix nitrogen (idem).
The total number of isolates reported here is a seemingly higher number compared to similar
studies. In previous reports, concerning A. longifolia, 38 and 44 isolates were obtained from root
nodules collected in the São Jacinto Natural Reserve in two separate occasions (Rodríguez-Echeverría
et al. 2010, 2007), while a study conducted in their native Australia, obtained 60 isolates from A.
longifolia root nodules. Though from a different plant species, a similar study, also found 112 isolates
in A. saligna in Portugal, a number closer to our findings, while in Tunisia 50 strains were isolated
from A. tortilis (Fterich et al. 2012). However it’s difficult to establish true comparisons. Studies
concerning plant-rhizobia interactions have frequently different methodological approaches and
analysis of results (Fteich et al. 2012; Ndlouv et al. 2013; Crisóstomo et al. 2013; Rodríguez-
Echeverría et al. 2007, 2009), which might condition and justify differences obtained.

35
Furthermore, the isolates were genetically diverse and distinguished. Although the strains
were not identified, polymorphisms resulting from amplification with two different universal primers,
GTG5 and PH allowed a clear separation of the bacterial strains. These primers are characterized by
being universal primers, complementary to conserved and repetitive sequences throughout the
genome, which translates into a great discriminatory capacity, facilitating the distinction between
intraspecific bacteria (Soqui, 2007; Chaves, 2005; Ramírez-Castrillho et al. 2014). GTG5 has been
successfully used in previous studies of rhizobia and non-rhizobia endophytes in other leguminous
species (De Meyer et al. 2015). Based on the patterns of both primers, cluster analysis was carried out
with Pearson coefficient. Later Shannon-Wiener and Simpson coefficients were determined, with a
cut-off of 50%.
In our present study, clustering analysis showed that strains from the same soil and treatment
combinations grouped into different clusters, while similar microorganisms were present in different
soil types. Similar results were obtained for studies conducted with wild and crop legumes, in Italy
(Moschetti et al. 2005). These data seem indicative not only of the presence of a varied and
heterogeneous bacterial community, but also of the absence of relationship between the isolated strains
and soil origin, again indicating a diverse community in each site. However, a previous report (Palmer
et al. 2000) indicates an influence of soil, in particular the combination of soil factors, on rhizobial
diversity.
Further studies are required, in particular the identification of the isolated strains, to better
understand and characterize the rhizobial community associated with the different soils, and to have a
more concrete notion of the diversity associated with A. longifolia . Since, acacia performance and
fitness are influenced by rhizobia diversity, but different bacterial stains might vary in symbiotic
effectiveness (Keet et al. 2017). Therefore, is essential to determine which bacteria establish
mutualistic interactions with acacia.
Additionally, it was not possible to establish any relationship between isolates and the
parameters applied during the experimental period. That is, there wasn’t an evident correlation
between the number of isolates obtained and the different treatments, which indicated that the applied
parameters didn’t influenced or conditioned the number of bacteria nodulating A. longifolia.
Furthermore, the different amount of bacteria isolated from acacias grown under different conditions
didn’t seem to, positively or negatively, influence plant development, but then again the determination
of bacteria strains would allow a more clear understanding of the presence, or absence of any
correlation.

36
4.3 Can SPAD be correlated with photosynthetic pigment quantification?
The quantification of photosynthetic pigments is time a consuming and destructive process,
and so we attempted to find a calibration equation correlating SPAD-502 readings and photosynthetic
pigments content for A. longifolia phyllodes. Our results showed low adjustment coefficients (R2)
varied between 0.1 and 0.3; however R2 values don’t determine the adequacy of the model. Despite
these low coefficients, the relationship between spectrophotometric chlorophyll and carotenoids
measurements and SPAD-502 readings was statistically significant Thus, the calibration equations
have predictive capacity, however it’s necessary to analyse more samples to validate the model. The
low adjustment coefficients may result from the fact that SPAD measurements are affected by several
factors such as leaf thickness and water content (Marenco et al. 2009). Furthermore, there is non-
uniform distribution of chloroplasts in the leaf, influenced by different light conditions (Xiong et al.
2015). Moreover, throughout the phyllodes, the vascular system (xylem and phloem) was present in
two main longitudinal areas of vascularization, and it was difficult to remove disks without these
tissues.
A correlation between SPAD-502 readings and photosynthetic pigments content has been
established for an assortment of species. A previous report was able to establish correlation (R2
> 0.9)
for Arabidopsis thaliana (Ling et al. 2011), thus facilitating the determination of photosynthetic
pigments for this species. Additionally, a calibration curve was also determined for birch, wheat and
potato (Uddling et al. 2007). However, the correlation found for potato was relatively weak (R2 ≈ 0.5),
illustrates that this correlation is not only species-specific but also that, its success might not be the
same for every specie.
This evaluation has not been done before, as far as we know, for other Acacia spp., including
A. longifolia and would allow a much faster and less laborious quantification of photosynthetic
pigments.

37
5. Conclusion and Future Perspectives
Acacia longifolia is an aggressive invader, disrupting habitats and communities both in
Portugal and in other regions around the world. Understanding what conditions its expansion and
influences its development is of paramount importance. To achieve that, we need acquire more
information, not only to better understand the complex process underlying its invasive success but to
encounter ways to avoid its establishment and control its dispersal.
Overall, our findings showed that acacias development is modulated by abiotic factors.
Through the greenhouse trials and subsequent analysis, we found evidence that nutrition and soil
conditions shape plant fitness, with soil conditioning development and nutrition promoting growth.
Additionally, we highlighted the importance of biological nitrogen fixation, particularly in situations
of nutrient scarcity.
Furthermore, our results regarding rhizobia analysis indicated the high bacterial diversity
associated with A. longifolia. Though, additional studies are necessary in order to identify the isolated
bacteria, as well as apply different technologies, such NGS (next generation sequencing), in order to
have a better and more complete understanding of the rhizobial community associated with A.
longifolia and how it might influence development and plant fitness.
Lastly, further studies are required, following an integrative perspective, since A. longifolia
success as prolific invasive species results of the conjugation and interaction of several factors.
Standardized methodologies should also be defined to facilitate comparisons between different studies.
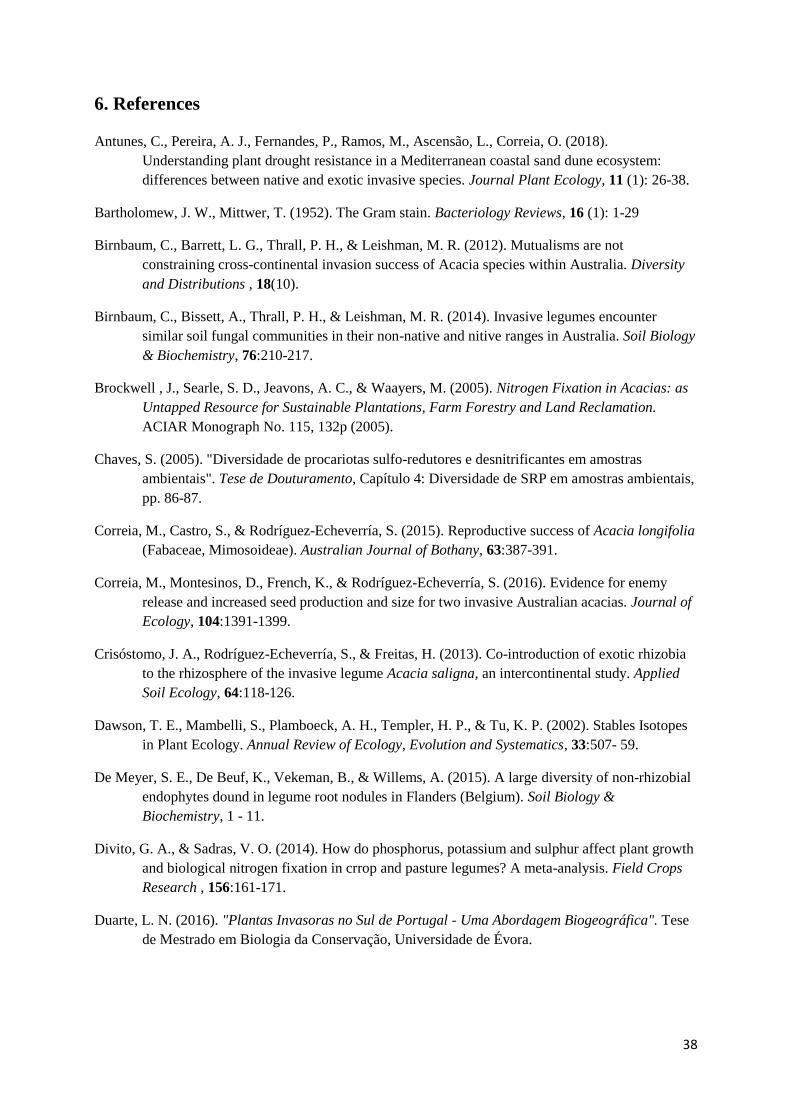
38
6. References
Antunes, C., Pereira, A. J., Fernandes, P., Ramos, M., Ascensão, L., Correia, O. (2018).
Understanding plant drought resistance in a Mediterranean coastal sand dune ecosystem:
differences between native and exotic invasive species. Journal Plant Ecology, 11 (1): 26-38.
Bartholomew, J. W., Mittwer, T. (1952). The Gram stain. Bacteriology Reviews, 16 (1): 1-29
Birnbaum, C., Barrett, L. G., Thrall, P. H., & Leishman, M. R. (2012). Mutualisms are not
constraining cross-continental invasion success of Acacia species within Australia. Diversity
and Distributions , 18(10).
Birnbaum, C., Bissett, A., Thrall, P. H., & Leishman, M. R. (2014). Invasive legumes encounter
similar soil fungal communities in their non-native and nitive ranges in Australia. Soil Biology
& Biochemistry, 76:210-217.
Brockwell , J., Searle, S. D., Jeavons, A. C., & Waayers, M. (2005). Nitrogen Fixation in Acacias: as
Untapped Resource for Sustainable Plantations, Farm Forestry and Land Reclamation.
ACIAR Monograph No. 115, 132p (2005).
Chaves, S. (2005). "Diversidade de procariotas sulfo-redutores e desnitrificantes em amostras
ambientais". Tese de Douturamento, Capítulo 4: Diversidade de SRP em amostras ambientais,
pp. 86-87.
Correia, M., Castro, S., & Rodríguez-Echeverría, S. (2015). Reproductive success of Acacia longifolia
(Fabaceae, Mimosoideae). Australian Journal of Bothany, 63:387-391.
Correia, M., Montesinos, D., French, K., & Rodríguez-Echeverría, S. (2016). Evidence for enemy
release and increased seed production and size for two invasive Australian acacias. Journal of
Ecology, 104:1391-1399.
Crisóstomo, J. A., Rodríguez-Echeverría, S., & Freitas, H. (2013). Co-introduction of exotic rhizobia
to the rhizosphere of the invasive legume Acacia saligna, an intercontinental study. Applied
Soil Ecology, 64:118-126.
Dawson, T. E., Mambelli, S., Plamboeck, A. H., Templer, H. P., & Tu, K. P. (2002). Stables Isotopes
in Plant Ecology. Annual Review of Ecology, Evolution and Systematics, 33:507- 59.
De Meyer, S. E., De Beuf, K., Vekeman, B., & Willems, A. (2015). A large diversity of non-rhizobial
endophytes dound in legume root nodules in Flanders (Belgium). Soil Biology &
Biochemistry, 1 - 11.
Divito, G. A., & Sadras, V. O. (2014). How do phosphorus, potassium and sulphur affect plant growth
and biological nitrogen fixation in crrop and pasture legumes? A meta-analysis. Field Crops
Research , 156:161-171.
Duarte, L. N. (2016). "Plantas Invasoras no Sul de Portugal - Uma Abordagem Biogeográfica". Tese
de Mestrado em Biologia da Conservação, Universidade de Évora.

39
Dupont, L., Alloing, G., Pierre, O., Msehli, S. E., Hopkins, J., Hérouart, D. (2012). The Legume Root
Nodule: From Symbiotic Nitrogen Fixation to Senescence . Senescence, Dr. Tetsuji Nagata
(Ed.), In Tech.
Fterich, A., Mahdhi, M., Lafuente, A., Pajuelo, E., Caviedes, M. A., Rodriguez-Llorente, I. D. (2012).
Taxonomic and symbiotic diversity of bacteria isolated from nodules of Acacia tortilis subsp.
raddiana in arid soils of Tunisia. Canadian Journal of Microbiology, 58: 738-751.
Hellmann, C., Sutter, R., Rascher, K. G., Máguas, C., Correia, O., & Werner, C. (2011). Impact of an
exotic N2-fixing Acacia on composition and N status of a native Mediterranean community.
Acta Oecologica, 37: 43-50.
Hungria, M., O'Hara, G. W., Zilli, J. E., Araujo, R. S., Deaker, R., & Howieson, J. G. (2016). Isolation
and growth of rhizobia. In Working with Rhizobia, Chapter 3 (pp. 39-41). Australian Centre
for International Agricultural Research Canberra : In J. G. Howieson and M.J Dilworth (Eds.).
Kamutando, C. N., Vikram, S., Kamgan-Nkuekam, G., Makhalanyane, T. P., Greeve, M., Le Roux, J.
J. (2017). Soil nutritional status and biogeography influence rhizosphere microbial
communities associated with the invasive tree Acacia dealbata. Scientific Reports.
Kamutando, C. N., Vikram, S., Kangan-Nkuekam, G., Makhalanyane, T. P., Greeve, M., Le Roux, J.
J. (2019). The Functional Potential of the Rhizospheric Microbiome of an Invasive Tree
Species, Acacia dealbata. Microbial Ecology, 77:191-200.
Keet, J., Ellis, A. G., Hui, C., & Le Roux, J. J. (2017). Legume -rhizobium symbiotic promiscuity and
effectiveness do not affect plant invasiveness. Annals of Botany, 119:1319-1331.
Le Maitre, D. C., Gaertner, M., Marchante, E., Ens, E., Holmes, P. M., Pauchard, A.(2011). Impacts of
invasive Australian acacias: implications for management and restoration. Diversity Distrib.,
17:1015-1029.
Le Roux, J. J., Ellis, A. G., Zyl, L., Hosking, N. D., Keet, J., & Yannelli, F. A. (2018). Imporrtance of
soil legacy effects and successful mutualistic interactions during Australian acacia invasions
in nutrient-poor environments. Journal of Ecology, 106:2071-2081.
Leidi, E. O., & Rodríguez-Navarro, D. N. (2000). Nitrogen and phosphorus availability limit N2
fixation in bean. New Phytologist, 147:337-346.
Li, J. H., Wang, E. T., Chen, W. F., & Chen, W. X. (2008). Genetic diversity and potential for
promotion of plant growth detected in nodule endophytic bacteria of soybean grown in
Heilongjiang province of China. Soil Biology and Biochemestry, 40(1):238-246.
Lichtenthaler, H. (1987). Chlorophylls and carotenoids: Pigments of photosynthetic biomembranes.
London: Academic Press.
Ling, Q., Huang, W., & Jarvis, P. (2011). Use of a SPAD-502 meter to measure leaf chlorophyll
concentration in Arabidopsis thaliana. Photosynthesis Research , 107(2): 209-214.
Madigan, M. T, Martinko, J. M, Bender, K. S, Buckley, D. H, & Stahl, D. A. (2017) Brock, Biology of
microorganisms (Fifteenth edition). Boston: Pearson.

40
Marchante, E., Kjoller, A., Struwe, S., & Freitas, H. (2008). Short- and long-term impacts of Acacia
longifolia invasion the belowground processes of a Mediterranean coastal dune ecosystem.
Applied Soil Ecology, 40: 210-217.
Marchante, H., Freitas, H., & Hoffman, J. H. (2011). Post-clearing recovery of coastal dunes invaded
by Acacia longifolia: is duration of invasion relevant for manegement success? Journal of
Applied Ecology, 48:1295-1304.
Marchante, H., Marchante, E., Freitas, H., & Hoffman, J. H. (2015). Temporal changes in the impacts
on plant communities of an invasive alien tree, Acacia longifolia. Plant Ecology, 216: 1481-
1498.
Marenco, R., Antezana-Vera, S., & Nascimento, H. (2009). Relationship between specific leaf area,
leaf thickness, leaf water content and SPAD-502 readings in six Amazonian tree species.
Photosynthetica, 47:184-190.
Morais, M. C., & Freitas, H. (2012). The acclimation potential of Acacia longifolia to water stress:
Implications for invasivness. Plant Science , 196:77-84.
Moschetti, G., Peluso, A., Protopapa, A., Anastasio, M., Pepe, O., & Defez, R. (2015). Use of
nodulation pattern stress tolerance nodC gene amplification, RAPD-PCR and RFLP-16S
rDNA analysis to discriminate genotypes of Rhizobium leguminosarum biovar viciae.
Systematic and Applied Microbiology, 28:619-631.
Ndlovu, J., Richardson, M. D., Wilson, J., & Le Roux, J. J. (2013). Co-invasion of South African
ecosystems by an Australian leguma and its rhizobial symbionts. Journal of Biogeography,
40:1240-1251.
Palmer, K. M., & Young, J. P. (2000). Higher Diversity of Rhizobium leguminosarum Biovar viciae
Populations in Arable Soils than in Grass Soils. Applied and Environmental Microbiology,
66(6):2445-2450.
Ramírez-Castrillón, M., Mendes, S. D., Inostroza-Ponta, M., & Valente, P. (2014). (GTG)5 MSP-PCR
Fingerprinting as a Technique for Driscrimination of Wine Associated Yeasts? PLoS ONE,
9(8):e105870.
Rascher, K., Werner, C., Máguas, C., & Correia, O. (2009). Tracing seasonal changes in water use of
an invasive Acacia and a native pine in southern Portugal by measurement of sap flow. Acta
Horticulturae, 846:209-216.
Rascher, K. G., Groβe-Stoltenberg, A., Máguas, C., & Werner, C. (2011a). Understory Invasion by
Acacia longifolia Alters the Water Balence and Carbon Gain of a Mediterranean Pine Forest.
Ecosystems, 14: 904-919.
Rascher, K., Groβe-Stoltenberg, A., Máguas, C., Meira-Neto, J., & Werner, C. (2011b). Acacia
longifolia invasion impacts vegetation structure and regeneration dynamics in open dunes and
pine forests. Biological Invasions , 13 (5): 1099-1113.
Rascher, K., Hellman, C., Máguas, C., & Werner, C. (2012). Community scale 15
N isoscapes: Tracing
the spatial impact of an exotic N2-fixing. Ecology Letters, 15(5):484-491.

41
Richardson, D. M., Peysek, P., Rejmánek, M., Barbour, M. G., Panetta, D., & West, C. J. (2000).
Naturalazation and invasion of alien plants: concepts and definitions. Diversity and
Distributions, 6:93-107.
Richardson, D. M., & Rejmánek, M. (2011). Trees and shrubs as invasive alien species - a global
review. Diversity and Distributions, 17:788-809.
Rodríguez-Echeverría, S., Pérez-Fernández, M. A., Vlaar, S., & Finnan, T. (2003). Analysis of
legume-rhizobia symbiosis in shrubs from central western Spain. Journal of Applied
Microbiology, 95:1367-1374.
Rodríguez-Echeverría, S., Crisóstomo, J. A., & Freitas, H. (2007). Genetic Diversity of Rhizobia
Associated with Acacia longifolia in Two Stages of Invasion of Coastal Sand Dunes. Applied
and Environmental Microbiology, 73 (15): 5066-5070.
Rodríguez-Echeverría, S., Crisóstomo, J. A., Nabais, C., & Freitas, H. (2009). Belowground
mutualists and the invasive ability of Acacia longifolia in coastal dunes of Portugal. Biological
Invasions.
Rodríguez-Echeverría, S. (2010). Rhizobial hitchhickers from Down Under: invasional meltsown in a
plant-bacteria mutualism? Journal of Biogeography, 37:1611-1622.
Rodríguez-Echeverría, S., Le Roux, J. J., Crisóstomo, J. A., & Ndlovu, J. (2011). Jack-of-all-trades
and master of many? How does asscoiated rhizobial diversity influence the colonization
success of Australian Acacia species? Diversity and Distributions, 17:946-957.
Rout, M. E., & Callaway, R. M. (2012). Interactions between exotic invasive plants and soil microbes
in the rizosphere suggest that "everything is not everywhere". Annals of Bothany , 110: 213-
222.
Sadava, D., Hills, D., Heller, C., & Berenbaum, M. (2014). Life: The Science of Biology, Tenth
Edition. Sinauer Associates, Inc., pp748.
Senthilkumar, M., Swarnalakshmi, K., Govindasamy, V., Lee, Y. K., & Annapurna, K. (2009).
Biocontrol potential of soybean bacterial endophytes against charcol rot fungus, Rhizoctonia
bataticola. Current Microbiology, 58:288-293.
Soqui, M. V. (2007). "Carcterização fenótipica e molecular de isolados de Campylobacter jejuni e
Campylobacter coli de origem avícola". Tese Douturamento, PARTE III: Caracterização
molecular, Capítulo 3: Análise por PCR-fingerprinting, pp 142-143.
Souza-Alonso, P., Guisande-Collazo, A., & González, L. (2014). Gradualism in Acacia dealbata Link
invasion: Impact on soil chemestry and microbial community over a chronological sequence.
Soil Biology & Biohemestry, 80:315-323.
Souza-Alonso, P., Rodríguez, J., González, L., & Lorenzo, P. (2017). Here to stay: Recent advances
and perspectives about Acacia invasion in Mediterranean areas. Annals of Forest Science , 74:
55.
Stephens, B. D., & Neyra, C. A. (1983). Nitrate and nitrite reduction in relation to nitrogenase ctivity
in soybean nodules and Rhizobium japonicum bacteroids. Plant Physiology, 71:731-735.

42
Uddling, J., Gelang-Alfredsson, J., Piikki, K., & Pleijel, H. (2007). Evaluating the relationship
between leaf chlorophyll concentration and SPAD-502 chlorophyll meter readings.
Photosynthesis Research, 91(1): 37-46.
Ulm, F., Hellman, C., Cruz, C., & Máguas, C. (2017). N/P imbalance as a key driver for the invasion
of oligotrophic dune systems by a woody legume. Oikos, 126: 232-240.
Vicente, S. (2016). "Assessement of genetic variability in the exotic invasive species Acacia longifolia
using molecular markers". Tese de Mestrado, Faculdade de Ciências, Universidade de Lisboa.
Xiong, D., Chen, J., Yu, T., Gao, W., Ling, X., Li, Y.,(2015). SPAD-based leaf nitrogen estimation is
impacted by environmental factors and crop leaf characteristics. Scientific Reports, 5:13389.
6. Appendices

43
6.1 Appendix I- Formulations
Table 6.1: Modified Hoagland Solution with final concentrations.
Table 6.2: Yeast Mannitol Medium

44
6.2 Appendix II- Significance Levels
Table 6.3: Kruskall-Wallis hypothesis test summary, according to treatment combinations (p≤ 0.05).
Null hypothesis Significance Decision
The distribution of Shoot Increment is
the same among the Treatments
categories
0.004 Reject the null
hypothesis
The distribution of Root Length is the
same among the Treatments categories 0.036
Reject the null
hypothesis
The distribution of Root/Shoot Length
Ratio is the same among the
Treatments categories
0.129 Retain the null
hypothesis
The distribution of Root/Shoot Fresh
Weight Ratio is the same among the
Treatments categories
0.002 Reject the null
hypotheis
The distribution of Root Hydric
Content is the same among the
Treatments categories
0.000 Reject the null
hypothesis
The distribution of Number of
Phyllodes is the same among the
Treatments categories
0.000 Reject the null
hypothesis
The distribution of Phyllode Hydric
Content is the same among the
Treatments categories
0.000 Reject the null
hypothesis
The distribution of Number of Nodules
is the same among the Treatments
categories
0.001 Reject the null
hypothesis
The distribution of Nodule Weight is
the same among the Treatments
categories
0.066 Retain the null
hypothesis
The distribution of Nodule
Weight/Number Ratio is the same
among the Treatments categories
0.042 Reject the null
hypothesis
The distribution of Ca+b Content
(phyllode tip) is the same among the
Treatments categories
0.079 Retain the null
hypothesis
The distribution of Ca+b Content
(phyllode base) is the same among the
Treatments categories
0.356 Retain the null
hypothesis
The distribution of Carotenoid Content
(phyllode tip) is the same among the
Treatments categories
0.002 Reject the null
hypothesis
The distribution of Carotenoid Content
(phyllode base) is the same among the
Treatments categories
0.011 Retain the null
hypothesis
The distribution of δ15
N (phyllode) is
the same among the Treatments
categories
0.014 Reject the null
hypothesis
The distribution of δ13
C (phyllode) is
the same among the Treatments
categories
0.741 Retain the null
hypothesis
The distribution of N% (phyllode) is
the same among the Treatments
categories
0.695 Retain the null
hypothesis
The distribution of C% (phyllode) is
the same among the Treatments 0.453
Retain the null
hypothesis

45
categories
Null hypothesis Significance Decision
The distribution of CN Ratio is the
same among the Treatments categories 0.745
Retain the null
hypothesis
The distribution of δ15
N (nodule) is the
same among the Treatments categories 0.240
Retain the null
hypothesis
The distribution of δ13
C (nodule) is the
same among the Treatments categories 0.267
Retain the null
hypothesis
The distribution of N% (nodule) is the
same among the Treatments categories 0.177
Retain the null
hypothesis
The distribution of C% (nodule) is the
same among the Treatments categories 0.235
Retain the null
hypothesis
The distribution of CN Ratio (nodule)
is the same among the Treatments
categories
0.153 Retain the null
hypothesis
Table 6.4: Pairwise comparisons summary of statistical significant variables, according to treatment combinations (p≤0.05).
F, forest soil; A, agricultural soil; D, dune soil; W+N+, water at 70% field capacity/presence of nutrient solution; W+N-,
water at 70% field capacity/absence of nutrient solution; W-N+, water at 30% field capacity/presence of nutrient solution; W-
N-, water at 30% field capacity/absence of nutrient solution.
Treatments
Variable Categories Adjusted Significance
Shoot Increment DW+N- FW+N+ 0.049
Root/Shoot Fresh
Weight
FW+N+ DW+N- 0.010
FW+N+ AW-N+ 0.014
Number of Phyllodes
DW+N- AW+N+ 0.028
DW+N- DW-N+ 0.010
DW+N- FW+N+ 0.000
DW-N- FW+N+ 0.004
FW+N- FW+N+ 0.007
Number of Nodules AW+N+ FW+N+ 0.021
AW-N+ FW+N+ 0.045
Carotenoid Content
(phyllode tip) AW+N+ FW+N- 0.034
Carotenoid Content
(phyllode tip)
AW-N- FW+N- 0.021
AW-N- DW-N+ 0.009
Phyllodes Hydric
Content
DW+N- AW-N- 0.041
DW+N- AW-N+ 0.016
DW+N- DW-N+ 0.012
DW+N- FW+N+ 0.000
DW+N- AW+N+ 0.000
DW-N- FW+N+ 0.042
DW-N- AW+N+ 0.035
Roots Hydric Content
DW+N- AW-N- 0.029
DW+N- AW-N+ 0.019
DW+N- AW+N+ 0.005
(continuation of table 6.3)

46
6.3 Appendix III- Values for absolute chlorophyll content in Acacia longifolia phyllode
Figure 6.1: Average distribution of Ca content (phyllode tip) (mean ± 2SE) of A. longifolia, according to treatment
combination (n= 55). F, forest soil; A, agricultural soil; D, dune soil; W+N+, water at 70% field capacity/presence of nutrient
solution; W+N-, water at 70% field capacity/absence of nutrient solution; W-N+, water at 30% field capacity/presence of
nutrient solution; W-N-, water at 30% field capacity/absence of nutrient solution.
Figure 6.2: Average distribution of Ca content (phyllode nase) (mean ± 2SE) of A. longifolia, according to treatment
combination (n= 60). F, forest soil; A, agricultural soil; D, dune soil; W+N+, water at 70% field capacity/presence of nutrient
solution; W+N-, water at 70% field capacity/absence of nutrient solution; W-N+, water at 30% field capacity/presence of
nutrient solution; W-N-, water at 30% field capacity/absence of nutrient solution.

47
Figure 6.3: Average distribution of Cb content (phyllode tip) (mean ± 2SE) of A. longifolia, according to treatment
combination (n= 55). F, forest soil; A, agricultural soil; D, dune soil; W+N+, water at 70% field capacity/presence of nutrient
solution; W+N-, water at 70% field capacity/absence of nutrient solution; W-N+, water at 30% field capacity/presence of
nutrient solution; W-N-, water at 30% field capacity/absence of nutrient solution.
Figure 6.4: Average distribution of Cb content (phyllode base) (mean ± 2SE) of A. longifolia, according to treatment
combination (n= 60). F, forest soil; A, agricultural soil; D, dune soil; W+N+, water at 70% field capacity/presence of nutrient
solution; W+N-, water at 70% field capacity/absence of nutrient solution; W-N+, water at 30% field capacity/presence of
nutrient solution; W-N-, water at 30% field capacity/absence of nutrient solution.

48
6.4 Appendix IV- Significance Analysis of Calibration Models
Table 6.5: F-test two samples for variance between SPAD-502 readings and absolute chlorophyll a (Ca) content at phyllode
base.
SPAD-502 Ca
Mean 54.189 38.886
Variance 52.813 60.847
Observations 59 59
gl 58 58
F 0.867
P(F<=f) one-tail 0.295
F critic one-tail 0.646
Table 6.6: F-test two samples for variance between SPAD-502 readings and absolute chlorophyll b (Cb) content at phyllode
base.
SPAD-502 Cb
Mean 54.189 14.508
Variance 52.813 13.672
Observations 59 59
gl 58 58
F 3.862
P(F<=f) one-tail 3.759E-07
F critic one-tail 1.545
Table 6.7: F-test two samples for variance between SPAD-502 readings and absolute total chlorophyll (Ca+b) content at
phyllode base.
SPAD-502 Ca+b
Mean 54.189 53.394
Variance 52.813 126.370
Observations 59 59
gl 58 58
F 0.417
P(F<=f) one-tail 0.001
F critic one-tail 0.646

49
Table 6.8: F-test two samples for variance between SPAD-502 readings and absolute carotenoid content at phyllode base.
SPAD-502 Carotenoids
Mean 54.189 8.476
Variance 52.813 3.187
Observations 59 59
gl 58 58
F 16.567
P(F<=f) one-tail 2.471E-21
F critic one-tail 1.545
Table 6.9: F-test two samples for variance between SPAD-502 readings and absolute chlorophyll a (Ca) content at phyllode
tip.
SPAD-502 Ca
Mean 41.966 27.892
Variance 121.384 37.873
Observations 56 56
gl 55 55
F 3.205
P(F<=f) one-tail 1.414E-05
F critic one-tail 1.564

50
Table 6.10: F-test two samples for variance between SPAD-502 readings and absolute chlorophyll b (Cb) content at phyllode
tip.
SPAD-502 Cb
Mean 41.966 9.391
Variance 121.384 6.007
Observations 56 56
gl 55 55
F 20.205
P(F<=f) one-tail 1.873E-22
F critic one-tail 1.564
Table 6.11: F-test two samples for variance between SPAD-502 readings and absolute total chlorophyll (Ca+b) content at
phyllode tip.
SPAD-502 Ca+b
Mean 41.966 37.283
Variance 121.384 70.466
Observations 56 56
gl 55 55
F 1.722
P(F<=f) one-tail 0.023
F critic one-tail 1.564

51
Table 6.12: F-test two samples for variance between SPAD-502 readings and absolute carotenoid content at phyllode tip.
SPAD-502 Carotenoids
Mean 41.966 7.009
Variance 121.384 2.003
Observations 56 56
gl 55 55
F 60.578
P(F<=f) one-tail 7.839E-35
F critic one-tail 1.564