Industrial scale solar thermal energy: the opportunity in ... · ‒Some of the greatest solar...
33
Industrial scale solar thermal energy: the opportunity in agri-processing P.F. Janse van Vuuren 17 November 2016 STIAS Stellenbosch Solar heating in agri-processing workshop
-
Upload
vuongduong -
Category
Documents
-
view
216 -
download
3
Transcript of Industrial scale solar thermal energy: the opportunity in ... · ‒Some of the greatest solar...

Industrial scale solar thermal energy: the opportunity in agri-processing
P.F. Janse van Vuuren
17 November 2016 STIAS Stellenbosch
Solar heating in agri-processing workshop
Motivation
South Africa has
‒ Rising energy prices
‒ Some of the greatest solar radiation on earth
Why we are here today

Rising energy prices
Electricity price rising significantly faster than inflation (CPI)
Source: Own calculations based on NERSA tariff book and StatsSA CPI
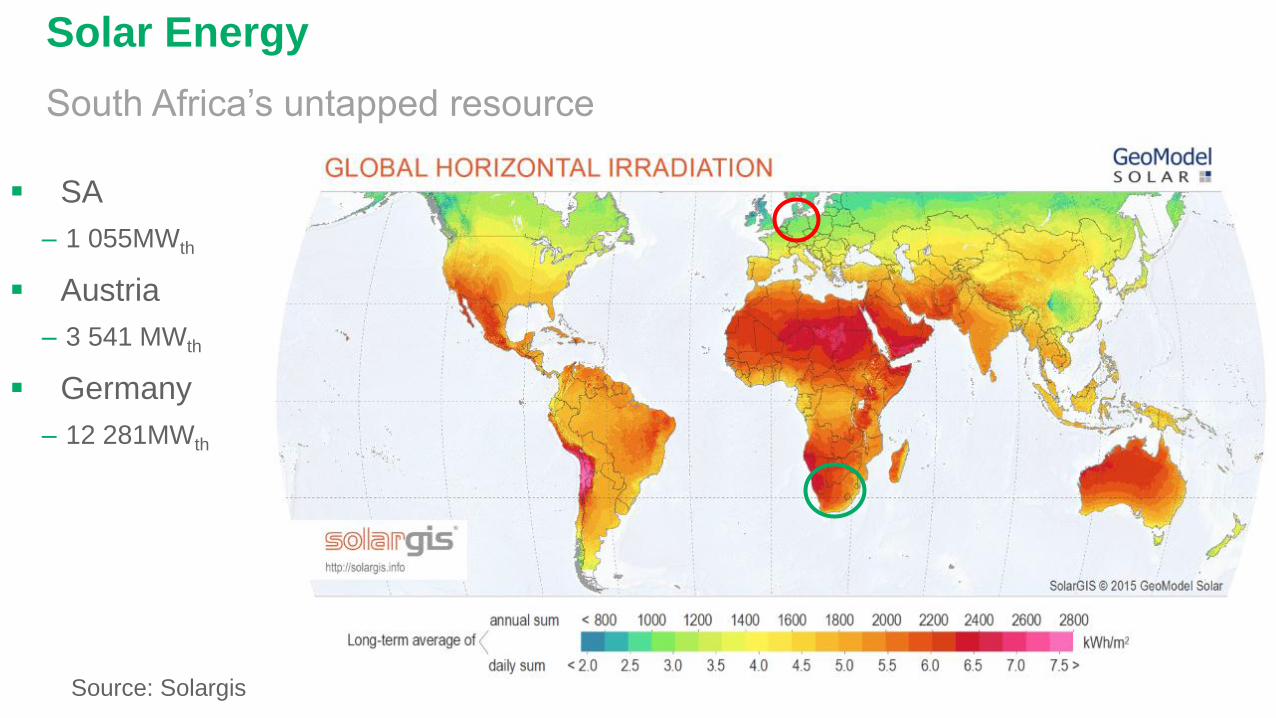
Solar Energy
South Africa’s untapped resource
SA
‒ 1 055MWth
Austria
‒ 3 541 MWth
Germany
‒ 12 281MWth
Source: Solargis

Motivation
South Africa has
‒ Rising energy prices
‒ Some of the greatest solar radiation on earth
Agri-processing has
‒ Significant energy demand for heat (79%)1
‒ Most of which is at low temperatures (less than 160 °C)2
Why we are here today
1. Lamperia (2014) 2. AEE Intec (2009)
Motivation
South Africa has
‒ Rising energy prices
‒ Some of the greatest solar radiation on earth
Agri-processing has
‒ Significant energy demand for heat (79%)1
‒ Most of which is at low temperatures (less than 160 °C)2
Solar thermal
‒ Most efficient and economic at low temperature ranges (less than 160 °C) 2
‒ Financially feasible replacement of most fossil fuels3
Why we are here today
1. Lamperia (2014) 2. AEE Intec (2009) 3. Joubert, Hess & Van Niekerk (2016)

Solar thermal
Solar
Collector Useful heat
Max efficiency + 45% Efficiency linked to
temperature range
Solar radiation: energy* from the sun
Solar PV
cell electricity
vs solar PV
*In the form of electromagnetic radiation from the infrared (long) to the ultraviolet (short) wavelengths
_

How solar thermal systems work
79% of energy demand in agri-processing is for low temp heat
‒ Solar heat most economical at low temperature applications
Food and beverages have significant cold chains that match PV
‒ Solar generates energy when cooling is needed
‒ Solar also provide insulating effect reducing the need for cooling
The basics
Source: Helmke & Hess (2015)

How solar thermal systems work Solar collectors overview

How solar thermal systems work
Ability to store energy is key selling point
Most economic at low temperature applications (less 160°C)
‒ Wide range of collectors that are applicable to different heat levels
‒ Solar heat can be integrated in different ways
Generally still in conjunction with traditional heat source
‒ Rule of thumb: solar fraction of 60% in South Africa
i.e. 60% of energy per annum provided by solar thermal system
In summary

Why focus on agri-processing
Agri-processing is highlighted as key sector for government support
‒ Industrial Policy Action Plan (IPAP) by Department of Trade and Industry (dti)
‒ Agripark programme of Department of Rural Development and Land Reform (DRDLR) &
Department of Agriculture, Forestry & Fisheries (DAFF)
Most of agri-processing heat is within the low temperature range (less 160°C)
‒ Mostly warm water and some steam e.g. cleaning fats requires 65°C
‒ Avoids losses from conversion

Why focus on agri-processing Linking solar thermal and agri-processing
Adapted from Horta (2015)

Why focus on agri-processing Industrial sectors and processes with the highest potential for solar heating
Source: Based on AEE Intec (2009) and Matrix of Industrial Processes (accessible online at: http://wiki.zero-emissions.at/)

7.4 Petajoules of energy
48.8 Petajoules of energy
Energy in food & beverages
DOE
energy
balance
2012
SATIM
model
energy
use
2006
4.8 gas
2.6 electricity
15 electricity
32.4 coal
Used for heat
5.1 Petajoules of energy
4.8 gas
0.26 electricity
*Not to scale
35.2 Petajoules of energy
1.4 electricity
32.4 coal
Assume:
1) 50% supplement
with solar thermal
2) 60% solar share
1.4 gas 1.4 gas
3 758 GWh per annum
110 922 CO2e
(tonne / annum)
942 556 CO2e
(tonnes / annum)
3 758 000 m2 of
installations
425 GWh per annum
425 000 m2 of
installations
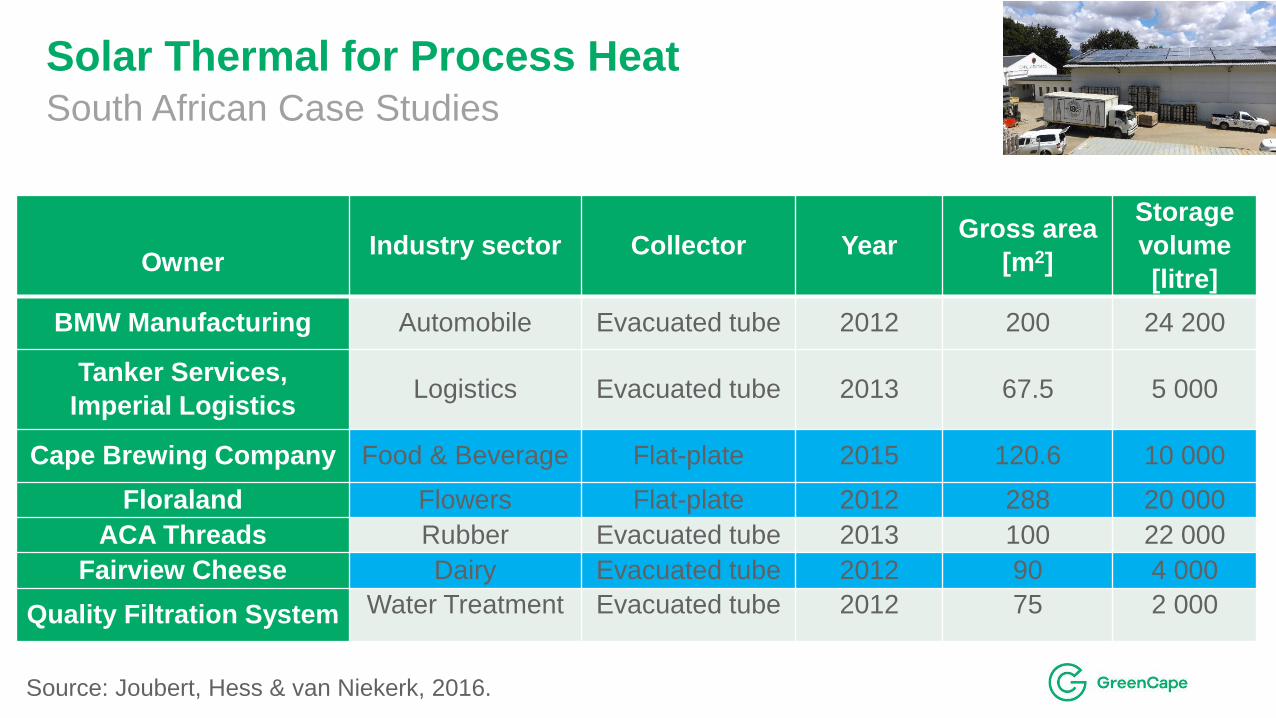
Solar Thermal for Process Heat
South African Case Studies
Owner Industry sector Collector Year
Gross area
[m2]
Storage
volume
[litre]
BMW Manufacturing Automobile Evacuated tube 2012 200 24 200
Tanker Services,
Imperial Logistics Logistics Evacuated tube 2013 67.5 5 000
Cape Brewing Company Food & Beverage Flat-plate 2015 120.6 10 000
Floraland Flowers Flat-plate 2012 288 20 000
ACA Threads Rubber Evacuated tube 2013 100 22 000
Fairview Cheese Dairy Evacuated tube 2012 90 4 000
Quality Filtration System Water Treatment Evacuated tube 2012 75 2 000
Source: Joubert, Hess & van Niekerk, 2016.

Solar Thermal Uptake
Rising energy prices
‒ Solar thermal cost competitive to replace most fossil fuels1
‒ Financially viable opportunity to replace all fossil fuels
(i.e. HFO, paraffin, electricity, diesel, petrol and LPG),
except possibly not coal (at this stage)
‒ For example, with zero cost increase in electricity,
some projects could payback in less than 5 years when replacing
electricity with solar thermal
‒ Majority of fuels are linked to volatile oil price
thus solar thermal allows better long term planning
Drivers
1. Joubert, Hess & Van Niekerk (2016)

Solar Thermal Uptake
Rising energy prices
‒ Solar thermal cost competitive to replace most fossil fuels
‒ Majority of fuels linked to volatile oil price thus solar thermal allows better long term planning
Greenhouse gas emission reduction potential
‒ Carbon tax of R120 per tonne CO2e awaiting cabinet approval
Energy efficiency incentives
‒ Section 12 income tax rebates (for large installations)
‒ SOLTRAIN support
Expansions
‒ Agri-processing highlighted for support
‒ Easier to integrate into new build thus lowering costs
Innovative contracting solutions e.g. ESCOs1
‒ SANEDI ESCO register being launched
Drivers
1. ESCO = Energy Service Company
barrie
rs

Conclusions For all stakeholders
Solar thermal has significant potential in agri-processing
‒ 425 000 – 3 758 000 m2 of installations
‒ 110 922 – 942 556 tCO2e savings potential

Conclusions For agri-processors
Solar energy a viable opportunity:
‒ Worth considering for all fossil fuels except possibly coal (at this stage)
‒ Set to improve – energy prices keep rising, proposed carbon tax
‒ Installations already in existence (e.g. CBC – next presentation)
Best practice is in collaboration with energy efficiency
‒ Ensures heat demands are optimised correctly as solar thermal long term solution
Incentives and support available to encourage uptake
‒ Residential and commercial buildings standards
‒ Income tax rebates (large installations)
‒ SOLTRAIN (presentation coming up)
Opportunity of innovative contracting e.g. ESCos
‒ SANEDI register being launched

Conclusions For solar thermal industry
Solar thermal industry ‘infant industry’
‒ Need to move along the learning curve for prices to drop
‒ Agri-processing large opportunity (425 000 - 3 758 000 m2 of installations)
Solar not understood by energy users
‒ Perceived to be untested
‒ Considered unreliable
Opportunity to overcome capital cost constraints with innovative contracting
‒ Ensure registered to be ESCO (http://www.sanediesco.org.za/user/register)
Utilise industry support
‒ e.g. income tax rebates as selling point large systems
‒ SOLTRAIN training and support (presentation upcoming)
Need clear and transparent communication about the costs,
benefits and practical implications of these technologies

Presenter:
Pieter Janse van Vuuren ([email protected])
Project Team members:
Lauren Basson (GreenCape)
Karin Kirtzinger (CRSES)
Ulrich Terblanche (CRSES)
Manisha Gulati (WWF)
Louise Scholtz (WWF)
Thank you

References
AEE Intec, 2009. Thermal use of Solar Energy: SOLTRAIN training course for experts and professionals.
Stellenbosch, AEE Institute for Sustainable Technologies.
DEADP, 2013. Energy Consumption and CO2e emissions database for the Western Cape. [Online]:
http://www.cityenergy.org.za/uploads/resource_108.pdf
Horta, P., 2015. Process Heat Collectors: State of the Art and available medium temperature collectors. , SolarPaces
Annex IV: IEA SHC Task 49
Janse van Vuuren, P.F. 2015. Regional Resource Flow Project – Social Accounting Matrix Analysis, available on
request: GreenCape: Report to Funder
Janse van Vuuren, P.F. 2015. Regional Resource Flow Project – Wine Sector Report, available on request:
GreenCape: Report to Funder
Joubert, E., Hess, S. & Niekerk, J. V., 2016. Large-scale solar water heating in South Africa: Status, barriers and
recommendations. Renewable Energy, Issue 97, pp. 809-822.
Lampreia, J., 2014. Industrial renewable heat. [Online]
Available at: https://www.carbontrust.com/news/2014/05/industrial-renewable-heat/
[Accessed 3 February 2016].
Mauthner, F., Weiss, W. & Spörk-Dür, M., 2016. Solar Heat Worldwide: Markets and Contribution to the Energy
Supply 2014. [Online]: http://www.ren21.net/wp-content/uploads/2016/06/GSR_2016_Full_Report_REN21.pdf
Solar GIS. 2016. GHI solar maps. [Online]: http://solargis.com/products/maps-and-gis-data/free/overview/

Additional slides

Conclusions For policy makers
Agri-processing clearly supported ‒ Agriparks & IPAP
‒ Agriparks present opportunity to ensure development done sustainably
Significant carbon savings of relevance to meet SA’ commitments ‒ 85% GHG emissions in South Africa from energy
‒ Committed to 34% GHG reduction by 2020 & 42% by 2025 under Copenhagen Accord
Solar thermal currently ‘infant industry’ ‒ Justifies support for sector e.g. the income tax rebates
Policy needs to clear and consistent ‒ Unclear and sudden changes in policy have been damaging to industry in past
‒ Considered unreliable
SABS’s systems testing is limiting ‒ Component testing will enable more competition and growth (including local manufacture)
Number of programmes working in solar space ‒ Working together is key to preventing overlap and duplication
Solar Thermal Uptake
Relative Complexity
‒ “Solar PV cables don’t leak”
‒ Solar thermal generates heat optimised for specific temperature
‒ Stagnation in solar thermal systems could result in damage from steam build up
Practical limitations
‒ Available roof or floor space, considering shading etc.
‒ Roof strengthening for retrofits increase cost
High cost of solar thermal
‒ Requirement for systems testing by SABS limits competition in solar water heater market
‒ Makes installations more costly as parts need to be imported or certified overseas
‒ Infant industry
Barriers
back

Specific investment costs and levelised costs of solar thermal generated heat for large pumped
domestic hot water systems. Source: Solar Worldwide 2016
Solar Energy Uptake
back

Solar Energy Uptake
CBC tender proposals with component breakdown (exchange rate ZAR/EUR = 15.3).
Table below graph shows calculated levelised costs of heat (LCOH), internal rate of return (IRR) and payback period.
Source: Joubert, Hess & van Niekerk, 2016

Source: Sarah Kurtz and Keith Emery - National Renewable Energy Laboratory (NREL), Golden, CO back

back

Milk
products
Fruits /
vegetabl
es /
herbs
Suga
r
Bee
r
Fats
/ oils
Chocola
te /
cacao /
coffee
Starch/
potatoe
s/grain
produc
ts
Bread /
biscuit
s /
cakes
Wine /
bevera
ge
Mea
t
Fish Arom
a
Baby-
food
Solar
integration
Emerging
technologi
es process
intensificati
on
Heat
integrati
on
Unit
operation
Typical
processes
√ √ √ √ √ √ √ √ √ √ √ √ √ √ √ √
Cleaning Cleaning of
bottles &
cases
√ √ √ √ √ √ √ √ √ √
Washing
products
√ √ √ √ √ √ √ √ √
Cleaning of
production
halls and
equipment
√ √ √ √ √ √ √ √ √ √
Drying Drying √ √ √ √ √ √ √ √ √ √ √ √
Evaporatio
n &
distillation
Evaporatio
n
√ √ √ √ √ √ √ √
Distillation √ √ √ √ √ √
Deodorisati
on
√ √ √ √
Blanching Blanching √ √ √ √ √ √
Pasteurisa
tion
Pasteurisati
on
√ √ √ √ √ √ √ √*
Sterilisatio
n
Sterilisation √ √ √ √ √ √
Cooking Cooking &
boiling
√ √ √ √ √ √ √ √ √ √
Other
process
heating
Pre-heating
& process
water
√ √ √ √ √
Soaking √ √ √ √
Thawing √ √ √ √
Peeling √ √ √ √ √

Unit
operation
Typical
processes
Milk
products
Fruits /
vegetabl
es /
herbs
Suga
r
Bee
r
Fats
/ oils
Chocola
te /
cacao /
coffee
Starch
/
potato
es /
grain
produc
ts
Bread /
biscuit
s /
cakes
Wine /
bevera
ge
Mea
t
Fish Arom
a
Baby-
food
Solar
integration
Emerging
technologi
es process
intensificati
on
Heat
integrati
on
General
process
heating
Boiler feed-
water
preheating
√ √ √ √ √ √ √ √ √ √ √ √ √ √ √
Heating of
productio
n halls
Heating of
production
halls
√ √ √ √ √ √ √ √ √ √ √ √ √ √ √
Cooling of
productio
n halls
Cooling of
production
halls
√ √ √ √ √ √ √ √ √ √ √ √ √ √
Cooling
processes
Cooling,
chilling &
cold
stabilisatio
n
√ √ √ √ √ √ √ √ √ √ √ √ √ √
Ageing √ √ √ √ √ √ √ √
Melting Melting √ √ √
Extracting Extracting √ √ √ √ √ √
Bleaching Bleaching √ √ √
Fermentati
on
Fermentati
on
√* √ √* √ √ √ √
Temperature level
20-40⁰C √ √ √ √ √ √
40-60⁰C √ √ √ √ √ √ √ √
60-80 ⁰C √ √ √ √ √ √ √ √ √ √ √
> 80 ⁰C √ √ √ √ √ √ √ √ √ √

Solar Thermal
International trend
Source: Mauthner, F., Weiss, W. & Spörk-Dür, M., 2016

Solar Thermal
South African status quo
Total solar thermal systems (residential and industrial) to date 1 055MWth
Source: Own calculations based on Solar Worldwide 2016