An Intelligent Fault Detection Model for Fault Detection ...
© 2016 Alaa Abdulhady Jaber and Robert Bicker. This open access article is distributed under a Creative Commons
Attribution (CC-BY) 3.0 license.
American Journal of Engineering and Applied Sciences
Original Research Paper
Industrial Robot Fault Detection Based on Statistical Control
Chart
1,2Alaa Abdulhady Jaber and
1Robert Bicker
1Newcastle University, UK 2University of Technology, Iraq
Article history
Received: 08-01-2016 Revised: 08-02-2016 Accepted: 29-02-2016 Corresponding author: Alaa Abdulhady Jaber Newcastle University, UK and University of Technology, Iraq Email: [email protected]
Abstract: Industrial robots have long been used in production systems in order to improve productivity, quality and safety in automated manufacturing processes. There are significant implications for operator safety in the event of a robot malfunction or failure and an unforeseen robot stoppage due to different reasons has the potential to cause an interruption in the entire production line, resulting in economic and production losses. In this research a fault detection system based on statistical control chart has been designed. An experimental investigation was accomplished using the PUMA 560 robot. Vibration signals are captured from the robot when it executes a repetitive task and then some statistical features are extracted from the signals, by utilising a developed data acquisition system based on National instruments hardware and software. The extracted vibration features, which are related to the robot healthy and faulty states, have subsequently been used for building and testing a statistical control chart. The chart has been validated using part of the measured data set, not used within the design stage, which represents the robot operating conditions. Validation results indicate the successful detection of faults at the early stages using the key extracted parameters. Keywords: Condition Monitoring, Fault Detection and Diagnosis, Statistical Control Chart, Industrial Robot, Backlash
Introduction
The Robot Institute of America (RIA) has defined an industrial robot as a reprogrammable multifunctional manipulator designed to move material, parts, tools, or specialized devices through variable programmed motions for the performance of a variety of tasks (Spong et al., 2005). The term fault is generally understood to mean an unpermitted variation of one or more characteristic features of a system away from the normal, reasonable and standard behaviour (Isermann, 2005). However, an unforeseen robot stoppage has the potential to cause an interruption in the entire production line, resulting in economic and production losses. Availability and maintainability, which can be defined as the probability of a system operating satisfactorily in any time period and its capability of being repaired, are therefore critical for industrial robots. Therefore, the automated supervision of the robot system is desirable, as this can increase robot availability and maintainability and reduce
operator effort. Currently, there are few commercially available solutions that allow for the automated health monitoring of the mechanical components of a robot and thus the ability to continuously monitor the status and condition of robots has become an important research topic in recent years and is now receiving considerable attention.
The concept of model-free based fault detection and diagnosis has stimulated the interest of using novelty
detection for condition monitoring, which focuses on identifying any deviations between the features extracted from the recent measured data and the data measured under normal (healthy) operating conditions. The features obtained from a machine in its undamaged state will have a distribution with an associated mean and variance. However, a variation in the mean and/or variance will appear if the machine is damaged. Statistical Control Charts (SCCs) provide a framework for monitoring the distribution of the features and detection if they are inconsistent with the past healthy
Alaa Abdulhady Jaber and Robert Bicker / American Journal of Engineering and Applied Sciences 2016, 9 (2): 251.263 DOI: 10.3844/ajeassp.2016.251.263
252
state and any change in the distribution characteristics of the features will indicate damage, termed outlier analysis. SCCs are one of the earliest statistical fault detection techniques dating back to 1931 (Yadav and Kalra, 2010). Starting with the advent of Shewhart control charts for averaging, usually called X-bar ( X ) chart, which is normally used in combination with a range chart (R chart) or standard deviation chart (S chart) (Shiroishi et al., 1997). Further modification to Shewhart charts have resulted in Cumulative Sum (CUSUM) and the Exponentially Weighted Moving Average (EWMA) charts in the early 1950 s (Yadav and Kalra, 2010). Because these charts are easy to construct, implement and interpret, they received a large acceptance in the field of machines and processes monitoring. Techniques based on SCCs can be classified to two approaches: The univariate and multivariate approaches. In the former method each characteristic of interest is monitored independently whereas in the latter the concurrent monitoring of characteristics is accomplished, considering the correlation that may exist among the various characteristics (Yadav and Kalra, 2010; Kisić et al., 2013). Baydar et al. (2001) presented a multivariate statistical methodology for helical gears monitoring. The gathered time-domain vibration signals were employed to form a reference condition model using Principle Component Analysis (PCA). The T-square control chart, type of multivariate SCCs, was adopted as health condition indicator. Researchers concluded that when tooth failures occur, the Probability Density Function (PDF) of the measured signal will change which gives good indication about the health condition. Another paper applied two statistical techniques for wind turbine gearbox CM (Zhang et al., 2012). The first technique was based on data-mining algorithms used to build a statistical model for predicting the jerk indicated by the vibration excitement of the gearbox. This model was utilized in conjunction with experimentally captured vibration signal to produce residual signals. Two control charts, X-bar and EWMA charts, were constructed to evaluate the residual and fault prediction. Another application, amongst others, of statistical control charts is for roller bearings condition monitoring. Niknam et al. (2013) at University of Tennessee investigate the use of CUSUM chart for detecting bearing failures, such as unbalance, based on acoustic emission signal analysis. Similarly, Zhou et al. (2008) presented an approach for in
situ induction motor bearing fault detection by combining noise cancellation and X-bar chart. In this study the motor current signature was analysed to extract features related to bearings deterioration. Two control charts were developed based on Shewhart average chart to identify the initial start point of the bearing defect (Wang and Zhang,
2008). These charts are named adaptive moving average chart and adaptive Shewhart average level charts. Based on these charts the researchers were able to produce warning and action limits. The findings of this study suggest that the adaptive Shewhart average level chart overcomes the drawback of adaptive moving charts by working out the limits using all the bearings’ data.
More attractive applications of SCC are for induction motors and rotating shafts health monitoring. García-Escudero et al. (2011) proposed a methodology for incipient fault detection in induction motors. They used Fast Fourier Transform (FFT) and Wavelet Transform (WT) signal processing techniques to detect significant peaks in the captured current signal. Then, a quality control approach based on multivariate T-square control chart was successfully applied to detect the progressive deterioration of the rotor cage. Another paper proposed the use of CUSMA chart to monitor the misalignment in a rotating shaft (Sun and Chang, 2004). The gathered vibration signal was fitted with an autoregressive model and the residuals between the fitted and observed vibration signals used as a monitored parameter. Control chart limits were designed using the healthy baseline residual data. The results showed that this approach was capable of detecting both mean and variance shifts and also indicate the fault severity.
The use of industrial robots has been rapidly increased in a wide range of industrial applications. Therefore, the need for reliable fault detection and diagnosis methods for industrial robots has been increased recently. However, in the reviewed work in the area of industrial robot health monitoring was noted that much of the work was focused on using many computationally intensive artificial intelligence techniques, such as neural network and support vector machines, for robot health monitoring, meaning that the health monitoring system is difficult to develop, needs a lot of training datasets and taking a long time. However, the SCC techniques have not yet been investigated for the robot Condition Monitoring (CM). Thus, in this study, an effort to fill part of the gap in the subject of industrial robot CM by using the SCC technique will be assessed using vibration signal analysis.
Principle of Control Charts
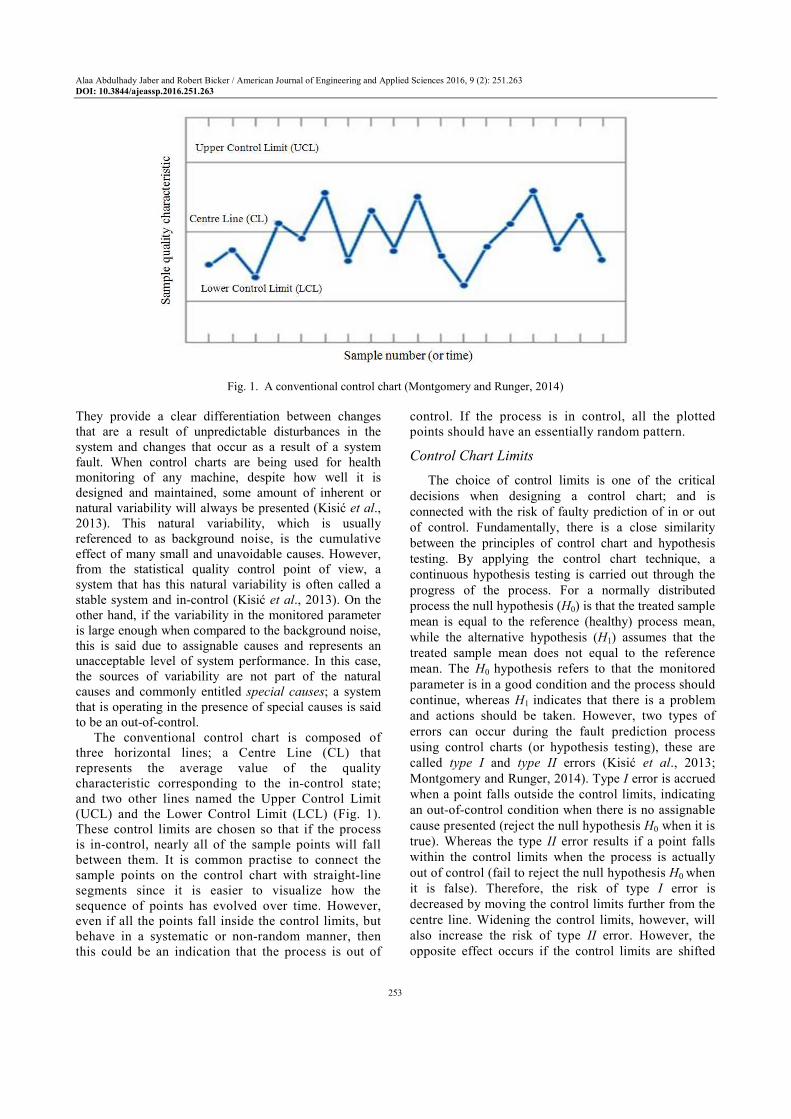
Control charts are a statistical tool for graphically displaying a quality characteristic plotted against the sample number (or time) with a centre line and two (upper and lower) control limits (Montgomery and Runger, 2014), as illustrated in Fig. 1. Control charts represent one of the most important and widely applied methods for detection of abnormal process operations based on process variables such as dimensions, temperature, vibration and forces etc.
Alaa Abdulhady Jaber and Robert Bicker / American Journal of Engineering and Applied Sciences 2016, 9 (2): 251.263 DOI: 10.3844/ajeassp.2016.251.263
253
Fig. 1. A conventional control chart (Montgomery and Runger, 2014) They provide a clear differentiation between changes that are a result of unpredictable disturbances in the system and changes that occur as a result of a system fault. When control charts are being used for health monitoring of any machine, despite how well it is designed and maintained, some amount of inherent or natural variability will always be presented (Kisić et al., 2013). This natural variability, which is usually referenced to as background noise, is the cumulative effect of many small and unavoidable causes. However, from the statistical quality control point of view, a system that has this natural variability is often called a stable system and in-control (Kisić et al., 2013). On the other hand, if the variability in the monitored parameter is large enough when compared to the background noise, this is said due to assignable causes and represents an unacceptable level of system performance. In this case, the sources of variability are not part of the natural causes and commonly entitled special causes; a system that is operating in the presence of special causes is said to be an out-of-control.
The conventional control chart is composed of three horizontal lines; a Centre Line (CL) that represents the average value of the quality characteristic corresponding to the in-control state; and two other lines named the Upper Control Limit (UCL) and the Lower Control Limit (LCL) (Fig. 1). These control limits are chosen so that if the process is in-control, nearly all of the sample points will fall between them. It is common practise to connect the sample points on the control chart with straight-line segments since it is easier to visualize how the sequence of points has evolved over time. However, even if all the points fall inside the control limits, but behave in a systematic or non-random manner, then this could be an indication that the process is out of
control. If the process is in control, all the plotted points should have an essentially random pattern.
Control Chart Limits
The choice of control limits is one of the critical decisions when designing a control chart; and is connected with the risk of faulty prediction of in or out of control. Fundamentally, there is a close similarity between the principles of control chart and hypothesis testing. By applying the control chart technique, a continuous hypothesis testing is carried out through the progress of the process. For a normally distributed process the null hypothesis (H0) is that the treated sample mean is equal to the reference (healthy) process mean, while the alternative hypothesis (H1) assumes that the treated sample mean does not equal to the reference mean. The H0 hypothesis refers to that the monitored parameter is in a good condition and the process should continue, whereas H1 indicates that there is a problem and actions should be taken. However, two types of errors can occur during the fault prediction process using control charts (or hypothesis testing), these are called type I and type II errors (Kisić et al., 2013; Montgomery and Runger, 2014). Type I error is accrued when a point falls outside the control limits, indicating an out-of-control condition when there is no assignable cause presented (reject the null hypothesis H0 when it is true). Whereas the type II error results if a point falls within the control limits when the process is actually out of control (fail to reject the null hypothesis H0 when it is false). Therefore, the risk of type I error is decreased by moving the control limits further from the centre line. Widening the control limits, however, will also increase the risk of type II error. However, the opposite effect occurs if the control limits are shifted
Alaa Abdulhady Jaber and Robert Bicker / American Journal of Engineering and Applied Sciences 2016, 9 (2): 251.263 DOI: 10.3844/ajeassp.2016.251.263
254
closer to the centre line. The general mathematical formulation for a control chart is Equation 1 to 3:
wCL µ= (1)
W WUCL kµ σ= + (2)
W WLCL kµ σ= − (3)
where, W is a sample statistic that measures some quality characteristic of interest and µw and σw are its mean and standard deviation, respectively, while k represents the distance of the control limits from the CL, expressed in standard deviation units. The common practice is to make the UCL and LCL equal three standard deviations (three-sigma) from the CL of the monitored data, i.e., k = 3. By using three-sigma control limits it is assumed that the distribution of the quality characteristics is approximately normally distributed. Then, by doing so it is presumed that while the system is in statistical control, nearly 99.7% of the points will fall within the control limits (Montgomery and Runger, 2014; Khan, 2013). In this way, a good balance is made between type I and II errors. In addition to the three-sigma limits, additional warning limits can be utilized. These are named the inner limits, usually placed at two-sigma (El-Din et al., 2006).
The Experimental Set-Up
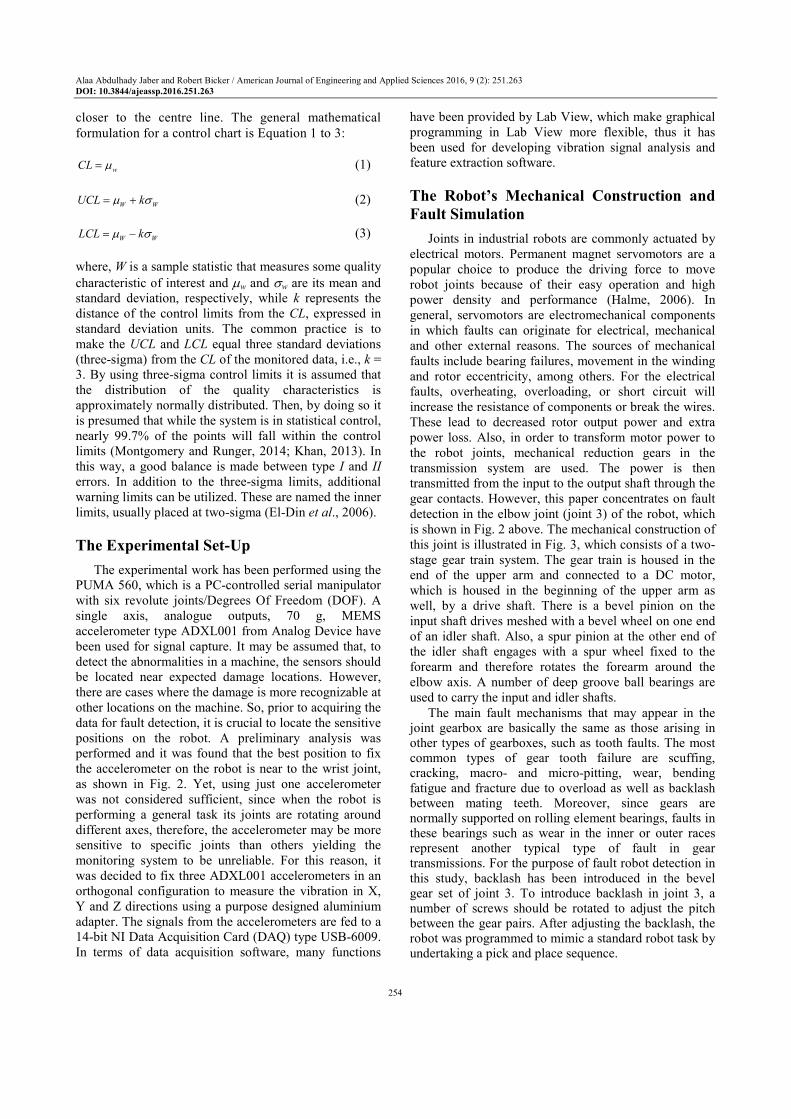
The experimental work has been performed using the PUMA 560, which is a PC-controlled serial manipulator with six revolute joints/Degrees Of Freedom (DOF). A single axis, analogue outputs, 70 g, MEMS accelerometer type ADXL001 from Analog Device have been used for signal capture. It may be assumed that, to detect the abnormalities in a machine, the sensors should be located near expected damage locations. However, there are cases where the damage is more recognizable at other locations on the machine. So, prior to acquiring the data for fault detection, it is crucial to locate the sensitive positions on the robot. A preliminary analysis was performed and it was found that the best position to fix the accelerometer on the robot is near to the wrist joint, as shown in Fig. 2. Yet, using just one accelerometer was not considered sufficient, since when the robot is performing a general task its joints are rotating around different axes, therefore, the accelerometer may be more sensitive to specific joints than others yielding the monitoring system to be unreliable. For this reason, it was decided to fix three ADXL001 accelerometers in an orthogonal configuration to measure the vibration in X, Y and Z directions using a purpose designed aluminium adapter. The signals from the accelerometers are fed to a 14-bit NI Data Acquisition Card (DAQ) type USB-6009. In terms of data acquisition software, many functions
have been provided by Lab View, which make graphical programming in Lab View more flexible, thus it has been used for developing vibration signal analysis and feature extraction software.
The Robot’s Mechanical Construction and
Fault Simulation
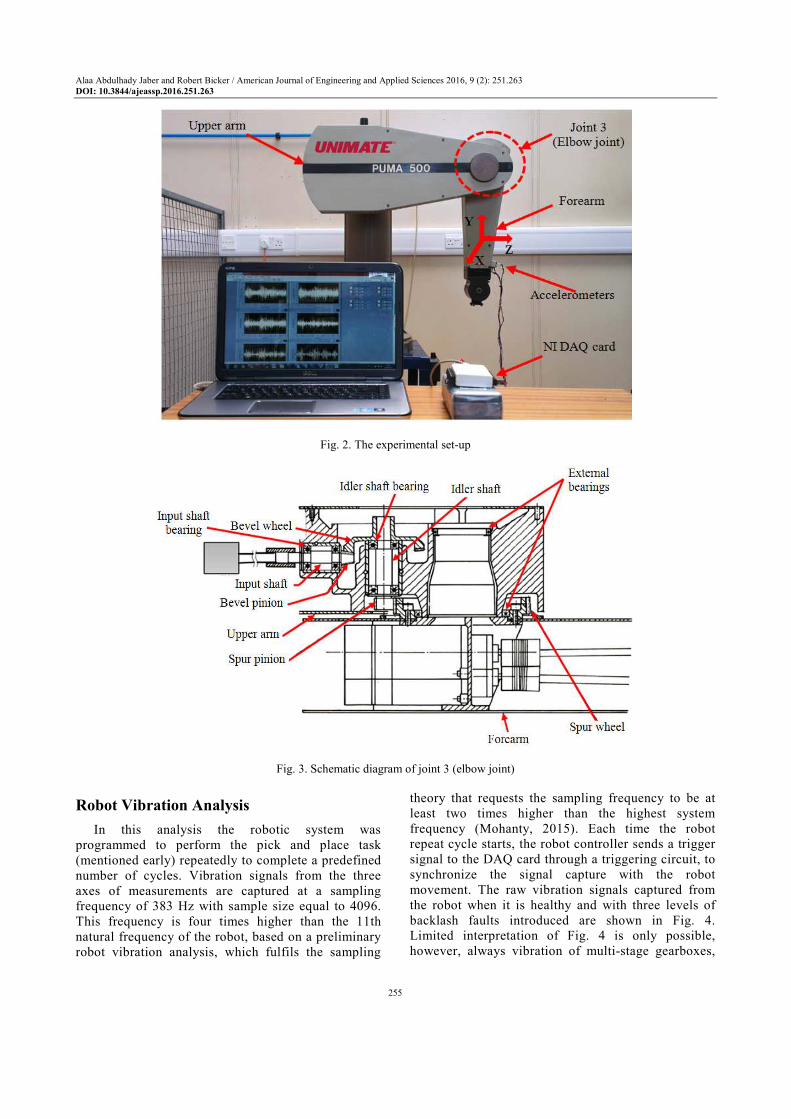
Joints in industrial robots are commonly actuated by electrical motors. Permanent magnet servomotors are a popular choice to produce the driving force to move robot joints because of their easy operation and high power density and performance (Halme, 2006). In general, servomotors are electromechanical components in which faults can originate for electrical, mechanical and other external reasons. The sources of mechanical faults include bearing failures, movement in the winding and rotor eccentricity, among others. For the electrical faults, overheating, overloading, or short circuit will increase the resistance of components or break the wires. These lead to decreased rotor output power and extra power loss. Also, in order to transform motor power to the robot joints, mechanical reduction gears in the transmission system are used. The power is then transmitted from the input to the output shaft through the gear contacts. However, this paper concentrates on fault detection in the elbow joint (joint 3) of the robot, which is shown in Fig. 2 above. The mechanical construction of this joint is illustrated in Fig. 3, which consists of a two-stage gear train system. The gear train is housed in the end of the upper arm and connected to a DC motor, which is housed in the beginning of the upper arm as well, by a drive shaft. There is a bevel pinion on the input shaft drives meshed with a bevel wheel on one end of an idler shaft. Also, a spur pinion at the other end of the idler shaft engages with a spur wheel fixed to the forearm and therefore rotates the forearm around the elbow axis. A number of deep groove ball bearings are used to carry the input and idler shafts.
The main fault mechanisms that may appear in the joint gearbox are basically the same as those arising in other types of gearboxes, such as tooth faults. The most common types of gear tooth failure are scuffing, cracking, macro- and micro-pitting, wear, bending fatigue and fracture due to overload as well as backlash between mating teeth. Moreover, since gears are normally supported on rolling element bearings, faults in these bearings such as wear in the inner or outer races represent another typical type of fault in gear transmissions. For the purpose of fault robot detection in this study, backlash has been introduced in the bevel gear set of joint 3. To introduce backlash in joint 3, a number of screws should be rotated to adjust the pitch between the gear pairs. After adjusting the backlash, the robot was programmed to mimic a standard robot task by undertaking a pick and place sequence.
Alaa Abdulhady Jaber and Robert Bicker / American Journal of Engineering and Applied Sciences 2016, 9 (2): 251.263 DOI: 10.3844/ajeassp.2016.251.263
255
Fig. 2. The experimental set-up
Fig. 3. Schematic diagram of joint 3 (elbow joint)
Robot Vibration Analysis
In this analysis the robotic system was programmed to perform the pick and place task (mentioned early) repeatedly to complete a predefined number of cycles. Vibration signals from the three axes of measurements are captured at a sampling frequency of 383 Hz with sample size equal to 4096. This frequency is four times higher than the 11th natural frequency of the robot, based on a preliminary robot vibration analysis, which fulfils the sampling
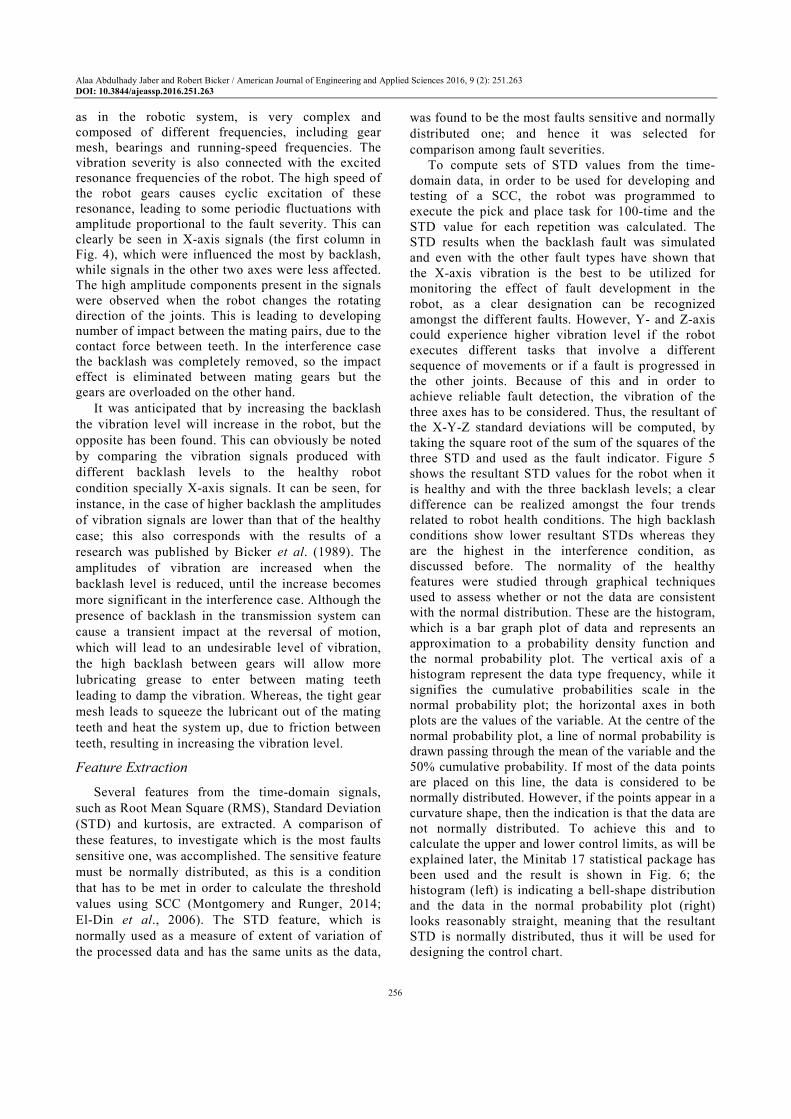
theory that requests the sampling frequency to be at least two times higher than the highest system frequency (Mohanty, 2015). Each time the robot repeat cycle starts, the robot controller sends a trigger signal to the DAQ card through a triggering circuit, to synchronize the signal capture with the robot movement. The raw vibration signals captured from the robot when it is healthy and with three levels of backlash faults introduced are shown in Fig. 4. Limited interpretation of Fig. 4 is only possible, however, always vibration of multi-stage gearboxes,
Alaa Abdulhady Jaber and Robert Bicker / American Journal of Engineering and Applied Sciences 2016, 9 (2): 251.263 DOI: 10.3844/ajeassp.2016.251.263
256
as in the robotic system, is very complex and composed of different frequencies, including gear mesh, bearings and running-speed frequencies. The vibration severity is also connected with the excited resonance frequencies of the robot. The high speed of the robot gears causes cyclic excitation of these resonance, leading to some periodic fluctuations with amplitude proportional to the fault severity. This can clearly be seen in X-axis signals (the first column in Fig. 4), which were influenced the most by backlash, while signals in the other two axes were less affected. The high amplitude components present in the signals were observed when the robot changes the rotating direction of the joints. This is leading to developing number of impact between the mating pairs, due to the contact force between teeth. In the interference case the backlash was completely removed, so the impact effect is eliminated between mating gears but the gears are overloaded on the other hand.
It was anticipated that by increasing the backlash the vibration level will increase in the robot, but the opposite has been found. This can obviously be noted by comparing the vibration signals produced with different backlash levels to the healthy robot condition specially X-axis signals. It can be seen, for instance, in the case of higher backlash the amplitudes of vibration signals are lower than that of the healthy case; this also corresponds with the results of a research was published by Bicker et al. (1989). The amplitudes of vibration are increased when the backlash level is reduced, until the increase becomes more significant in the interference case. Although the presence of backlash in the transmission system can cause a transient impact at the reversal of motion, which will lead to an undesirable level of vibration, the high backlash between gears will allow more lubricating grease to enter between mating teeth leading to damp the vibration. Whereas, the tight gear mesh leads to squeeze the lubricant out of the mating teeth and heat the system up, due to friction between teeth, resulting in increasing the vibration level.
Feature Extraction
Several features from the time-domain signals, such as Root Mean Square (RMS), Standard Deviation (STD) and kurtosis, are extracted. A comparison of these features, to investigate which is the most faults sensitive one, was accomplished. The sensitive feature must be normally distributed, as this is a condition that has to be met in order to calculate the threshold values using SCC (Montgomery and Runger, 2014; El-Din et al., 2006). The STD feature, which is normally used as a measure of extent of variation of the processed data and has the same units as the data,
was found to be the most faults sensitive and normally distributed one; and hence it was selected for comparison among fault severities.
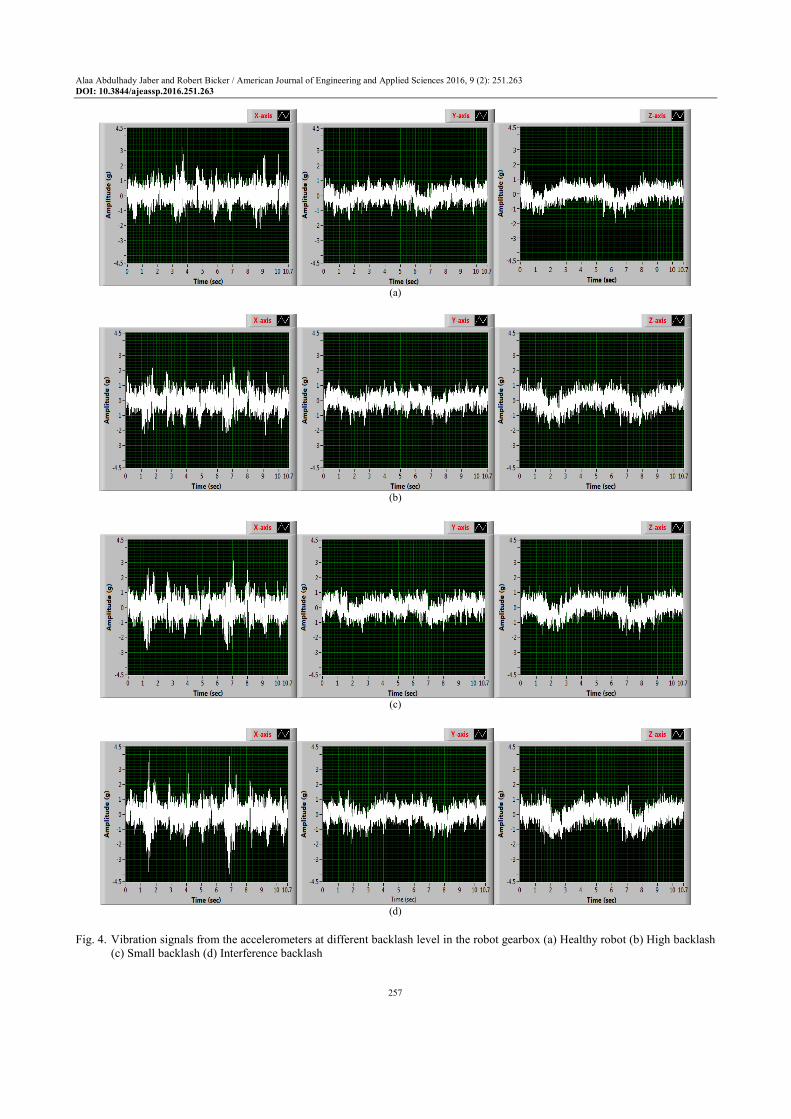
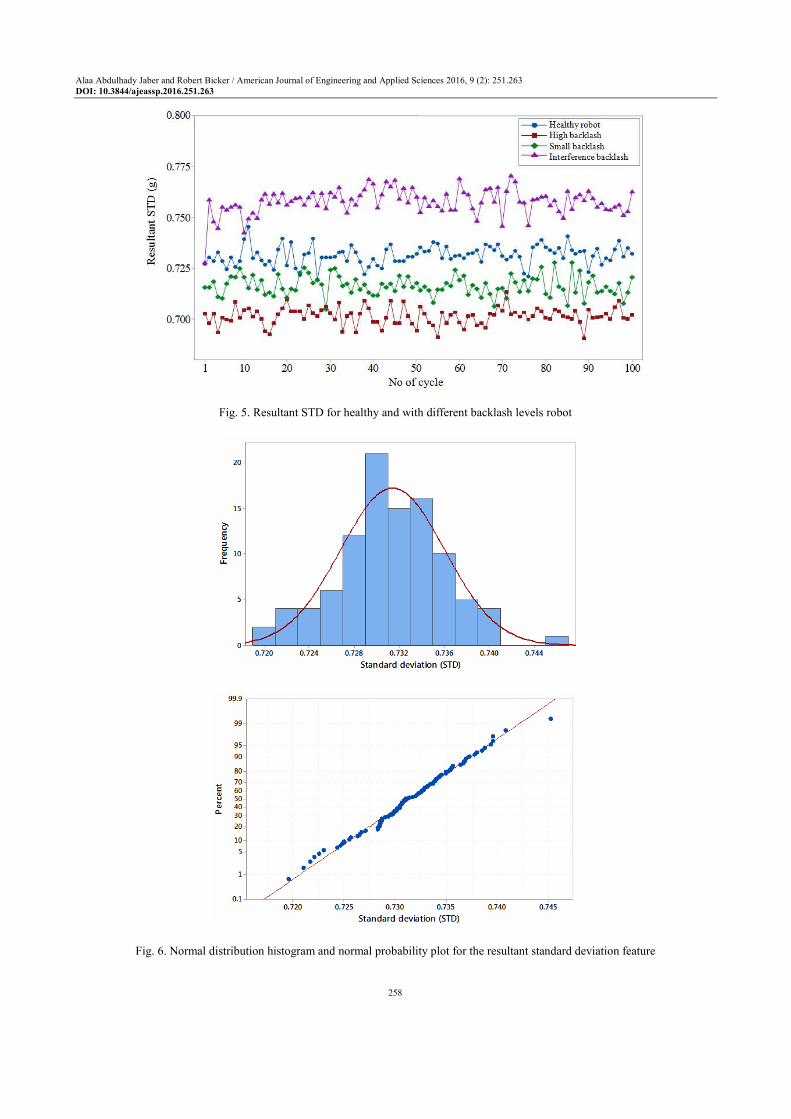
To compute sets of STD values from the time-domain data, in order to be used for developing and testing of a SCC, the robot was programmed to execute the pick and place task for 100-time and the STD value for each repetition was calculated. The STD results when the backlash fault was simulated and even with the other fault types have shown that the X-axis vibration is the best to be utilized for monitoring the effect of fault development in the robot, as a clear designation can be recognized amongst the different faults. However, Y- and Z-axis could experience higher vibration level if the robot executes different tasks that involve a different sequence of movements or if a fault is progressed in the other joints. Because of this and in order to achieve reliable fault detection, the vibration of the three axes has to be considered. Thus, the resultant of the X-Y-Z standard deviations will be computed, by taking the square root of the sum of the squares of the three STD and used as the fault indicator. Figure 5 shows the resultant STD values for the robot when it is healthy and with the three backlash levels; a clear difference can be realized amongst the four trends related to robot health conditions. The high backlash conditions show lower resultant STDs whereas they are the highest in the interference condition, as discussed before. The normality of the healthy features were studied through graphical techniques used to assess whether or not the data are consistent with the normal distribution. These are the histogram, which is a bar graph plot of data and represents an approximation to a probability density function and the normal probability plot. The vertical axis of a histogram represent the data type frequency, while it signifies the cumulative probabilities scale in the normal probability plot; the horizontal axes in both plots are the values of the variable. At the centre of the normal probability plot, a line of normal probability is drawn passing through the mean of the variable and the 50% cumulative probability. If most of the data points are placed on this line, the data is considered to be normally distributed. However, if the points appear in a curvature shape, then the indication is that the data are not normally distributed. To achieve this and to calculate the upper and lower control limits, as will be explained later, the Minitab 17 statistical package has been used and the result is shown in Fig. 6; the histogram (left) is indicating a bell-shape distribution and the data in the normal probability plot (right) looks reasonably straight, meaning that the resultant STD is normally distributed, thus it will be used for designing the control chart.
Alaa Abdulhady Jaber and Robert Bicker / American Journal of Engineering and Applied Sciences 2016, 9 (2): 251.263 DOI: 10.3844/ajeassp.2016.251.263
257
(a)
(b)
(c)
(d)
Fig. 4. Vibration signals from the accelerometers at different backlash level in the robot gearbox (a) Healthy robot (b) High backlash
(c) Small backlash (d) Interference backlash
Alaa Abdulhady Jaber and Robert Bicker / American Journal of Engineering and Applied Sciences 2016, 9 (2): 251.263 DOI: 10.3844/ajeassp.2016.251.263
258
Fig. 5. Resultant STD for healthy and with different backlash levels robot
Fig. 6. Normal distribution histogram and normal probability plot for the resultant standard deviation feature
Alaa Abdulhady Jaber and Robert Bicker / American Journal of Engineering and Applied Sciences 2016, 9 (2): 251.263 DOI: 10.3844/ajeassp.2016.251.263
259
Control Chart Design
The most commonly used control charts are: Shewhart, Cumulative Sum (CUSUM), Exponentially Weighted Moving Average (EWMA), which are called univariate charts and T-square control chart, which is one of multivariate control charts. Shewhart control charts are the most popular charts used for process monitoring and can be easily implemented since they do not require a lot of computational effort; and for this reason has been used here, based on the following discussion.
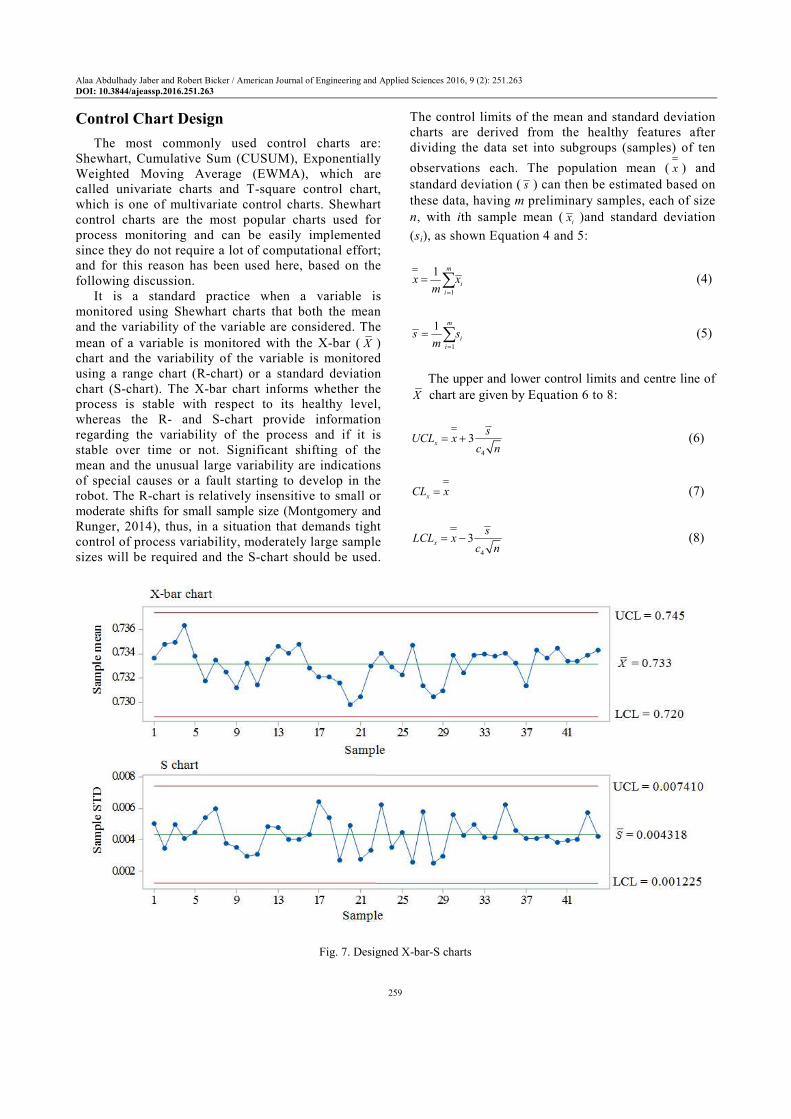
It is a standard practice when a variable is monitored using Shewhart charts that both the mean and the variability of the variable are considered. The mean of a variable is monitored with the X-bar ( X ) chart and the variability of the variable is monitored using a range chart (R-chart) or a standard deviation chart (S-chart). The X-bar chart informs whether the process is stable with respect to its healthy level, whereas the R- and S-chart provide information regarding the variability of the process and if it is stable over time or not. Significant shifting of the mean and the unusual large variability are indications of special causes or a fault starting to develop in the robot. The R-chart is relatively insensitive to small or moderate shifts for small sample size (Montgomery and Runger, 2014), thus, in a situation that demands tight control of process variability, moderately large sample sizes will be required and the S-chart should be used.
The control limits of the mean and standard deviation charts are derived from the healthy features after dividing the data set into subgroups (samples) of ten
observations each. The population mean ( x ) and standard deviation ( s ) can then be estimated based on these data, having m preliminary samples, each of size n, with ith sample mean (
ix )and standard deviation
(si), as shown Equation 4 and 5:
1
1 m
i
i
x xm =
= ∑ (4)
1
1 m
i
i
s sm =
= ∑ (5)
The upper and lower control limits and centre line of
X chart are given by Equation 6 to 8:
4
3x
sUCL x
c n= + (6)
xCL x= (7)
4
3x
sLCL x
c n= − (8)
Fig. 7. Designed X-bar-S charts
Alaa Abdulhady Jaber and Robert Bicker / American Journal of Engineering and Applied Sciences 2016, 9 (2): 251.263 DOI: 10.3844/ajeassp.2016.251.263
260
And the upper and lower control limits and centre line of S-chart are Equation 9 to 11:
24
4
3 1s
sUCL s c
c= + − (9)
sCL s= (10)
24
4
3 1s
sLCL s c
c= − − (11)
where, c4 is a tabulated constant depends on the sample size and can be found in (Montgomery and Runger, 2014). Minitab results for the X -S charts, based on the resultant STD data from the healthy robot are presented in Fig. 7. It can be seen from the charts that all the points are randomly distributed and within the control limits which means the robot is healthy.
Performance Testing of the Designed
Control Chart
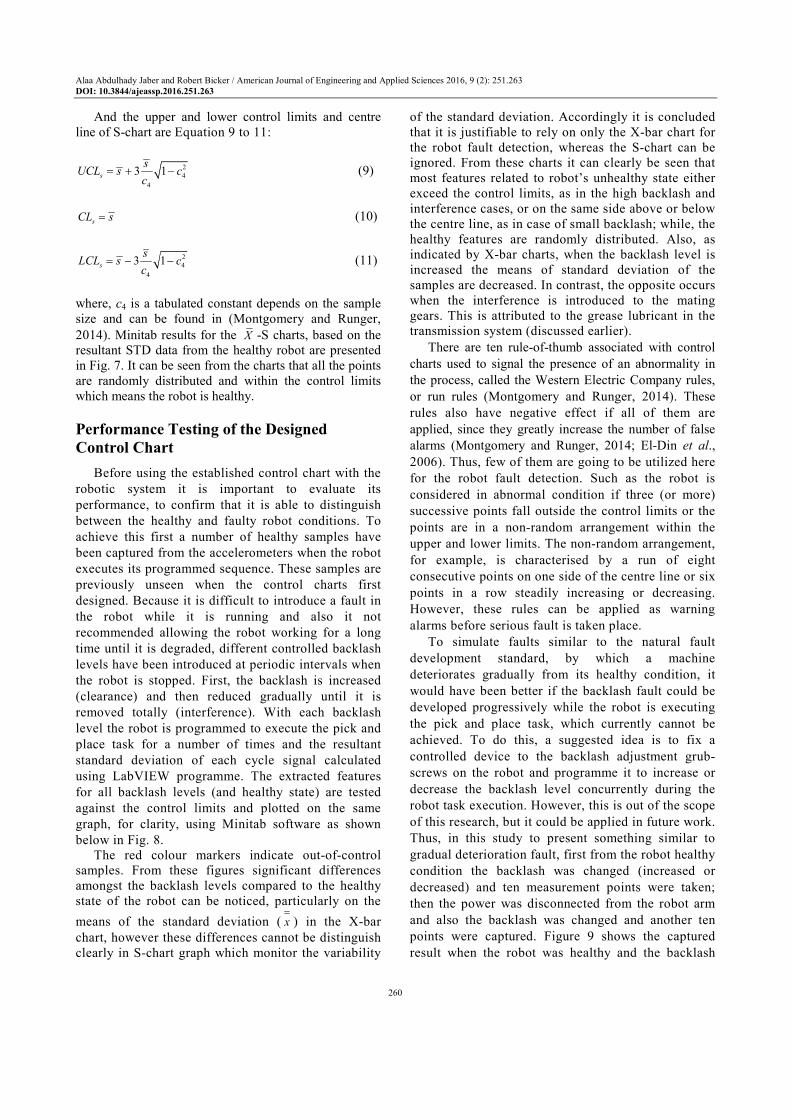
Before using the established control chart with the robotic system it is important to evaluate its performance, to confirm that it is able to distinguish between the healthy and faulty robot conditions. To achieve this first a number of healthy samples have been captured from the accelerometers when the robot executes its programmed sequence. These samples are previously unseen when the control charts first designed. Because it is difficult to introduce a fault in the robot while it is running and also it not recommended allowing the robot working for a long time until it is degraded, different controlled backlash levels have been introduced at periodic intervals when the robot is stopped. First, the backlash is increased (clearance) and then reduced gradually until it is removed totally (interference). With each backlash level the robot is programmed to execute the pick and place task for a number of times and the resultant standard deviation of each cycle signal calculated using LabVIEW programme. The extracted features for all backlash levels (and healthy state) are tested against the control limits and plotted on the same graph, for clarity, using Minitab software as shown below in Fig. 8.
The red colour markers indicate out-of-control samples. From these figures significant differences amongst the backlash levels compared to the healthy state of the robot can be noticed, particularly on the
means of the standard deviation ( x ) in the X-bar chart, however these differences cannot be distinguish clearly in S-chart graph which monitor the variability
of the standard deviation. Accordingly it is concluded that it is justifiable to rely on only the X-bar chart for the robot fault detection, whereas the S-chart can be ignored. From these charts it can clearly be seen that most features related to robot’s unhealthy state either exceed the control limits, as in the high backlash and interference cases, or on the same side above or below the centre line, as in case of small backlash; while, the healthy features are randomly distributed. Also, as indicated by X-bar charts, when the backlash level is increased the means of standard deviation of the samples are decreased. In contrast, the opposite occurs when the interference is introduced to the mating gears. This is attributed to the grease lubricant in the transmission system (discussed earlier).
There are ten rule-of-thumb associated with control charts used to signal the presence of an abnormality in the process, called the Western Electric Company rules, or run rules (Montgomery and Runger, 2014). These rules also have negative effect if all of them are applied, since they greatly increase the number of false alarms (Montgomery and Runger, 2014; El-Din et al., 2006). Thus, few of them are going to be utilized here for the robot fault detection. Such as the robot is considered in abnormal condition if three (or more) successive points fall outside the control limits or the points are in a non-random arrangement within the upper and lower limits. The non-random arrangement, for example, is characterised by a run of eight consecutive points on one side of the centre line or six points in a row steadily increasing or decreasing. However, these rules can be applied as warning alarms before serious fault is taken place.
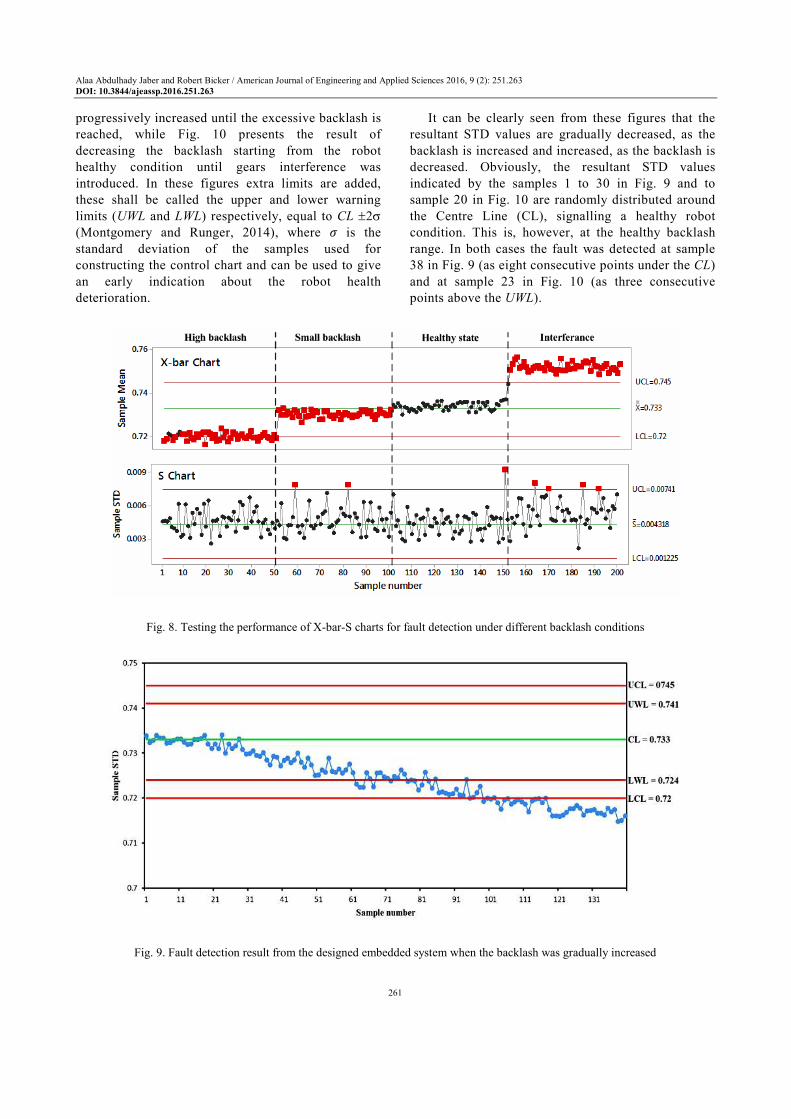
To simulate faults similar to the natural fault development standard, by which a machine deteriorates gradually from its healthy condition, it would have been better if the backlash fault could be developed progressively while the robot is executing the pick and place task, which currently cannot be achieved. To do this, a suggested idea is to fix a controlled device to the backlash adjustment grub-screws on the robot and programme it to increase or decrease the backlash level concurrently during the robot task execution. However, this is out of the scope of this research, but it could be applied in future work. Thus, in this study to present something similar to gradual deterioration fault, first from the robot healthy condition the backlash was changed (increased or decreased) and ten measurement points were taken; then the power was disconnected from the robot arm and also the backlash was changed and another ten points were captured. Figure 9 shows the captured result when the robot was healthy and the backlash
Alaa Abdulhady Jaber and Robert Bicker / American Journal of Engineering and Applied Sciences 2016, 9 (2): 251.263 DOI: 10.3844/ajeassp.2016.251.263
261
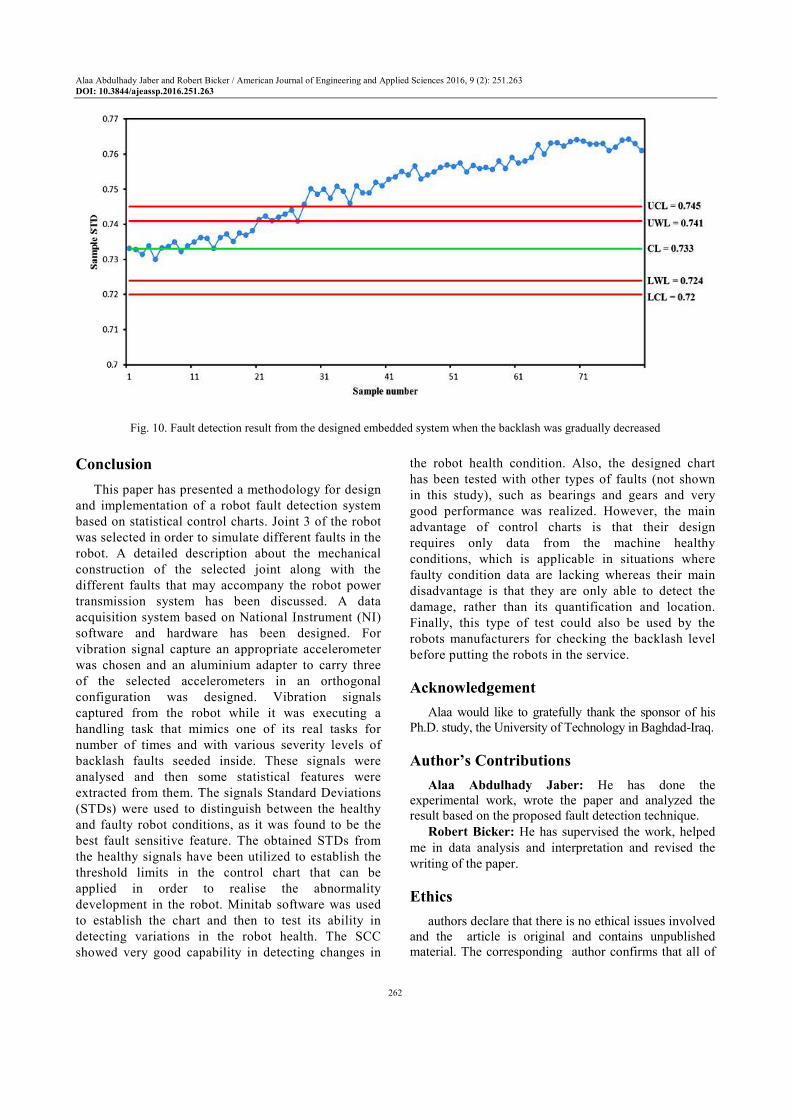
progressively increased until the excessive backlash is reached, while Fig. 10 presents the result of decreasing the backlash starting from the robot healthy condition until gears interference was introduced. In these figures extra limits are added, these shall be called the upper and lower warning limits (UWL and LWL) respectively, equal to CL ±2σ (Montgomery and Runger, 2014), where � is the standard deviation of the samples used for constructing the control chart and can be used to give an early indication about the robot health deterioration.
It can be clearly seen from these figures that the resultant STD values are gradually decreased, as the backlash is increased and increased, as the backlash is decreased. Obviously, the resultant STD values indicated by the samples 1 to 30 in Fig. 9 and to sample 20 in Fig. 10 are randomly distributed around the Centre Line (CL), signalling a healthy robot condition. This is, however, at the healthy backlash range. In both cases the fault was detected at sample 38 in Fig. 9 (as eight consecutive points under the CL) and at sample 23 in Fig. 10 (as three consecutive points above the UWL).
Fig. 8. Testing the performance of X-bar-S charts for fault detection under different backlash conditions
Fig. 9. Fault detection result from the designed embedded system when the backlash was gradually increased
Alaa Abdulhady Jaber and Robert Bicker / American Journal of Engineering and Applied Sciences 2016, 9 (2): 251.263 DOI: 10.3844/ajeassp.2016.251.263
262
Fig. 10. Fault detection result from the designed embedded system when the backlash was gradually decreased
Conclusion
This paper has presented a methodology for design and implementation of a robot fault detection system based on statistical control charts. Joint 3 of the robot was selected in order to simulate different faults in the robot. A detailed description about the mechanical construction of the selected joint along with the different faults that may accompany the robot power transmission system has been discussed. A data acquisition system based on National Instrument (NI) software and hardware has been designed. For vibration signal capture an appropriate accelerometer was chosen and an aluminium adapter to carry three of the selected accelerometers in an orthogonal configuration was designed. Vibration signals captured from the robot while it was executing a handling task that mimics one of its real tasks for number of times and with various severity levels of backlash faults seeded inside. These signals were analysed and then some statistical features were extracted from them. The signals Standard Deviations (STDs) were used to distinguish between the healthy and faulty robot conditions, as it was found to be the best fault sensitive feature. The obtained STDs from the healthy signals have been utilized to establish the threshold limits in the control chart that can be applied in order to realise the abnormality development in the robot. Minitab software was used to establish the chart and then to test its ability in detecting variations in the robot health. The SCC showed very good capability in detecting changes in
the robot health condition. Also, the designed chart has been tested with other types of faults (not shown in this study), such as bearings and gears and very good performance was realized. However, the main advantage of control charts is that their design requires only data from the machine healthy conditions, which is applicable in situations where faulty condition data are lacking whereas their main disadvantage is that they are only able to detect the damage, rather than its quantification and location. Finally, this type of test could also be used by the robots manufacturers for checking the backlash level before putting the robots in the service.
Acknowledgement
Alaa would like to gratefully thank the sponsor of his Ph.D. study, the University of Technology in Baghdad-Iraq.
Author’s Contributions
Alaa Abdulhady Jaber: He has done the experimental work, wrote the paper and analyzed the result based on the proposed fault detection technique.
Robert Bicker: He has supervised the work, helped me in data analysis and interpretation and revised the writing of the paper.
Ethics
authors declare that there is no ethical issues involved and the article is original and contains unpublished material. The corresponding author confirms that all of
Alaa Abdulhady Jaber and Robert Bicker / American Journal of Engineering and Applied Sciences 2016, 9 (2): 251.263 DOI: 10.3844/ajeassp.2016.251.263
263
the other authors have read and approved the manuscript.
References
Baydar, N., Q. Chen, A. Ball and U. Kruger, 2001. Detection of incipient tooth defect in helical gears using multivariate statistics. Mechan. Syst. Signal Process., 15: 303-321.
DOI: 10.1006/mssp.2000.1315 Bicker, R., A. Daadbin and J. Rosinski, 1989. The
monitoring of vibration in industrial robots. Proceedings of the ASME 12th Biennial Conference on Mechanical Vibration and Noise, (MVN’ 89).
El-Din, M.A.S., H.I. Rashed and M.M. El-Khabeery, 2006. Statistical process control charts applied to steelmaking quality improvement. Int. J. Q. Technol. Quantitative Manage., 3: 473-491.
García-Escudero, L.A., O. Duque-Perez, D. Morinigo-Sotelo and M. Perez-Alonso, 2011. Robust condition monitoring for early detection of broken rotor bars in induction motors. Expert Syst. Applic., 38: 2653-2660.
DOI: 10.1016/j.eswa.2010.08.055 Halme, J., 2006. Condition monitoring of a material
handling industrial robot. Proceedings of the 19th International Congress, (IC’ 06), Lulea, Sweden.
Isermann, R., 2005. Model-based fault-detection and diagnosis-Status and applications. Annual Rev. Control, 29: 71-85.
DOI: 10.1016/j.arcontrol.2004.12.002 Khan, R.M., 2013. Problem Solving and Data Analysis
using Minitab. 1st Edn., John Wiley and Sons, Chichester, ISBN-10: 1118307526, pp: 488.
Kisić, E., V. Petrović, M. Jakovljević and Ž. Đurović, 2013. Fault detection in electric power systems based on control charts. Serbian J. Electr. Eng., 10: 73-90. DOI: 10.2298/sjee1301073k
Mohanty, A.R., 2015. Machinerycondition monitoring: Principles and practices. Taylor and Francis Group.
Montgomery, D.C. and G.C. Runger, 2014. Applied Statistics and Probability for Engineers. 6th Edn., John Wiley and Sons Incorporated, Hoboken,
ISBN-10: 1118744128, pp: 765. Niknam, S.A., T. Thomas, J. Wesley Hines and R.
Sawhney, 2013. Analysis of acoustic emission data for bearings subject to unbalance. Int. J. Prognost. Health Manage., 4: 1-10.
Shiroishi, J., Y. Li, S. Liang, T. Kurfess and S. Danyluk, 1997. Bearing condition diagnostics via vibration and acoustic emission measurements. Mechan. Syst. Signal Process., 11: 693-705.
DOI: 10.1006/mssp.1997.0113
Spong, M.W., S. Hutchinson and M. Vidyasagar, 2005. Robot Modeling and Control. 1st Edn., Wiley, ISBN-10: 0471649902, pp: 496.
Sun, Z. and C.C. Chang, 2004. Statistical wavelet-based method for structural health monitoring. J. Structural Eng., 130: 1055-1062.
DOI: 10.1061/(ASCE)0733-9445(2004)130:7(1055) Wang, W. and W. Zhang, 2008. Early defect
identification: Application of statistical process control methods. J. Q. Maintenance Eng., 14: 225-236. DOI: 10.1108/13552510810899445
Yadav, S.K. and P.K. Kalra, 2010. Condition Monitoring of Internal Combustion Engine Using EMD and HMM. In: Intelligent Autonomous Systems, Pratihar, D.K. and L.C. Jain (Eds.), Springer,
ISBN-10: 3642116752, pp: 167-185. Zhang, Z., A. Verma and A. Kusiak, 2012. Fault analysis
and condition monitoring of the wind turbine gearbox. IEEE Trans. Energy Convers., 27: 526-535. DOI: 10.1109/TEC.2012.2189887
Zhou, W., T.G. Habetler and R.G. Harley, 2008. Bearing fault detection via stator current noise cancellation and statistical control. IEEE Trans. Indust. Electr., 55: 4260-4269. DOI: 10.1109/TIE.2008.2005018