Industrial Recession Proof Asset Report
53
INDUSTRIAL: THE RECESSION-PROOF ASSET CLASS? SEPTEMBER 2020 CUSHMAN & WAKEFIELD RESEARCH PUBLICATION
Transcript of Industrial Recession Proof Asset Report

INDUSTRIAL: THE RECESSION-PROOF ASSET CLASS? SEPTEMBER 2020
CUSHMAN & WAKEFIELD RESEARCH PUBLICATION

CLICK TO GO TO MARKET OVERVIEW
FEATURED MARKETS
North America Summary ......................................2Atlanta ......................................................................... 4Calgary, Canada ....................................................... 6Chicago ........................................................................8Cincinnati ................................................................. 10Columbus ..................................................................12Dallas-Fort Worth ..................................................14Denver ........................................................................16Detroit ........................................................................18Houston ....................................................................20Indianapolis .............................................................22Inland Empire .........................................................24Kansas City ..............................................................26Los Angeles .............................................................28Miami ..........................................................................30Montreal, Canada ..................................................32Nashville ...................................................................34New Jersey ..............................................................36Orlando .....................................................................38Pennsylvania I-81/I-78 Corridor ...................... 40Phoenix .....................................................................42St. Louis ................................................................... 44Tampa ........................................................................46Toronto, Canada ....................................................48Vancouver, Canada ...............................................50
WWW.CUSHMANWAKEFIELD.COM 2
INDUSTRIAL: THE RECESSION-PROOF ASSET CLASS?
WASHINGTON, DC
WWW.CUSHMANWAKEFIELD.COM 2
INDUSTRIAL: THE RECESSION-PROOF ASSET CLASS?
HOW DOES NORTH AMERICA STACK UP?
NORTH AMERICA
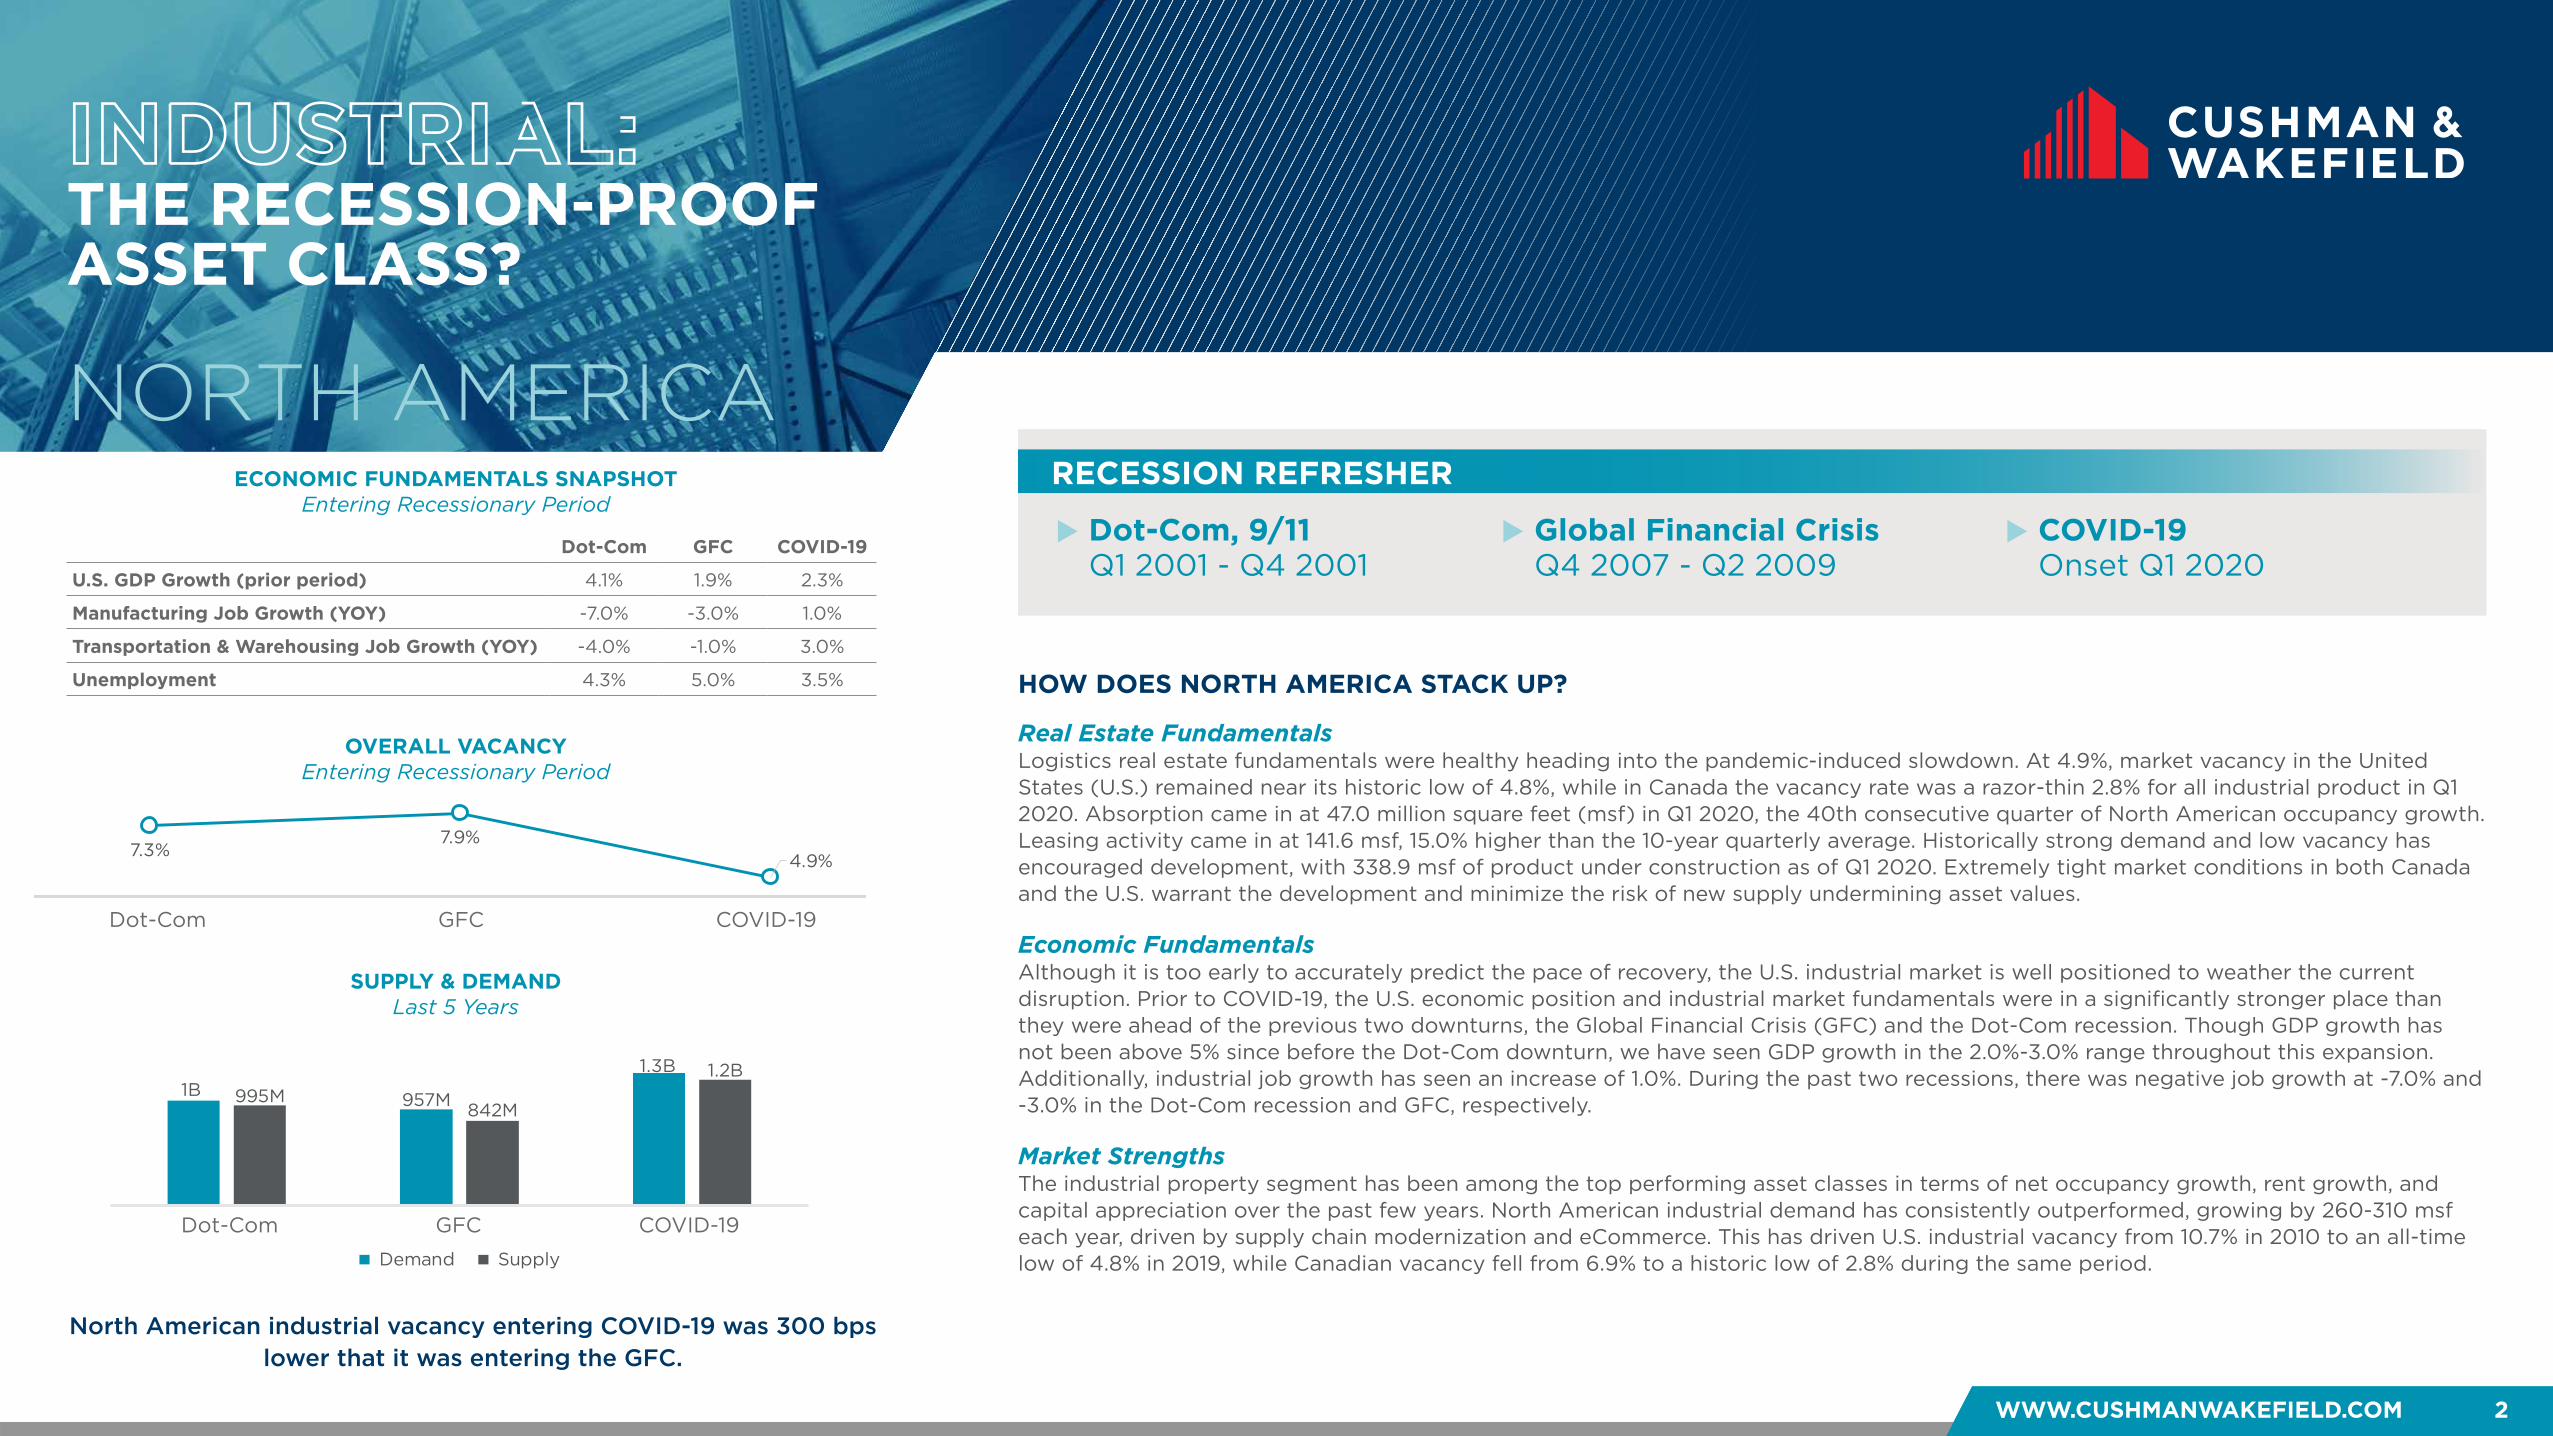
Real Estate FundamentalsLogistics real estate fundamentals were healthy heading into the pandemic-induced slowdown. At 4.9%, market vacancy in the United States (U.S.) remained near its historic low of 4.8%, while in Canada the vacancy rate was a razor-thin 2.8% for all industrial product in Q1 2020. Absorption came in at 47.0 million square feet (msf) in Q1 2020, the 40th consecutive quarter of North American occupancy growth. Leasing activity came in at 141.6 msf, 15.0% higher than the 10-year quarterly average. Historically strong demand and low vacancy has encouraged development, with 338.9 msf of product under construction as of Q1 2020. Extremely tight market conditions in both Canada and the U.S. warrant the development and minimize the risk of new supply undermining asset values.
Economic FundamentalsAlthough it is too early to accurately predict the pace of recovery, the U.S. industrial market is well positioned to weather the current disruption. Prior to COVID-19, the U.S. economic position and industrial market fundamentals were in a significantly stronger place than they were ahead of the previous two downturns, the Global Financial Crisis (GFC) and the Dot-Com recession. Though GDP growth has not been above 5% since before the Dot-Com downturn, we have seen GDP growth in the 2.0%-3.0% range throughout this expansion. Additionally, industrial job growth has seen an increase of 1.0%. During the past two recessions, there was negative job growth at -7.0% and -3.0% in the Dot-Com recession and GFC, respectively.
Market StrengthsThe industrial property segment has been among the top performing asset classes in terms of net occupancy growth, rent growth, and capital appreciation over the past few years. North American industrial demand has consistently outperformed, growing by 260-310 msf each year, driven by supply chain modernization and eCommerce. This has driven U.S. industrial vacancy from 10.7% in 2010 to an all-time low of 4.8% in 2019, while Canadian vacancy fell from 6.9% to a historic low of 2.8% during the same period.
North American industrial vacancy entering COVID-19 was 300 bps lower that it was entering the GFC.
Dot-Com GFC COVID-19
U.S. GDP Growth (prior period) 4.1% 1.9% 2.3%
Manufacturing Job Growth (YOY) -7.0% -3.0% 1.0%
Transportation & Warehousing Job Growth (YOY) -4.0% -1.0% 3.0%
Unemployment 4.3% 5.0% 3.5%
1B 957M
1.3B
995M842M
1.2B
Dot Com Financial Crisis COVID-19
Demand Supply
RECESSION REFRESHER
Dot-Com, 9/11Q1 2001 - Q4 2001
Global Financial CrisisQ4 2007 - Q2 2009
COVID-19Onset Q1 2020
OVERALL VACANCYEntering Recessionary Period
SUPPLY & DEMANDLast 5 Years
ECONOMIC FUNDAMENTALS SNAPSHOTEntering Recessionary Period
7.3%7.9%
4.9%
Dot Com Financial Crisis COVID-19Dot-Com GFC COVID-19
Dot-Com GFC COVID-19
WHAT’S DIFFERENT THIS TIME?
HEADWINDS TAILWINDS
WHAT CAN WE EXPECT GOING FORWARD?
WWW.CUSHMANWAKEFIELD.COM 3
PLACEHOLDER (4-qtr r.0olling)
WASHINGTON, DC Things to watch that may impact the industrial market
WHAT’S DIFFERENT THIS TIME?
HEADWINDS TAILWINDS
WHAT CAN WE EXPECT GOING FORWARD?
WWW.CUSHMANWAKEFIELD.COM 3
Things to watch that may impact the industrial market
NORTH AMERICA
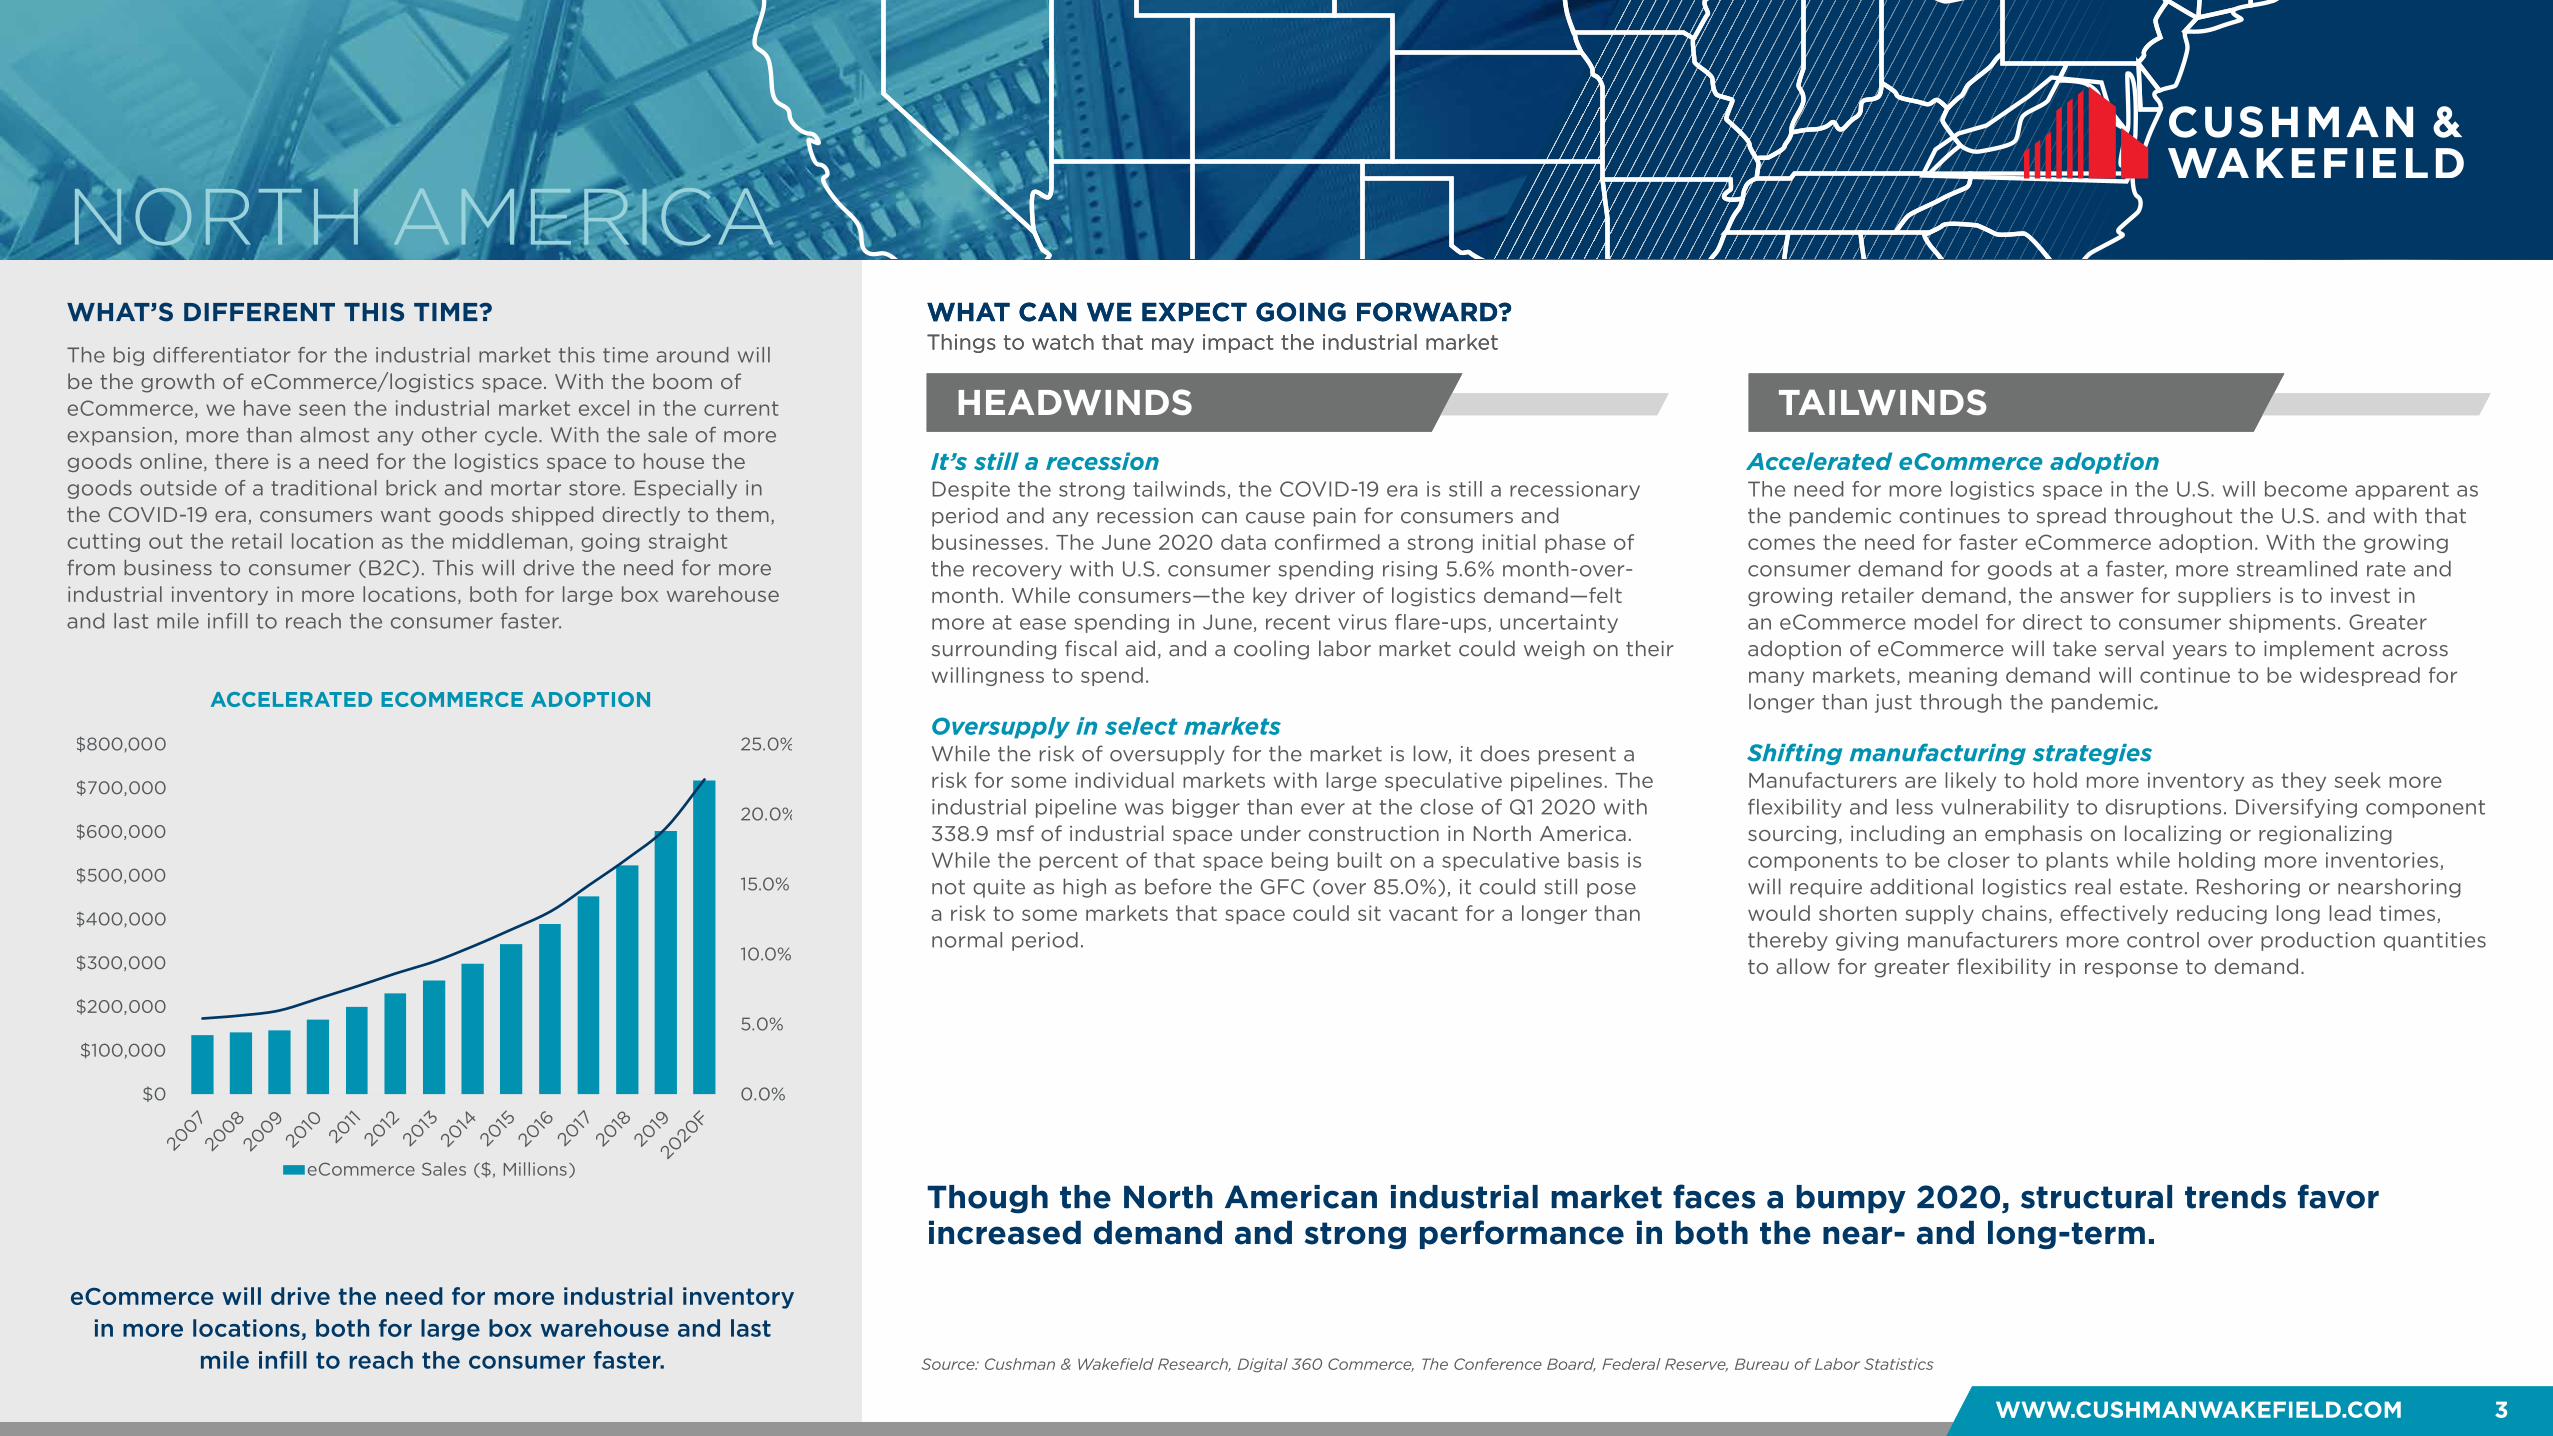
ACCELERATED ECOMMERCE ADOPTION
The big differentiator for the industrial market this time around will be the growth of eCommerce/logistics space. With the boom of eCommerce, we have seen the industrial market excel in the current expansion, more than almost any other cycle. With the sale of more goods online, there is a need for the logistics space to house the goods outside of a traditional brick and mortar store. Especially in the COVID-19 era, consumers want goods shipped directly to them, cutting out the retail location as the middleman, going straight from business to consumer (B2C). This will drive the need for more industrial inventory in more locations, both for large box warehouse and last mile infill to reach the consumer faster.
eCommerce will drive the need for more industrial inventory in more locations, both for large box warehouse and last
mile infill to reach the consumer faster.
0.0%
5.0%
10.0%
15.0%
20.0%
25.0%
$0
$100,000
$200,000
$300,000
$400,000
$500,000
$600,000
$700,000
$800,000
eCommerce Sales ($, Millions)
It’s still a recession Despite the strong tailwinds, the COVID-19 era is still a recessionary period and any recession can cause pain for consumers and businesses. The June 2020 data confirmed a strong initial phase of the recovery with U.S. consumer spending rising 5.6% month-over-month. While consumers—the key driver of logistics demand—felt more at ease spending in June, recent virus flare-ups, uncertainty surrounding fiscal aid, and a cooling labor market could weigh on their willingness to spend.
Oversupply in select marketsWhile the risk of oversupply for the market is low, it does present a risk for some individual markets with large speculative pipelines. The industrial pipeline was bigger than ever at the close of Q1 2020 with 338.9 msf of industrial space under construction in North America. While the percent of that space being built on a speculative basis is not quite as high as before the GFC (over 85.0%), it could still pose a risk to some markets that space could sit vacant for a longer than normal period.
Accelerated eCommerce adoptionThe need for more logistics space in the U.S. will become apparent as the pandemic continues to spread throughout the U.S. and with that comes the need for faster eCommerce adoption. With the growing consumer demand for goods at a faster, more streamlined rate and growing retailer demand, the answer for suppliers is to invest in an eCommerce model for direct to consumer shipments. Greater adoption of eCommerce will take serval years to implement across many markets, meaning demand will continue to be widespread for longer than just through the pandemic.
Shifting manufacturing strategiesManufacturers are likely to hold more inventory as they seek more flexibility and less vulnerability to disruptions. Diversifying component sourcing, including an emphasis on localizing or regionalizing components to be closer to plants while holding more inventories, will require additional logistics real estate. Reshoring or nearshoring would shorten supply chains, effectively reducing long lead times, thereby giving manufacturers more control over production quantities to allow for greater flexibility in response to demand.
Though the North American industrial market faces a bumpy 2020, structural trends favor increased demand and strong performance in both the near- and long-term.
Source: Cushman & Wakefield Research, Digital 360 Commerce, The Conference Board, Federal Reserve, Bureau of Labor Statistics

WWW.CUSHMANWAKEFIELD.COM 4
INDUSTRIAL: THE RECESSION-PROOF ASSET CLASS?
17.2M14.1M
18.7M16.2M
8.9M
19.6M
Dot Com Financial Crisis COVID-19
Despite an unprecedented development boom in recent years, vacancy entering COVID-19 was 150 bps lower than
it was heading into the previous downturn.
Dot-Com GFC COVID-19
Industrial Production* 96.6 110.3 105.5
Manufacturing Job Growth (YOY) -2.6% -1.8% 1.1%
Transportation & Warehousing Job Growth (YOY) 1.6% 0.3% 2.3%
Unemployment 3.1% 4.7% 3.0%
Real Estate FundamentalsHeading into the current downturn, the Atlanta industrial market fundamentals were experiencing record-breaking performance. Since its low point in mid-2012, the average asking rental rate has been on a tear as Atlanta began to emerge as a true logistics hub for the Southeast, climbing 20.0% since the GFC to $4.00. The overall warehouse/distribution (W/D) vacancy rate held steady at 7.7% after falling to an all-time low in late 2019. Following two years of the strongest lease activity on record in 2018 and 2019 (28.8 msf and 31.5 msf respectively), Atlanta recorded its healthiest quarter of new demand in two years, with more than 9.9 msf of new leases signed in Q1 2020. In response to prolonged demand for premier space and the constraints of the existing inventory, development has boomed in Atlanta. Vacancy has continued to fall dramatically since the GFC recovery, despite 97.5 msf of new product being added to the warehouse inventory.
Economic FundamentalsAtlanta is among the top five metros in the country in net migration. Beginning in the 1990s, Atlanta’s landscape started to change dramatically as the city began to emerge as a key U.S. region, partially due to hosting the 1996 Olympic Games. Over the past 20 years, Atlanta has grown to more than 3 million jobs, climbing 32.0% or by 727,000 jobs. With a GMP of $452B, the metro is among the 10 largest economies in the U.S. More than 33,000 supply chain and logistics technology jobs exist in Georgia, up 35.0% over the past decade. The supply chain and logistics industry alone has a statewide economic impact of $10.4 billion.
Market StrengthsAtlanta is the economic and social engine of the Southeast and a key logistics hub for the U.S. More than 80.0% of the U.S. population is within a two-hour flight or two-day drive from the city. By land, over 4,600 railroad miles span across the Georgia landscape. By air, Hartsfield-Jackson International Airport has been ranked the #1 most efficient and #1 busiest airport in the world since 1998 with 2,700 flights daily. The airport recorded an 8.2% year-over-year (YOY) increase in global trade volume in 2019, while the U.S. total decreased 1.5% over the same period. By sea, the Port of Savannah is the fastest-growing container port in North America and holds 208.0% of the market share among U.S. East Coast ports.
More than 85% of the world’s top third-party logistics (3PLs) operate in Georgia, and Metro Atlanta has emerged as a critical hub for eCommerce firms. Atlanta is home to the UPS SMART hub, a regional super hub and their second-largest ground package facility in the U.S., capable of processing 100,000 packages per hour. Though Metro Atlanta boasts a diverse industrial tenant base, eCommerce, 3PLs, and food and beverage firms are the key drivers of activity.
*Index 2012=100Source: Cushman & Wakefield Research, Bureau of Labor Statistics (2020), Moody’s Analytics (2020), Board of Governors of the Federal Reserve System (2020), Metro Atlanta Chamber
3.0% 1.8%7.4%
Dot Com Financial Crisis COVID-19
8.0%9.2%
7.7%
1 2 3
ATLANTA HOW DOES ATLANTA STACK UP?
ECONOMIC FUNDAMENTALS SNAPSHOTEntering Recessionary Period
OVERALL VACANCYEntering Recessionary Period
SUPPLY & DEMAND4-qtr. Rolling
12.3M 12.3M
8.2M
12.3M9.9M
11.8M
Dot Com Financial Crisis COVID-19
Net Absorption Deliveries
Dot-Com GFC COVID-19
Dot-Com GFC COVID-19
WHAT’S DIFFERENT THIS TIME?
HEADWINDS TAILWINDS
WHAT CAN WE EXPECT GOING FORWARD?
WWW.CUSHMANWAKEFIELD.COM 5
Things to watch that may impact the industrial market
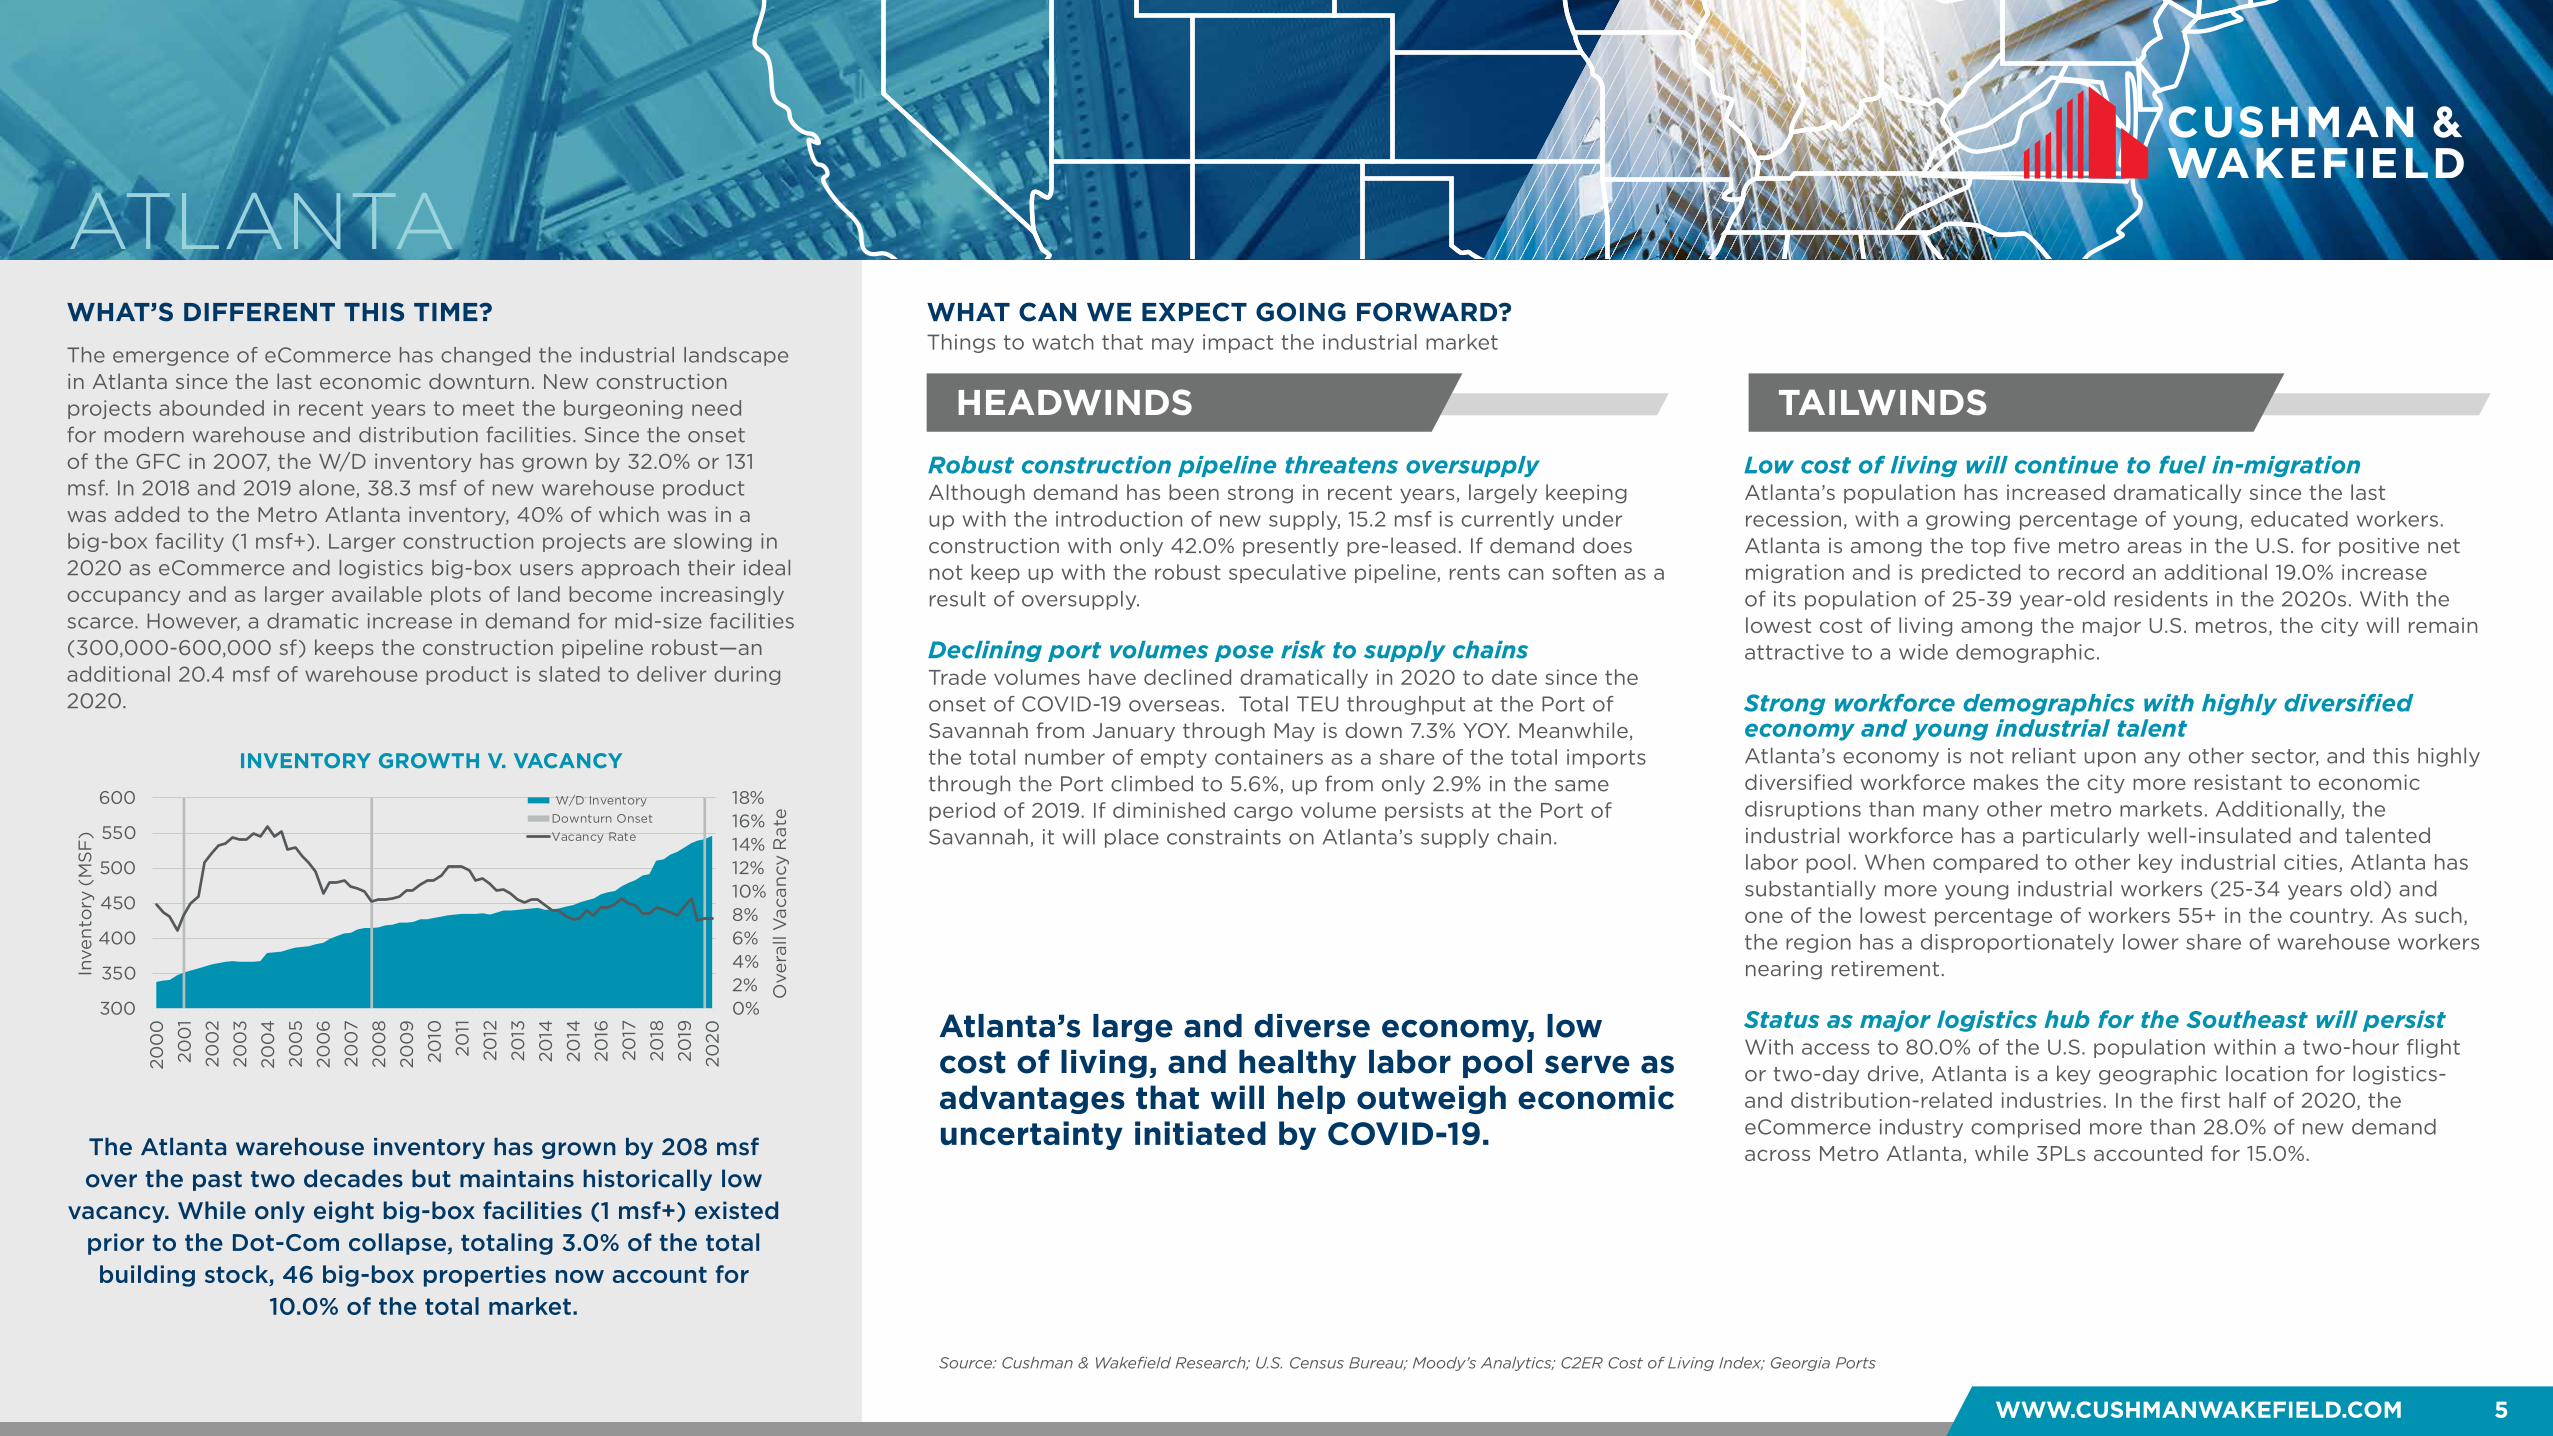
INVENTORY GROWTH V. VACANCY
Robust construction pipeline threatens oversupply Although demand has been strong in recent years, largely keeping up with the introduction of new supply, 15.2 msf is currently under construction with only 42.0% presently pre-leased. If demand does not keep up with the robust speculative pipeline, rents can soften as a result of oversupply. Declining port volumes pose risk to supply chains Trade volumes have declined dramatically in 2020 to date since the onset of COVID-19 overseas. Total TEU throughput at the Port of Savannah from January through May is down 7.3% YOY. Meanwhile, the total number of empty containers as a share of the total imports through the Port climbed to 5.6%, up from only 2.9% in the same period of 2019. If diminished cargo volume persists at the Port of Savannah, it will place constraints on Atlanta’s supply chain.
Low cost of living will continue to fuel in-migration Atlanta’s population has increased dramatically since the last recession, with a growing percentage of young, educated workers. Atlanta is among the top five metro areas in the U.S. for positive net migration and is predicted to record an additional 19.0% increase of its population of 25-39 year-old residents in the 2020s. With the lowest cost of living among the major U.S. metros, the city will remain attractive to a wide demographic. Strong workforce demographics with highly diversified economy and young industrial talent Atlanta’s economy is not reliant upon any other sector, and this highly diversified workforce makes the city more resistant to economic disruptions than many other metro markets. Additionally, the industrial workforce has a particularly well-insulated and talented labor pool. When compared to other key industrial cities, Atlanta has substantially more young industrial workers (25-34 years old) and one of the lowest percentage of workers 55+ in the country. As such, the region has a disproportionately lower share of warehouse workers nearing retirement. Status as major logistics hub for the Southeast will persist With access to 80.0% of the U.S. population within a two-hour flight or two-day drive, Atlanta is a key geographic location for logistics- and distribution-related industries. In the first half of 2020, the eCommerce industry comprised more than 28.0% of new demand across Metro Atlanta, while 3PLs accounted for 15.0%.The Atlanta warehouse inventory has grown by 208 msf
over the past two decades but maintains historically low vacancy. While only eight big-box facilities (1 msf+) existed
prior to the Dot-Com collapse, totaling 3.0% of the total building stock, 46 big-box properties now account for
10.0% of the total market.
The emergence of eCommerce has changed the industrial landscape in Atlanta since the last economic downturn. New construction projects abounded in recent years to meet the burgeoning need for modern warehouse and distribution facilities. Since the onset of the GFC in 2007, the W/D inventory has grown by 32.0% or 131 msf. In 2018 and 2019 alone, 38.3 msf of new warehouse product was added to the Metro Atlanta inventory, 40% of which was in a big-box facility (1 msf+). Larger construction projects are slowing in 2020 as eCommerce and logistics big-box users approach their ideal occupancy and as larger available plots of land become increasingly scarce. However, a dramatic increase in demand for mid-size facilities (300,000-600,000 sf) keeps the construction pipeline robust—an additional 20.4 msf of warehouse product is slated to deliver during 2020.
Source: Cushman & Wakefield Research; U.S. Census Bureau; Moody’s Analytics; C2ER Cost of Living Index; Georgia Ports
0%2%4%6%8%10%12%14%16%18%
300
350
400
450
500
550
600
200
020
01
200
220
03
200
420
05
200
620
07
200
820
09
2010
2011
2012
2013
2014
2014
2016
2017
2018
2019
2020
Ove
rall
Vac
ancy
Rat
e
Inve
nto
ry (
MS
F)
W/D InventoryDownturn OnsetVacancy Rate
Atlanta’s large and diverse economy, low cost of living, and healthy labor pool serve as advantages that will help outweigh economic uncertainty initiated by COVID-19.
ATLANTA
WWW.CUSHMANWAKEFIELD.COM 6
OVERALL VACANCYEntering Recessionary Period
SUPPLY & DEMANDLast 5 Years
ECONOMIC FUNDAMENTALS SNAPSHOTEntering Recessionary Period
INDUSTRIAL: THE RECESSION-PROOF ASSET CLASS?
HOW DOES CALGARY STACK UP?
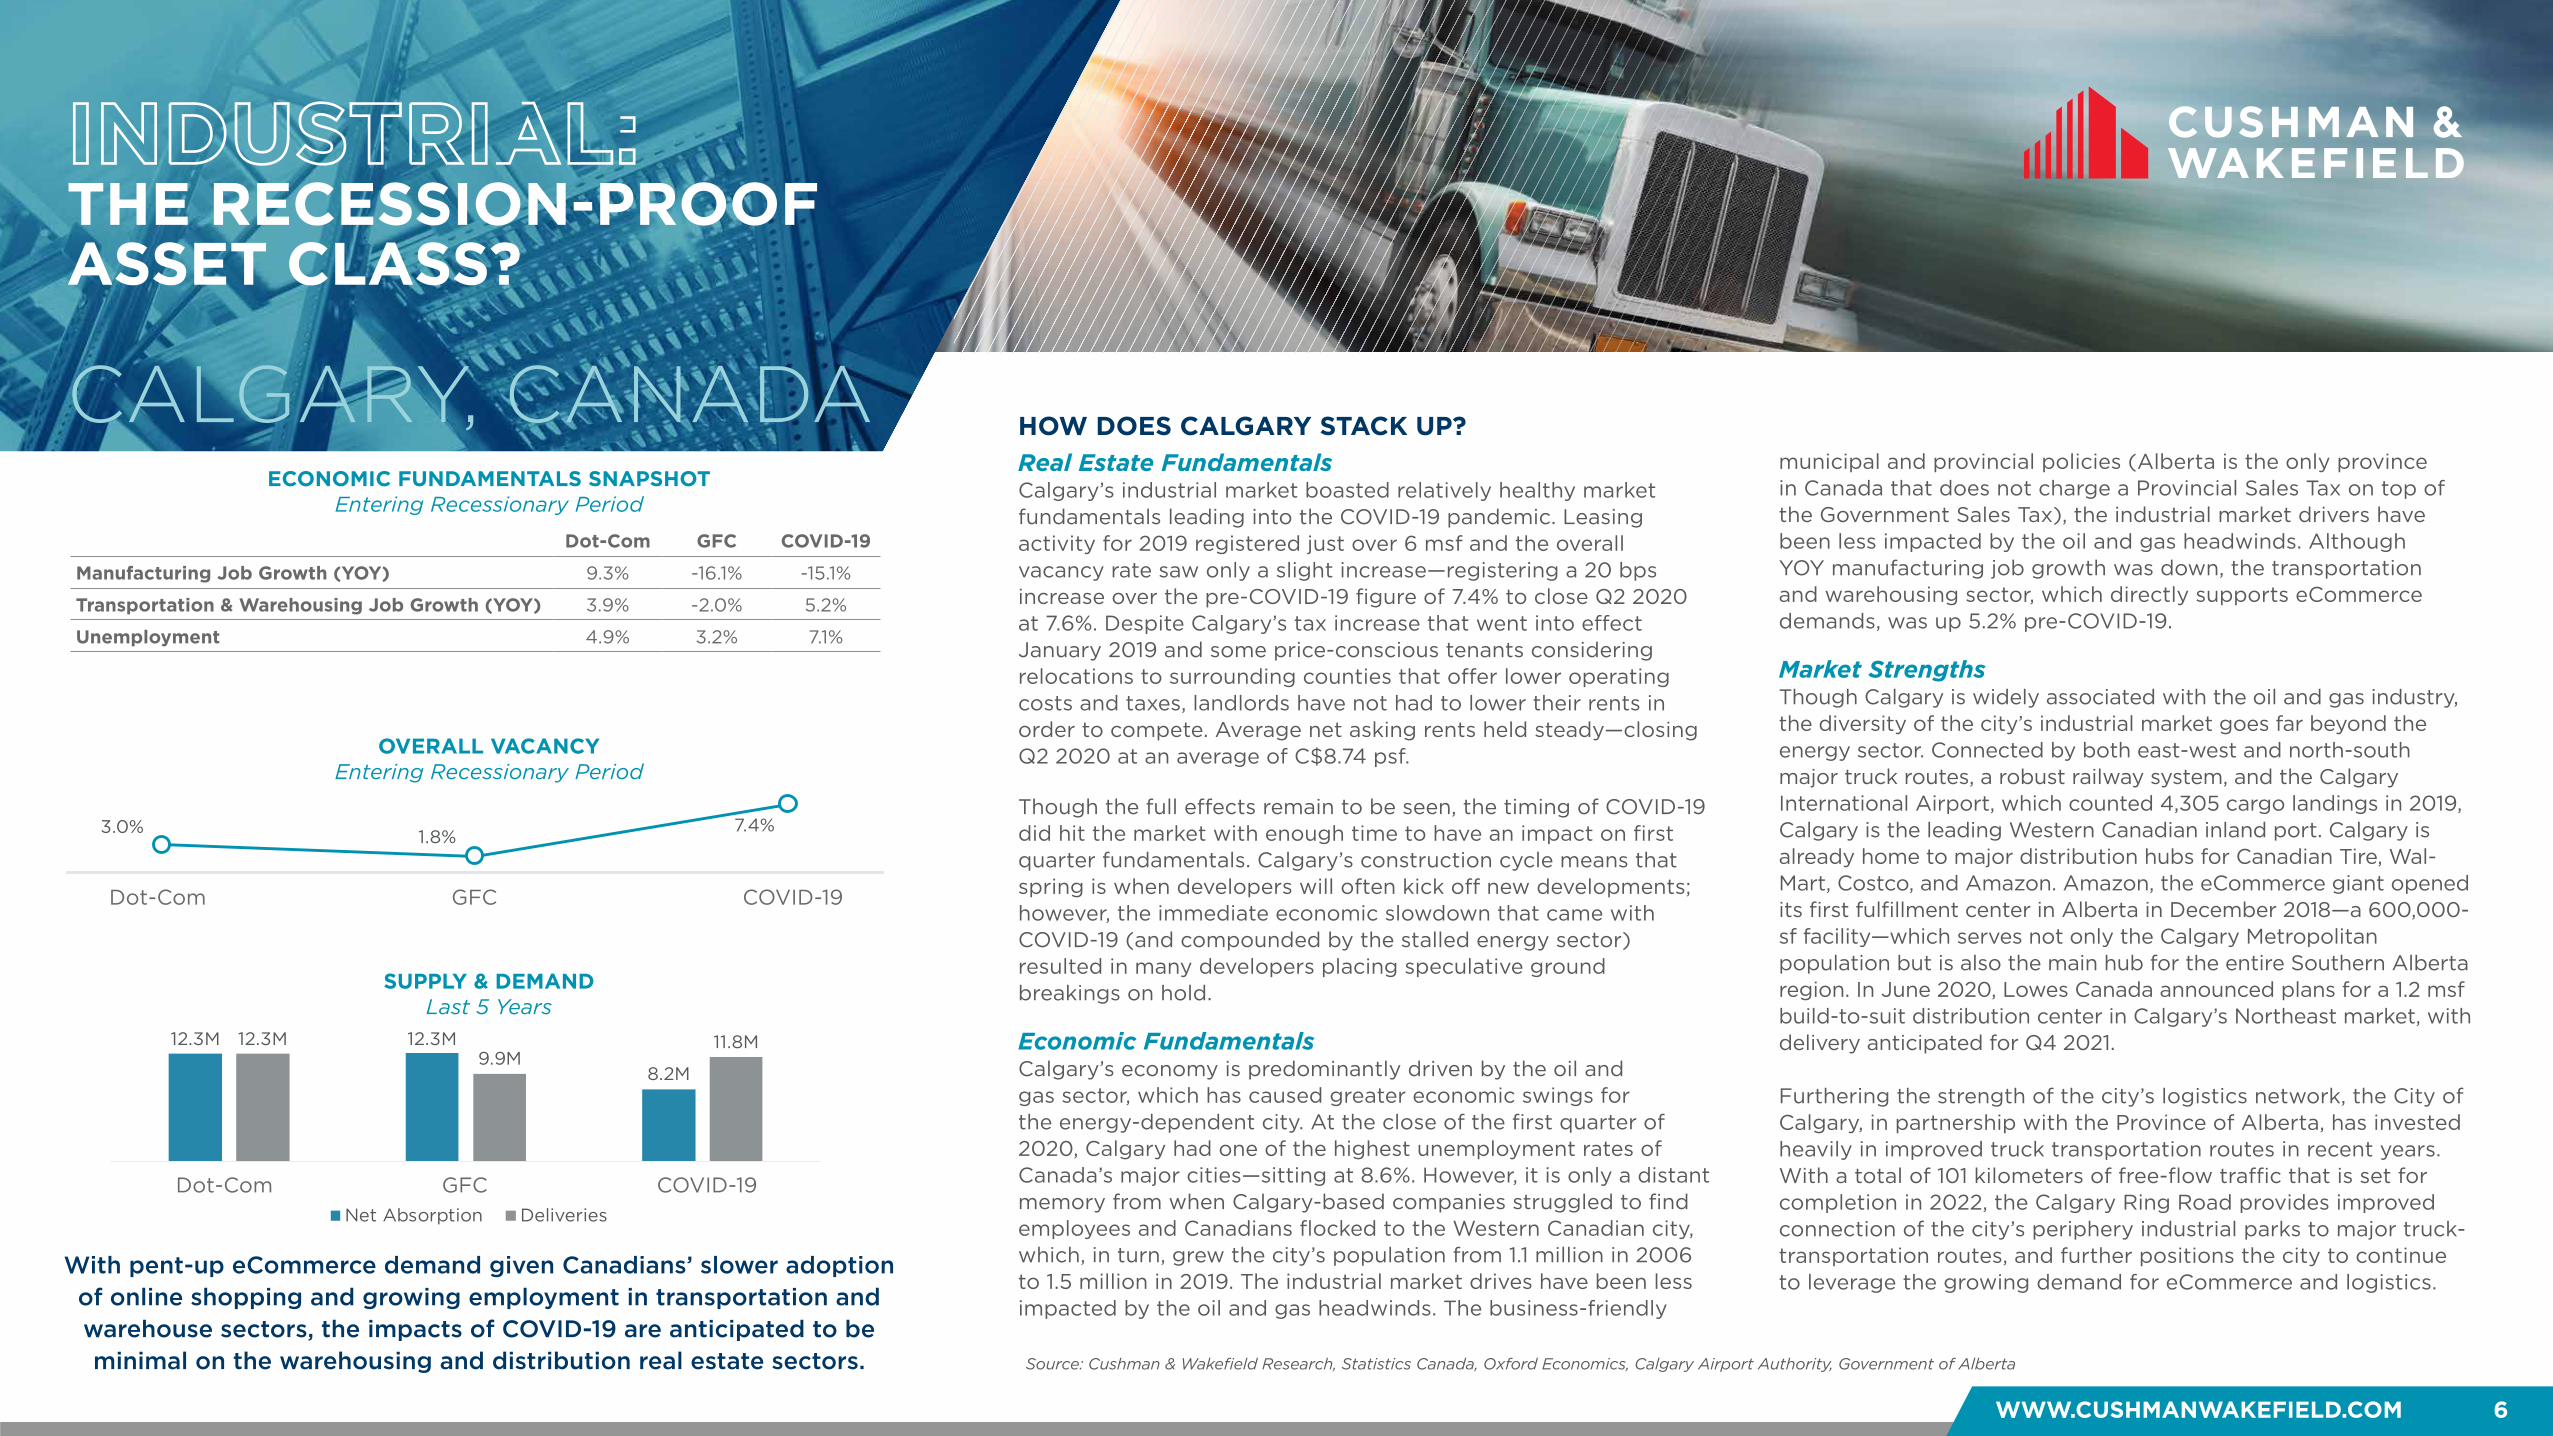
Dot-Com GFC COVID-19
Manufacturing Job Growth (YOY) 9.3% -16.1% -15.1%
Transportation & Warehousing Job Growth (YOY) 3.9% -2.0% 5.2%
Unemployment 4.9% 3.2% 7.1%
Real Estate FundamentalsCalgary’s industrial market boasted relatively healthy market fundamentals leading into the COVID-19 pandemic. Leasing activity for 2019 registered just over 6 msf and the overall vacancy rate saw only a slight increase—registering a 20 bps increase over the pre-COVID-19 figure of 7.4% to close Q2 2020 at 7.6%. Despite Calgary’s tax increase that went into effect January 2019 and some price-conscious tenants considering relocations to surrounding counties that offer lower operating costs and taxes, landlords have not had to lower their rents in order to compete. Average net asking rents held steady—closing Q2 2020 at an average of C$8.74 psf.
Though the full effects remain to be seen, the timing of COVID-19 did hit the market with enough time to have an impact on first quarter fundamentals. Calgary’s construction cycle means that spring is when developers will often kick off new developments; however, the immediate economic slowdown that came with COVID-19 (and compounded by the stalled energy sector) resulted in many developers placing speculative ground breakings on hold.
Economic FundamentalsCalgary’s economy is predominantly driven by the oil and gas sector, which has caused greater economic swings for the energy-dependent city. At the close of the first quarter of 2020, Calgary had one of the highest unemployment rates of Canada’s major cities—sitting at 8.6%. However, it is only a distant memory from when Calgary-based companies struggled to find employees and Canadians flocked to the Western Canadian city, which, in turn, grew the city’s population from 1.1 million in 2006 to 1.5 million in 2019. The industrial market drives have been less impacted by the oil and gas headwinds. The business-friendly
municipal and provincial policies (Alberta is the only province in Canada that does not charge a Provincial Sales Tax on top of the Government Sales Tax), the industrial market drivers have been less impacted by the oil and gas headwinds. Although YOY manufacturing job growth was down, the transportation and warehousing sector, which directly supports eCommerce demands, was up 5.2% pre-COVID-19.
Market StrengthsThough Calgary is widely associated with the oil and gas industry, the diversity of the city’s industrial market goes far beyond the energy sector. Connected by both east-west and north-south major truck routes, a robust railway system, and the Calgary International Airport, which counted 4,305 cargo landings in 2019, Calgary is the leading Western Canadian inland port. Calgary is already home to major distribution hubs for Canadian Tire, Wal-Mart, Costco, and Amazon. Amazon, the eCommerce giant opened its first fulfillment center in Alberta in December 2018—a 600,000-sf facility—which serves not only the Calgary Metropolitan population but is also the main hub for the entire Southern Alberta region. In June 2020, Lowes Canada announced plans for a 1.2 msf build-to-suit distribution center in Calgary’s Northeast market, with delivery anticipated for Q4 2021.
Furthering the strength of the city’s logistics network, the City of Calgary, in partnership with the Province of Alberta, has invested heavily in improved truck transportation routes in recent years. With a total of 101 kilometers of free-flow traffic that is set for completion in 2022, the Calgary Ring Road provides improved connection of the city’s periphery industrial parks to major truck-transportation routes, and further positions the city to continue to leverage the growing demand for eCommerce and logistics.
Source: Cushman & Wakefield Research, Statistics Canada, Oxford Economics, Calgary Airport Authority, Government of Alberta
With pent-up eCommerce demand given Canadians’ slower adoption of online shopping and growing employment in transportation and warehouse sectors, the impacts of COVID-19 are anticipated to be minimal on the warehousing and distribution real estate sectors.
3.0% 1.8%7.4%
Dot Com Financial Crisis COVID-19
12.3M 12.3M
8.2M
12.3M9.9M
11.8M
Dot Com Financial Crisis COVID-19
Net Absorption Deliveries
CALGARY, CANADA
Dot-Com GFC COVID-19
Dot-Com GFC COVID-19
WHAT’S DIFFERENT THIS TIME?
HEADWINDS TAILWINDS
WHAT CAN WE EXPECT GOING FORWARD?
WWW.CUSHMANWAKEFIELD.COM 7
Things to watch that may impact the industrial market
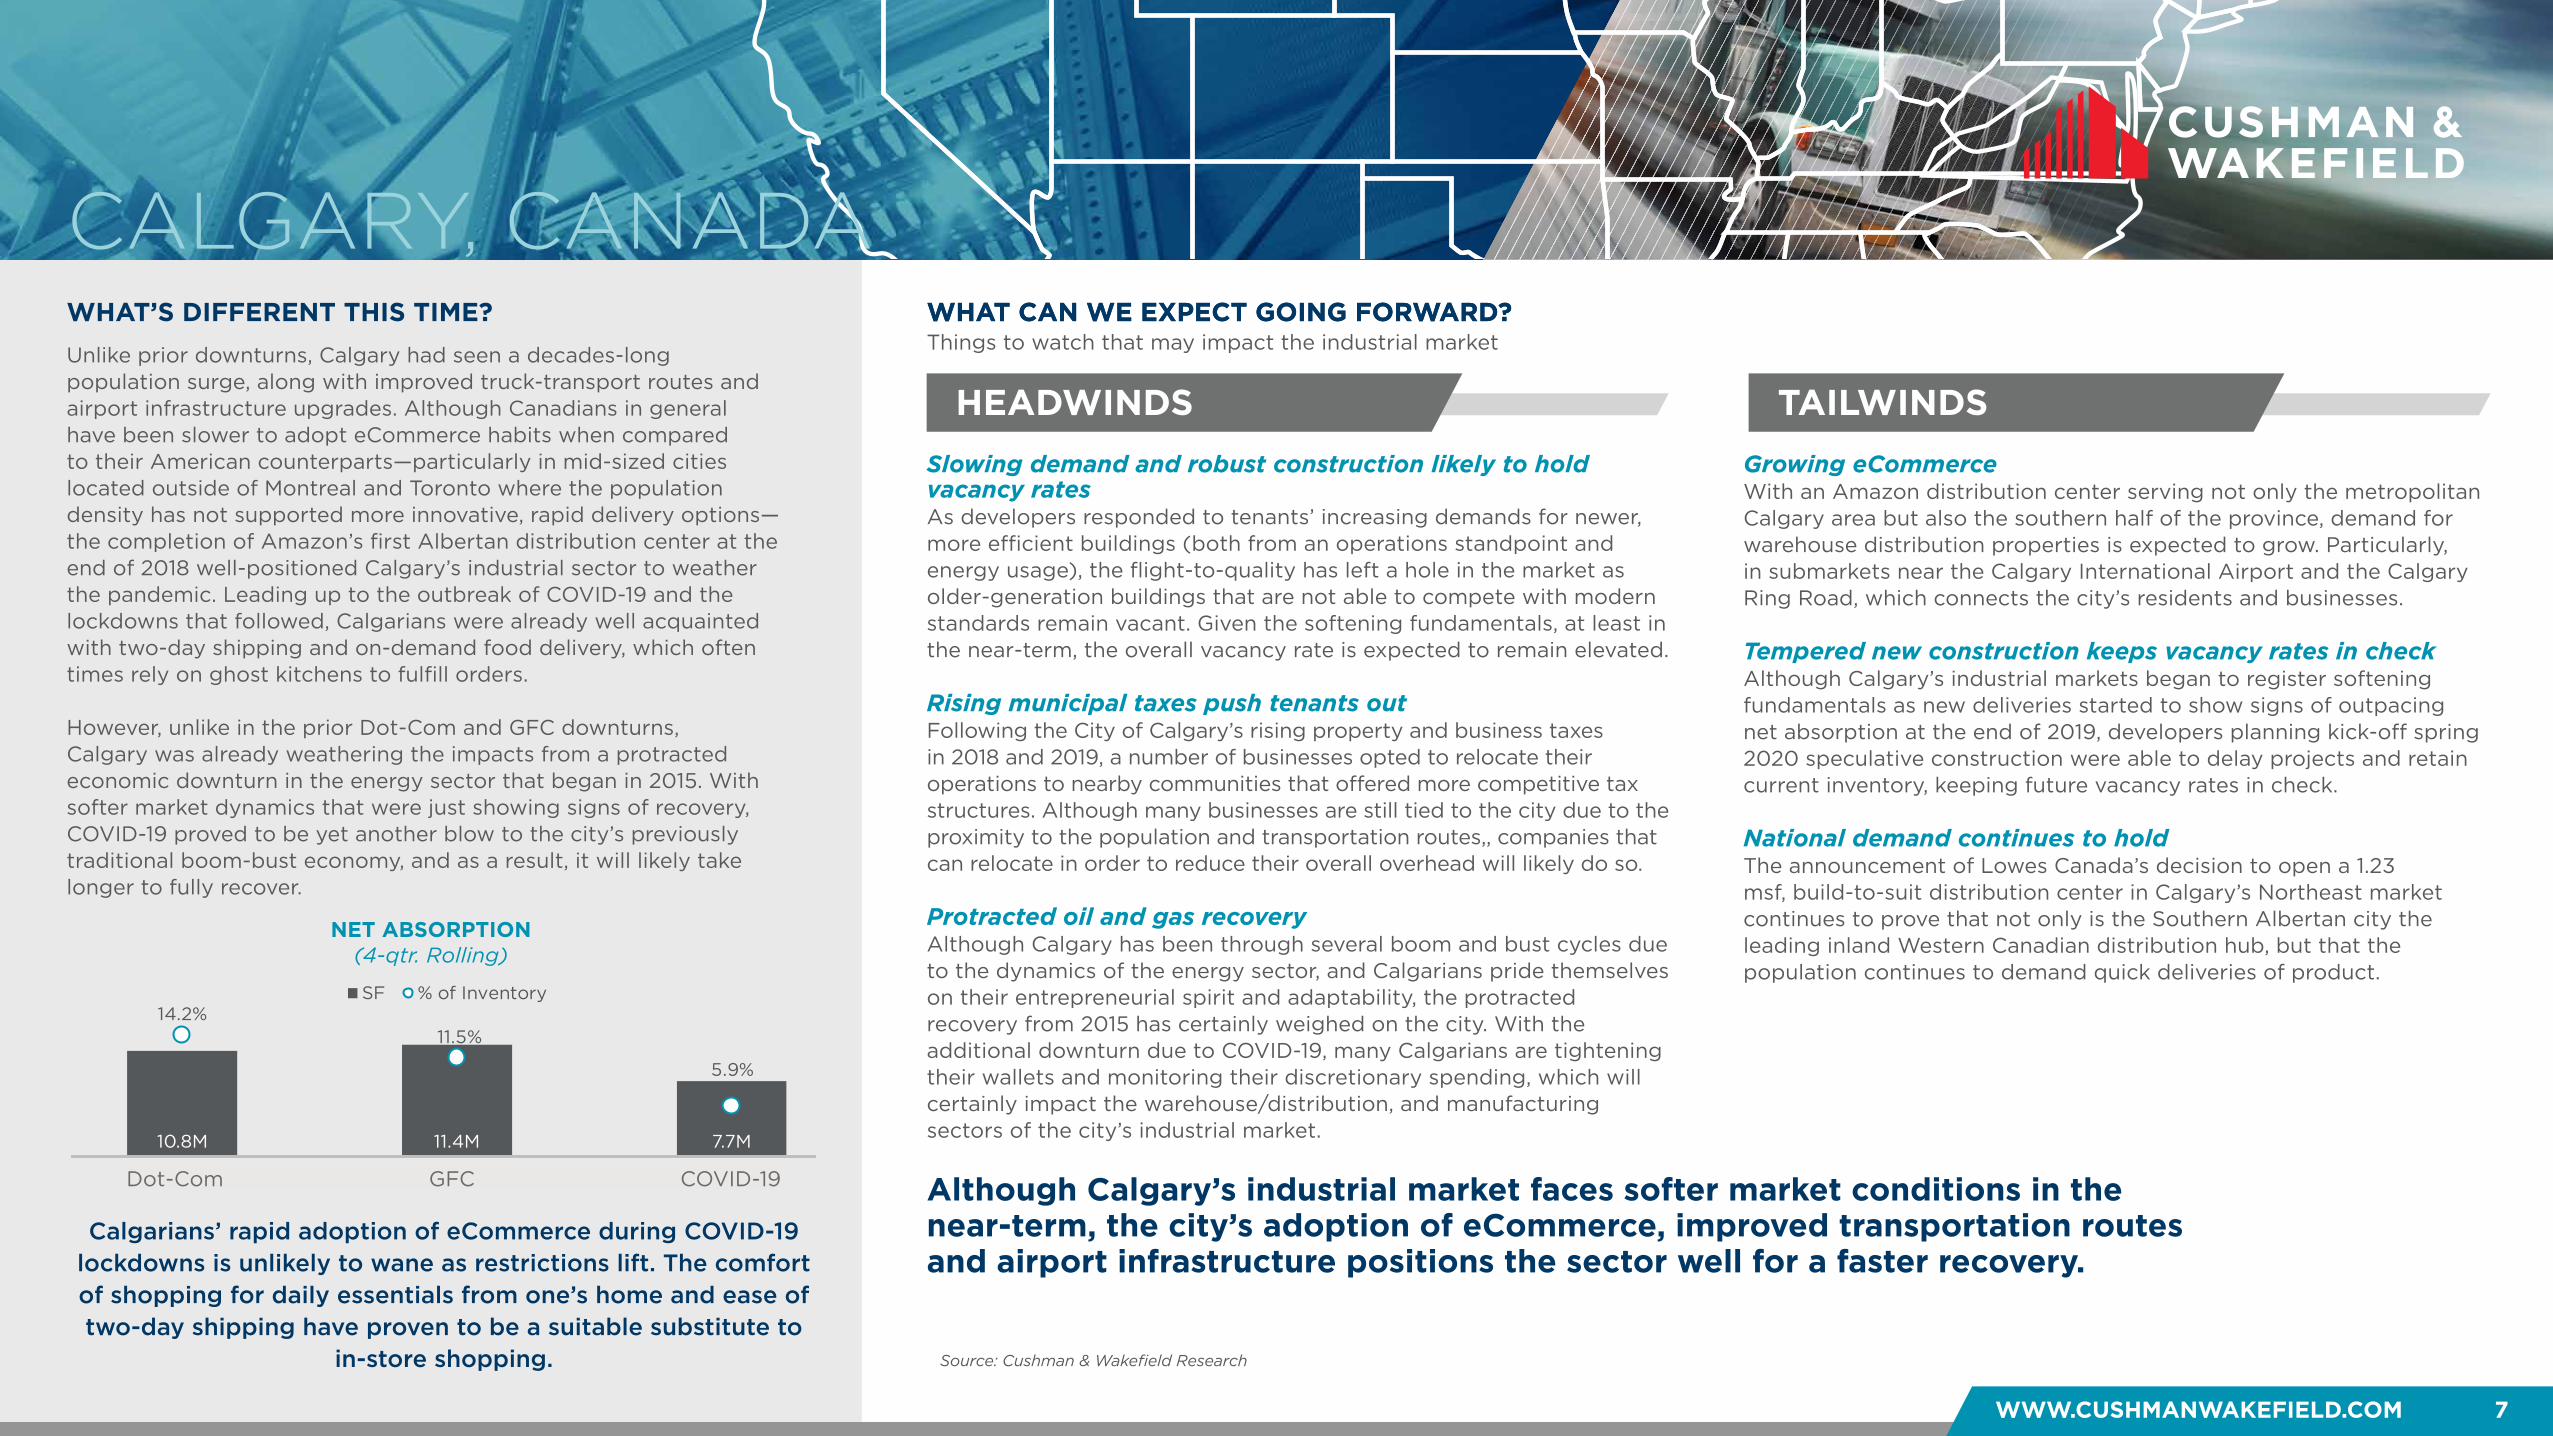
NET ABSORPTION (4-qtr. Rolling)
WHAT CAN WE EXPECT GOING FORWARD?
Although Calgary’s industrial market faces softer market conditions in the near-term, the city’s adoption of eCommerce, improved transportation routes and airport infrastructure positions the sector well for a faster recovery.
Slowing demand and robust construction likely to hold vacancy ratesAs developers responded to tenants’ increasing demands for newer, more efficient buildings (both from an operations standpoint and energy usage), the flight-to-quality has left a hole in the market as older-generation buildings that are not able to compete with modern standards remain vacant. Given the softening fundamentals, at least in the near-term, the overall vacancy rate is expected to remain elevated.
Rising municipal taxes push tenants outFollowing the City of Calgary’s rising property and business taxes in 2018 and 2019, a number of businesses opted to relocate their operations to nearby communities that offered more competitive tax structures. Although many businesses are still tied to the city due to the proximity to the population and transportation routes,, companies that can relocate in order to reduce their overall overhead will likely do so.
Protracted oil and gas recoveryAlthough Calgary has been through several boom and bust cycles due to the dynamics of the energy sector, and Calgarians pride themselves on their entrepreneurial spirit and adaptability, the protracted recovery from 2015 has certainly weighed on the city. With the additional downturn due to COVID-19, many Calgarians are tightening their wallets and monitoring their discretionary spending, which will certainly impact the warehouse/distribution, and manufacturing sectors of the city’s industrial market.
Growing eCommerceWith an Amazon distribution center serving not only the metropolitan Calgary area but also the southern half of the province, demand for warehouse distribution properties is expected to grow. Particularly, in submarkets near the Calgary International Airport and the Calgary Ring Road, which connects the city’s residents and businesses.
Tempered new construction keeps vacancy rates in checkAlthough Calgary’s industrial markets began to register softening fundamentals as new deliveries started to show signs of outpacing net absorption at the end of 2019, developers planning kick-off spring 2020 speculative construction were able to delay projects and retain current inventory, keeping future vacancy rates in check.
National demand continues to holdThe announcement of Lowes Canada’s decision to open a 1.23 msf, build-to-suit distribution center in Calgary’s Northeast market continues to prove that not only is the Southern Albertan city the leading inland Western Canadian distribution hub, but that the population continues to demand quick deliveries of product.
Unlike prior downturns, Calgary had seen a decades-long population surge, along with improved truck-transport routes and airport infrastructure upgrades. Although Canadians in general have been slower to adopt eCommerce habits when compared to their American counterparts—particularly in mid-sized cities located outside of Montreal and Toronto where the population density has not supported more innovative, rapid delivery options—the completion of Amazon’s first Albertan distribution center at the end of 2018 well-positioned Calgary’s industrial sector to weather the pandemic. Leading up to the outbreak of COVID-19 and the lockdowns that followed, Calgarians were already well acquainted with two-day shipping and on-demand food delivery, which often times rely on ghost kitchens to fulfill orders.
However, unlike in the prior Dot-Com and GFC downturns, Calgary was already weathering the impacts from a protracted economic downturn in the energy sector that began in 2015. With softer market dynamics that were just showing signs of recovery, COVID-19 proved to be yet another blow to the city’s previously traditional boom-bust economy, and as a result, it will likely take longer to fully recover.
Source: Cushman & Wakefield Research
10.8M 11.4M 7.7M
14.2%11.5%
5.9%
00.020.040.060.080.10.120.140.16
0
2000000
4000000
6000000
8000000
10000000
12000000
14000000
Dot Com Financial Crisis COVID-19
SF % of Inventory
Calgarians’ rapid adoption of eCommerce during COVID-19 lockdowns is unlikely to wane as restrictions lift. The comfort of shopping for daily essentials from one’s home and ease of two-day shipping have proven to be a suitable substitute to
in-store shopping.
CALGARY, CANADA
Dot-Com GFC COVID-19
WWW.CUSHMANWAKEFIELD.COM 8
INDUSTRIAL: THE RECESSION-PROOF ASSET CLASS?
SUPPLY & DEMANDLast 5 Years
OVERALL VACANCYEntering Recessionary Period
ECONOMIC FUNDAMENTALS SNAPSHOTEntering Recessionary Period
HOW DOES CHICAGO STACK UP?CHICAGO
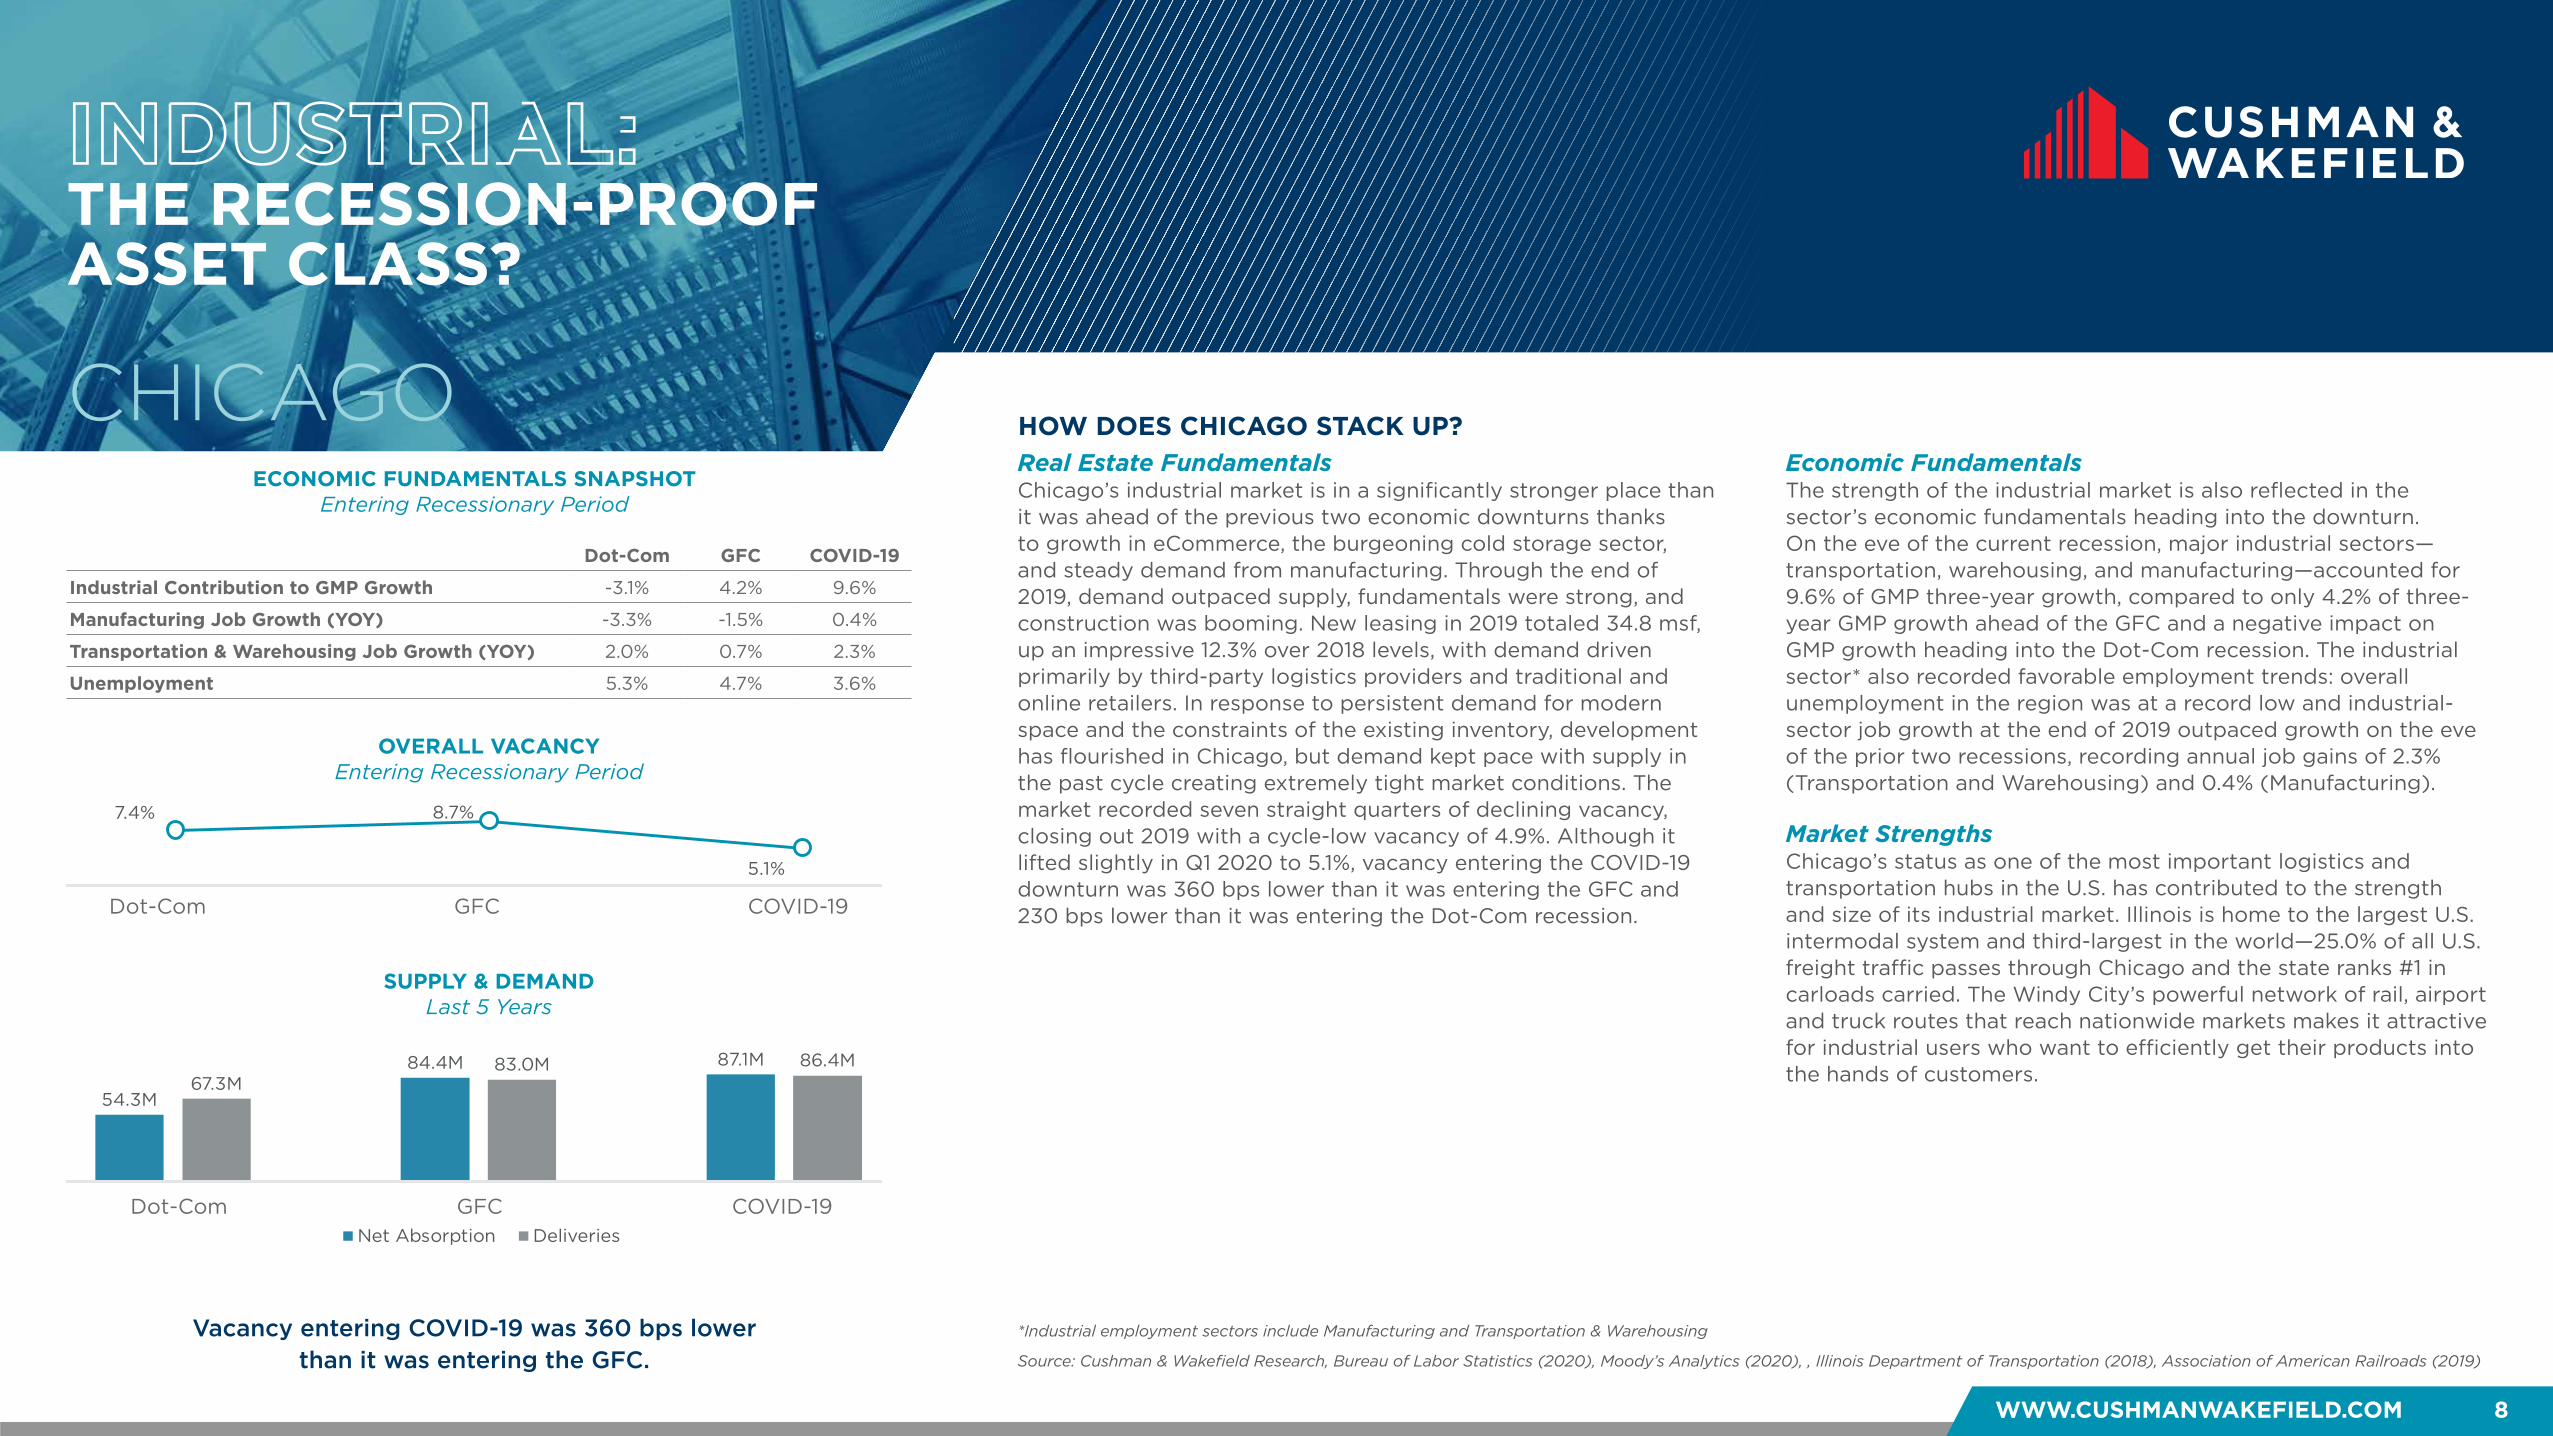
Vacancy entering COVID-19 was 360 bps lower than it was entering the GFC.
Real Estate FundamentalsChicago’s industrial market is in a significantly stronger place than it was ahead of the previous two economic downturns thanks to growth in eCommerce, the burgeoning cold storage sector, and steady demand from manufacturing. Through the end of 2019, demand outpaced supply, fundamentals were strong, and construction was booming. New leasing in 2019 totaled 34.8 msf, up an impressive 12.3% over 2018 levels, with demand driven primarily by third-party logistics providers and traditional and online retailers. In response to persistent demand for modern space and the constraints of the existing inventory, development has flourished in Chicago, but demand kept pace with supply in the past cycle creating extremely tight market conditions. The market recorded seven straight quarters of declining vacancy, closing out 2019 with a cycle-low vacancy of 4.9%. Although it lifted slightly in Q1 2020 to 5.1%, vacancy entering the COVID-19 downturn was 360 bps lower than it was entering the GFC and 230 bps lower than it was entering the Dot-Com recession.
Economic FundamentalsThe strength of the industrial market is also reflected in the sector’s economic fundamentals heading into the downturn. On the eve of the current recession, major industrial sectors—transportation, warehousing, and manufacturing—accounted for 9.6% of GMP three-year growth, compared to only 4.2% of three-year GMP growth ahead of the GFC and a negative impact on GMP growth heading into the Dot-Com recession. The industrial sector* also recorded favorable employment trends: overall unemployment in the region was at a record low and industrial-sector job growth at the end of 2019 outpaced growth on the eve of the prior two recessions, recording annual job gains of 2.3% (Transportation and Warehousing) and 0.4% (Manufacturing).
Market StrengthsChicago’s status as one of the most important logistics and transportation hubs in the U.S. has contributed to the strength and size of its industrial market. Illinois is home to the largest U.S. intermodal system and third-largest in the world—25.0% of all U.S. freight traffic passes through Chicago and the state ranks #1 in carloads carried. The Windy City’s powerful network of rail, airport and truck routes that reach nationwide markets makes it attractive for industrial users who want to efficiently get their products into the hands of customers.
Source: Cushman & Wakefield Research, Bureau of Labor Statistics (2020), Moody’s Analytics (2020), , Illinois Department of Transportation (2018), Association of American Railroads (2019)
*Industrial employment sectors include Manufacturing and Transportation & Warehousing
Dot-Com GFC COVID-19
Industrial Contribution to GMP Growth -3.1% 4.2% 9.6%
Manufacturing Job Growth (YOY) -3.3% -1.5% 0.4%
Transportation & Warehousing Job Growth (YOY) 2.0% 0.7% 2.3%
Unemployment 5.3% 4.7% 3.6%
7.4% 8.7%
5.1%
Dot Com Financial Crisis COVID-19
54.3M
84.4M 87.1M67.3M
83.0M 86.4M
Dot Com Financial Crisis COVID-19
Net Absorption Deliveries
Dot-Com GFC COVID-19
Dot-Com GFC COVID-19
WHAT’S DIFFERENT THIS TIME?
HEADWINDS TAILWINDS
WHAT CAN WE EXPECT GOING FORWARD?
WWW.CUSHMANWAKEFIELD.COM 9
Things to watch that may impact the industrial market
CHICAGO
A robust development pipeline could place pressure on rents and vacancyIn Q1 2020, Chicago had 17.2 msf under construction—1.6% of total inventory—of which only 22.4% was pre-leased. While demand has kept up with new supply, with tenants quickly leasing new space as it comes to market, industrial tenant demand may shift in response to the pandemic. If supply overshoots demand, vacancy and rents will be pressured.
Declining rail volumes could shift demand from ChicagoRail freight growth has been hampered by competition from trucking. Through the end of November 2019, North American rail volume was down 3.6% compared to the same period in 2018. As America’s busiest rail freight hub, industrial real estate demand in Chicago could be impacted if rail volumes continue to fall. As supply chains shift away from rail to trucking, Chicago may experience lower cargo volumes.
Weak population trends could tighten the industrial labor marketMetro Chicago leads the country in population loss, recording four straight years of population decline as of 2019. These losses reflect a gradual transformation of the market: Chicago is losing more of its low-income households and gaining high-income residents, with growth concentrated in the city of Chicago. Labor availability for industrial occupations such as transportation and warehouse workers may further tighten as low-wage workers move out of the market.
Economic diversity will soften the blowChicago boasts the most diverse major economy in the country with a blend of industries from tech to advanced manufacturing to logistics. No single industry accounts for more than 14.0% of the local economy. This highly-diversified economy typically keeps the real estate market better protected from economic disruptions in any single sector.
Chicago’s status as a logistics epicenter will persist even as supply chains evolveChicago’s central location and extensive transportation and distribution network make it a vital logistics hub. Even if supply chains shift in response to the pandemic, most goods will likely still need to pass through Chicago, sustaining demand for industrial real estate relative to other markets.
Leader in corporate relocations and expansions for 7 years runningChicago’s central location, talent pool, affordability, and infrastructure continue to make the Windy City an attractive option for companies. In 2019, Chicago once again saw more new and expanding corporate locations than any other region in the country—416 expansions accounting for over $5 billion in investment. Continued corporate growth in Chicago will help bolster the economy in challenging times.
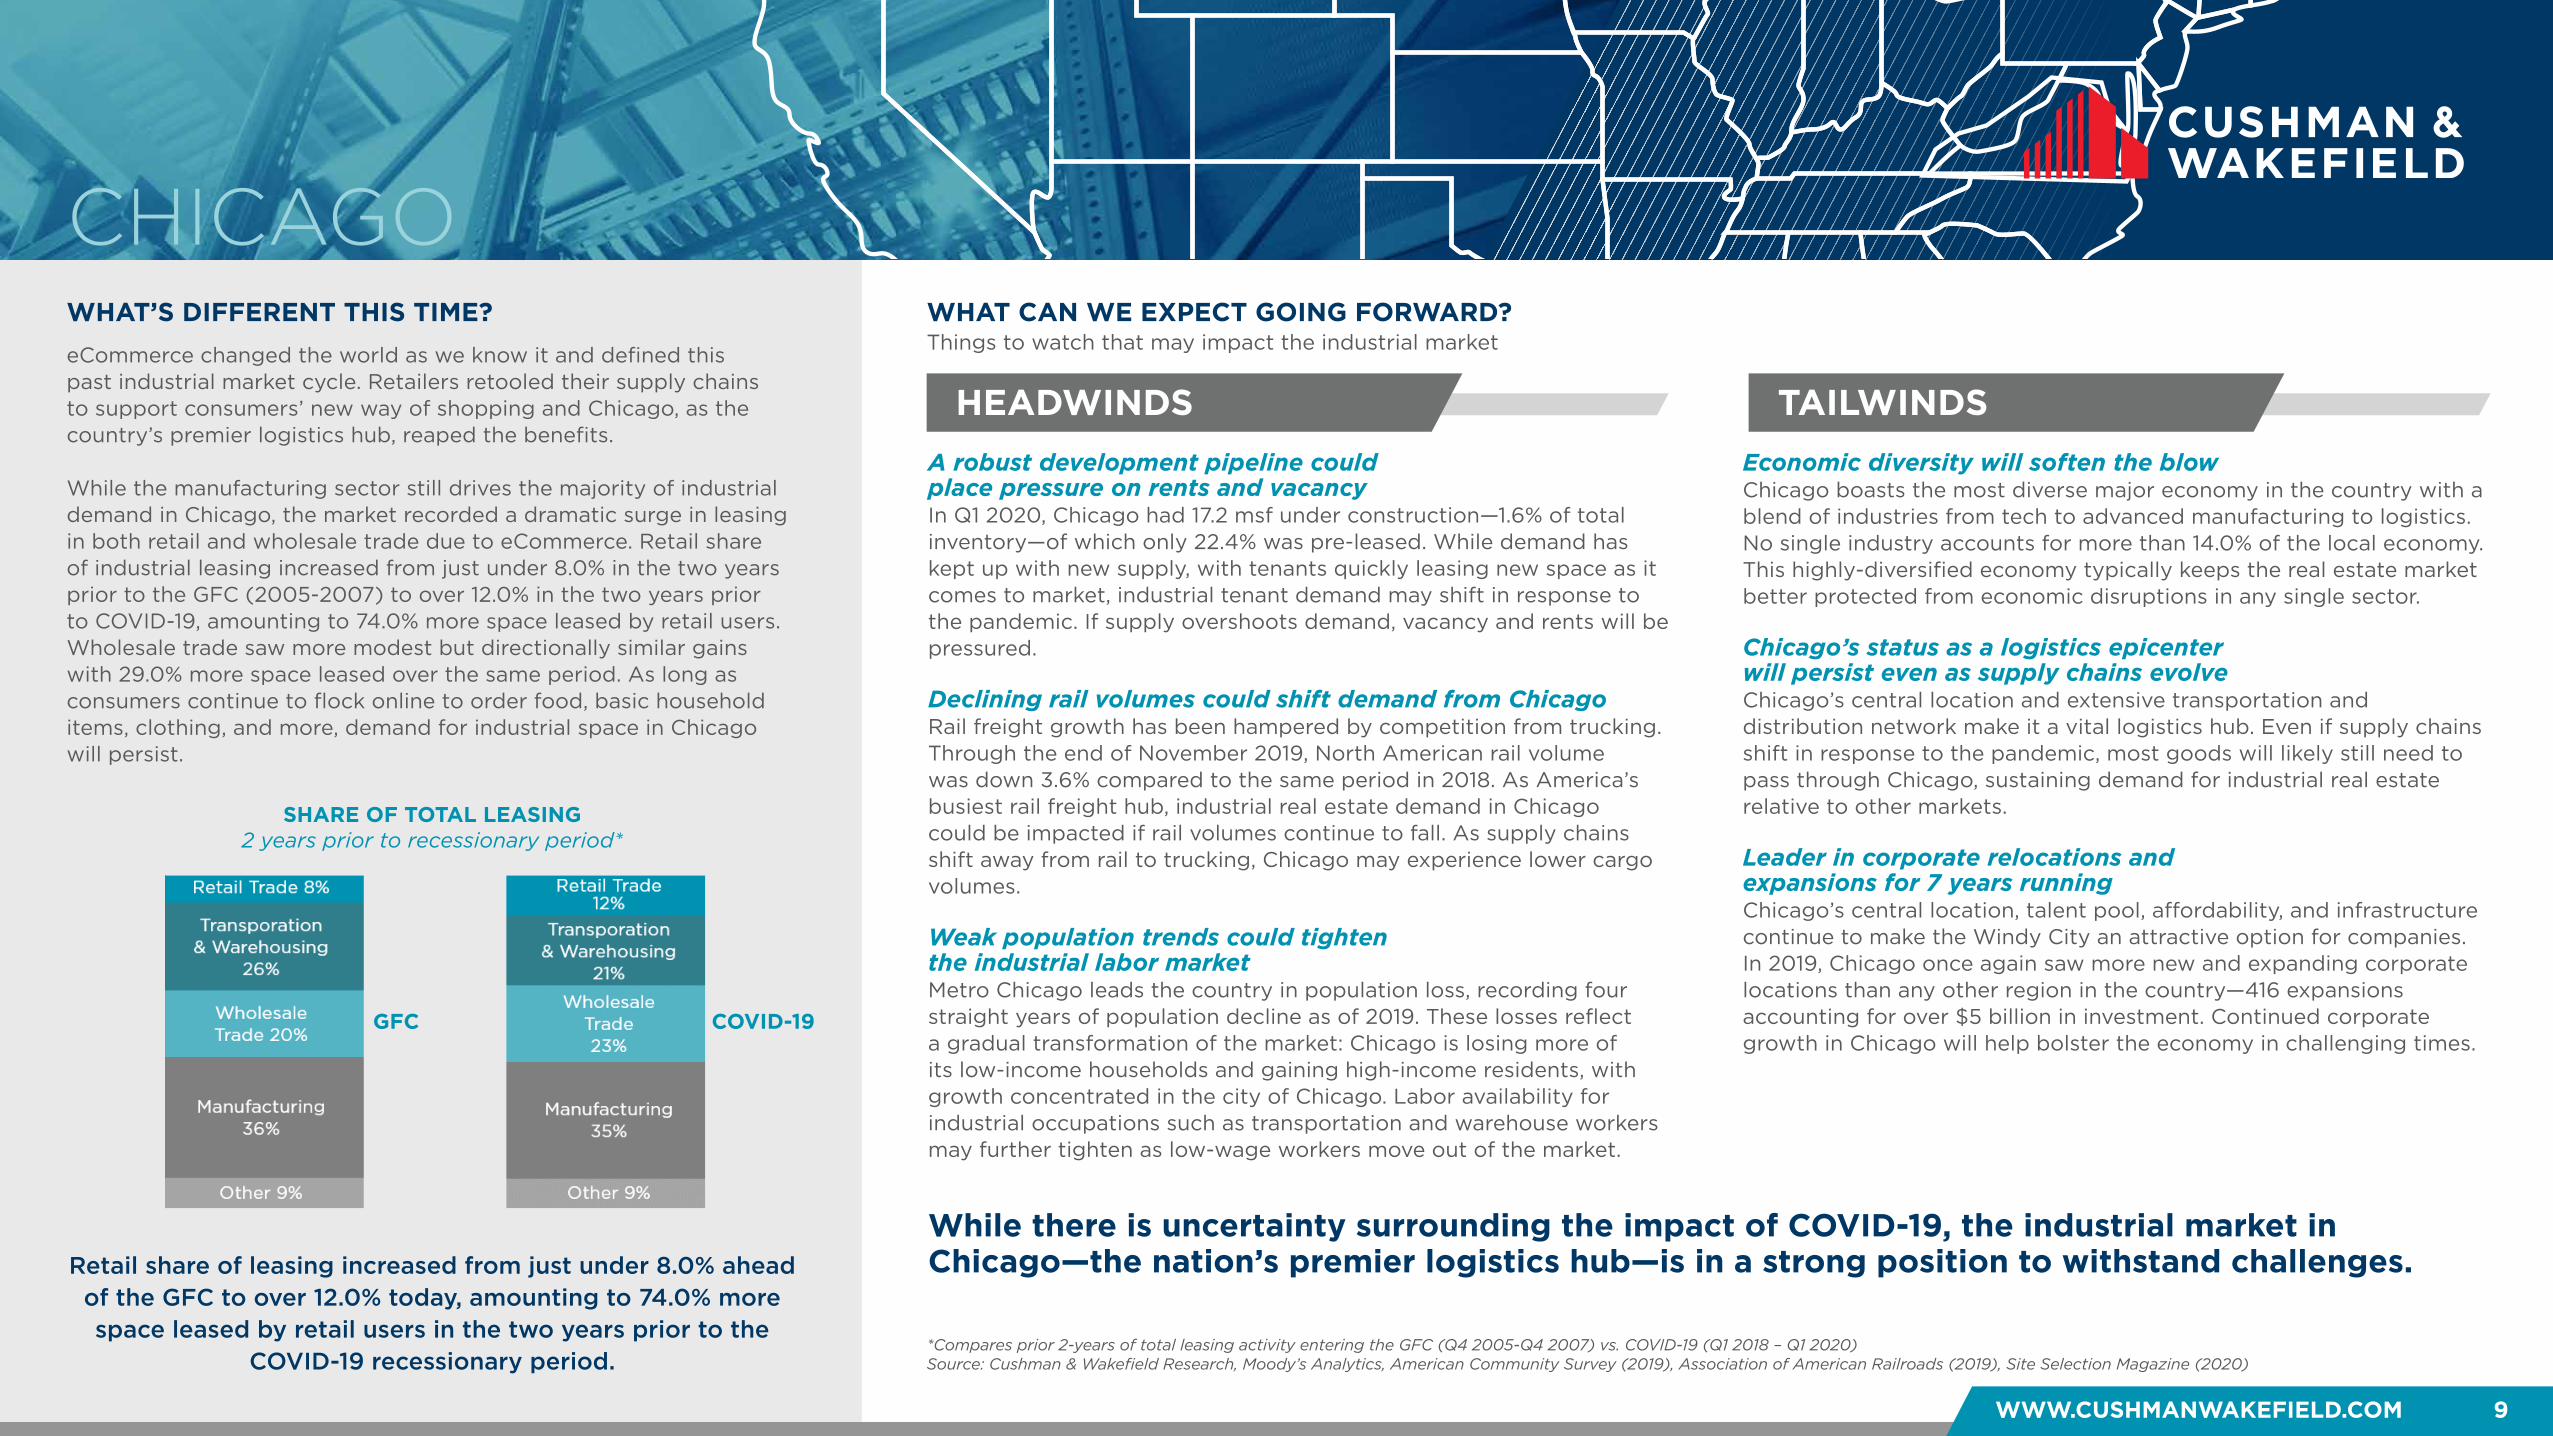
eCommerce changed the world as we know it and defined this past industrial market cycle. Retailers retooled their supply chains to support consumers’ new way of shopping and Chicago, as the country’s premier logistics hub, reaped the benefits.
While the manufacturing sector still drives the majority of industrial demand in Chicago, the market recorded a dramatic surge in leasing in both retail and wholesale trade due to eCommerce. Retail share of industrial leasing increased from just under 8.0% in the two years prior to the GFC (2005-2007) to over 12.0% in the two years prior to COVID-19, amounting to 74.0% more space leased by retail users. Wholesale trade saw more modest but directionally similar gains with 29.0% more space leased over the same period. As long as consumers continue to flock online to order food, basic household items, clothing, and more, demand for industrial space in Chicago will persist.
Retail share of leasing increased from just under 8.0% ahead of the GFC to over 12.0% today, amounting to 74.0% more space leased by retail users in the two years prior to the
COVID-19 recessionary period.
While there is uncertainty surrounding the impact of COVID-19, the industrial market in Chicago—the nation’s premier logistics hub—is in a strong position to withstand challenges.
*Compares prior 2-years of total leasing activity entering the GFC (Q4 2005-Q4 2007) vs. COVID-19 (Q1 2018 – Q1 2020)Source: Cushman & Wakefield Research, Moody’s Analytics, American Community Survey (2019), Association of American Railroads (2019), Site Selection Magazine (2020)
GFC COVID-19
SHARE OF TOTAL LEASING2 years prior to recessionary period*
WWW.CUSHMANWAKEFIELD.COM 10
INDUSTRIAL: THE RECESSION-PROOF ASSET CLASS?
OVERALL VACANCYEntering Recessionary Period
SUPPLY & DEMANDCumulative 4-qtr. Total
HOW DOES CINCINNATI STACK UP?CINCINNATI
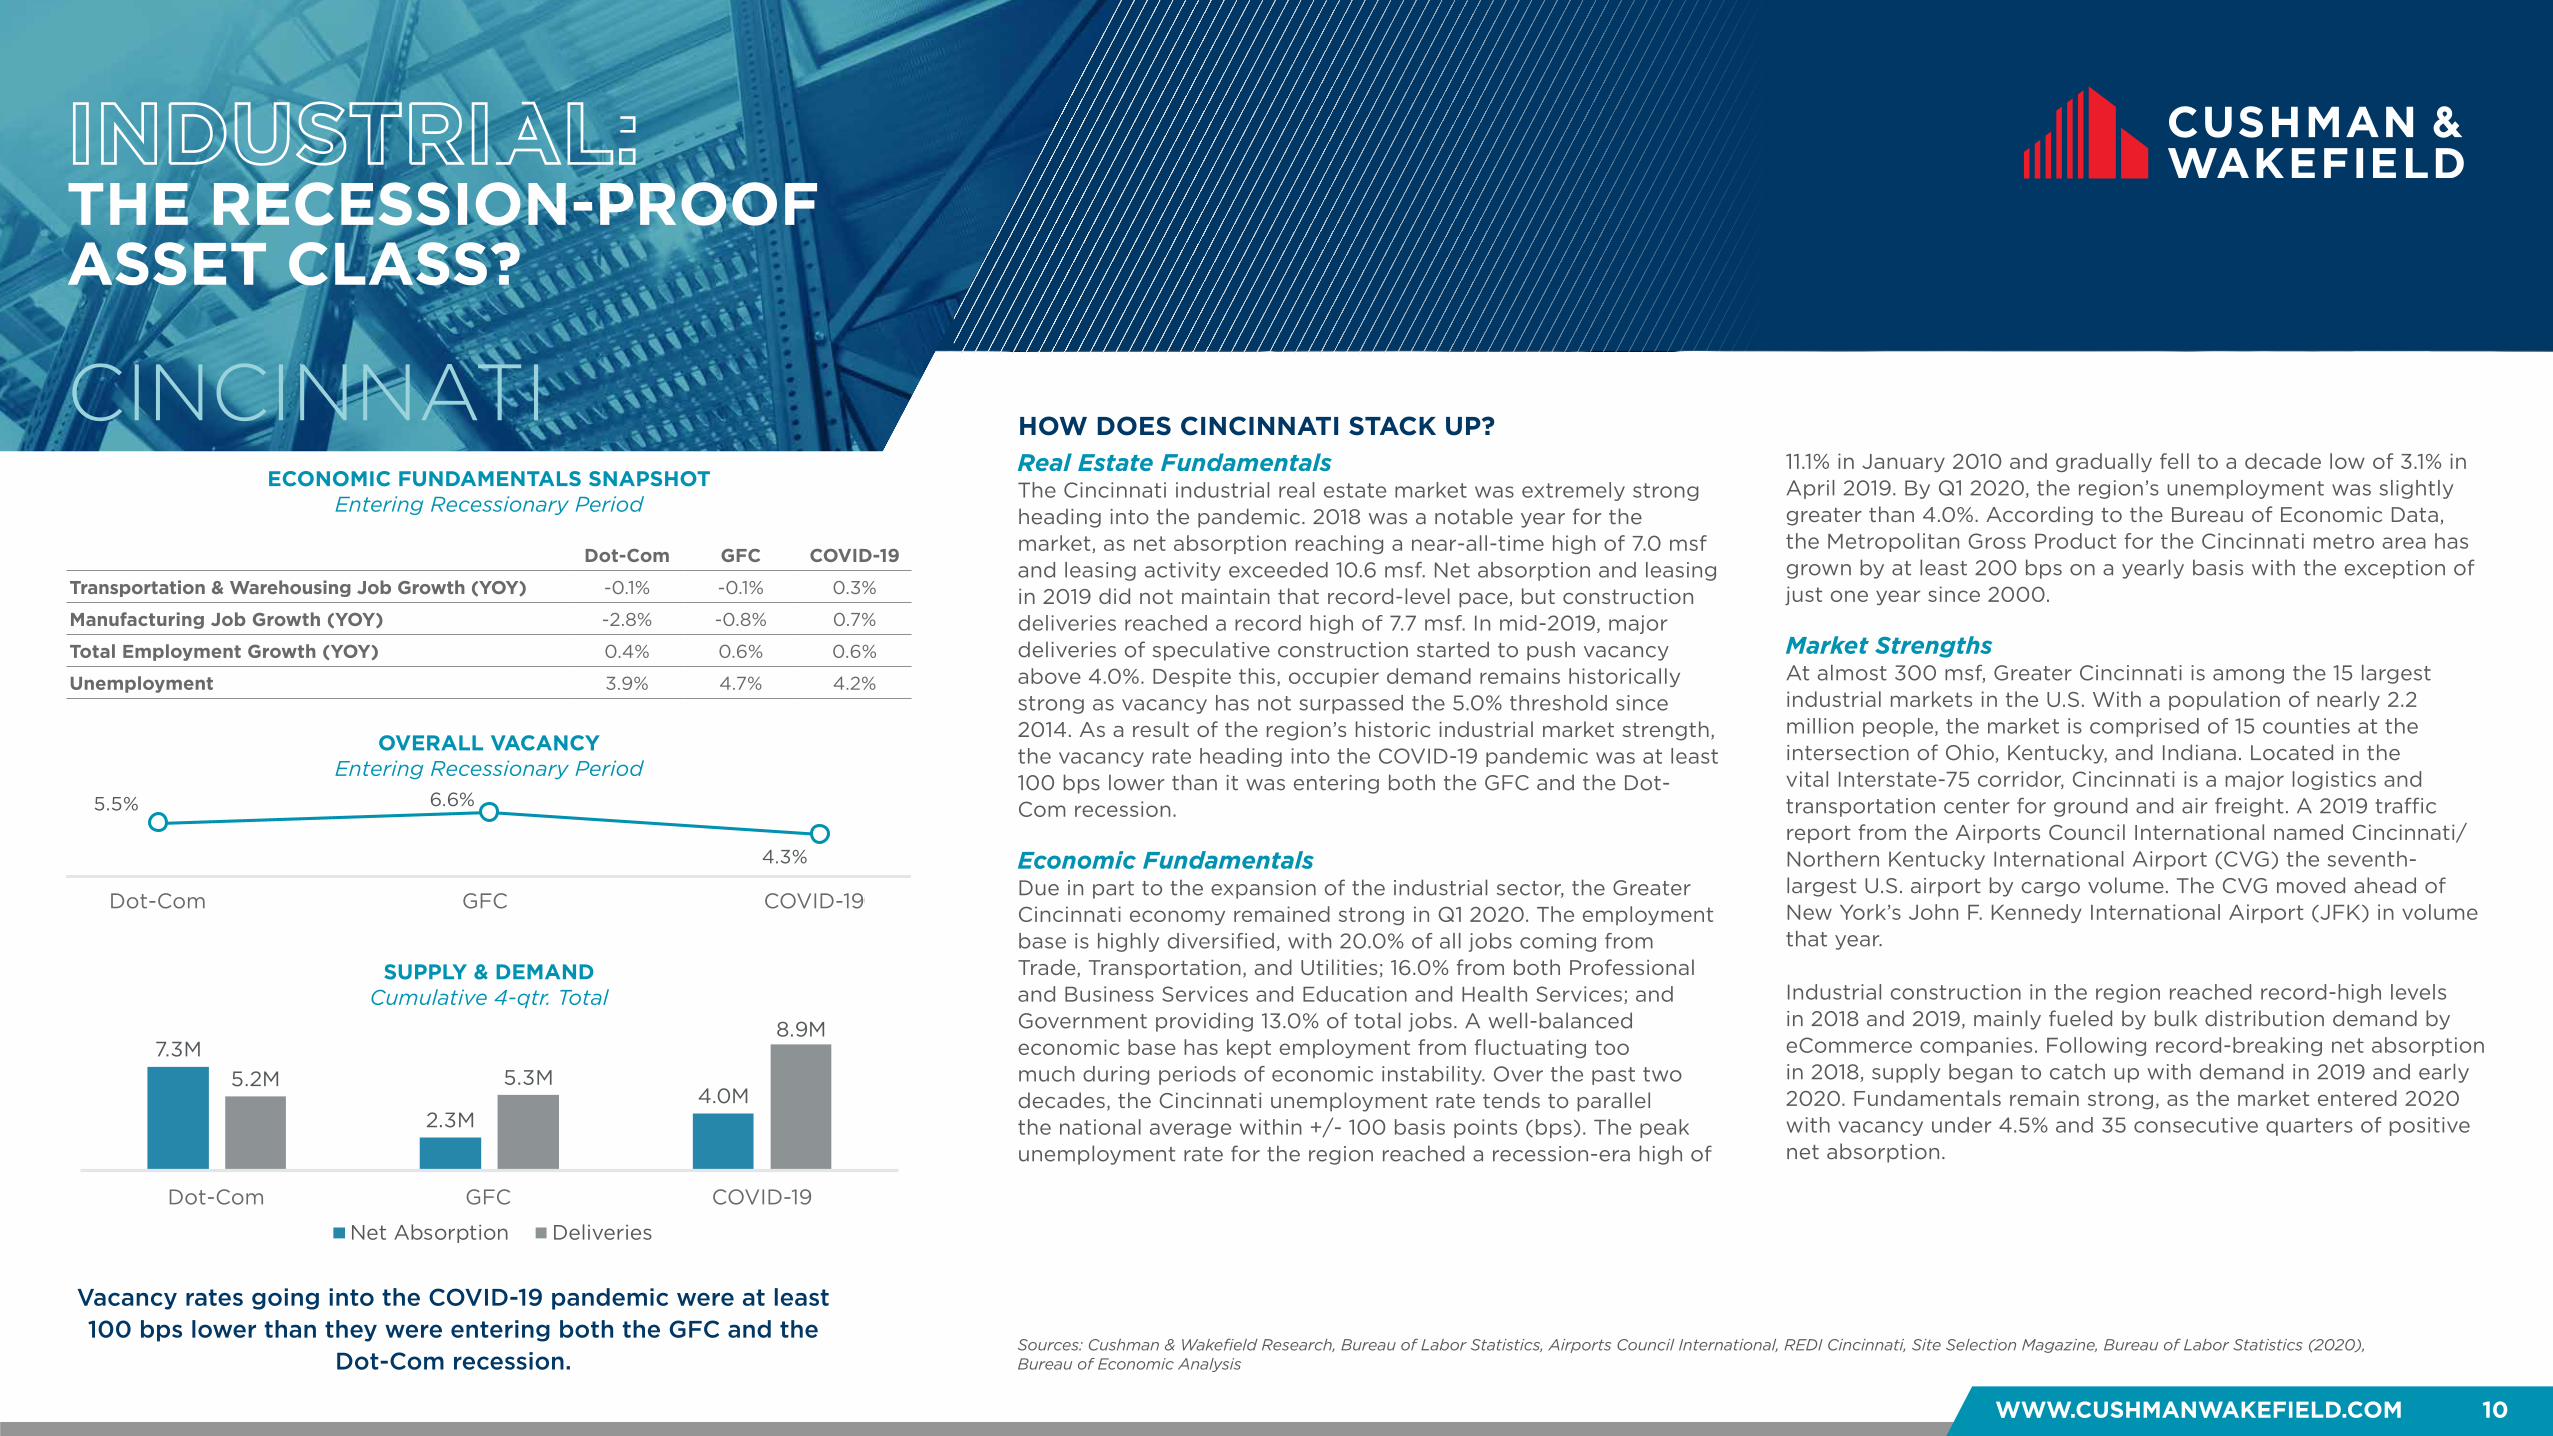
Vacancy rates going into the COVID-19 pandemic were at least 100 bps lower than they were entering both the GFC and the
Dot-Com recession.
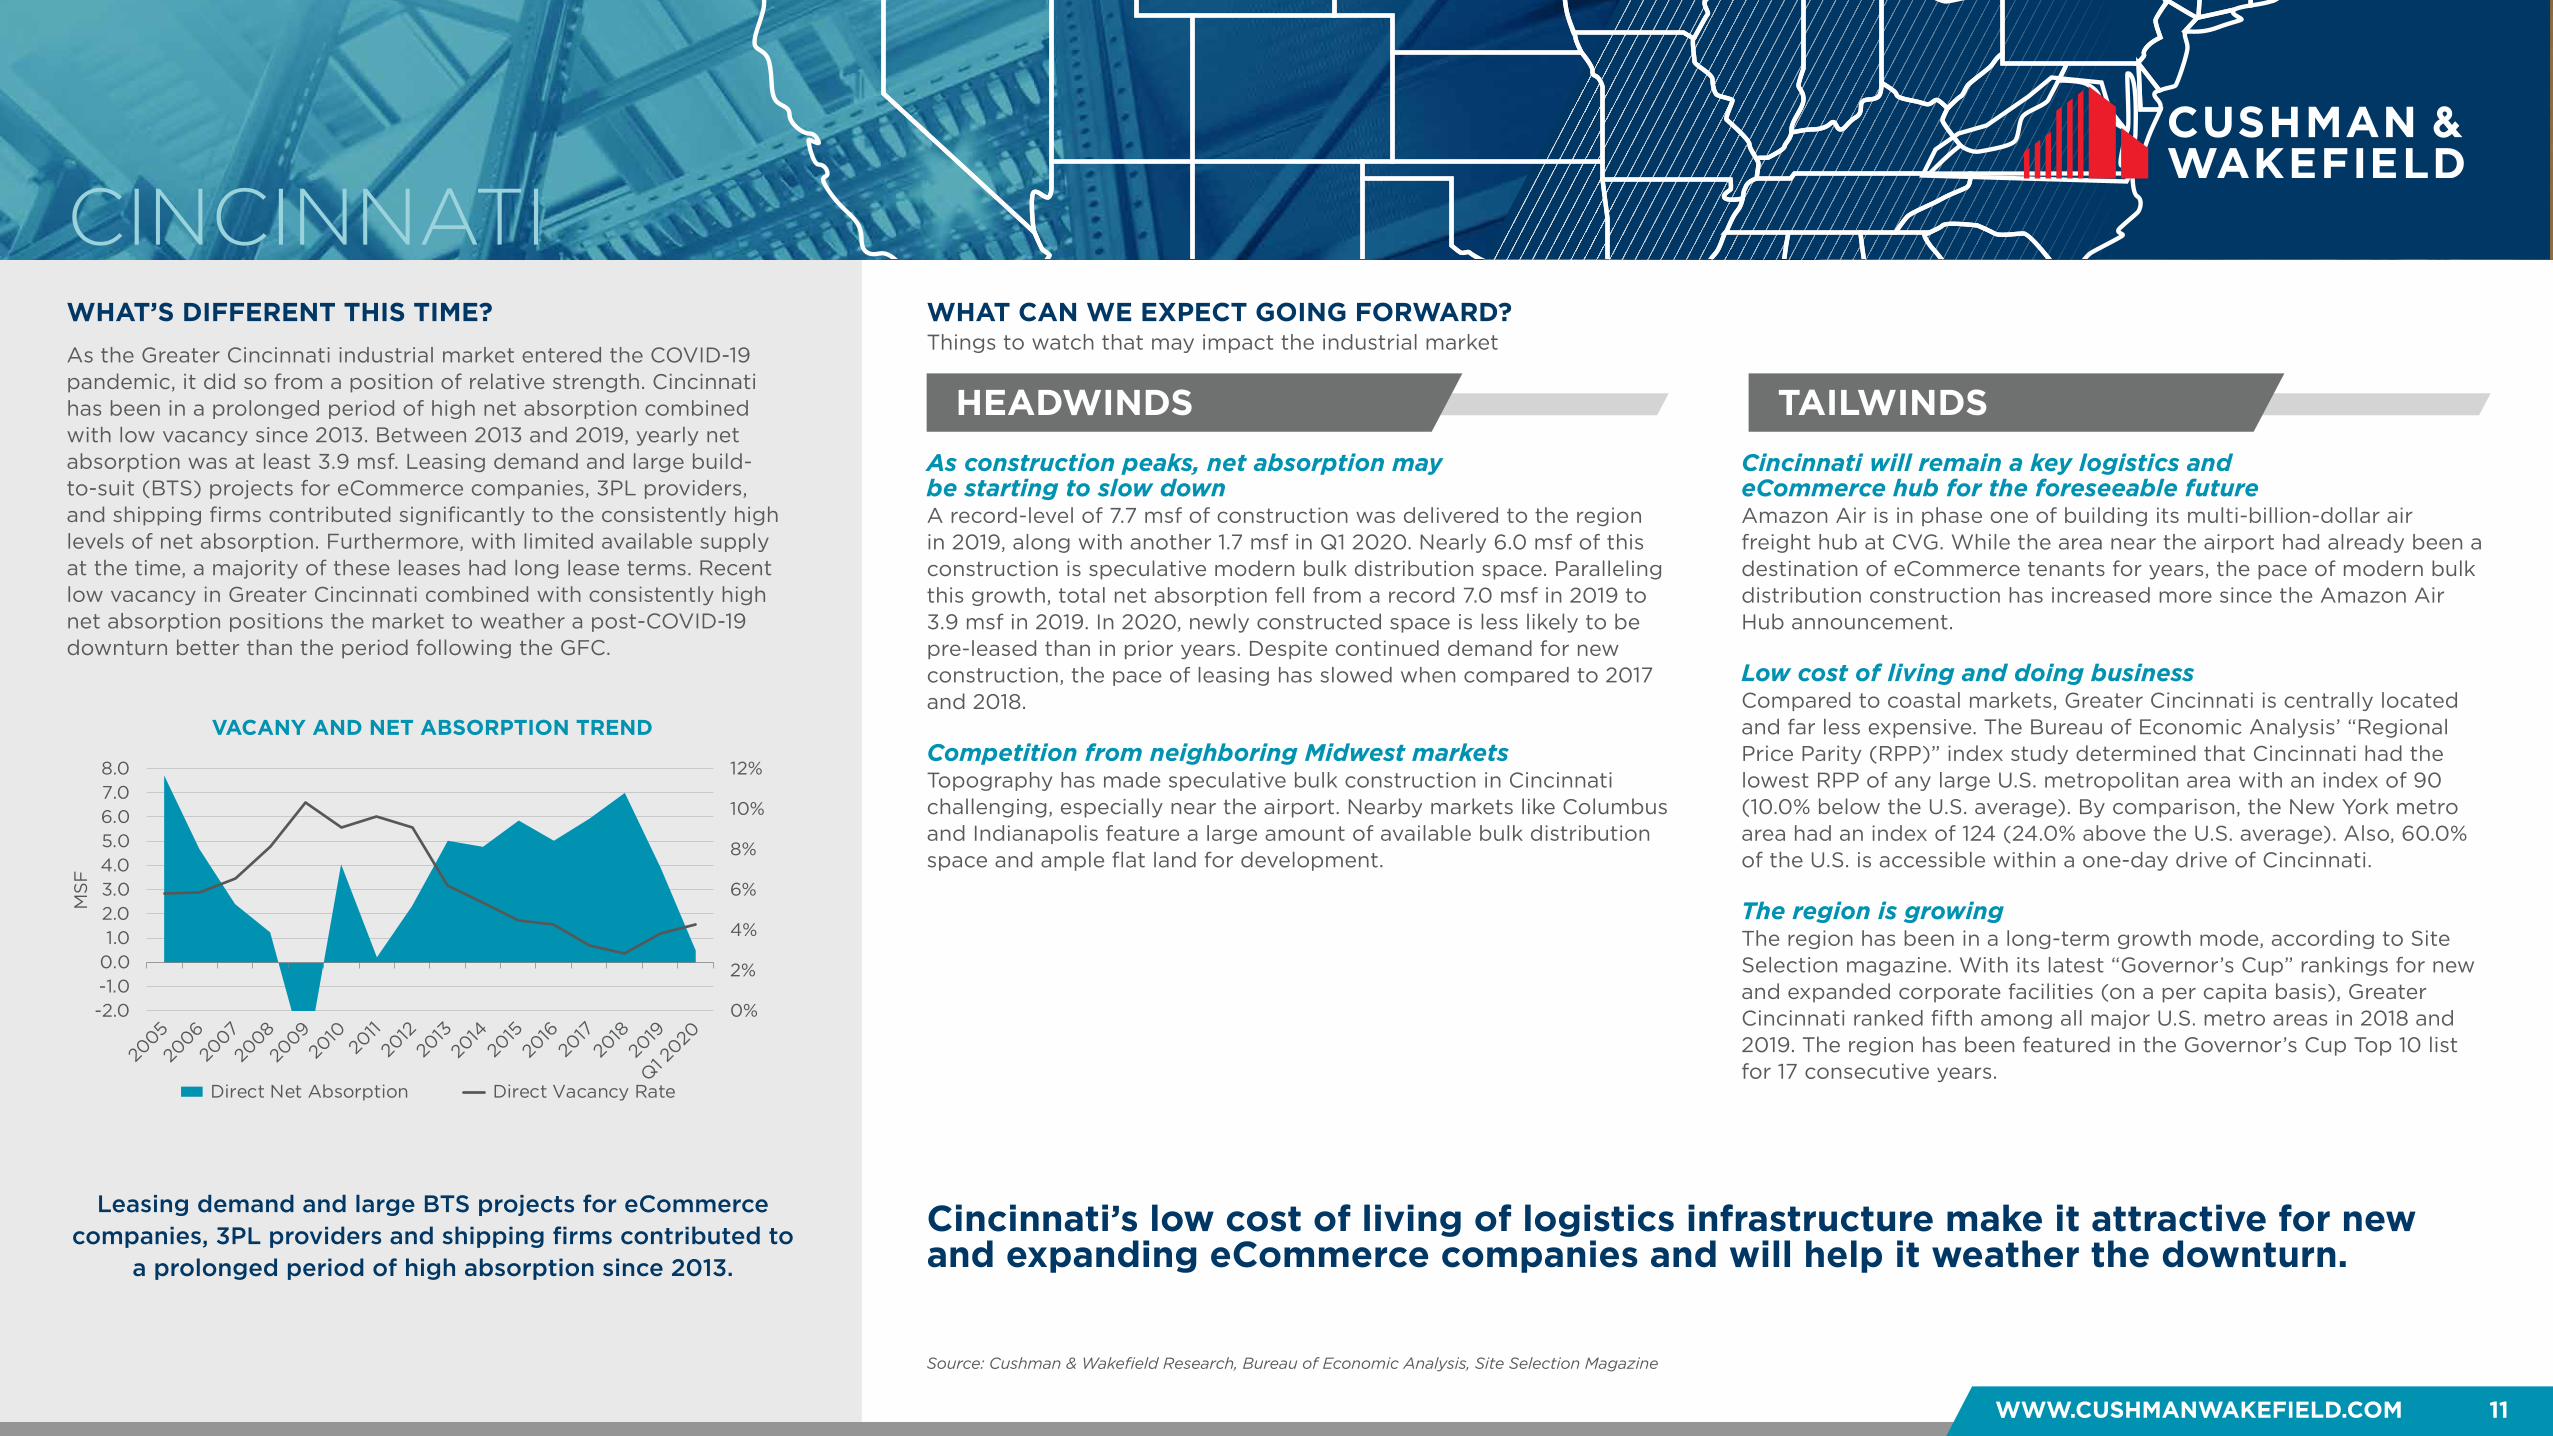
Real Estate FundamentalsThe Cincinnati industrial real estate market was extremely strong heading into the pandemic. 2018 was a notable year for the market, as net absorption reaching a near-all-time high of 7.0 msf and leasing activity exceeded 10.6 msf. Net absorption and leasing in 2019 did not maintain that record-level pace, but construction deliveries reached a record high of 7.7 msf. In mid-2019, major deliveries of speculative construction started to push vacancy above 4.0%. Despite this, occupier demand remains historically strong as vacancy has not surpassed the 5.0% threshold since 2014. As a result of the region’s historic industrial market strength, the vacancy rate heading into the COVID-19 pandemic was at least 100 bps lower than it was entering both the GFC and the Dot-Com recession.
Economic FundamentalsDue in part to the expansion of the industrial sector, the Greater Cincinnati economy remained strong in Q1 2020. The employment base is highly diversified, with 20.0% of all jobs coming from Trade, Transportation, and Utilities; 16.0% from both Professional and Business Services and Education and Health Services; and Government providing 13.0% of total jobs. A well-balanced economic base has kept employment from fluctuating too much during periods of economic instability. Over the past two decades, the Cincinnati unemployment rate tends to parallel the national average within +/- 100 basis points (bps). The peak unemployment rate for the region reached a recession-era high of
11.1% in January 2010 and gradually fell to a decade low of 3.1% in April 2019. By Q1 2020, the region’s unemployment was slightly greater than 4.0%. According to the Bureau of Economic Data, the Metropolitan Gross Product for the Cincinnati metro area has grown by at least 200 bps on a yearly basis with the exception of just one year since 2000.
Market StrengthsAt almost 300 msf, Greater Cincinnati is among the 15 largest industrial markets in the U.S. With a population of nearly 2.2 million people, the market is comprised of 15 counties at the intersection of Ohio, Kentucky, and Indiana. Located in the vital Interstate-75 corridor, Cincinnati is a major logistics and transportation center for ground and air freight. A 2019 traffic report from the Airports Council International named Cincinnati/Northern Kentucky International Airport (CVG) the seventh-largest U.S. airport by cargo volume. The CVG moved ahead of New York’s John F. Kennedy International Airport (JFK) in volume that year. Industrial construction in the region reached record-high levels in 2018 and 2019, mainly fueled by bulk distribution demand by eCommerce companies. Following record-breaking net absorption in 2018, supply began to catch up with demand in 2019 and early 2020. Fundamentals remain strong, as the market entered 2020 with vacancy under 4.5% and 35 consecutive quarters of positive net absorption.
Sources: Cushman & Wakefield Research, Bureau of Labor Statistics, Airports Council International, REDI Cincinnati, Site Selection Magazine, Bureau of Labor Statistics (2020), Bureau of Economic Analysis
Dot-Com GFC COVID-19
Transportation & Warehousing Job Growth (YOY) -0.1% -0.1% 0.3%
Manufacturing Job Growth (YOY) -2.8% -0.8% 0.7%
Total Employment Growth (YOY) 0.4% 0.6% 0.6%
Unemployment 3.9% 4.7% 4.2%
5.5% 6.6%
4.3%
Dot Com Financial Crisis COVID-19
7.3M
2.3M4.0M
5.2M 5.3M
8.9M
Dot Com Financial Crisis COVID-19
Net Absorption Deliveries
ECONOMIC FUNDAMENTALS SNAPSHOTEntering Recessionary Period
Dot-Com GFC COVID-19
Dot-Com GFC COVID-19
WHAT’S DIFFERENT THIS TIME?
HEADWINDS TAILWINDS
WHAT CAN WE EXPECT GOING FORWARD?
WWW.CUSHMANWAKEFIELD.COM 11
Things to watch that may impact the industrial market
CINCINNATI
Cincinnati’s low cost of living of logistics infrastructure make it attractive for new and expanding eCommerce companies and will help it weather the downturn.
As construction peaks, net absorption may be starting to slow down A record-level of 7.7 msf of construction was delivered to the region in 2019, along with another 1.7 msf in Q1 2020. Nearly 6.0 msf of this construction is speculative modern bulk distribution space. Paralleling this growth, total net absorption fell from a record 7.0 msf in 2019 to 3.9 msf in 2019. In 2020, newly constructed space is less likely to be pre-leased than in prior years. Despite continued demand for new construction, the pace of leasing has slowed when compared to 2017 and 2018. Competition from neighboring Midwest markets Topography has made speculative bulk construction in Cincinnati challenging, especially near the airport. Nearby markets like Columbus and Indianapolis feature a large amount of available bulk distribution space and ample flat land for development.
Cincinnati will remain a key logistics and eCommerce hub for the foreseeable future Amazon Air is in phase one of building its multi-billion-dollar air freight hub at CVG. While the area near the airport had already been a destination of eCommerce tenants for years, the pace of modern bulk distribution construction has increased more since the Amazon Air Hub announcement. Low cost of living and doing business Compared to coastal markets, Greater Cincinnati is centrally located and far less expensive. The Bureau of Economic Analysis’ “Regional Price Parity (RPP)” index study determined that Cincinnati had the lowest RPP of any large U.S. metropolitan area with an index of 90 (10.0% below the U.S. average). By comparison, the New York metro area had an index of 124 (24.0% above the U.S. average). Also, 60.0% of the U.S. is accessible within a one-day drive of Cincinnati.
The region is growing The region has been in a long-term growth mode, according to Site Selection magazine. With its latest “Governor’s Cup” rankings for new and expanded corporate facilities (on a per capita basis), Greater Cincinnati ranked fifth among all major U.S. metro areas in 2018 and 2019. The region has been featured in the Governor’s Cup Top 10 list for 17 consecutive years.
Leasing demand and large BTS projects for eCommerce companies, 3PL providers and shipping firms contributed to
a prolonged period of high absorption since 2013.
As the Greater Cincinnati industrial market entered the COVID-19 pandemic, it did so from a position of relative strength. Cincinnati has been in a prolonged period of high net absorption combined with low vacancy since 2013. Between 2013 and 2019, yearly net absorption was at least 3.9 msf. Leasing demand and large build-to-suit (BTS) projects for eCommerce companies, 3PL providers, and shipping firms contributed significantly to the consistently high levels of net absorption. Furthermore, with limited available supply at the time, a majority of these leases had long lease terms. Recent low vacancy in Greater Cincinnati combined with consistently high net absorption positions the market to weather a post-COVID-19 downturn better than the period following the GFC.
Source: Cushman & Wakefield Research, Bureau of Economic Analysis, Site Selection Magazine
VACANY AND NET ABSORPTION TREND
0%
2%
4%
6%
8%
10%
12%
-2.0-1.00.01.02.03.04.05.06.07.08.0
Vac
ancy
Rat
e
MS
F
Direct Net Absorption Direct Vacancy Rate
WWW.CUSHMANWAKEFIELD.COM 12
INDUSTRIAL: THE RECESSION-PROOF ASSET CLASS?
OVERALL VACANCYEntering Recessionary Period
SUPPLY & DEMANDCumulative 4-qtr. Total
HOW DOES COLUMBUS STACK UP?COLUMBUS
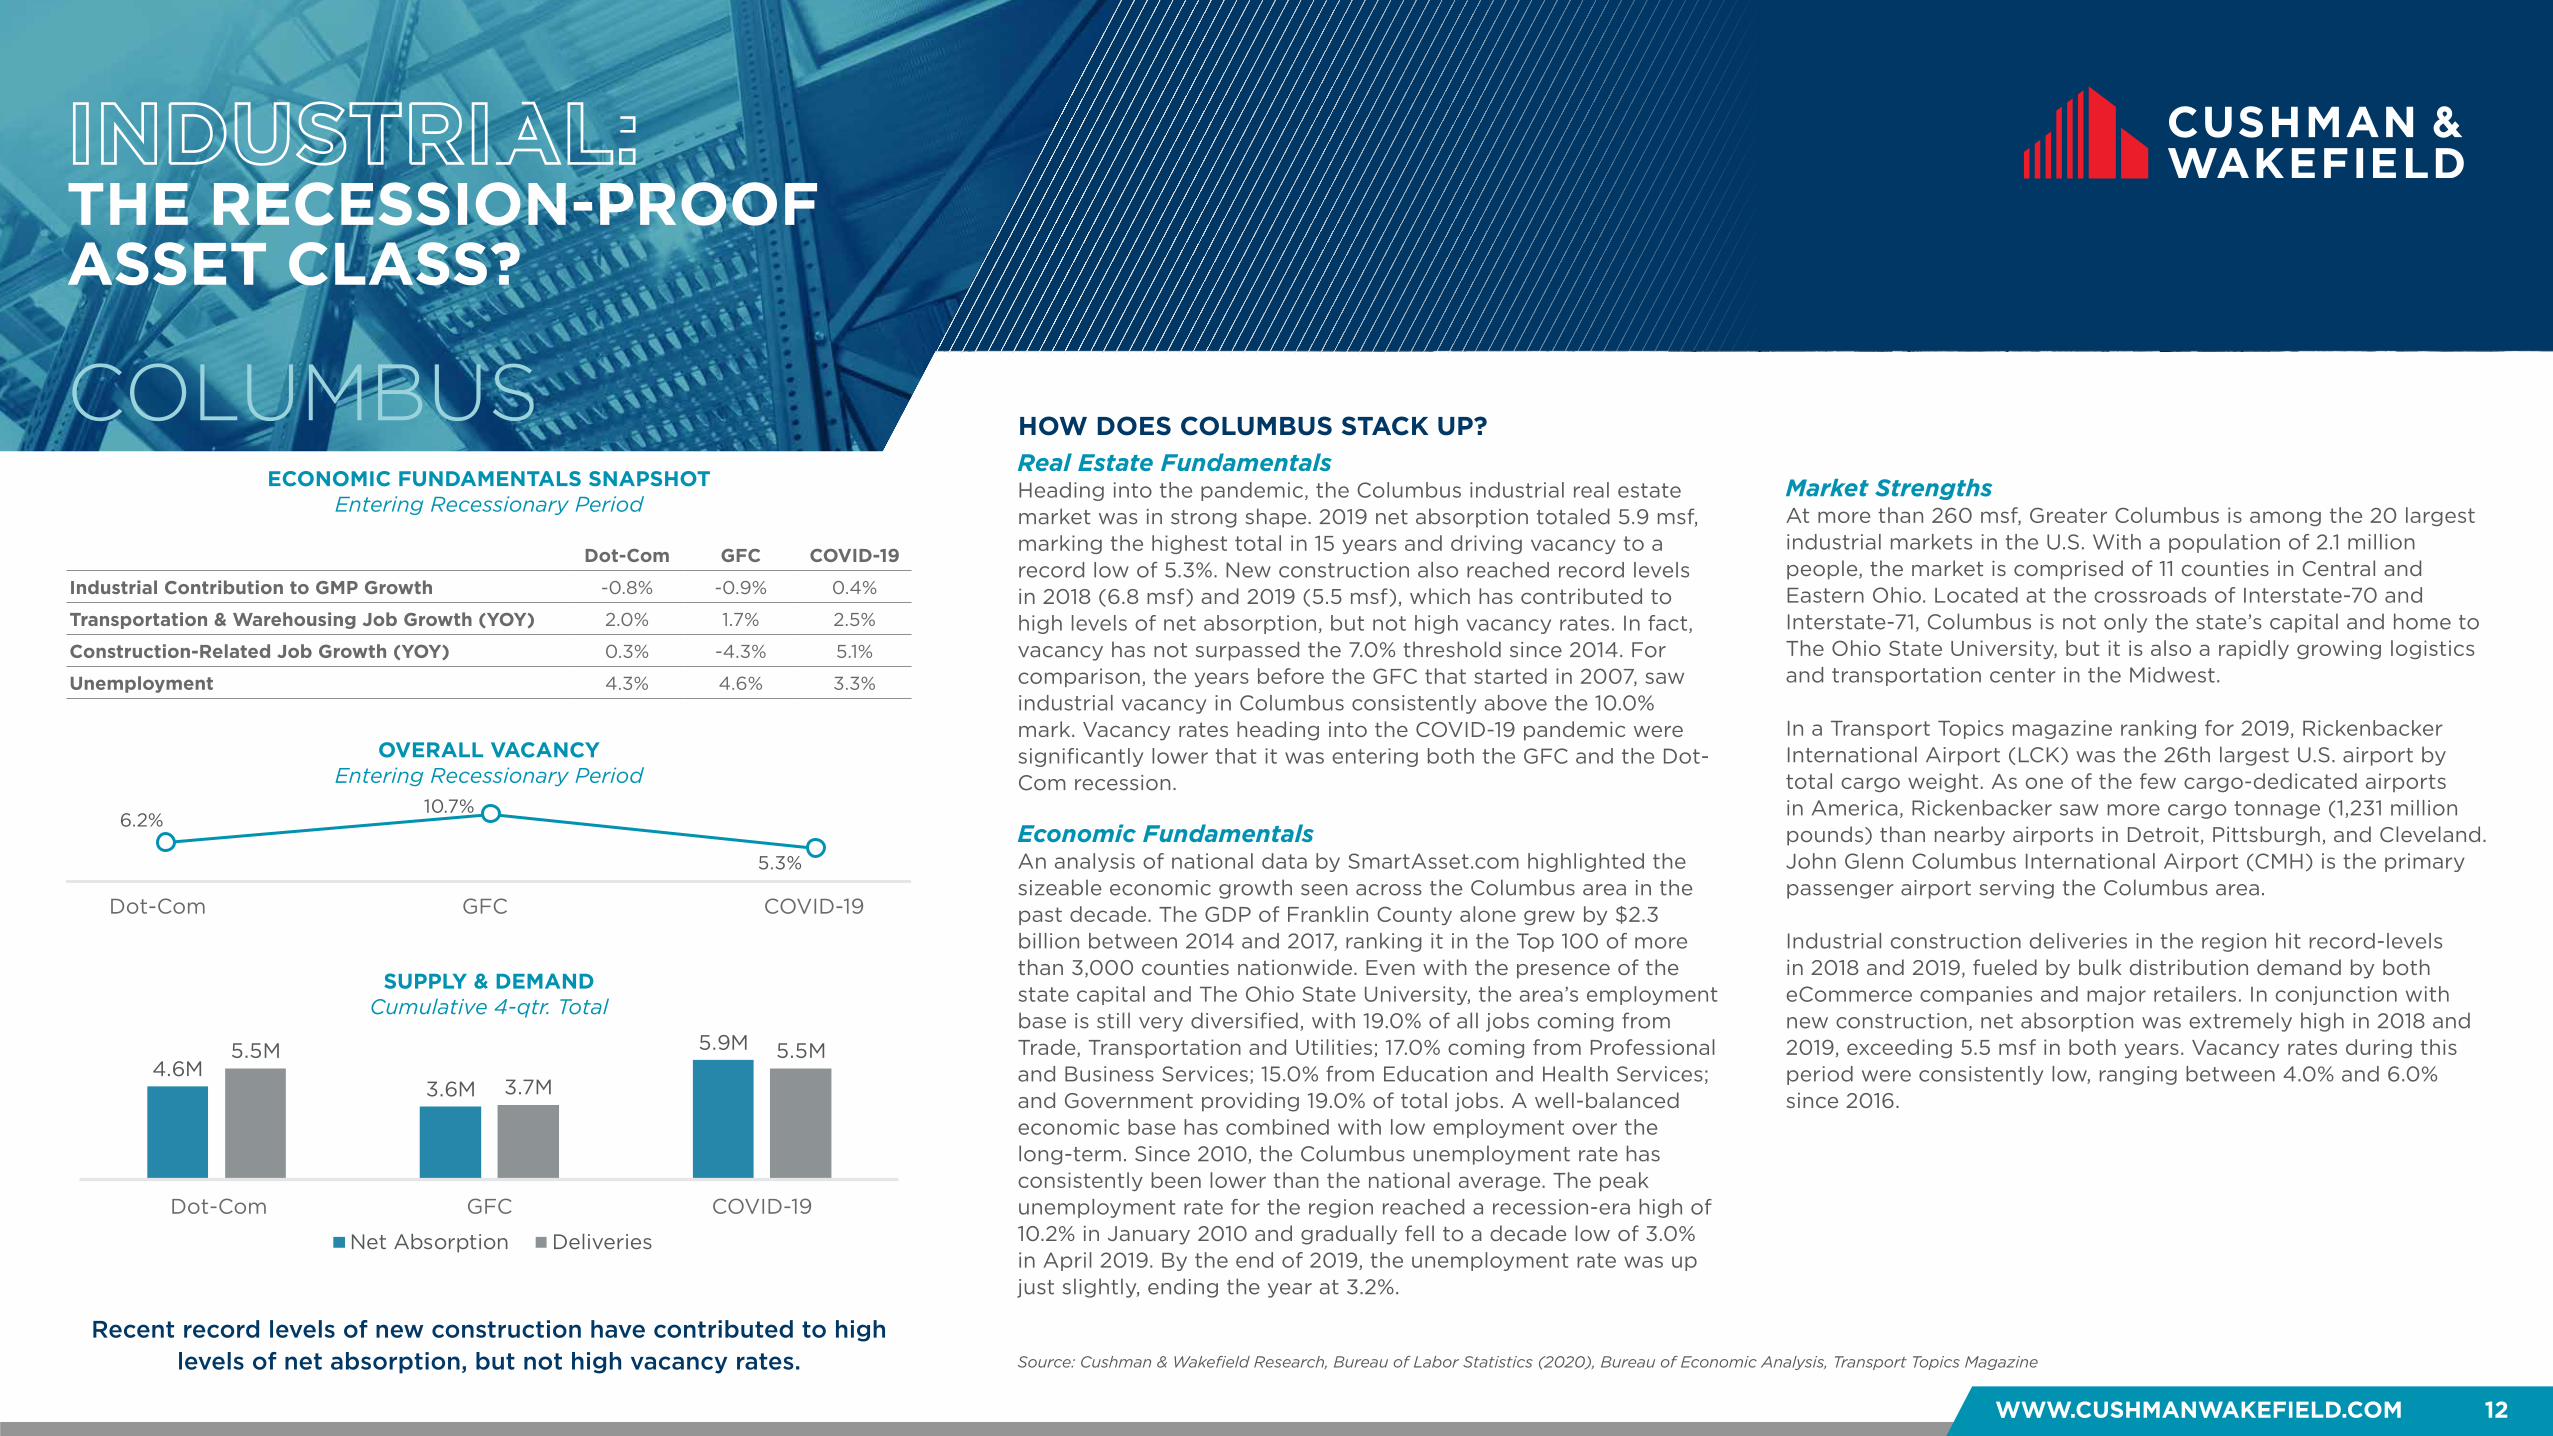
Recent record levels of new construction have contributed to high levels of net absorption, but not high vacancy rates.
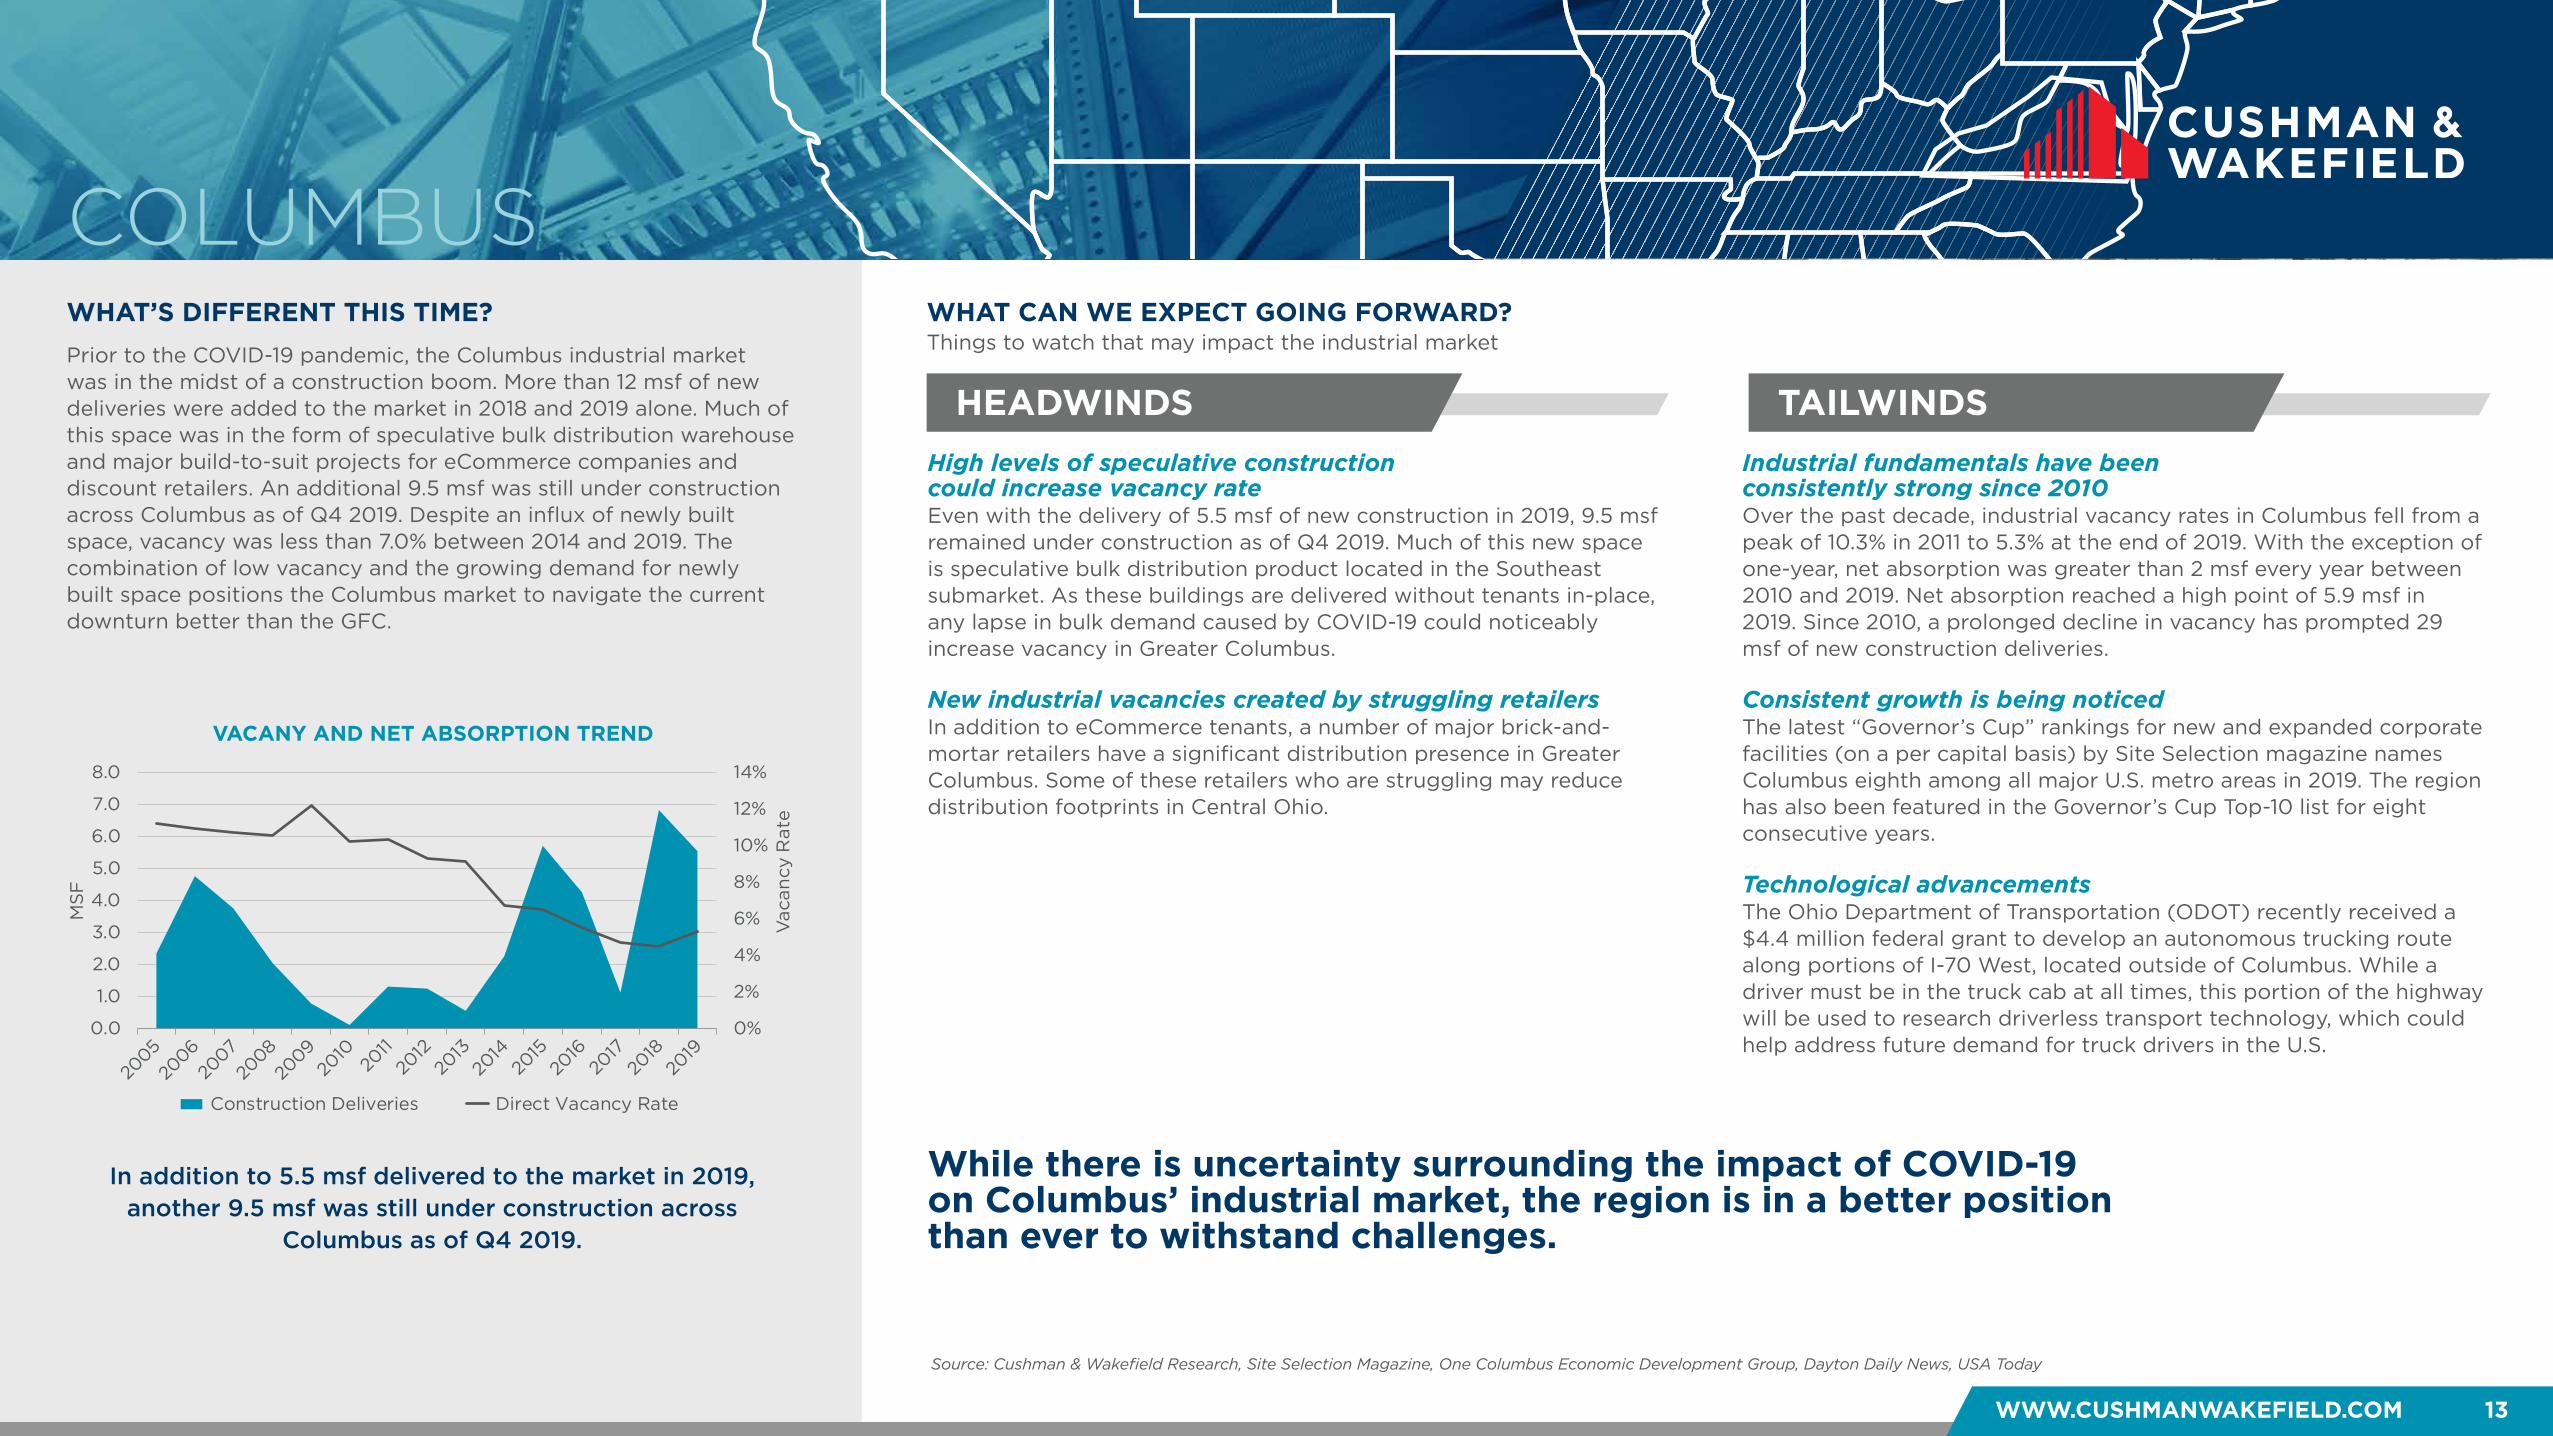
Real Estate FundamentalsHeading into the pandemic, the Columbus industrial real estate market was in strong shape. 2019 net absorption totaled 5.9 msf, marking the highest total in 15 years and driving vacancy to a record low of 5.3%. New construction also reached record levels in 2018 (6.8 msf) and 2019 (5.5 msf), which has contributed to high levels of net absorption, but not high vacancy rates. In fact, vacancy has not surpassed the 7.0% threshold since 2014. For comparison, the years before the GFC that started in 2007, saw industrial vacancy in Columbus consistently above the 10.0% mark. Vacancy rates heading into the COVID-19 pandemic were significantly lower that it was entering both the GFC and the Dot-Com recession.
Economic FundamentalsAn analysis of national data by SmartAsset.com highlighted the sizeable economic growth seen across the Columbus area in the past decade. The GDP of Franklin County alone grew by $2.3 billion between 2014 and 2017, ranking it in the Top 100 of more than 3,000 counties nationwide. Even with the presence of the state capital and The Ohio State University, the area’s employment base is still very diversified, with 19.0% of all jobs coming from Trade, Transportation and Utilities; 17.0% coming from Professional and Business Services; 15.0% from Education and Health Services; and Government providing 19.0% of total jobs. A well-balanced economic base has combined with low employment over the long-term. Since 2010, the Columbus unemployment rate has consistently been lower than the national average. The peak unemployment rate for the region reached a recession-era high of 10.2% in January 2010 and gradually fell to a decade low of 3.0% in April 2019. By the end of 2019, the unemployment rate was up just slightly, ending the year at 3.2%.
Market StrengthsAt more than 260 msf, Greater Columbus is among the 20 largest industrial markets in the U.S. With a population of 2.1 million people, the market is comprised of 11 counties in Central and Eastern Ohio. Located at the crossroads of Interstate-70 and Interstate-71, Columbus is not only the state’s capital and home to The Ohio State University, but it is also a rapidly growing logistics and transportation center in the Midwest. In a Transport Topics magazine ranking for 2019, Rickenbacker International Airport (LCK) was the 26th largest U.S. airport by total cargo weight. As one of the few cargo-dedicated airports in America, Rickenbacker saw more cargo tonnage (1,231 million pounds) than nearby airports in Detroit, Pittsburgh, and Cleveland. John Glenn Columbus International Airport (CMH) is the primary passenger airport serving the Columbus area. Industrial construction deliveries in the region hit record-levels in 2018 and 2019, fueled by bulk distribution demand by both eCommerce companies and major retailers. In conjunction with new construction, net absorption was extremely high in 2018 and 2019, exceeding 5.5 msf in both years. Vacancy rates during this period were consistently low, ranging between 4.0% and 6.0% since 2016.
Source: Cushman & Wakefield Research, Bureau of Labor Statistics (2020), Bureau of Economic Analysis, Transport Topics Magazine
Dot-Com GFC COVID-19
Industrial Contribution to GMP Growth -0.8% -0.9% 0.4%
Transportation & Warehousing Job Growth (YOY) 2.0% 1.7% 2.5%
Construction-Related Job Growth (YOY) 0.3% -4.3% 5.1%
Unemployment 4.3% 4.6% 3.3%
6.2%10.7%
5.3%
Dot Com Financial Crisis COVID-19
4.6M3.6M
5.9M5.5M
3.7M
5.5M
Dot Com Financial Crisis COVID-19
Net Absorption Deliveries
ECONOMIC FUNDAMENTALS SNAPSHOTEntering Recessionary Period
Dot-Com GFC COVID-19
Dot-Com GFC COVID-19
WHAT’S DIFFERENT THIS TIME?
HEADWINDS TAILWINDS
WHAT CAN WE EXPECT GOING FORWARD?
WWW.CUSHMANWAKEFIELD.COM 13
Things to watch that may impact the industrial market
COLUMBUS
While there is uncertainty surrounding the impact of COVID-19 on Columbus’ industrial market, the region is in a better position than ever to withstand challenges.
High levels of speculative construction could increase vacancy rate Even with the delivery of 5.5 msf of new construction in 2019, 9.5 msf remained under construction as of Q4 2019. Much of this new space is speculative bulk distribution product located in the Southeast submarket. As these buildings are delivered without tenants in-place, any lapse in bulk demand caused by COVID-19 could noticeably increase vacancy in Greater Columbus.
New industrial vacancies created by struggling retailers In addition to eCommerce tenants, a number of major brick-and-mortar retailers have a significant distribution presence in Greater Columbus. Some of these retailers who are struggling may reduce distribution footprints in Central Ohio.
Industrial fundamentals have been consistently strong since 2010 Over the past decade, industrial vacancy rates in Columbus fell from a peak of 10.3% in 2011 to 5.3% at the end of 2019. With the exception of one-year, net absorption was greater than 2 msf every year between 2010 and 2019. Net absorption reached a high point of 5.9 msf in 2019. Since 2010, a prolonged decline in vacancy has prompted 29 msf of new construction deliveries. Consistent growth is being noticed The latest “Governor’s Cup” rankings for new and expanded corporate facilities (on a per capital basis) by Site Selection magazine names Columbus eighth among all major U.S. metro areas in 2019. The region has also been featured in the Governor’s Cup Top-10 list for eight consecutive years. Technological advancements The Ohio Department of Transportation (ODOT) recently received a $4.4 million federal grant to develop an autonomous trucking route along portions of I-70 West, located outside of Columbus. While a driver must be in the truck cab at all times, this portion of the highway will be used to research driverless transport technology, which could help address future demand for truck drivers in the U.S.
In addition to 5.5 msf delivered to the market in 2019, another 9.5 msf was still under construction across
Columbus as of Q4 2019.
Prior to the COVID-19 pandemic, the Columbus industrial market was in the midst of a construction boom. More than 12 msf of new deliveries were added to the market in 2018 and 2019 alone. Much of this space was in the form of speculative bulk distribution warehouse and major build-to-suit projects for eCommerce companies and discount retailers. An additional 9.5 msf was still under construction across Columbus as of Q4 2019. Despite an influx of newly built space, vacancy was less than 7.0% between 2014 and 2019. The combination of low vacancy and the growing demand for newly built space positions the Columbus market to navigate the current downturn better than the GFC.
Source: Cushman & Wakefield Research, Site Selection Magazine, One Columbus Economic Development Group, Dayton Daily News, USA Today
VACANY AND NET ABSORPTION TREND
0%
2%
4%
6%
8%
10%
12%
14%
0.0
1.0
2.0
3.0
4.0
5.0
6.0
7.0
8.0V
acan
cy R
ate
MS
F
Construction Deliveries Direct Vacancy Rate
WWW.CUSHMANWAKEFIELD.COM 14
INDUSTRIAL: THE RECESSION-PROOF ASSET CLASS?
OVERALL VACANCYEntering Recessionary Period
SUPPLY & DEMANDLast 5 Years
HOW DOES DALLAS-FORT WORTH STACK UP?
DALLAS- FORT WORTH
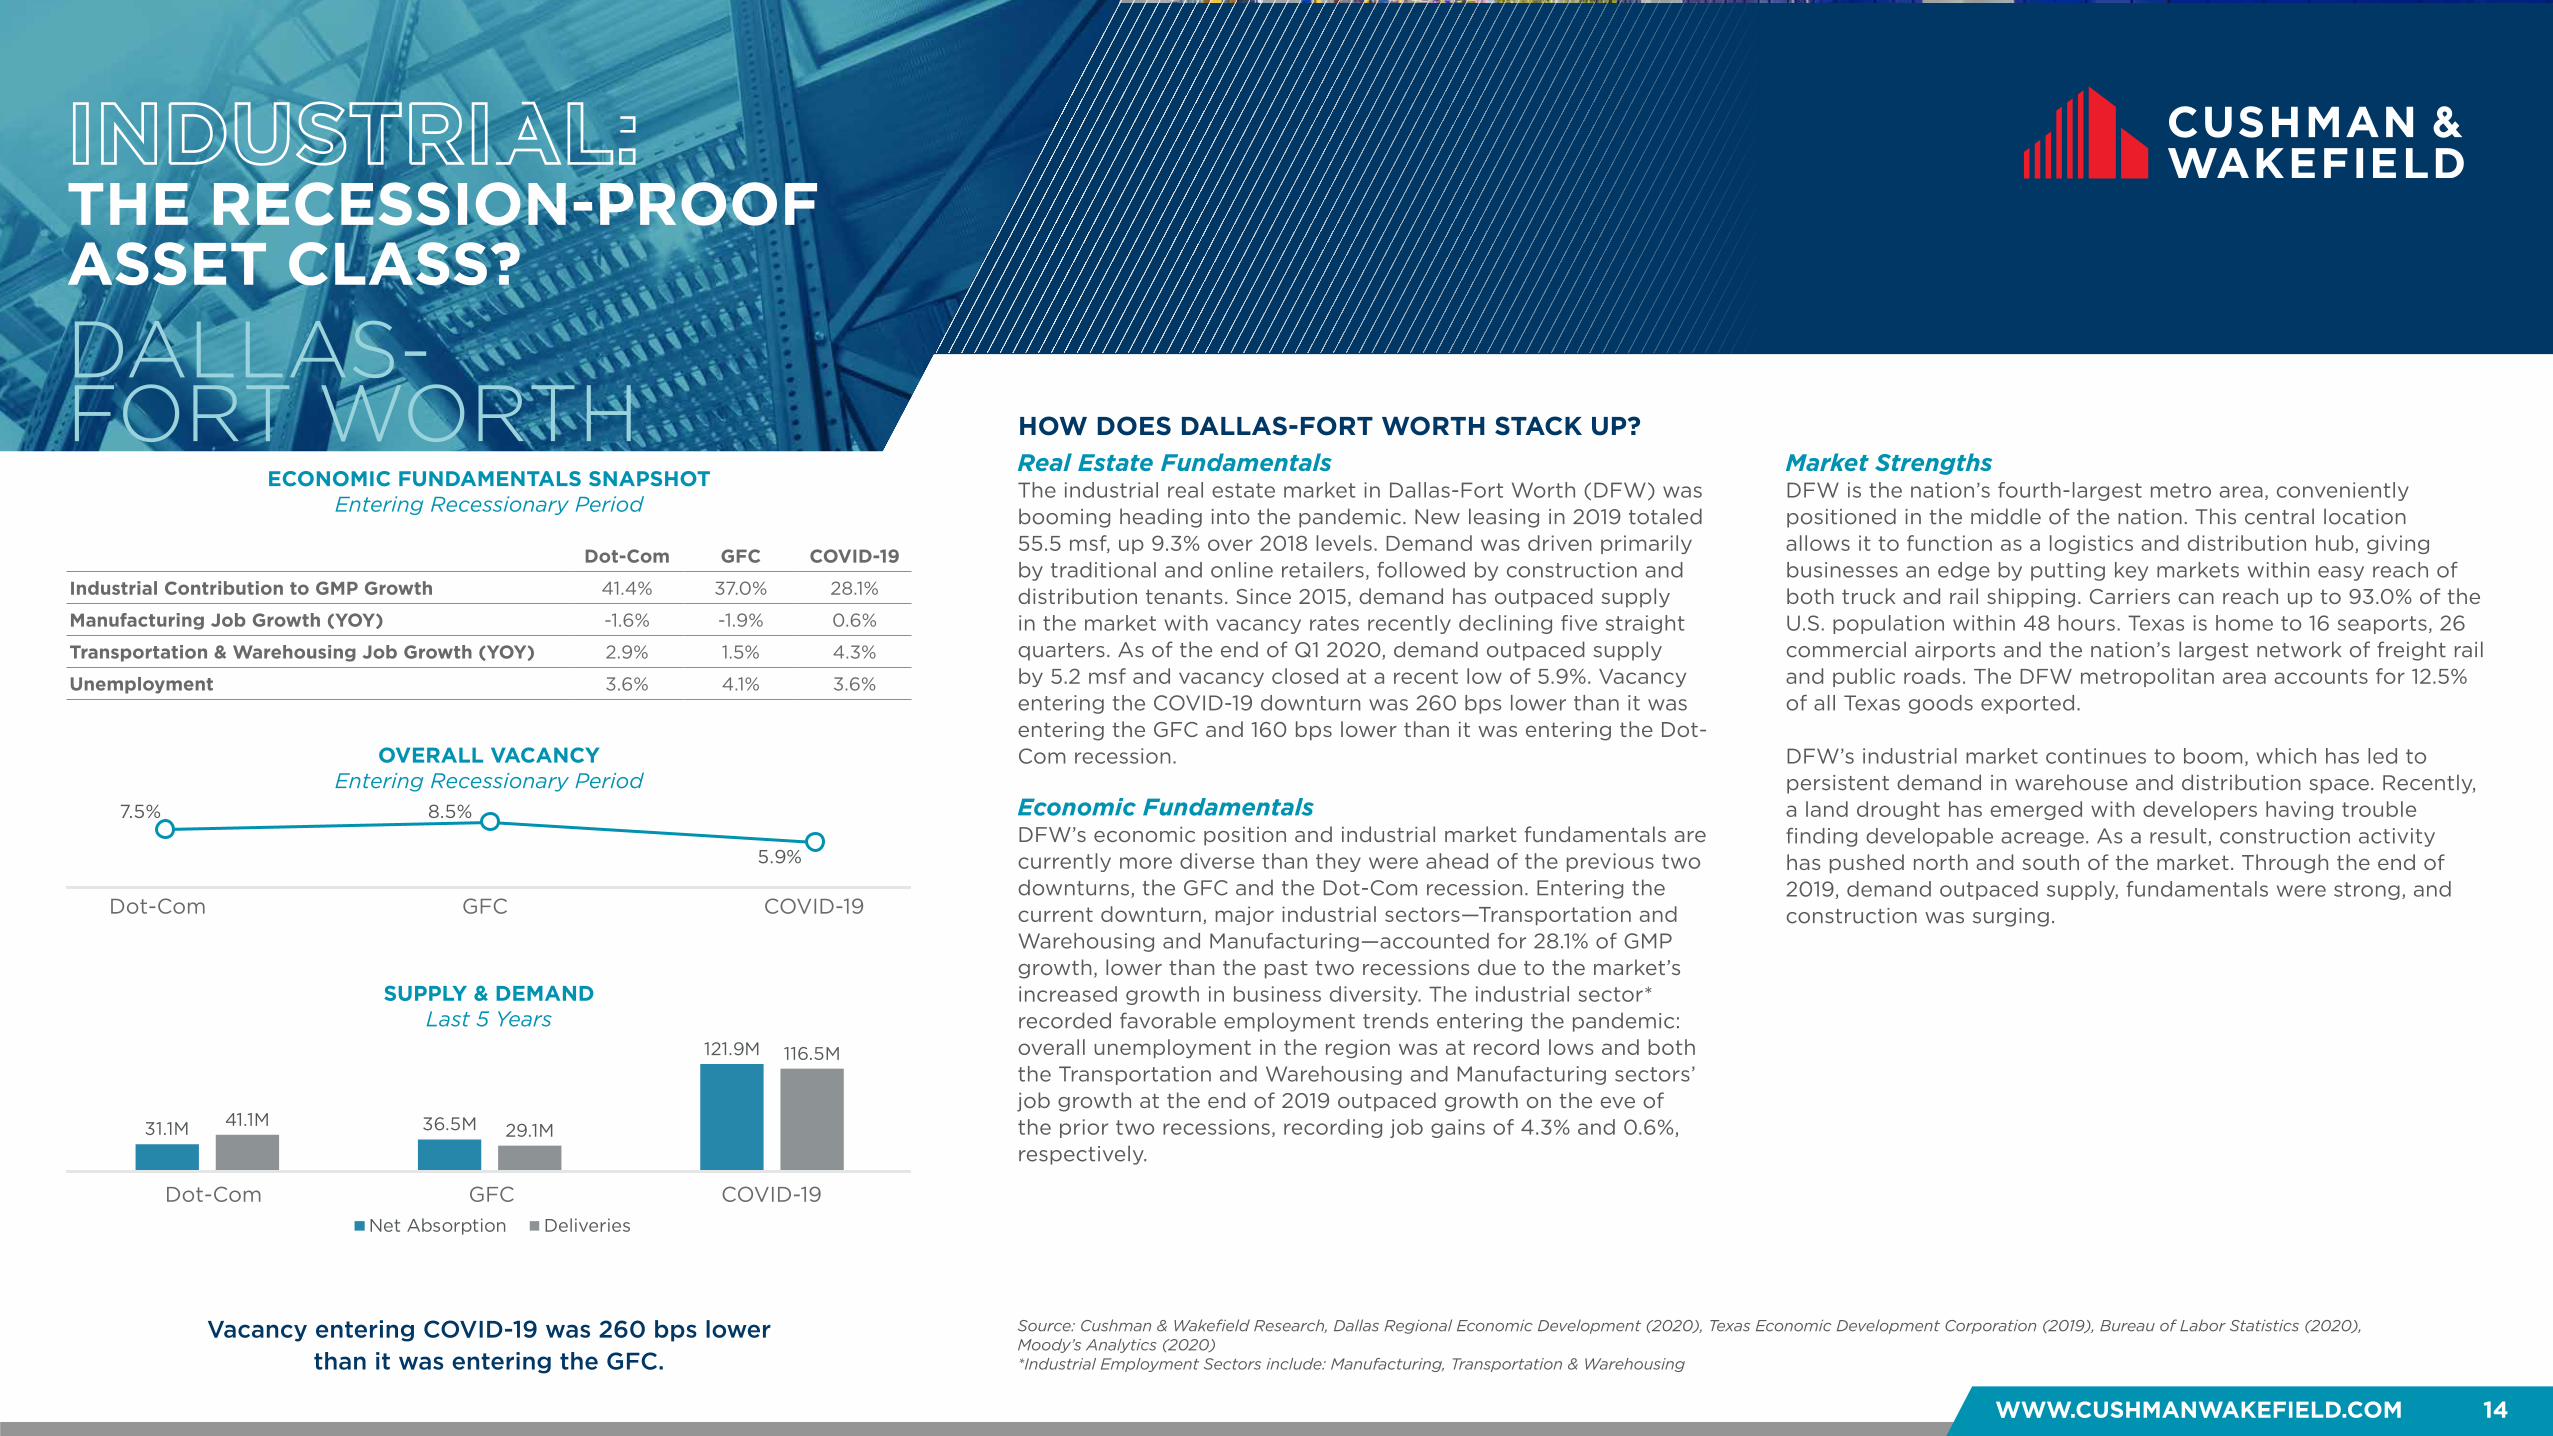
Vacancy entering COVID-19 was 260 bps lower than it was entering the GFC.
Real Estate FundamentalsThe industrial real estate market in Dallas-Fort Worth (DFW) was booming heading into the pandemic. New leasing in 2019 totaled 55.5 msf, up 9.3% over 2018 levels. Demand was driven primarily by traditional and online retailers, followed by construction and distribution tenants. Since 2015, demand has outpaced supply in the market with vacancy rates recently declining five straight quarters. As of the end of Q1 2020, demand outpaced supply by 5.2 msf and vacancy closed at a recent low of 5.9%. Vacancy entering the COVID-19 downturn was 260 bps lower than it was entering the GFC and 160 bps lower than it was entering the Dot-Com recession.
Economic FundamentalsDFW’s economic position and industrial market fundamentals are currently more diverse than they were ahead of the previous two downturns, the GFC and the Dot-Com recession. Entering the current downturn, major industrial sectors—Transportation and Warehousing and Manufacturing—accounted for 28.1% of GMP growth, lower than the past two recessions due to the market’s increased growth in business diversity. The industrial sector* recorded favorable employment trends entering the pandemic: overall unemployment in the region was at record lows and both the Transportation and Warehousing and Manufacturing sectors’ job growth at the end of 2019 outpaced growth on the eve of the prior two recessions, recording job gains of 4.3% and 0.6%, respectively.
Market StrengthsDFW is the nation’s fourth-largest metro area, conveniently positioned in the middle of the nation. This central location allows it to function as a logistics and distribution hub, giving businesses an edge by putting key markets within easy reach of both truck and rail shipping. Carriers can reach up to 93.0% of the U.S. population within 48 hours. Texas is home to 16 seaports, 26 commercial airports and the nation’s largest network of freight rail and public roads. The DFW metropolitan area accounts for 12.5% of all Texas goods exported. DFW’s industrial market continues to boom, which has led to persistent demand in warehouse and distribution space. Recently, a land drought has emerged with developers having trouble finding developable acreage. As a result, construction activity has pushed north and south of the market. Through the end of 2019, demand outpaced supply, fundamentals were strong, and construction was surging.
Source: Cushman & Wakefield Research, Dallas Regional Economic Development (2020), Texas Economic Development Corporation (2019), Bureau of Labor Statistics (2020), Moody’s Analytics (2020)*Industrial Employment Sectors include: Manufacturing, Transportation & Warehousing
Dot-Com GFC COVID-19
Industrial Contribution to GMP Growth 41.4% 37.0% 28.1%
Manufacturing Job Growth (YOY) -1.6% -1.9% 0.6%
Transportation & Warehousing Job Growth (YOY) 2.9% 1.5% 4.3%
Unemployment 3.6% 4.1% 3.6%
7.5% 8.5%
5.9%
Dot Com Financial Crisis COVID-19
ECONOMIC FUNDAMENTALS SNAPSHOTEntering Recessionary Period
31.1M 36.5M
121.9M
41.1M 29.1M
116.5M
Dot Com Financial Crisis COVID-19
Net Absorption Deliveries
Dot-Com GFC COVID-19
Dot-Com GFC COVID-19
WHAT’S DIFFERENT THIS TIME?
HEADWINDS TAILWINDS
WHAT CAN WE EXPECT GOING FORWARD?
WWW.CUSHMANWAKEFIELD.COM 15
Things to watch that may impact the industrial market
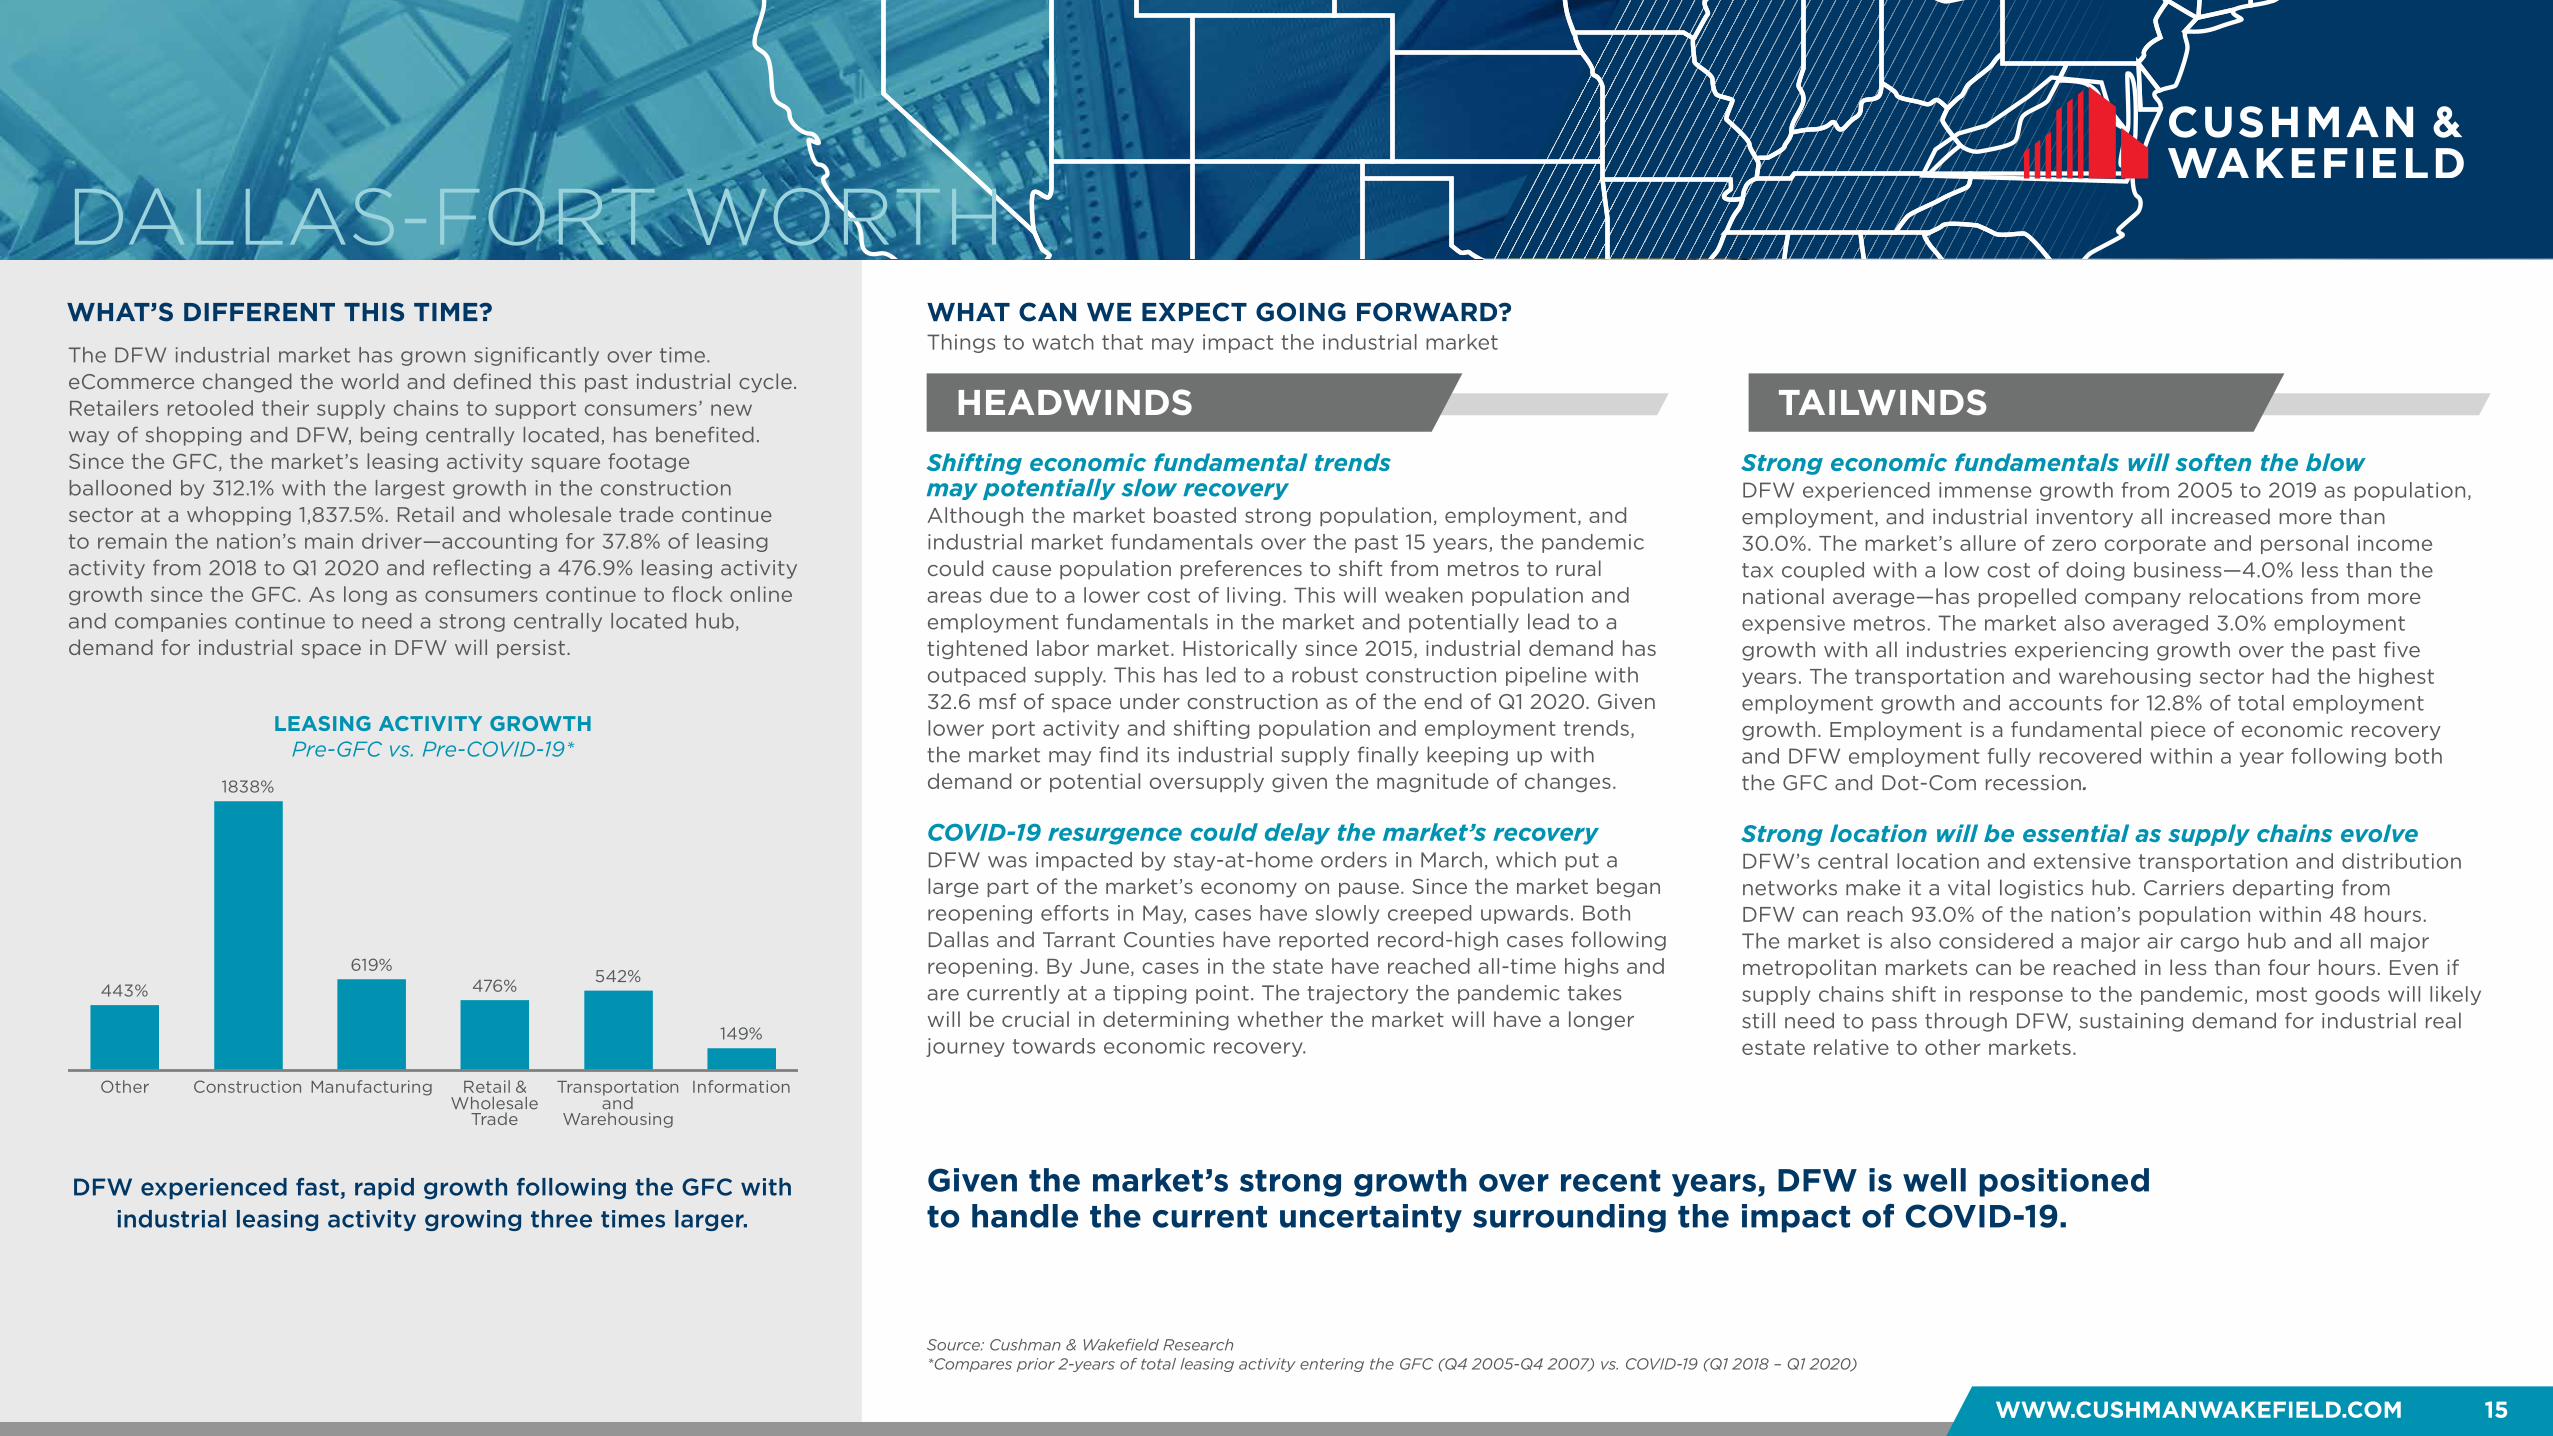
LEASING ACTIVITY GROWTH Pre-GFC vs. Pre-COVID-19*
DALLAS-FORT WORTH
Given the market’s strong growth over recent years, DFW is well positioned to handle the current uncertainty surrounding the impact of COVID-19.
Shifting economic fundamental trends may potentially slow recovery Although the market boasted strong population, employment, and industrial market fundamentals over the past 15 years, the pandemic could cause population preferences to shift from metros to rural areas due to a lower cost of living. This will weaken population and employment fundamentals in the market and potentially lead to a tightened labor market. Historically since 2015, industrial demand has outpaced supply. This has led to a robust construction pipeline with 32.6 msf of space under construction as of the end of Q1 2020. Given lower port activity and shifting population and employment trends, the market may find its industrial supply finally keeping up with demand or potential oversupply given the magnitude of changes. COVID-19 resurgence could delay the market’s recovery DFW was impacted by stay-at-home orders in March, which put a large part of the market’s economy on pause. Since the market began reopening efforts in May, cases have slowly creeped upwards. Both Dallas and Tarrant Counties have reported record-high cases following reopening. By June, cases in the state have reached all-time highs and are currently at a tipping point. The trajectory the pandemic takes will be crucial in determining whether the market will have a longer journey towards economic recovery.
Strong economic fundamentals will soften the blow DFW experienced immense growth from 2005 to 2019 as population, employment, and industrial inventory all increased more than 30.0%. The market’s allure of zero corporate and personal income tax coupled with a low cost of doing business—4.0% less than the national average—has propelled company relocations from more expensive metros. The market also averaged 3.0% employment growth with all industries experiencing growth over the past five years. The transportation and warehousing sector had the highest employment growth and accounts for 12.8% of total employment growth. Employment is a fundamental piece of economic recovery and DFW employment fully recovered within a year following both the GFC and Dot-Com recession. Strong location will be essential as supply chains evolve DFW’s central location and extensive transportation and distribution networks make it a vital logistics hub. Carriers departing from DFW can reach 93.0% of the nation’s population within 48 hours. The market is also considered a major air cargo hub and all major metropolitan markets can be reached in less than four hours. Even if supply chains shift in response to the pandemic, most goods will likely still need to pass through DFW, sustaining demand for industrial real estate relative to other markets.
DFW experienced fast, rapid growth following the GFC with industrial leasing activity growing three times larger.
The DFW industrial market has grown significantly over time. eCommerce changed the world and defined this past industrial cycle. Retailers retooled their supply chains to support consumers’ new way of shopping and DFW, being centrally located, has benefited. Since the GFC, the market’s leasing activity square footage ballooned by 312.1% with the largest growth in the construction sector at a whopping 1,837.5%. Retail and wholesale trade continue to remain the nation’s main driver—accounting for 37.8% of leasing activity from 2018 to Q1 2020 and reflecting a 476.9% leasing activity growth since the GFC. As long as consumers continue to flock online and companies continue to need a strong centrally located hub, demand for industrial space in DFW will persist.
443%
1838%
619%476% 542%
149%
Other Construction Manufacturing Retail & Wholesale
Trade
Transportation and
Warehousing
Information
Source: Cushman & Wakefield Research*Compares prior 2-years of total leasing activity entering the GFC (Q4 2005-Q4 2007) vs. COVID-19 (Q1 2018 – Q1 2020)
WWW.CUSHMANWAKEFIELD.COM 16
INDUSTRIAL: THE RECESSION-PROOF ASSET CLASS?
OVERALL VACANCYEntering Recessionary Period
SUPPLY & DEMANDLast 3 Years
HOW DOES DENVER STACK UP?DENVER
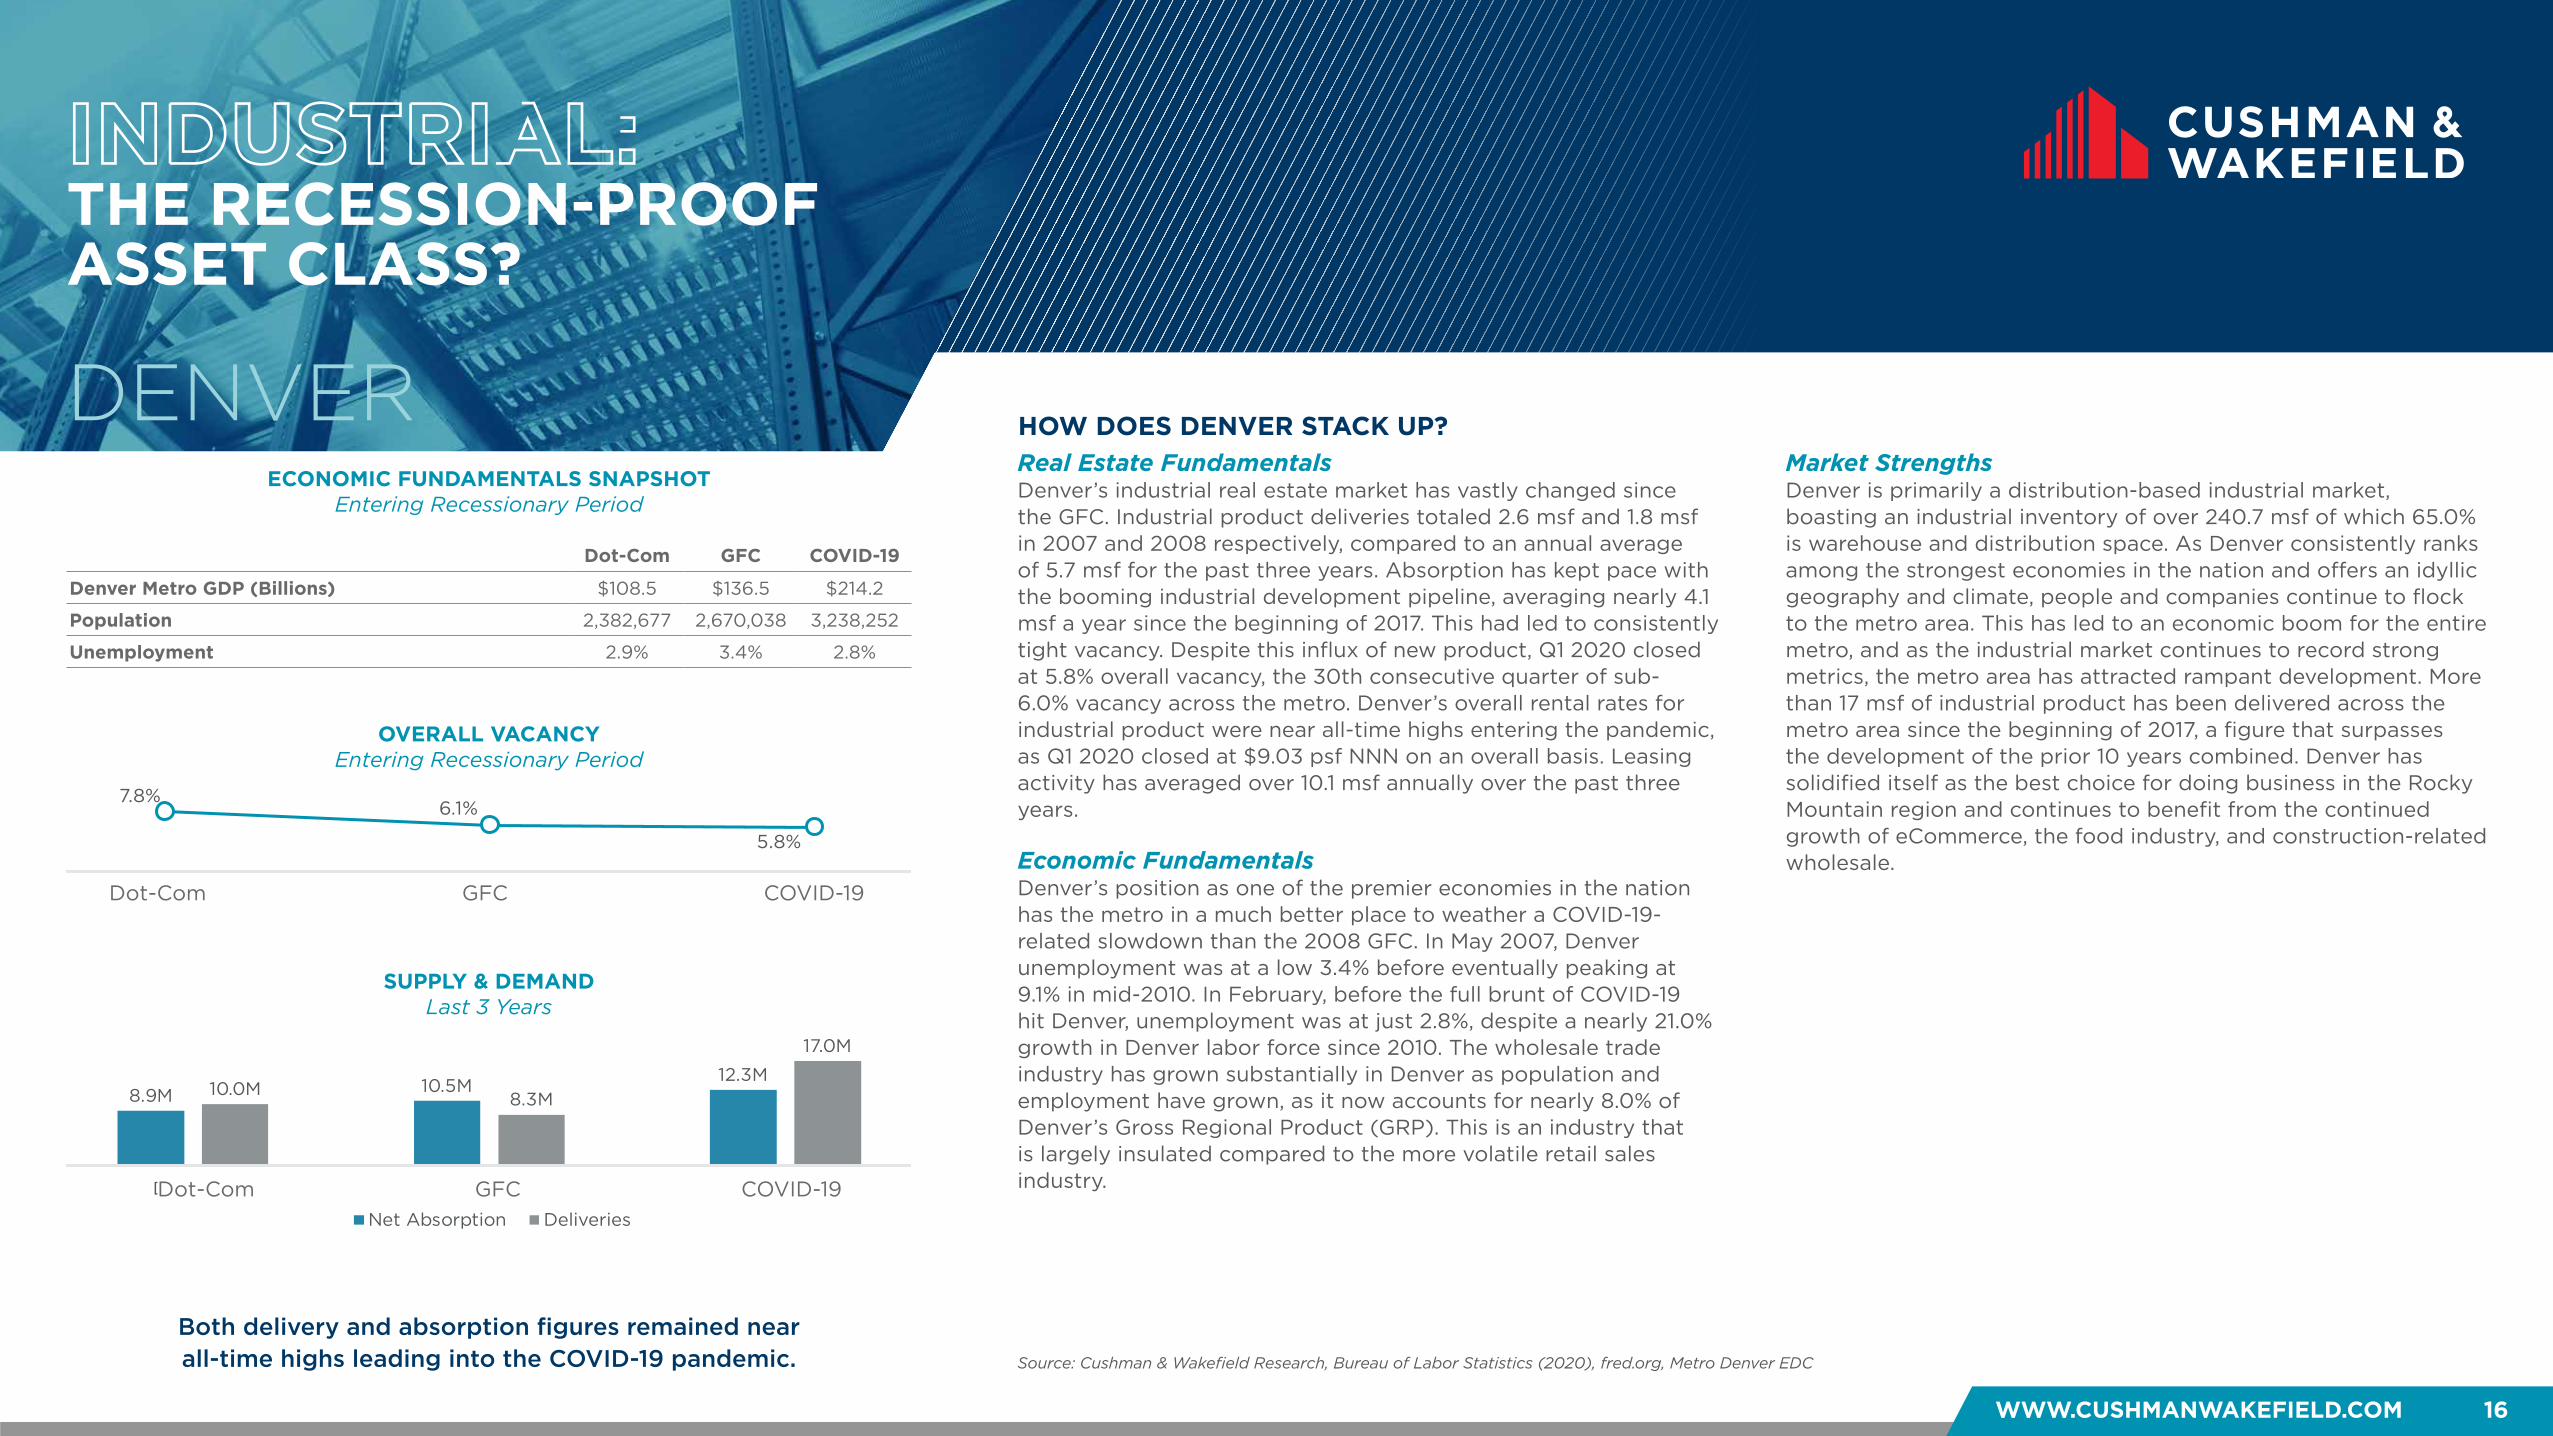
Both delivery and absorption figures remained near all-time highs leading into the COVID-19 pandemic.
Real Estate FundamentalsDenver’s industrial real estate market has vastly changed since the GFC. Industrial product deliveries totaled 2.6 msf and 1.8 msf in 2007 and 2008 respectively, compared to an annual average of 5.7 msf for the past three years. Absorption has kept pace with the booming industrial development pipeline, averaging nearly 4.1 msf a year since the beginning of 2017. This had led to consistently tight vacancy. Despite this influx of new product, Q1 2020 closed at 5.8% overall vacancy, the 30th consecutive quarter of sub-6.0% vacancy across the metro. Denver’s overall rental rates for industrial product were near all-time highs entering the pandemic, as Q1 2020 closed at $9.03 psf NNN on an overall basis. Leasing activity has averaged over 10.1 msf annually over the past three years.
Economic FundamentalsDenver’s position as one of the premier economies in the nation has the metro in a much better place to weather a COVID-19-related slowdown than the 2008 GFC. In May 2007, Denver unemployment was at a low 3.4% before eventually peaking at 9.1% in mid-2010. In February, before the full brunt of COVID-19 hit Denver, unemployment was at just 2.8%, despite a nearly 21.0% growth in Denver labor force since 2010. The wholesale trade industry has grown substantially in Denver as population and employment have grown, as it now accounts for nearly 8.0% of Denver’s Gross Regional Product (GRP). This is an industry that is largely insulated compared to the more volatile retail sales industry.
Market StrengthsDenver is primarily a distribution-based industrial market, boasting an industrial inventory of over 240.7 msf of which 65.0% is warehouse and distribution space. As Denver consistently ranks among the strongest economies in the nation and offers an idyllic geography and climate, people and companies continue to flock to the metro area. This has led to an economic boom for the entire metro, and as the industrial market continues to record strong metrics, the metro area has attracted rampant development. More than 17 msf of industrial product has been delivered across the metro area since the beginning of 2017, a figure that surpasses the development of the prior 10 years combined. Denver has solidified itself as the best choice for doing business in the Rocky Mountain region and continues to benefit from the continued growth of eCommerce, the food industry, and construction-related wholesale.
Source: Cushman & Wakefield Research, Bureau of Labor Statistics (2020), fred.org, Metro Denver EDC
Dot-Com GFC COVID-19
Denver Metro GDP (Billions) $108.5 $136.5 $214.2
Population 2,382,677 2,670,038 3,238,252
Unemployment 2.9% 3.4% 2.8%
7.8%6.1%
5.8%
Dot Com Financial Crisis COVID-19
ECONOMIC FUNDAMENTALS SNAPSHOTEntering Recessionary Period
8.9M 10.5M 12.3M10.0M 8.3M
17.0M
Dot Com Financial Crisis COVID-19
Net Absorption Deliveries
Dot-Com GFC COVID-19
Dot-Com GFC COVID-19
WHAT’S DIFFERENT THIS TIME?
HEADWINDS TAILWINDS
WHAT CAN WE EXPECT GOING FORWARD?
WWW.CUSHMANWAKEFIELD.COM 17
Things to watch that may impact the industrial market
DENVER
Over-development concerns Denver has consistently recorded low pre-leasing with strong leasing activity upon delivery during this cycle. So far, vacancy has been able to remain tight, but with 5.1 msf of spec product currently under construction, vacancy could begin to rise quickly if activity in new product slows. This could then lead to falling rental rates if landlords get more aggressive in pursuit of tenants. This will especially impact the Southeast market, which is likely being overbuilt and should see increased competition by way of falling rates. Investor concerns Largely related to the impacts of over-development, if vacancy begins to rise and asking rental rates fall in turn, investors may become wary of the Denver market. This could further emphasize developer attention on the red-hot Northeast and Central submarkets as demand there remains strongest, while the Northwest and Southern submarkets struggle to lease new construction. Cost of living While Denver is still far more favorable than Western tech cities and Northeastern finance hubs, the cost of living is still well above the national average. If people remain unemployed without further stimulus, Denver may begin to see an exodus to the suburbs, or people departing from the metro entirely.
Location Denver is the clear choice for doing business in the Rocky Mountain region and is the largest metro area for a good distance in any direction. Phoenix lies over 13 hours to the south, Kansas City is over nine hours to the east, and there aren’t any substantial metro areas to the north. The nearest large metro area is Salt Lake City to the west, just over eight hours away, and the metros are separated by the Rockies. Industry diversification eCommerce has continued to grow without any signs of slowing and users will continue to require large blocks of space around the metro. Coupled with growth in other construction-related industries, employment and demand in the industrial sector should remain strong. Denver’s pre-pandemic rate of growth Denver is poised for a rapid recovery regardless of the extent of this recession. Strong migration numbers and a booming economy have attracted a wealth of talent, especially in highly educated, younger demographics.
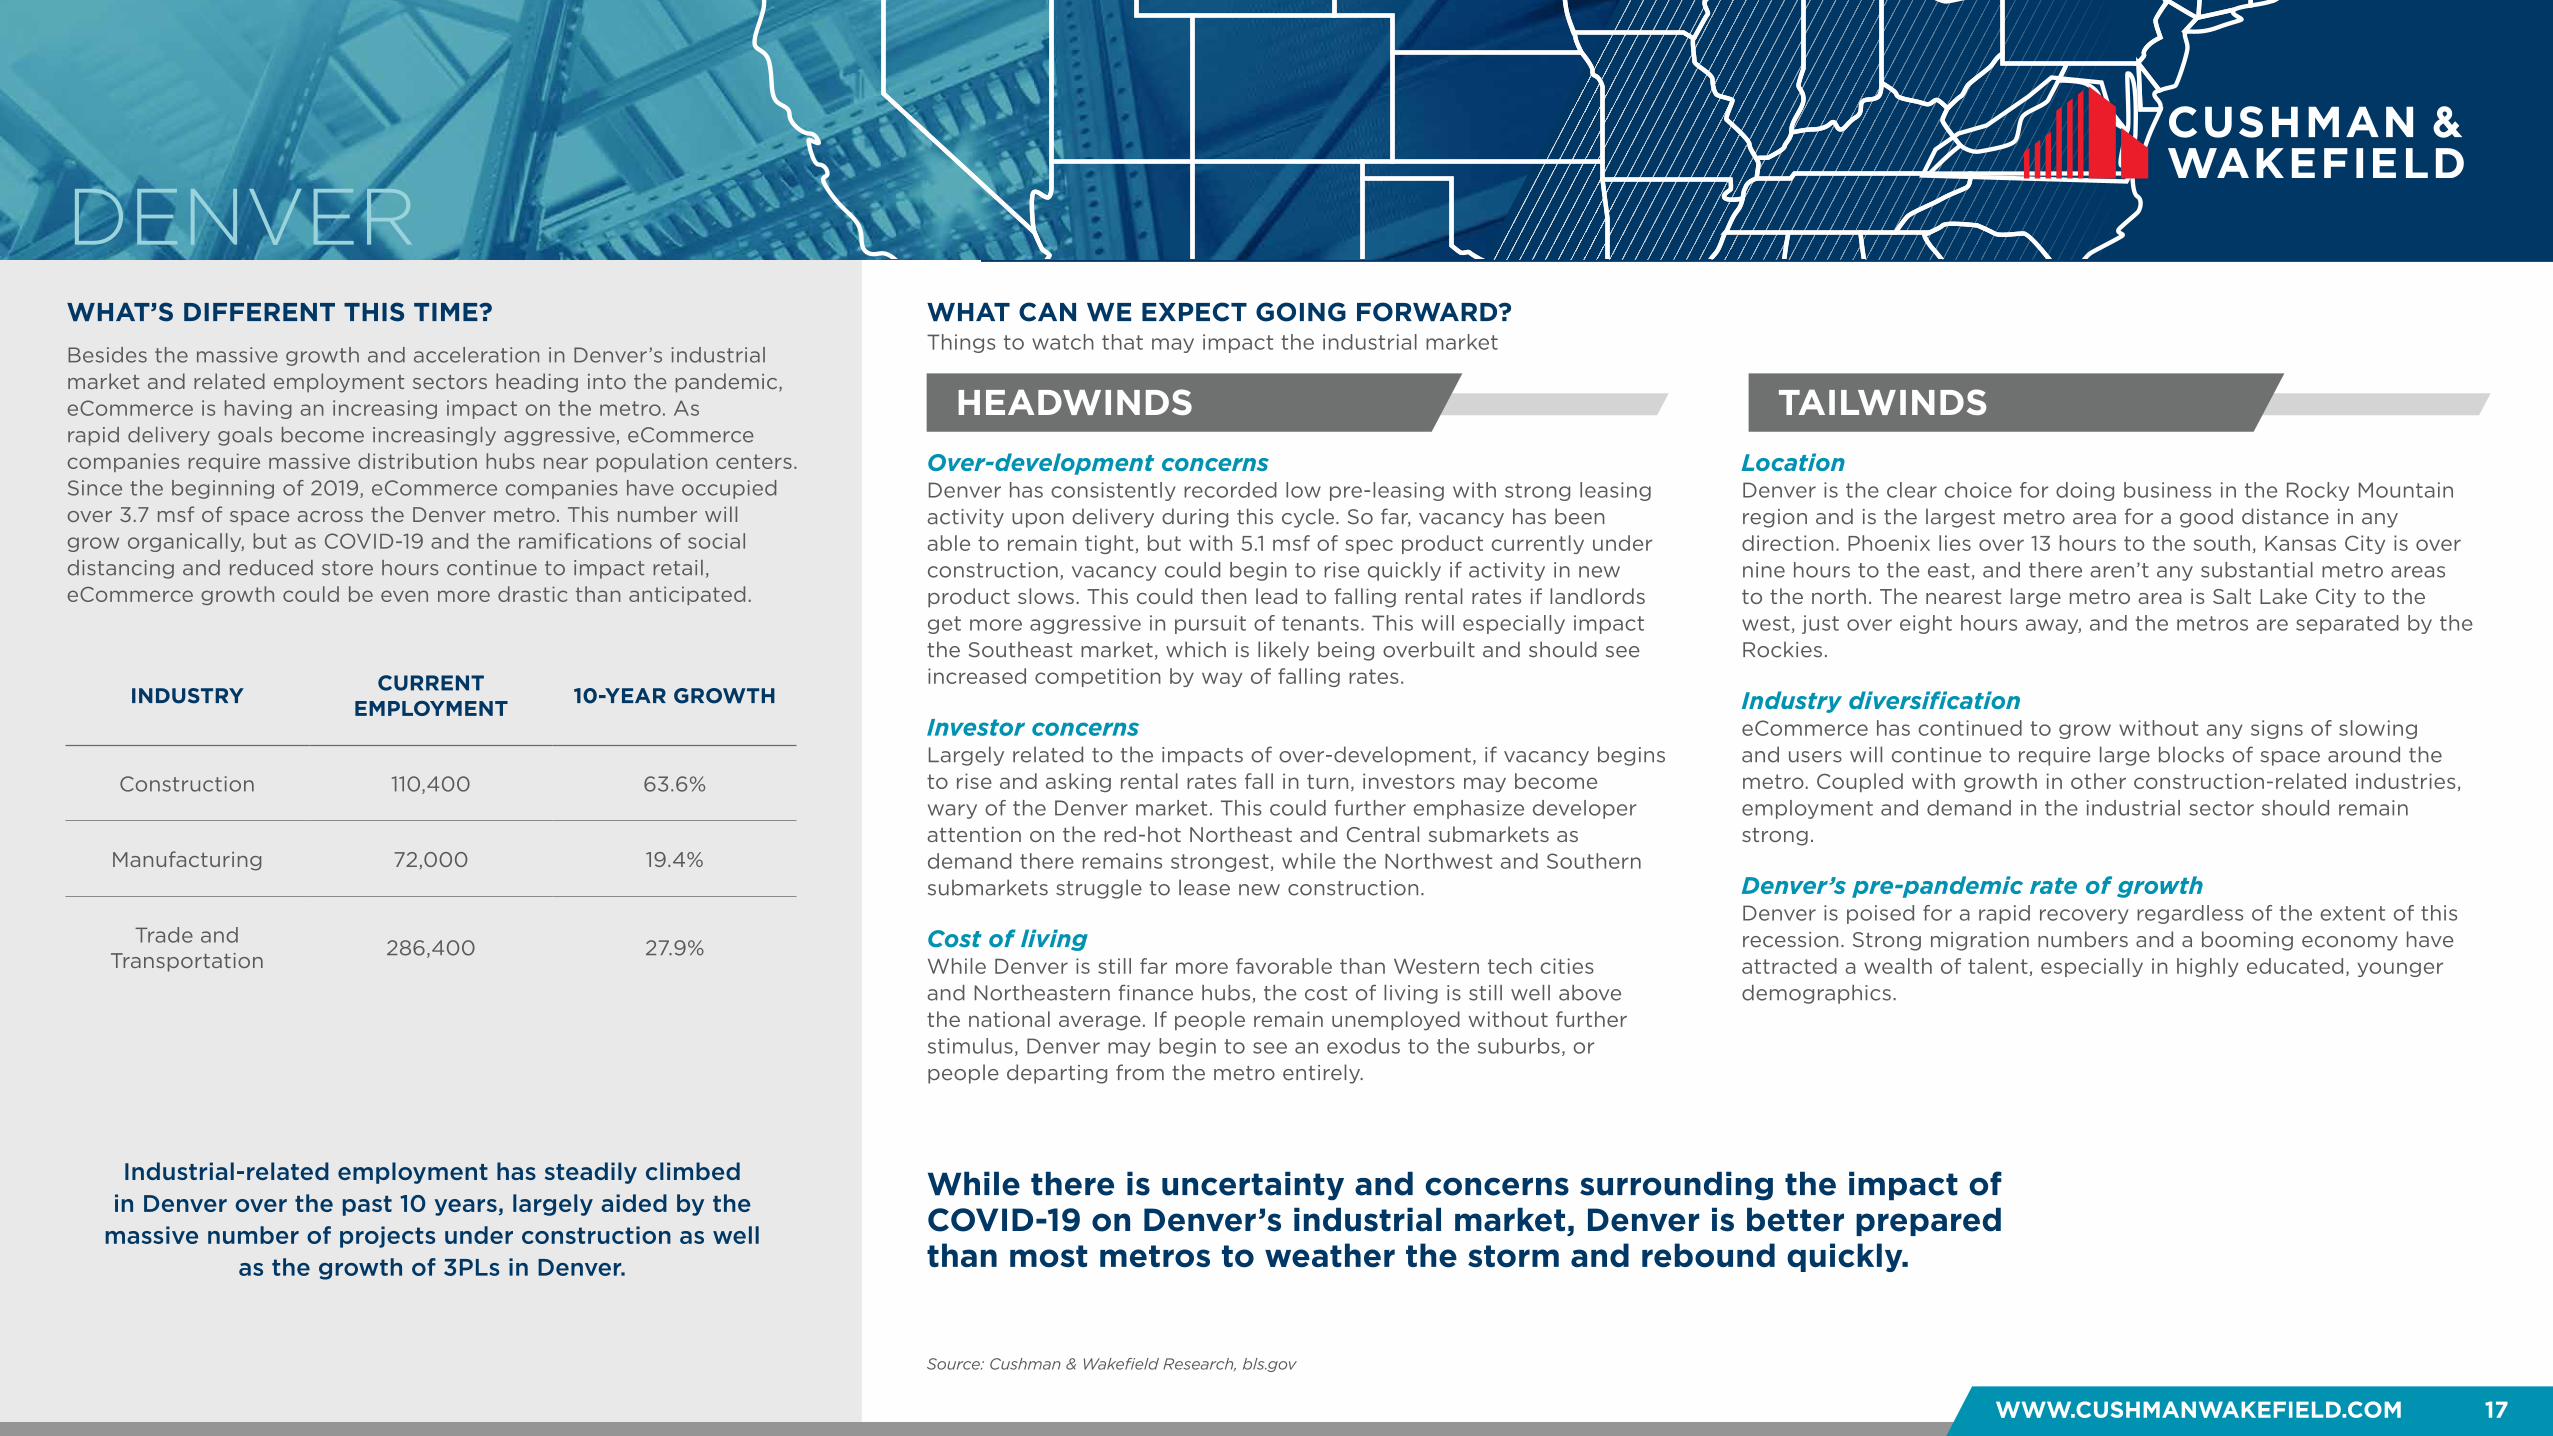
Industrial-related employment has steadily climbed in Denver over the past 10 years, largely aided by the
massive number of projects under construction as well as the growth of 3PLs in Denver.
Besides the massive growth and acceleration in Denver’s industrial market and related employment sectors heading into the pandemic, eCommerce is having an increasing impact on the metro. As rapid delivery goals become increasingly aggressive, eCommerce companies require massive distribution hubs near population centers. Since the beginning of 2019, eCommerce companies have occupied over 3.7 msf of space across the Denver metro. This number will grow organically, but as COVID-19 and the ramifications of social distancing and reduced store hours continue to impact retail, eCommerce growth could be even more drastic than anticipated.
Source: Cushman & Wakefield Research, bls.gov
While there is uncertainty and concerns surrounding the impact of COVID-19 on Denver’s industrial market, Denver is better prepared than most metros to weather the storm and rebound quickly.
INDUSTRY CURRENT EMPLOYMENT 10-YEAR GROWTH
Construction 110,400 63.6%
Manufacturing 72,000 19.4%
Trade and Transportation 286,400 27.9%

WWW.CUSHMANWAKEFIELD.COM 18
INDUSTRIAL: THE RECESSION-PROOF ASSET CLASS?
SUPPLY & DEMAND4-qtr. Rolling
HOW DOES DETROIT STACK UP?DETROIT
Prior to the Dot-Com recession, Metro Detroit’s economy was extremely stable while delivering a large amount of industrial space. Heading into the recent pandemic, Metro Detroit has delivered a significant amount of industrial space along with
5.7 msf of construction underway.
Real Estate FundamentalsOut of state investors continue to show interest in Metro Detroit. Large companies such as Amazon, Rivian, and Faurceia have made considerable investments into the area over the last few years, each adding hundreds of jobs to the economy. The high demand for speculative construction has led to a shortage of space. The vacancy rate heading in to the current pandemic was 3.5%. Ahead of the Dot-Com recession and GFC the vacancy rates were 6.6% and 10.3%, respectively.
Economic FundamentalsDetroit’s economic position and industrial market fundamentals entering the current downturn were in a stronger position than they were prior to the previous two economic downturns this century. While the labor workforce is aging, Metro Detroit’s total population has grown an average 0.1% annually since 2016. Entering COVID-19, the unemployment rate in the Metro Detroit area was 3.8%, compared to 7.1% ahead of the GFC and 4.4% ahead of the Dot-Com Recession. Prior to the GFC Metro Detroit’s Automobile industry had an abundance of extra capacity. A prime
example of this was GM’s former 3 msf powertrain facility (in the Airport/I-75 submarket) which will now be producing electric batteries. As a result, the auto industry in Detroit has been running much leaner heading into this current economic situation.
Market StrengthsDetroit is home not only to the “Big Three” but also to 96 out of the top 100 automotive suppliers in the country. Michigan leads the nation in automotive R&D spending, representing 75.0% of the entire national total. The local industrial sector has also experienced growth in the eCommerce supply chain network over the last few years.
Throughout the most recent economic expansion, there has been a severe strain on speculative availability in Detroit, which still holds true to this day. Since 2016, there has been over 75 speculative industrial completions with 25 speculative buildings currently under construction.
Source: Cushman & Wakefield Research, Surface Transportation Bureau (2018), KC SmartPort (2019), Bureau of Labor Statistics (2020), Bureau of Economic Analysis
Dot-Com GFC COVID-19
Industrial Contribution to GMP Growth -0.3% -0.2% 0.2%
Transportation & Warehousing Job Growth (YOY) -0.3% -5.2% 11.7%
Manufacturing Job Growth (YOY) -8.3% -9.1% -0.6%
Unemployment 4.4% 7.1% 3.8%
OVERALL VACANCYEntering Recessionary Period
6.6% 10.3%
3.5%
Dot Com Financial Crisis COVID-19
ECONOMIC FUNDAMENTALS SNAPSHOTEntering Recessionary Period
0.1M 1.0M2.5M
9.2M
2.6M4.3M
Dot Com Financial Crisis COVID-19
Net Absorption Deliveries
Dot-Com GFC COVID-19
Dot-Com GFC COVID-19
WHAT’S DIFFERENT THIS TIME?
HEADWINDS TAILWINDS
WHAT CAN WE EXPECT GOING FORWARD?
WWW.CUSHMANWAKEFIELD.COM 19
Things to watch that may impact the industrial market
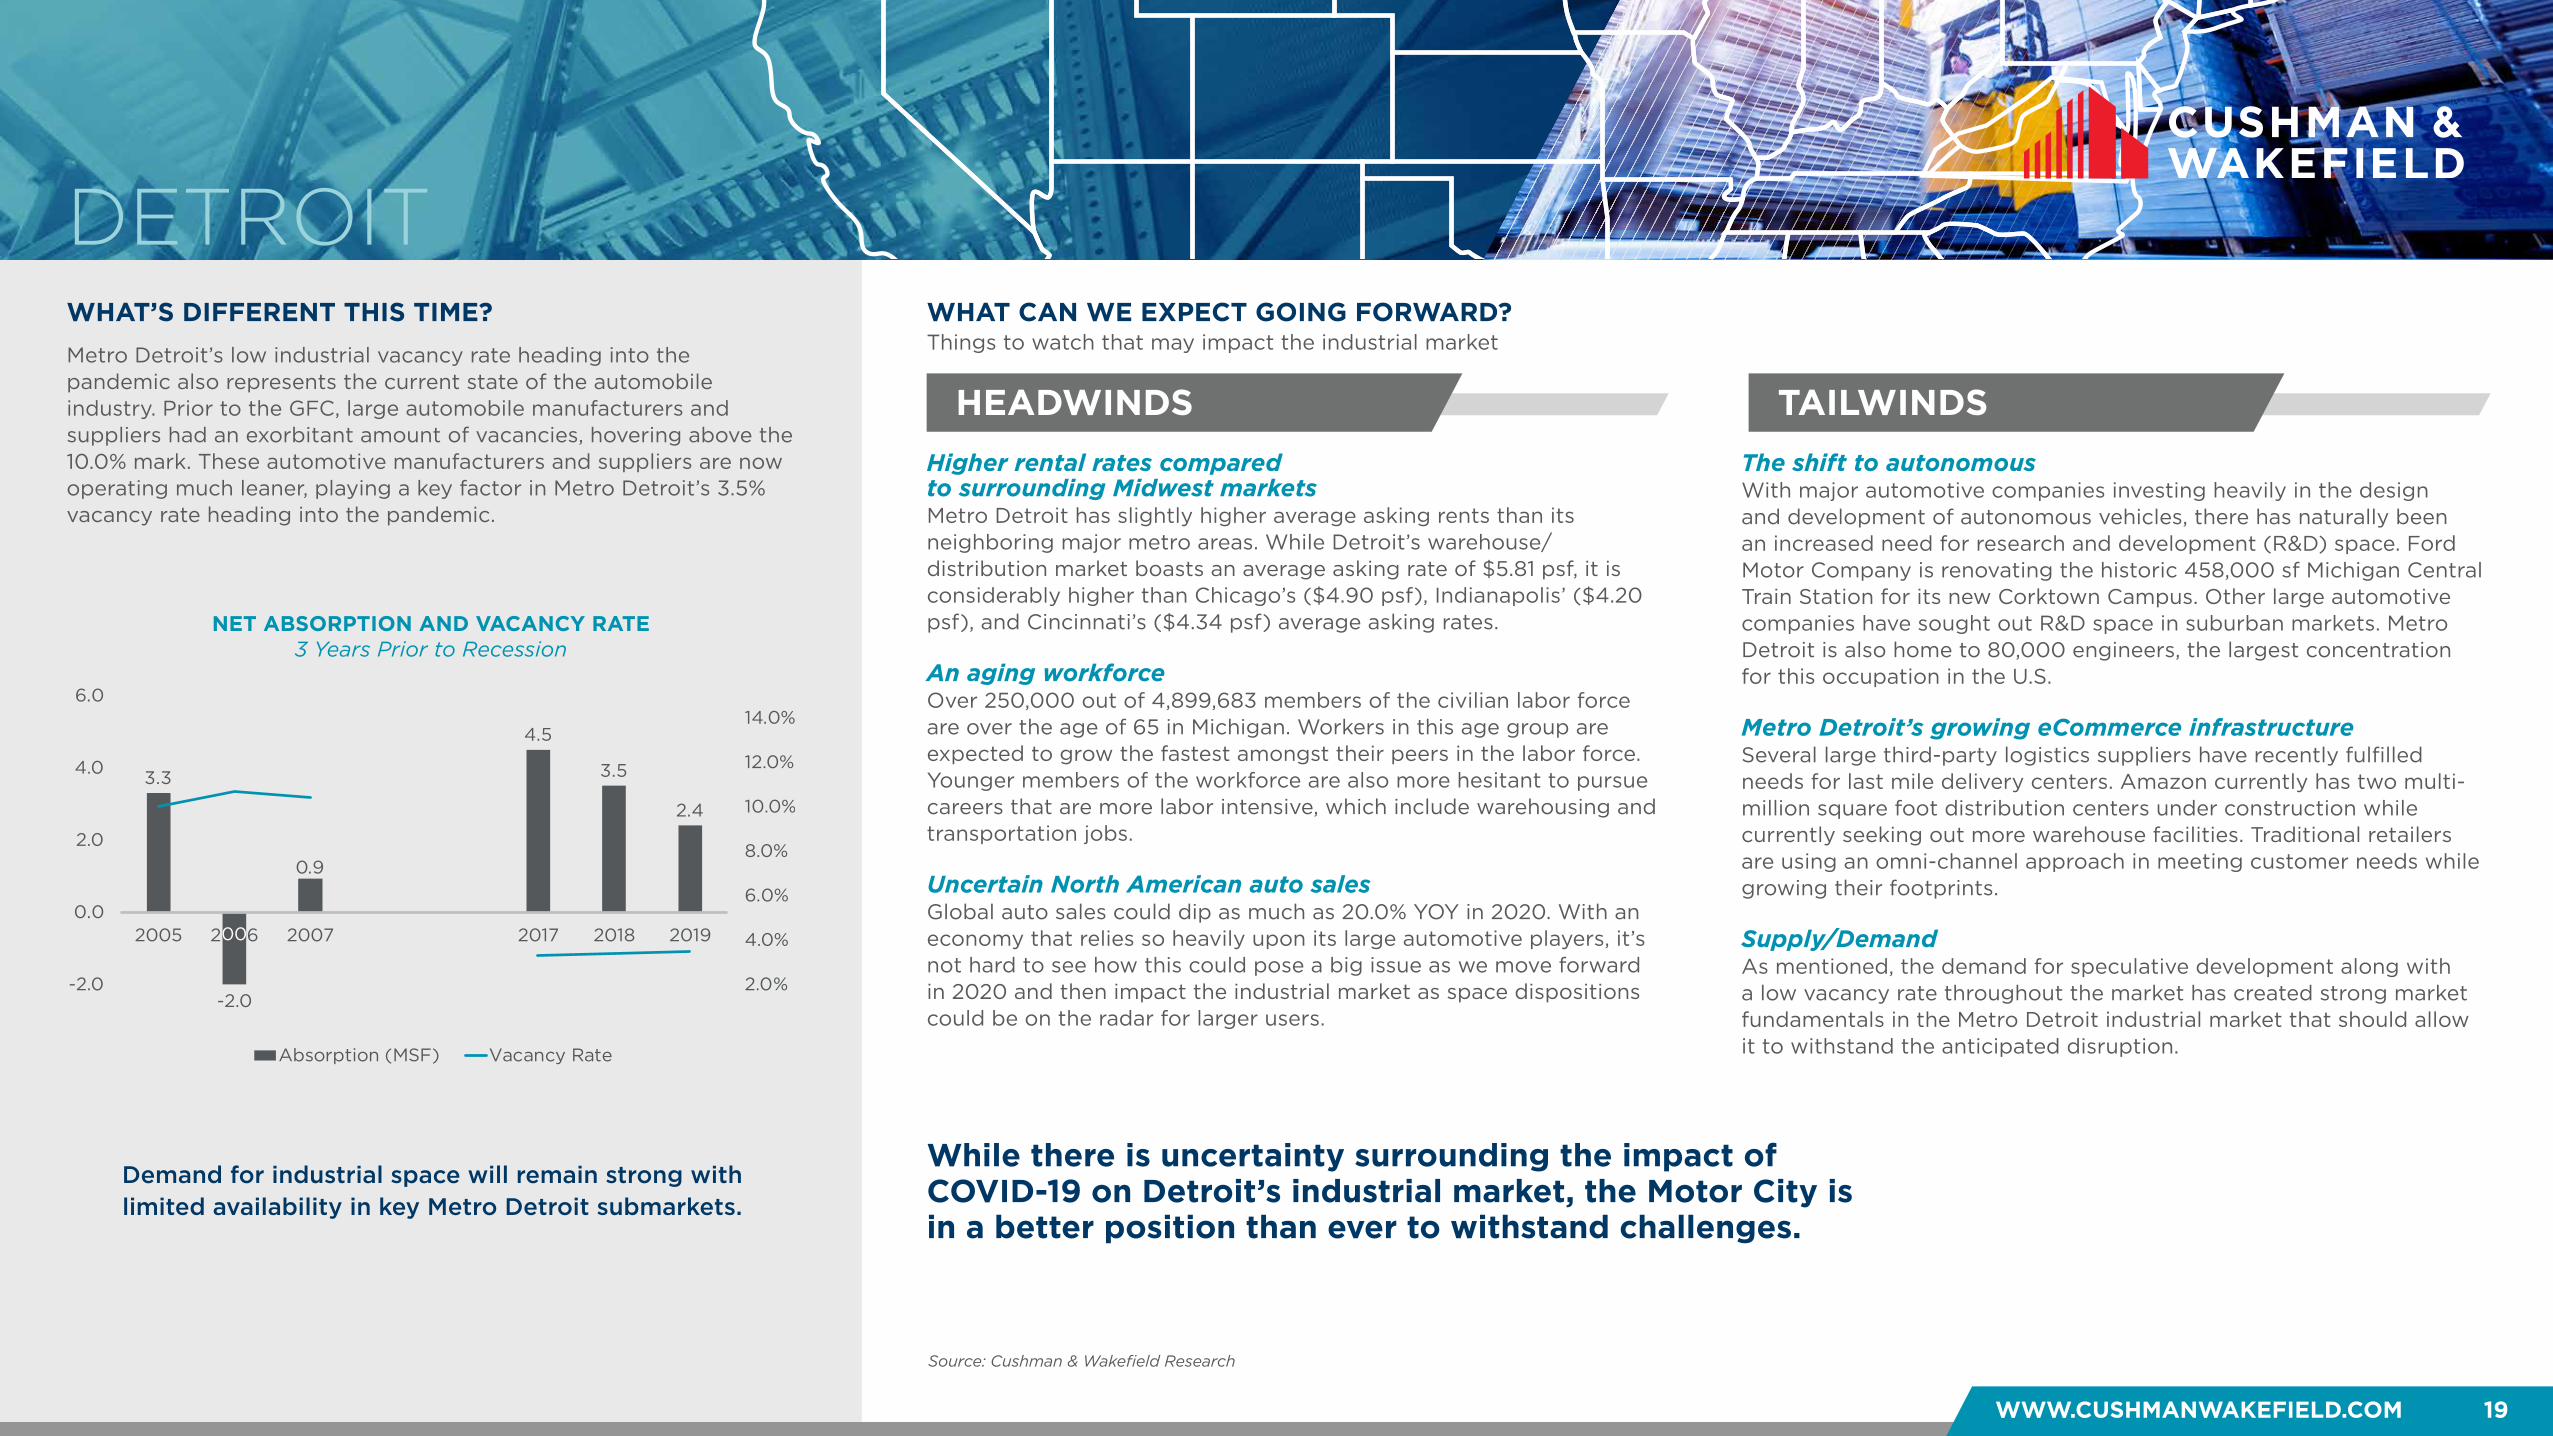
NET ABSORPTION AND VACANCY RATE 3 Years Prior to Recession
DETROIT
While there is uncertainty surrounding the impact of COVID-19 on Detroit’s industrial market, the Motor City is in a better position than ever to withstand challenges.
Higher rental rates compared to surrounding Midwest marketsMetro Detroit has slightly higher average asking rents than its neighboring major metro areas. While Detroit’s warehouse/distribution market boasts an average asking rate of $5.81 psf, it is considerably higher than Chicago’s ($4.90 psf), Indianapolis’ ($4.20 psf), and Cincinnati’s ($4.34 psf) average asking rates.
An aging workforceOver 250,000 out of 4,899,683 members of the civilian labor force are over the age of 65 in Michigan. Workers in this age group are expected to grow the fastest amongst their peers in the labor force. Younger members of the workforce are also more hesitant to pursue careers that are more labor intensive, which include warehousing and transportation jobs.
Uncertain North American auto salesGlobal auto sales could dip as much as 20.0% YOY in 2020. With an economy that relies so heavily upon its large automotive players, it’s not hard to see how this could pose a big issue as we move forward in 2020 and then impact the industrial market as space dispositions could be on the radar for larger users.
The shift to autonomousWith major automotive companies investing heavily in the design and development of autonomous vehicles, there has naturally been an increased need for research and development (R&D) space. Ford Motor Company is renovating the historic 458,000 sf Michigan Central Train Station for its new Corktown Campus. Other large automotive companies have sought out R&D space in suburban markets. Metro Detroit is also home to 80,000 engineers, the largest concentration for this occupation in the U.S.
Metro Detroit’s growing eCommerce infrastructureSeveral large third-party logistics suppliers have recently fulfilled needs for last mile delivery centers. Amazon currently has two multi-million square foot distribution centers under construction while currently seeking out more warehouse facilities. Traditional retailers are using an omni-channel approach in meeting customer needs while growing their footprints.
Supply/DemandAs mentioned, the demand for speculative development along with a low vacancy rate throughout the market has created strong market fundamentals in the Metro Detroit industrial market that should allow it to withstand the anticipated disruption.
Demand for industrial space will remain strong with limited availability in key Metro Detroit submarkets.
Metro Detroit’s low industrial vacancy rate heading into the pandemic also represents the current state of the automobile industry. Prior to the GFC, large automobile manufacturers and suppliers had an exorbitant amount of vacancies, hovering above the 10.0% mark. These automotive manufacturers and suppliers are now operating much leaner, playing a key factor in Metro Detroit’s 3.5% vacancy rate heading into the pandemic.
Source: Cushman & Wakefield Research
3.3
-2.0
0.9
4.5
3.5
2.4
2.0%
4.0%
6.0%
8.0%
10.0%
12.0%
14.0%
-2.0
0.0
2.0
4.0
6.0
2005 2006 2007 2017 2018 2019
Absorption (MSF) Vacancy Rate
00
WWW.CUSHMANWAKEFIELD.COM 20
INDUSTRIAL: THE RECESSION-PROOF ASSET CLASS?
OVERALL VACANCYEntering Recessionary Period
UNDER CONSTRUCTION Entering Recessionary Period
HOW DOES HOUSTON STACK UP?HOUSTON
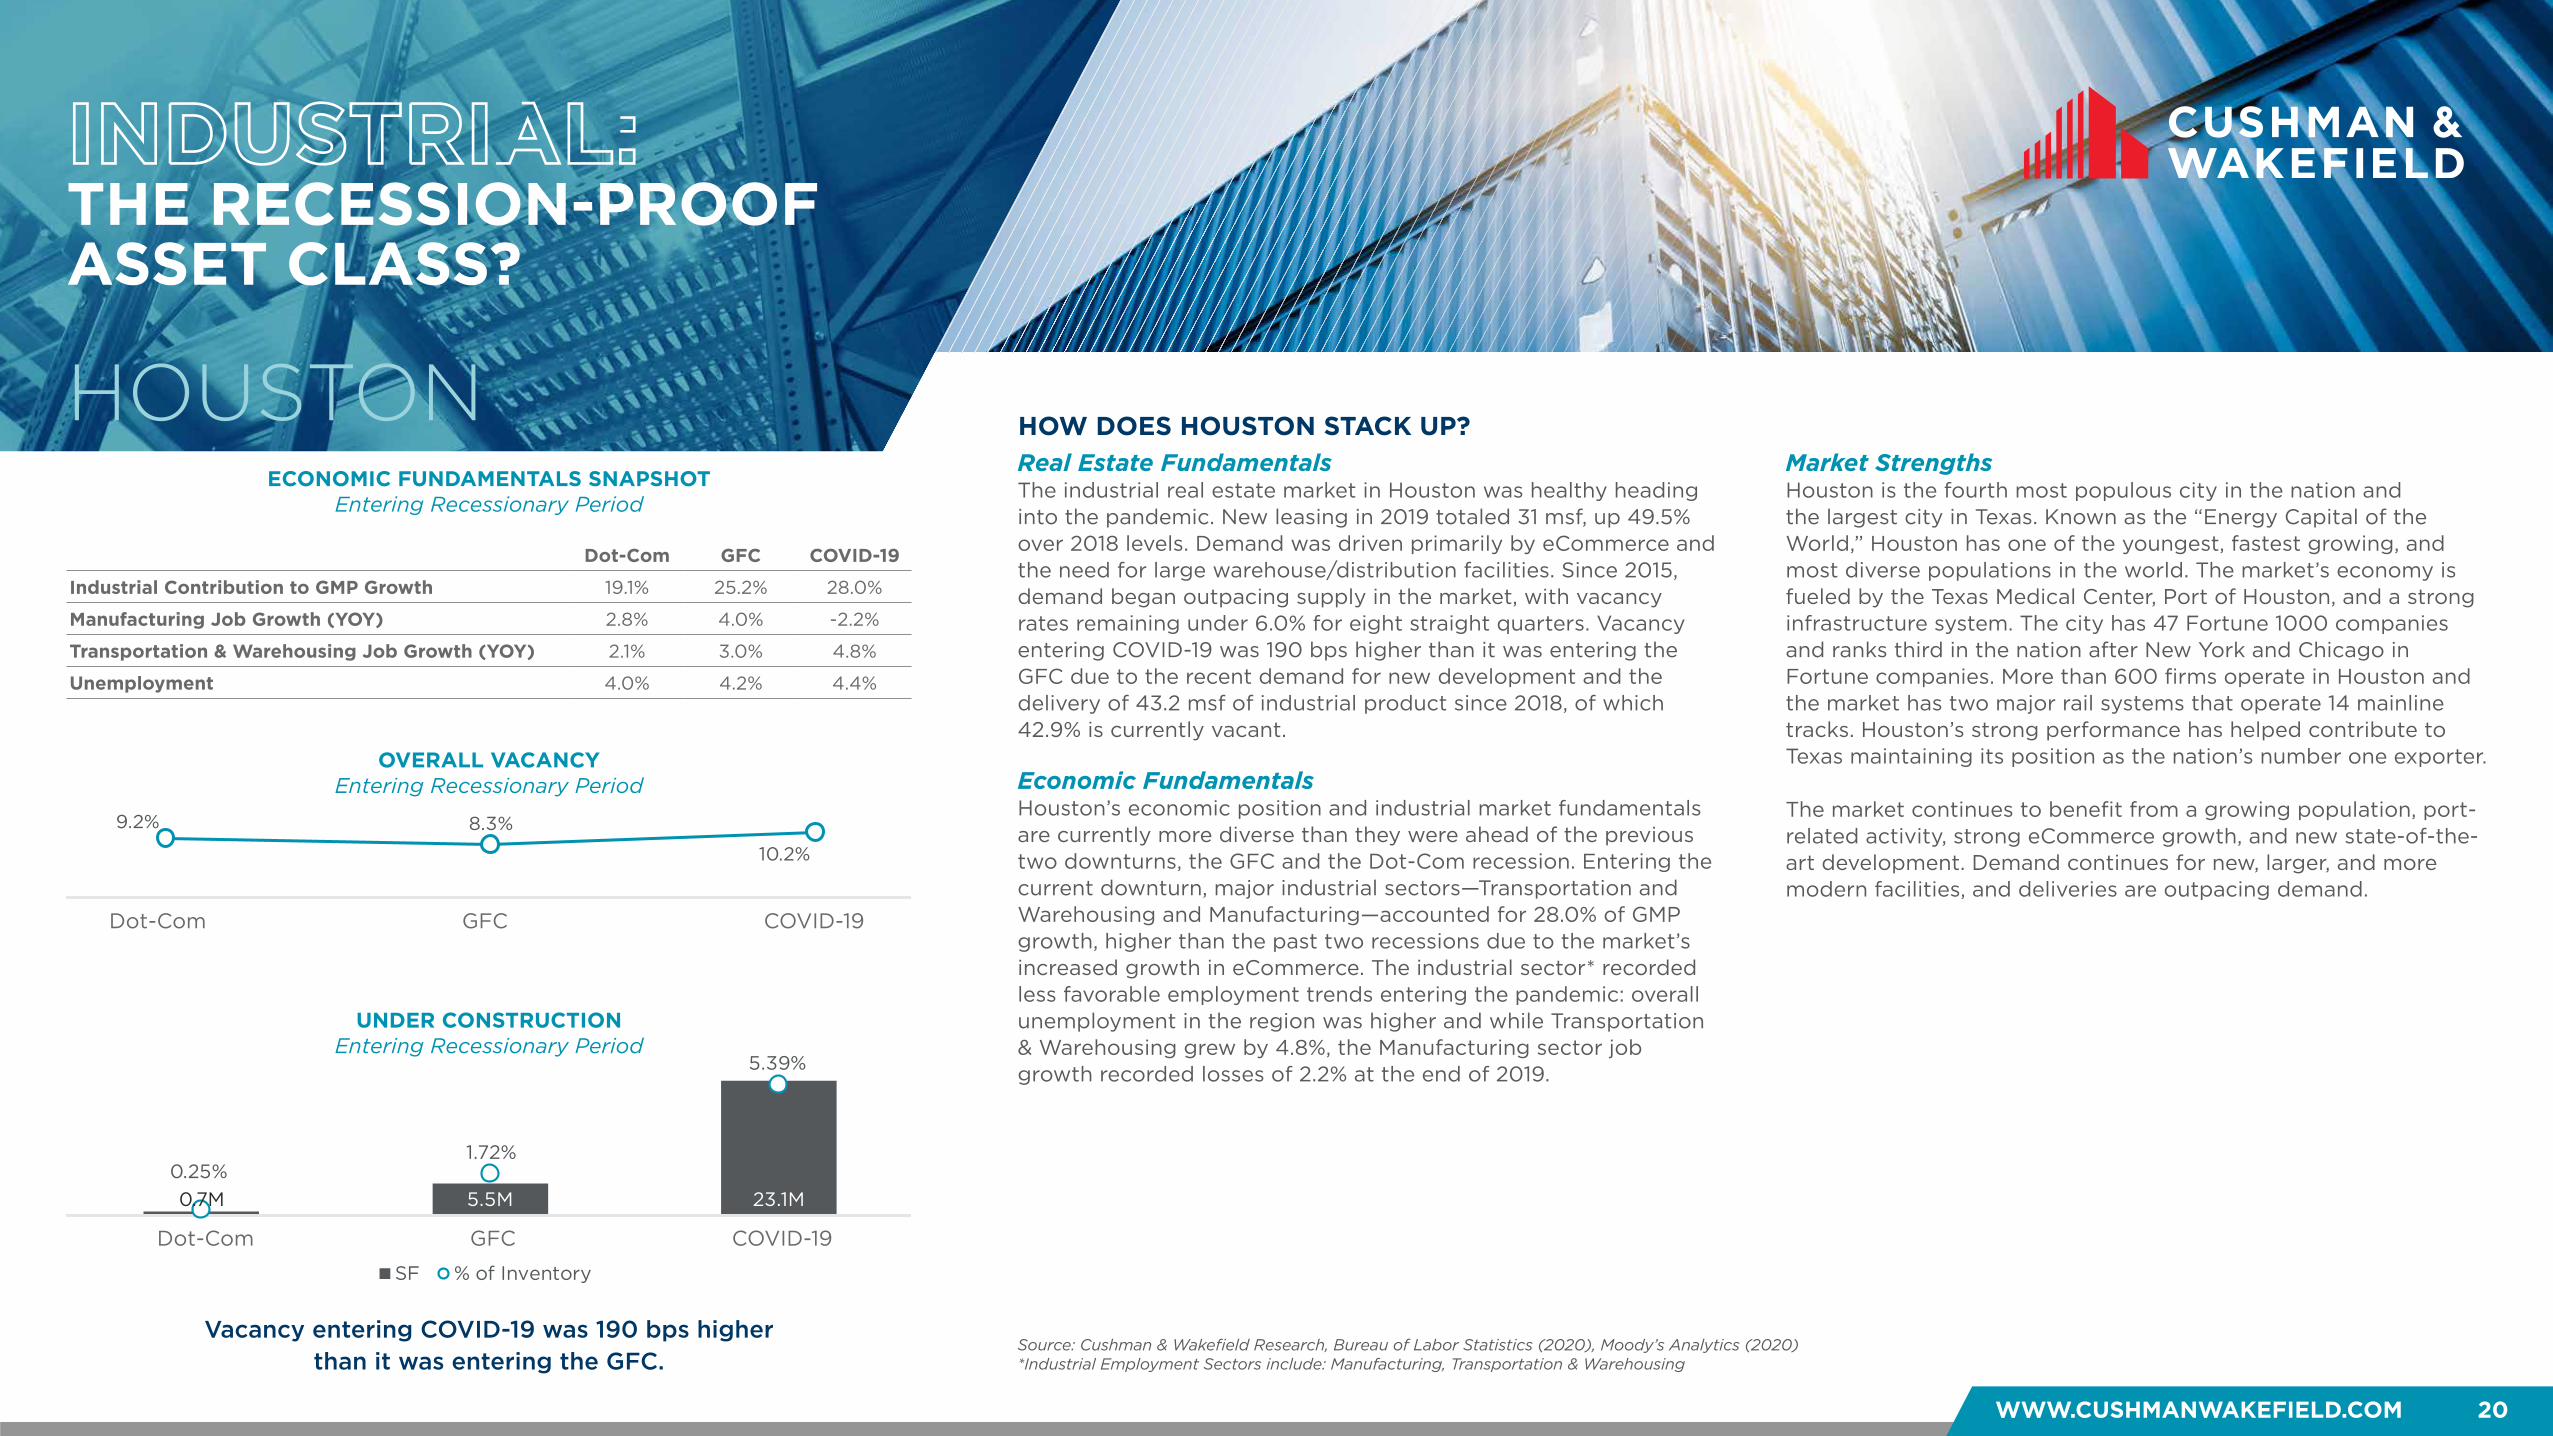
Vacancy entering COVID-19 was 190 bps higher than it was entering the GFC.
Real Estate FundamentalsThe industrial real estate market in Houston was healthy heading into the pandemic. New leasing in 2019 totaled 31 msf, up 49.5% over 2018 levels. Demand was driven primarily by eCommerce and the need for large warehouse/distribution facilities. Since 2015, demand began outpacing supply in the market, with vacancy rates remaining under 6.0% for eight straight quarters. Vacancy entering COVID-19 was 190 bps higher than it was entering the GFC due to the recent demand for new development and the delivery of 43.2 msf of industrial product since 2018, of which 42.9% is currently vacant.
Economic FundamentalsHouston’s economic position and industrial market fundamentals are currently more diverse than they were ahead of the previous two downturns, the GFC and the Dot-Com recession. Entering the current downturn, major industrial sectors—Transportation and Warehousing and Manufacturing—accounted for 28.0% of GMP growth, higher than the past two recessions due to the market’s increased growth in eCommerce. The industrial sector* recorded less favorable employment trends entering the pandemic: overall unemployment in the region was higher and while Transportation & Warehousing grew by 4.8%, the Manufacturing sector job growth recorded losses of 2.2% at the end of 2019.
Market StrengthsHouston is the fourth most populous city in the nation and the largest city in Texas. Known as the “Energy Capital of the World,” Houston has one of the youngest, fastest growing, and most diverse populations in the world. The market’s economy is fueled by the Texas Medical Center, Port of Houston, and a strong infrastructure system. The city has 47 Fortune 1000 companies and ranks third in the nation after New York and Chicago in Fortune companies. More than 600 firms operate in Houston and the market has two major rail systems that operate 14 mainline tracks. Houston’s strong performance has helped contribute to Texas maintaining its position as the nation’s number one exporter. The market continues to benefit from a growing population, port-related activity, strong eCommerce growth, and new state-of-the-art development. Demand continues for new, larger, and more modern facilities, and deliveries are outpacing demand.
Source: Cushman & Wakefield Research, Bureau of Labor Statistics (2020), Moody’s Analytics (2020)*Industrial Employment Sectors include: Manufacturing, Transportation & Warehousing
Dot-Com GFC COVID-19
Industrial Contribution to GMP Growth 19.1% 25.2% 28.0%
Manufacturing Job Growth (YOY) 2.8% 4.0% -2.2%
Transportation & Warehousing Job Growth (YOY) 2.1% 3.0% 4.8%
Unemployment 4.0% 4.2% 4.4%
9.2% 8.3%
10.2%
Dot Com Financial Crisis COVID-19
ECONOMIC FUNDAMENTALS SNAPSHOTEntering Recessionary Period
0.7M 5.5M 23.1M0.25%
1.72%
5.39%
0.00%
1.00%
2.00%
3.00%
4.00%
5.00%
6.00%
0
5000000
10000000
15000000
20000000
25000000
Dot Com Financial Crisis COVID-19
SF % of Inventory
Dot-Com GFC COVID-19
Dot-Com GFC COVID-19
WHAT’S DIFFERENT THIS TIME?
HEADWINDS TAILWINDS
WHAT CAN WE EXPECT GOING FORWARD?
WWW.CUSHMANWAKEFIELD.COM 21
Things to watch that may impact the industrial market
CHANGE IN LEASING ACTIVITY Pre-GFC vs. Pre-COVID-19
HOUSTON
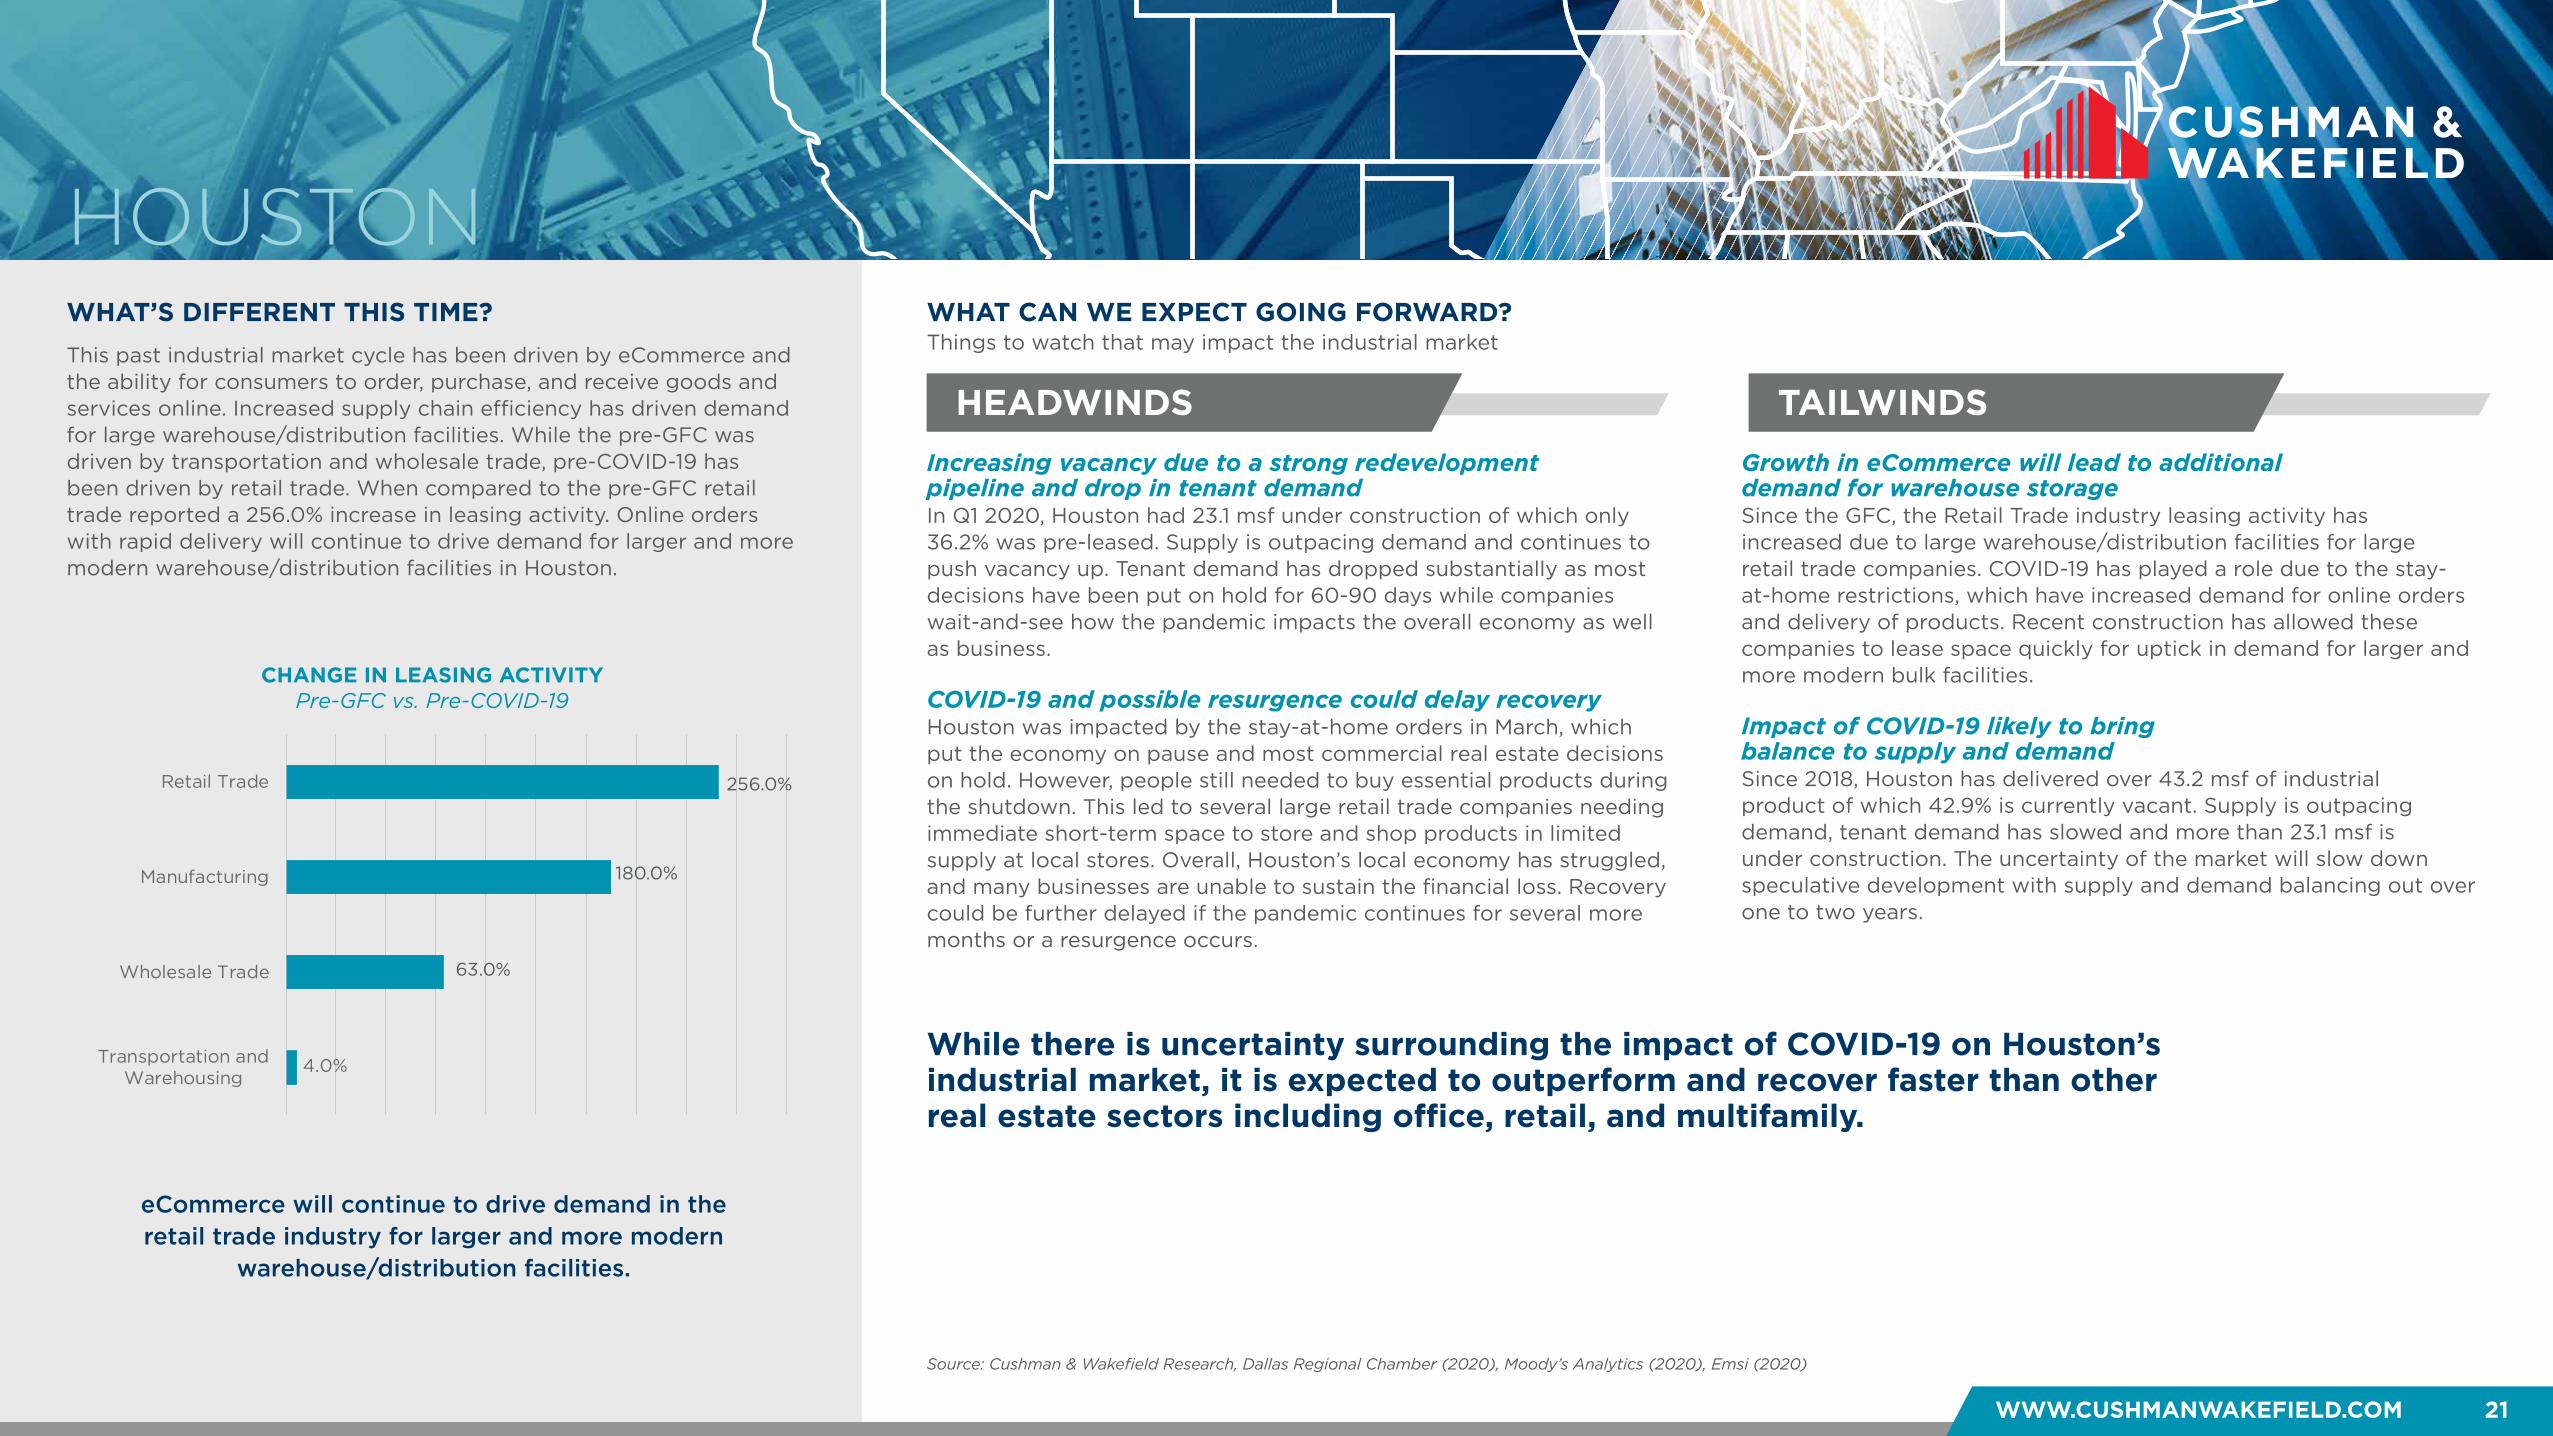
While there is uncertainty surrounding the impact of COVID-19 on Houston’s industrial market, it is expected to outperform and recover faster than other real estate sectors including office, retail, and multifamily.
Increasing vacancy due to a strong redevelopment pipeline and drop in tenant demand In Q1 2020, Houston had 23.1 msf under construction of which only 36.2% was pre-leased. Supply is outpacing demand and continues to push vacancy up. Tenant demand has dropped substantially as most decisions have been put on hold for 60-90 days while companies wait-and-see how the pandemic impacts the overall economy as well as business. COVID-19 and possible resurgence could delay recovery Houston was impacted by the stay-at-home orders in March, which put the economy on pause and most commercial real estate decisions on hold. However, people still needed to buy essential products during the shutdown. This led to several large retail trade companies needing immediate short-term space to store and shop products in limited supply at local stores. Overall, Houston’s local economy has struggled, and many businesses are unable to sustain the financial loss. Recovery could be further delayed if the pandemic continues for several more months or a resurgence occurs.
Growth in eCommerce will lead to additional demand for warehouse storage Since the GFC, the Retail Trade industry leasing activity has increased due to large warehouse/distribution facilities for large retail trade companies. COVID-19 has played a role due to the stay-at-home restrictions, which have increased demand for online orders and delivery of products. Recent construction has allowed these companies to lease space quickly for uptick in demand for larger and more modern bulk facilities. Impact of COVID-19 likely to bring balance to supply and demand Since 2018, Houston has delivered over 43.2 msf of industrial product of which 42.9% is currently vacant. Supply is outpacing demand, tenant demand has slowed and more than 23.1 msf is under construction. The uncertainty of the market will slow down speculative development with supply and demand balancing out over one to two years.
eCommerce will continue to drive demand in the retail trade industry for larger and more modern
warehouse/distribution facilities.
This past industrial market cycle has been driven by eCommerce and the ability for consumers to order, purchase, and receive goods and services online. Increased supply chain efficiency has driven demand for large warehouse/distribution facilities. While the pre-GFC was driven by transportation and wholesale trade, pre-COVID-19 has been driven by retail trade. When compared to the pre-GFC retail trade reported a 256.0% increase in leasing activity. Online orders with rapid delivery will continue to drive demand for larger and more modern warehouse/distribution facilities in Houston.
Source: Cushman & Wakefield Research, Dallas Regional Chamber (2020), Moody’s Analytics (2020), Emsi (2020)
Transportation andWarehousing
Wholesale Trade
Manufacturing
Retail Trade
4.0%
63.0%
180.0%
256.0%
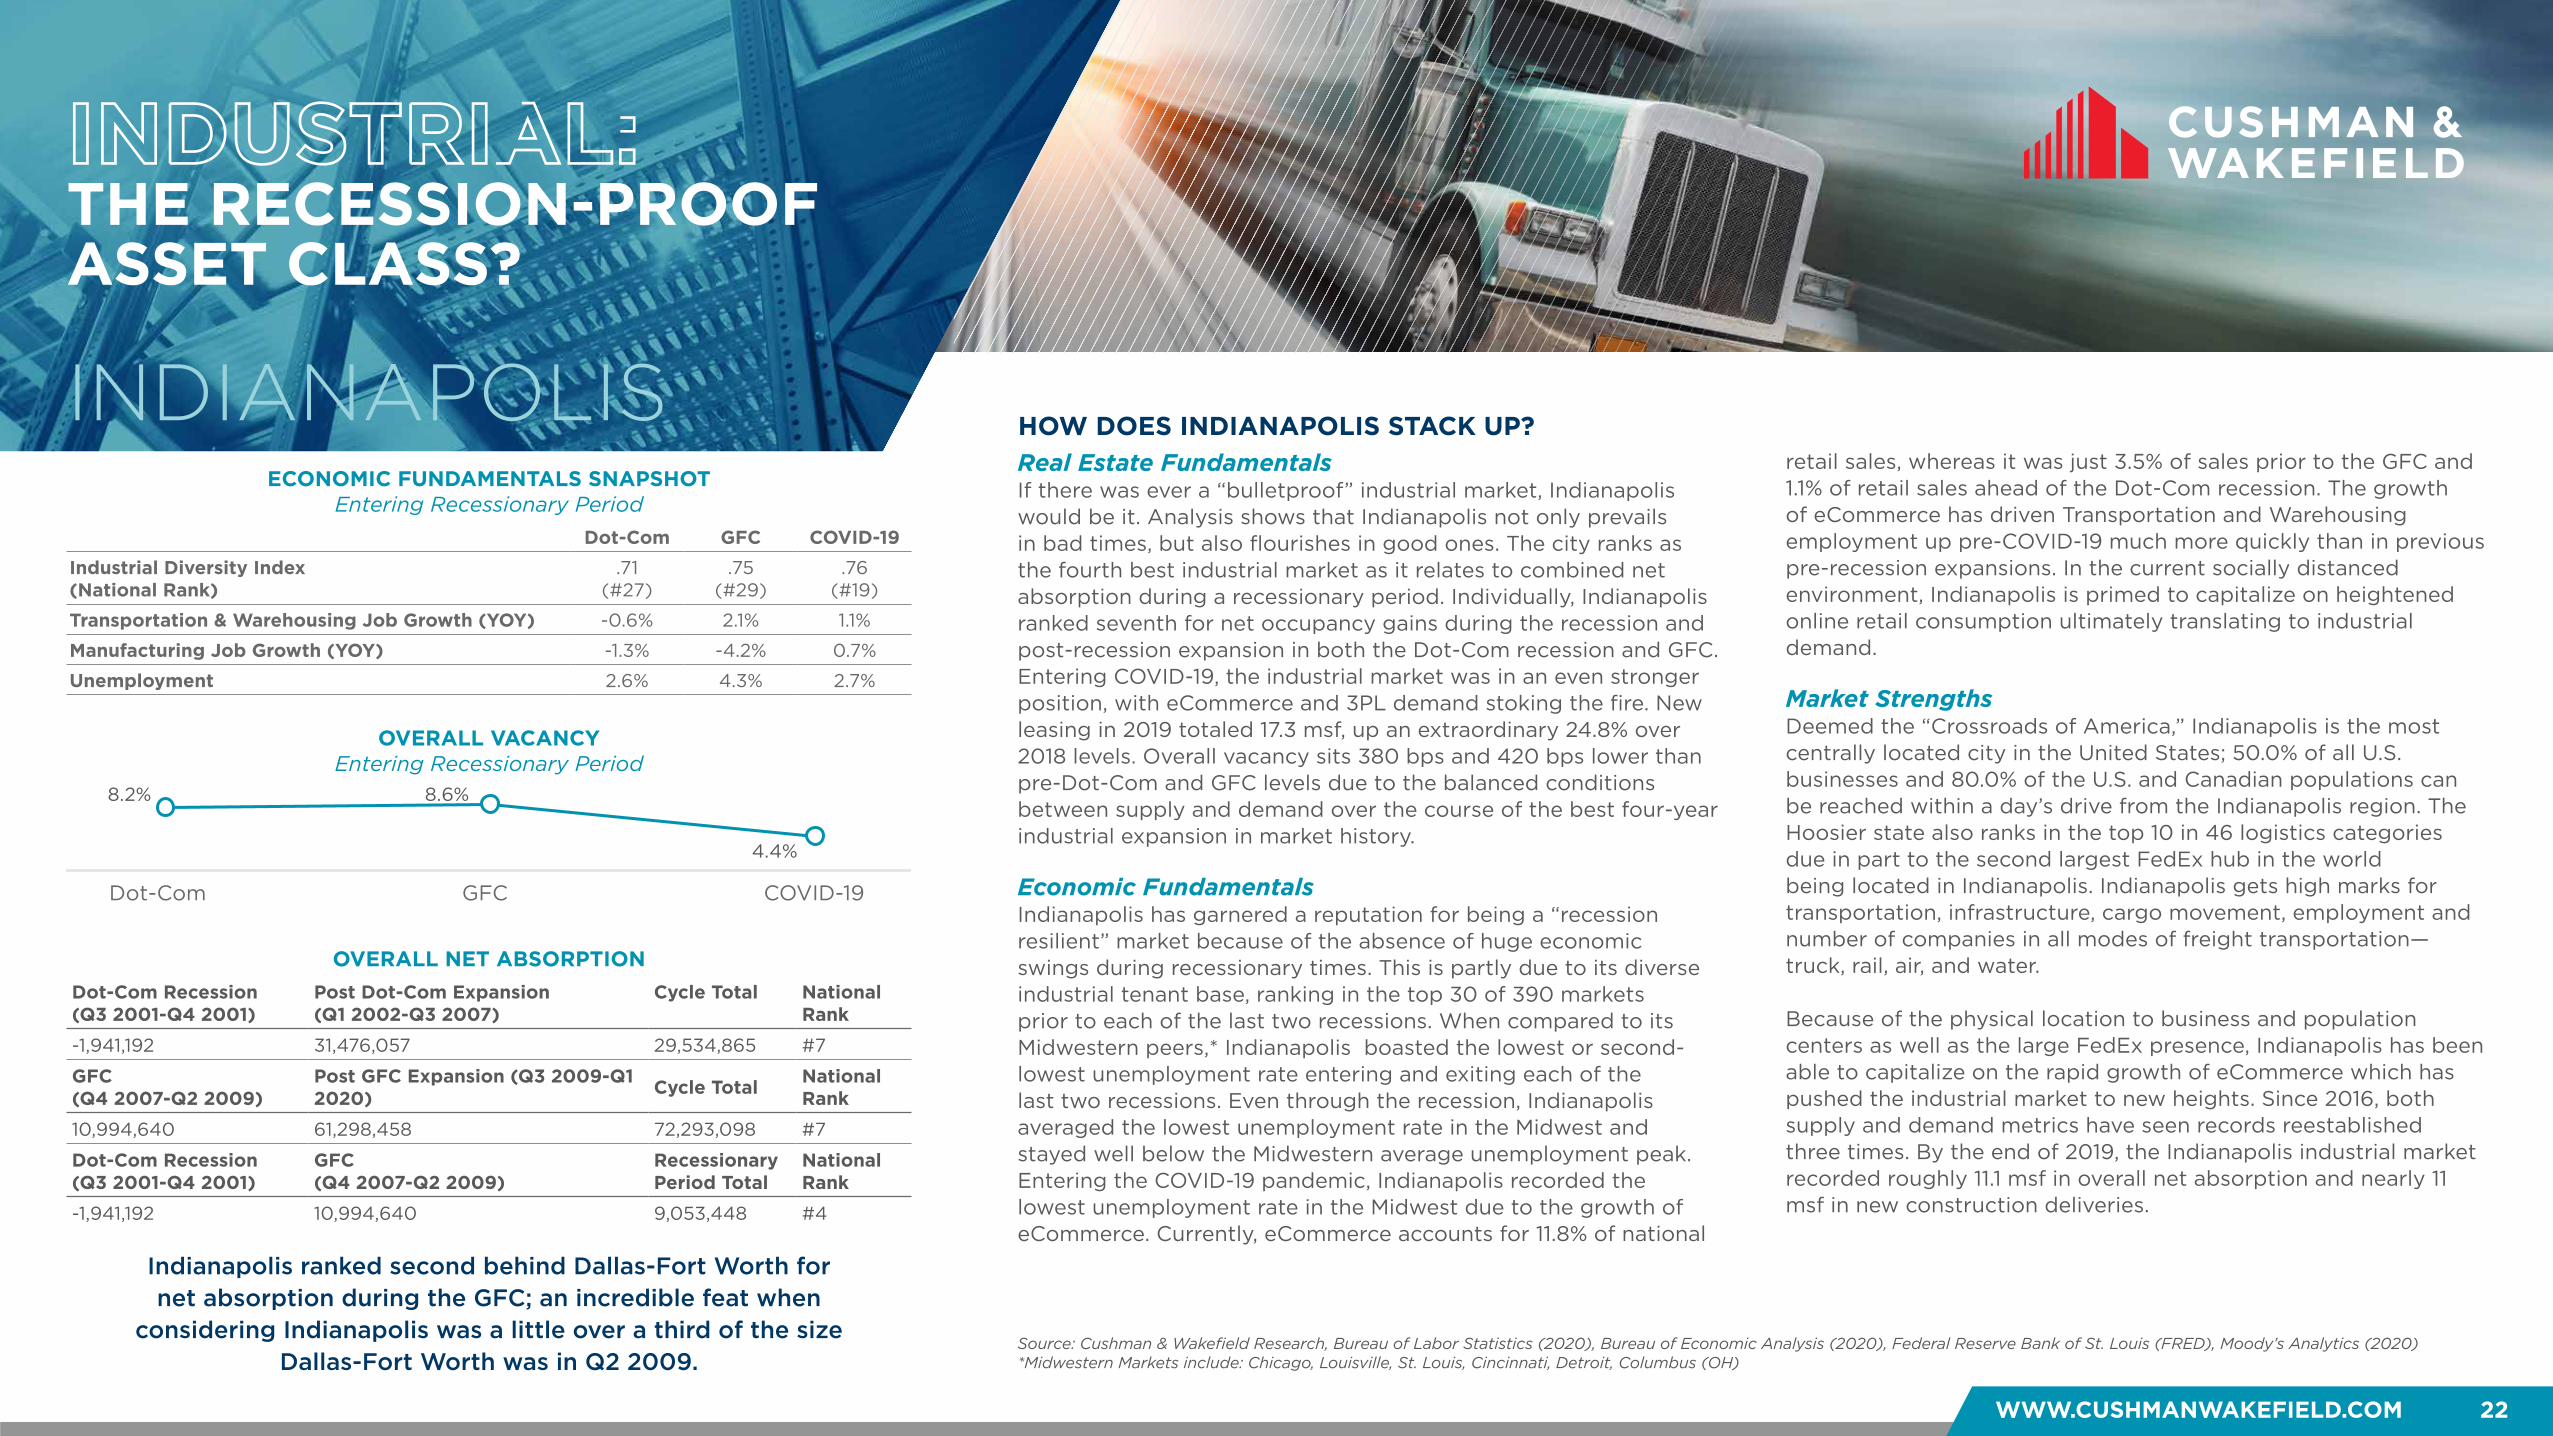
WWW.CUSHMANWAKEFIELD.COM 22
ECONOMIC FUNDAMENTALS SNAPSHOTEntering Recessionary Period
INDUSTRIAL: THE RECESSION-PROOF ASSET CLASS?
OVERALL NET ABSORPTION
HOW DOES INDIANAPOLIS STACK UP?INDIANAPOLIS
Indianapolis ranked second behind Dallas-Fort Worth for net absorption during the GFC; an incredible feat when
considering Indianapolis was a little over a third of the size Dallas-Fort Worth was in Q2 2009.
Real Estate FundamentalsIf there was ever a “bulletproof” industrial market, Indianapolis would be it. Analysis shows that Indianapolis not only prevails in bad times, but also flourishes in good ones. The city ranks as the fourth best industrial market as it relates to combined net absorption during a recessionary period. Individually, Indianapolis ranked seventh for net occupancy gains during the recession and post-recession expansion in both the Dot-Com recession and GFC. Entering COVID-19, the industrial market was in an even stronger position, with eCommerce and 3PL demand stoking the fire. New leasing in 2019 totaled 17.3 msf, up an extraordinary 24.8% over 2018 levels. Overall vacancy sits 380 bps and 420 bps lower than pre-Dot-Com and GFC levels due to the balanced conditions between supply and demand over the course of the best four-year industrial expansion in market history.
Economic FundamentalsIndianapolis has garnered a reputation for being a “recession resilient” market because of the absence of huge economic swings during recessionary times. This is partly due to its diverse industrial tenant base, ranking in the top 30 of 390 markets prior to each of the last two recessions. When compared to its Midwestern peers,* Indianapolis boasted the lowest or second-lowest unemployment rate entering and exiting each of the last two recessions. Even through the recession, Indianapolis averaged the lowest unemployment rate in the Midwest and stayed well below the Midwestern average unemployment peak. Entering the COVID-19 pandemic, Indianapolis recorded the lowest unemployment rate in the Midwest due to the growth of eCommerce. Currently, eCommerce accounts for 11.8% of national
retail sales, whereas it was just 3.5% of sales prior to the GFC and 1.1% of retail sales ahead of the Dot-Com recession. The growth of eCommerce has driven Transportation and Warehousing employment up pre-COVID-19 much more quickly than in previous pre-recession expansions. In the current socially distanced environment, Indianapolis is primed to capitalize on heightened online retail consumption ultimately translating to industrial demand.
Market StrengthsDeemed the “Crossroads of America,” Indianapolis is the most centrally located city in the United States; 50.0% of all U.S. businesses and 80.0% of the U.S. and Canadian populations can be reached within a day’s drive from the Indianapolis region. The Hoosier state also ranks in the top 10 in 46 logistics categories due in part to the second largest FedEx hub in the world being located in Indianapolis. Indianapolis gets high marks for transportation, infrastructure, cargo movement, employment and number of companies in all modes of freight transportation—truck, rail, air, and water. Because of the physical location to business and population centers as well as the large FedEx presence, Indianapolis has been able to capitalize on the rapid growth of eCommerce which has pushed the industrial market to new heights. Since 2016, both supply and demand metrics have seen records reestablished three times. By the end of 2019, the Indianapolis industrial market recorded roughly 11.1 msf in overall net absorption and nearly 11 msf in new construction deliveries.
Source: Cushman & Wakefield Research, Bureau of Labor Statistics (2020), Bureau of Economic Analysis (2020), Federal Reserve Bank of St. Louis (FRED), Moody’s Analytics (2020)*Midwestern Markets include: Chicago, Louisville, St. Louis, Cincinnati, Detroit, Columbus (OH)
Dot-Com GFC COVID-19Industrial Diversity Index (National Rank)
.71(#27)
.75(#29)
.76(#19)
Transportation & Warehousing Job Growth (YOY) -0.6% 2.1% 1.1%
Manufacturing Job Growth (YOY) -1.3% -4.2% 0.7%
Unemployment 2.6% 4.3% 2.7%
Dot-Com Recession (Q3 2001-Q4 2001)
Post Dot-Com Expansion (Q1 2002-Q3 2007)
Cycle Total National Rank
-1,941,192 31,476,057 29,534,865 #7
GFC (Q4 2007-Q2 2009)
Post GFC Expansion (Q3 2009-Q1 2020) Cycle Total National
Rank
10,994,640 61,298,458 72,293,098 #7
Dot-Com Recession(Q3 2001-Q4 2001)
GFC(Q4 2007-Q2 2009)
Recessionary Period Total
National Rank
-1,941,192 10,994,640 9,053,448 #4
OVERALL VACANCYEntering Recessionary Period
8.2% 8.6%
4.4%
Dot Com Financial Crisis COVID-19Dot-Com GFC COVID-19
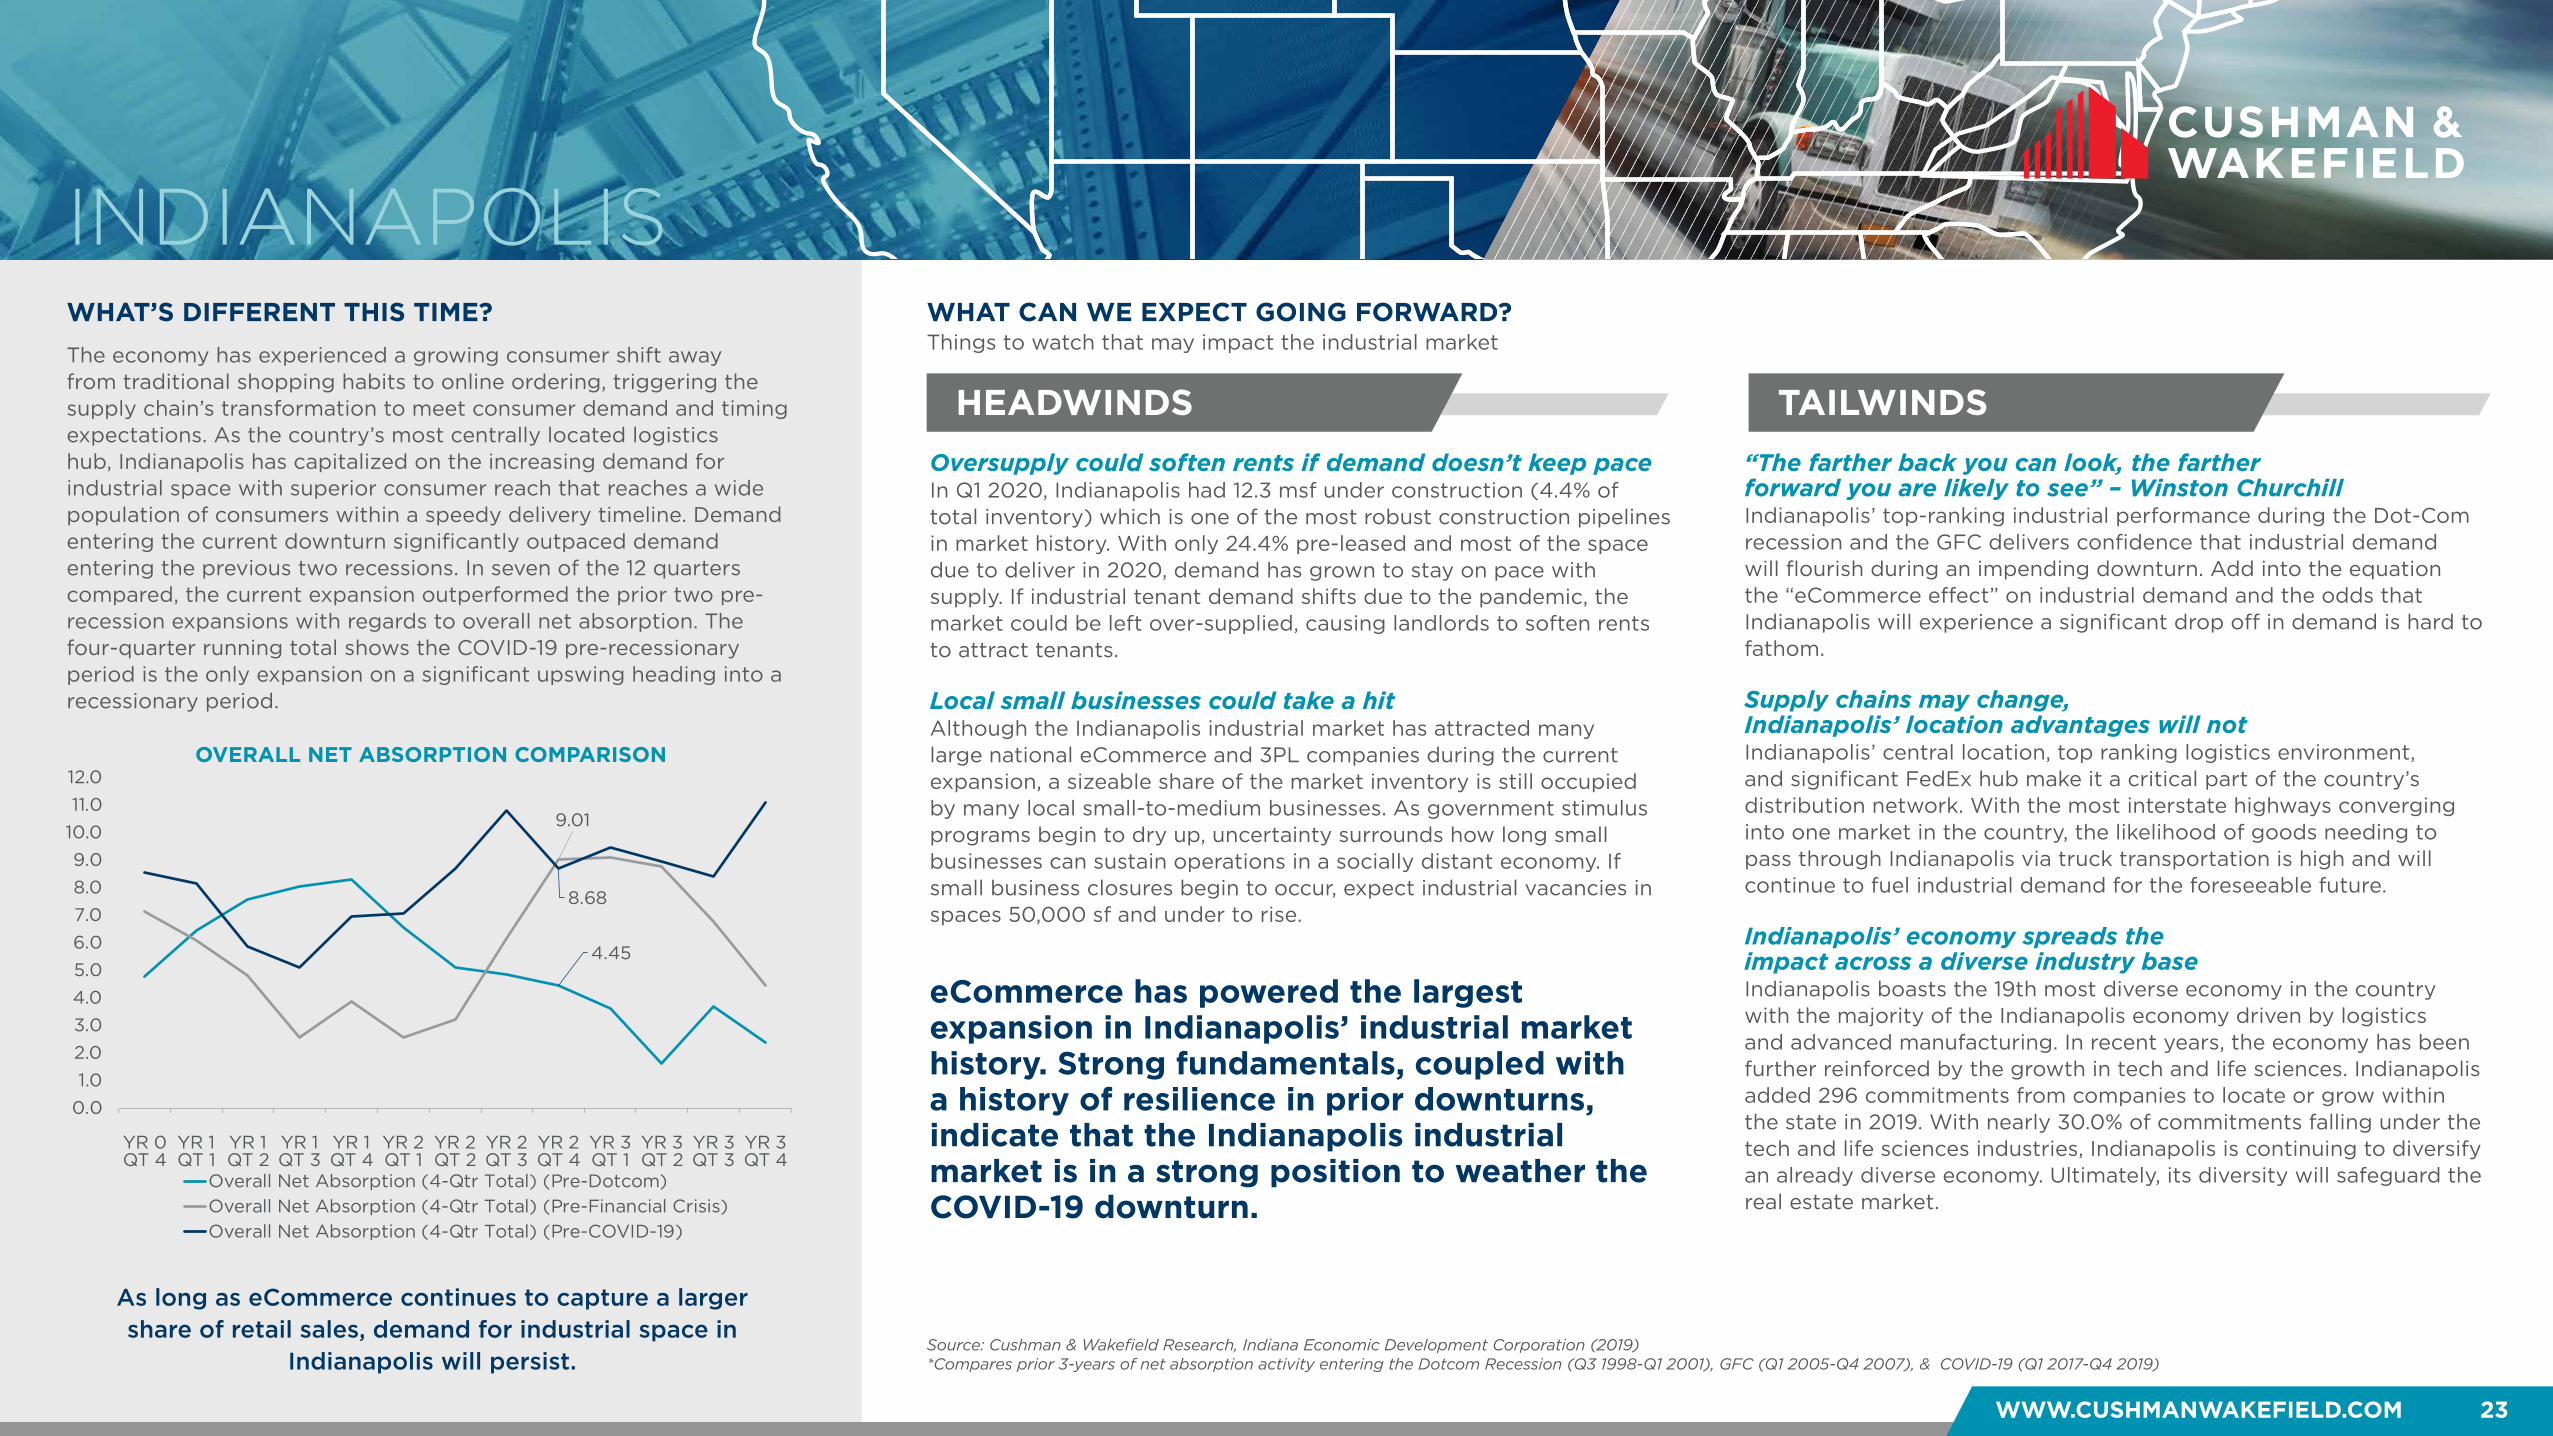
WHAT’S DIFFERENT THIS TIME?
HEADWINDS TAILWINDS
WHAT CAN WE EXPECT GOING FORWARD?
WWW.CUSHMANWAKEFIELD.COM 23
Things to watch that may impact the industrial market
INDIANAPOLIS
eCommerce has powered the largest expansion in Indianapolis’ industrial market history. Strong fundamentals, coupled with a history of resilience in prior downturns, indicate that the Indianapolis industrial market is in a strong position to weather the COVID-19 downturn.
Oversupply could soften rents if demand doesn’t keep pace In Q1 2020, Indianapolis had 12.3 msf under construction (4.4% of total inventory) which is one of the most robust construction pipelines in market history. With only 24.4% pre-leased and most of the space due to deliver in 2020, demand has grown to stay on pace with supply. If industrial tenant demand shifts due to the pandemic, the market could be left over-supplied, causing landlords to soften rents to attract tenants. Local small businesses could take a hit Although the Indianapolis industrial market has attracted many large national eCommerce and 3PL companies during the current expansion, a sizeable share of the market inventory is still occupied by many local small-to-medium businesses. As government stimulus programs begin to dry up, uncertainty surrounds how long small businesses can sustain operations in a socially distant economy. If small business closures begin to occur, expect industrial vacancies in spaces 50,000 sf and under to rise.
“The farther back you can look, the farther forward you are likely to see” – Winston Churchill Indianapolis’ top-ranking industrial performance during the Dot-Com recession and the GFC delivers confidence that industrial demand will flourish during an impending downturn. Add into the equation the “eCommerce effect” on industrial demand and the odds that Indianapolis will experience a significant drop off in demand is hard to fathom. Supply chains may change, Indianapolis’ location advantages will not Indianapolis’ central location, top ranking logistics environment, and significant FedEx hub make it a critical part of the country’s distribution network. With the most interstate highways converging into one market in the country, the likelihood of goods needing to pass through Indianapolis via truck transportation is high and will continue to fuel industrial demand for the foreseeable future. Indianapolis’ economy spreads the impact across a diverse industry base Indianapolis boasts the 19th most diverse economy in the country with the majority of the Indianapolis economy driven by logistics and advanced manufacturing. In recent years, the economy has been further reinforced by the growth in tech and life sciences. Indianapolis added 296 commitments from companies to locate or grow within the state in 2019. With nearly 30.0% of commitments falling under the tech and life sciences industries, Indianapolis is continuing to diversify an already diverse economy. Ultimately, its diversity will safeguard the real estate market.
As long as eCommerce continues to capture a larger share of retail sales, demand for industrial space in
Indianapolis will persist.
The economy has experienced a growing consumer shift away from traditional shopping habits to online ordering, triggering the supply chain’s transformation to meet consumer demand and timing expectations. As the country’s most centrally located logistics hub, Indianapolis has capitalized on the increasing demand for industrial space with superior consumer reach that reaches a wide population of consumers within a speedy delivery timeline. Demand entering the current downturn significantly outpaced demand entering the previous two recessions. In seven of the 12 quarters compared, the current expansion outperformed the prior two pre-recession expansions with regards to overall net absorption. The four-quarter running total shows the COVID-19 pre-recessionary period is the only expansion on a significant upswing heading into a recessionary period.
Source: Cushman & Wakefield Research, Indiana Economic Development Corporation (2019)*Compares prior 3-years of net absorption activity entering the Dotcom Recession (Q3 1998-Q1 2001), GFC (Q1 2005-Q4 2007), & COVID-19 (Q1 2017-Q4 2019)
OVERALL NET ABSORPTION COMPARISON
4.45
9.01
8.68
YR 0QT 4
YR 1QT 1
YR 1QT 2
YR 1QT 3
YR 1QT 4
YR 2QT 1
YR 2QT 2
YR 2QT 3
YR 2QT 4
YR 3QT 1
YR 3QT 2
YR 3QT 3
YR 3QT 4
0.01.02.03.04.05.06.07.08.09.0
10.011.012.0
Overall Net Absorption (4-Qtr Total) (Pre-Dotcom)Overall Net Absorption (4-Qtr Total) (Pre-Financial Crisis)Overall Net Absorption (4-Qtr Total) (Pre-COVID-19)
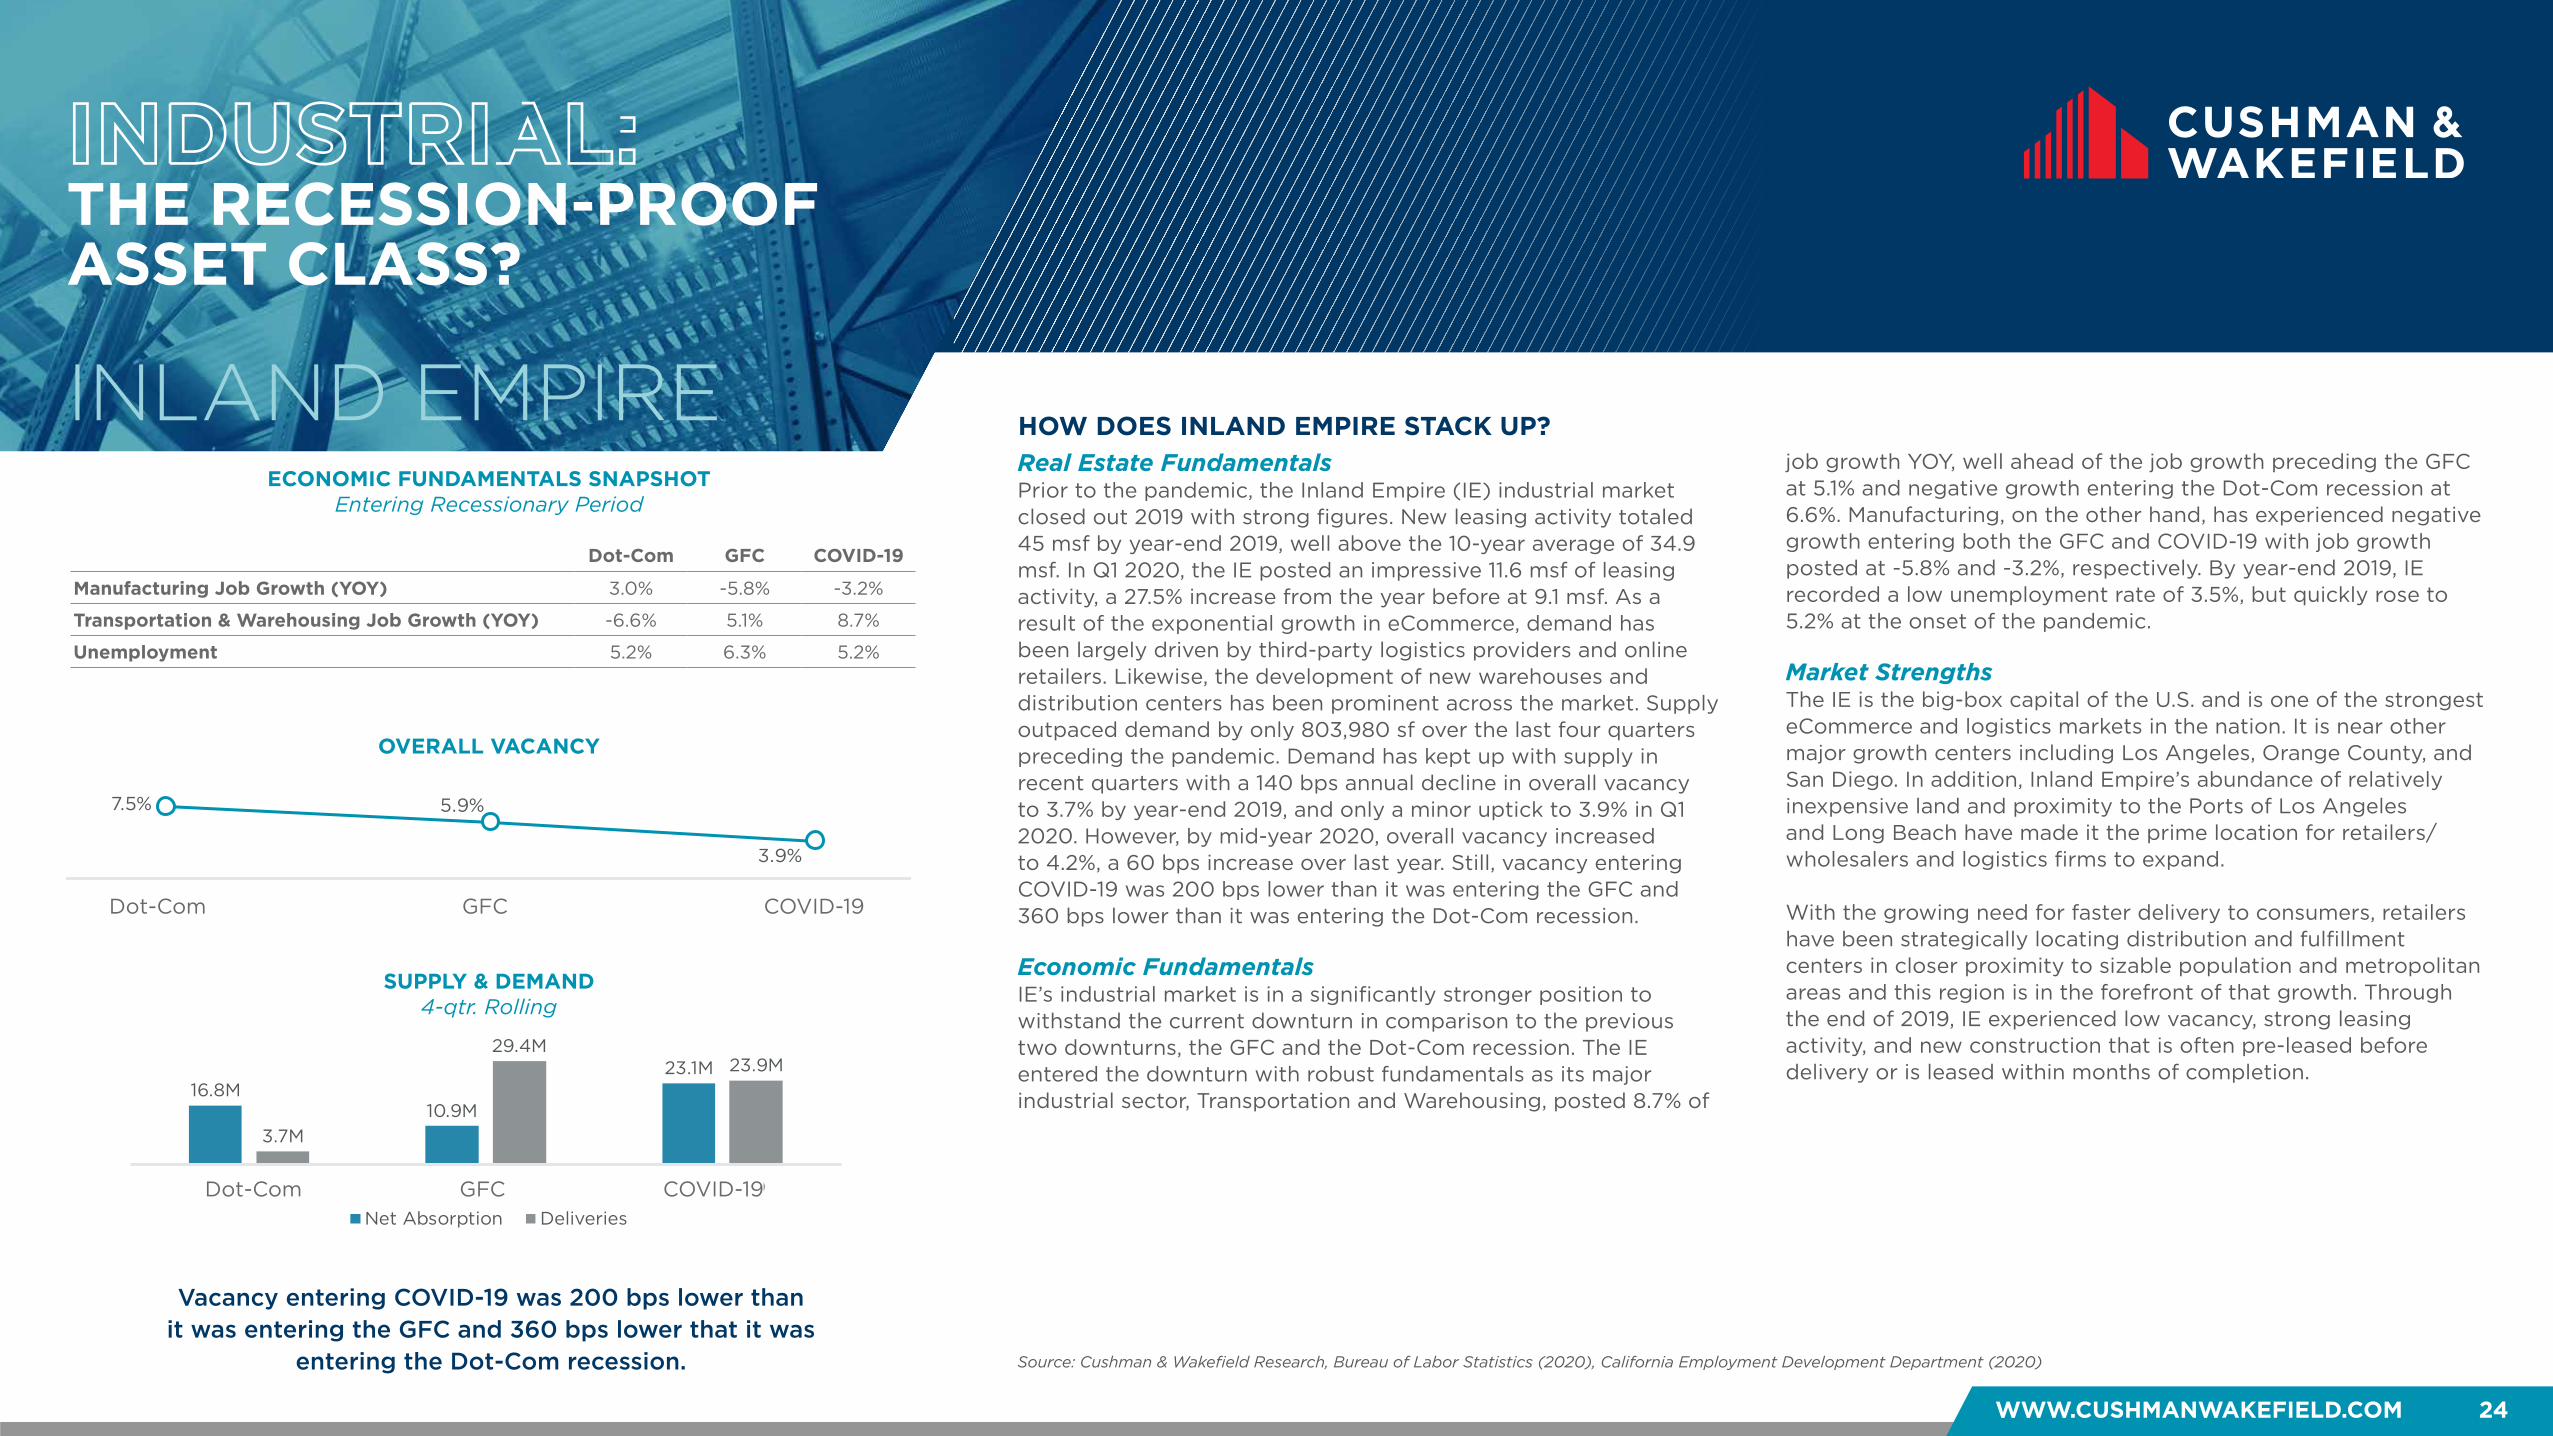
WWW.CUSHMANWAKEFIELD.COM 24
OVERALL VACANCY
SUPPLY & DEMAND4-qtr. Rolling
ECONOMIC FUNDAMENTALS SNAPSHOTEntering Recessionary Period
INDUSTRIAL: THE RECESSION-PROOF ASSET CLASS?
HOW DOES INLAND EMPIRE STACK UP?INLAND EMPIRE
Vacancy entering COVID-19 was 200 bps lower than it was entering the GFC and 360 bps lower that it was
entering the Dot-Com recession.
Real Estate FundamentalsPrior to the pandemic, the Inland Empire (IE) industrial market closed out 2019 with strong figures. New leasing activity totaled 45 msf by year-end 2019, well above the 10-year average of 34.9 msf. In Q1 2020, the IE posted an impressive 11.6 msf of leasing activity, a 27.5% increase from the year before at 9.1 msf. As a result of the exponential growth in eCommerce, demand has been largely driven by third-party logistics providers and online retailers. Likewise, the development of new warehouses and distribution centers has been prominent across the market. Supply outpaced demand by only 803,980 sf over the last four quarters preceding the pandemic. Demand has kept up with supply in recent quarters with a 140 bps annual decline in overall vacancy to 3.7% by year-end 2019, and only a minor uptick to 3.9% in Q1 2020. However, by mid-year 2020, overall vacancy increased to 4.2%, a 60 bps increase over last year. Still, vacancy entering COVID-19 was 200 bps lower than it was entering the GFC and 360 bps lower than it was entering the Dot-Com recession.
Economic FundamentalsIE’s industrial market is in a significantly stronger position to withstand the current downturn in comparison to the previous two downturns, the GFC and the Dot-Com recession. The IE entered the downturn with robust fundamentals as its major industrial sector, Transportation and Warehousing, posted 8.7% of
job growth YOY, well ahead of the job growth preceding the GFC at 5.1% and negative growth entering the Dot-Com recession at 6.6%. Manufacturing, on the other hand, has experienced negative growth entering both the GFC and COVID-19 with job growth posted at -5.8% and -3.2%, respectively. By year-end 2019, IE recorded a low unemployment rate of 3.5%, but quickly rose to 5.2% at the onset of the pandemic.
Market StrengthsThe IE is the big-box capital of the U.S. and is one of the strongest eCommerce and logistics markets in the nation. It is near other major growth centers including Los Angeles, Orange County, and San Diego. In addition, Inland Empire’s abundance of relatively inexpensive land and proximity to the Ports of Los Angeles and Long Beach have made it the prime location for retailers/wholesalers and logistics firms to expand.
With the growing need for faster delivery to consumers, retailers have been strategically locating distribution and fulfillment centers in closer proximity to sizable population and metropolitan areas and this region is in the forefront of that growth. Through the end of 2019, IE experienced low vacancy, strong leasing activity, and new construction that is often pre-leased before delivery or is leased within months of completion.
Source: Cushman & Wakefield Research, Bureau of Labor Statistics (2020), California Employment Development Department (2020)
Dot-Com GFC COVID-19
Manufacturing Job Growth (YOY) 3.0% -5.8% -3.2%
Transportation & Warehousing Job Growth (YOY) -6.6% 5.1% 8.7%
Unemployment 5.2% 6.3% 5.2%
7.5% 5.9%
3.9%
Dot Com Financial Crisis COVID-19
16.8M10.9M
23.1M
3.7M
29.4M23.9M
Dot Com Financial Crisis COVID-19
Net Absorption Deliveries
Dot-Com GFC COVID-19
Dot-Com GFC COVID-19
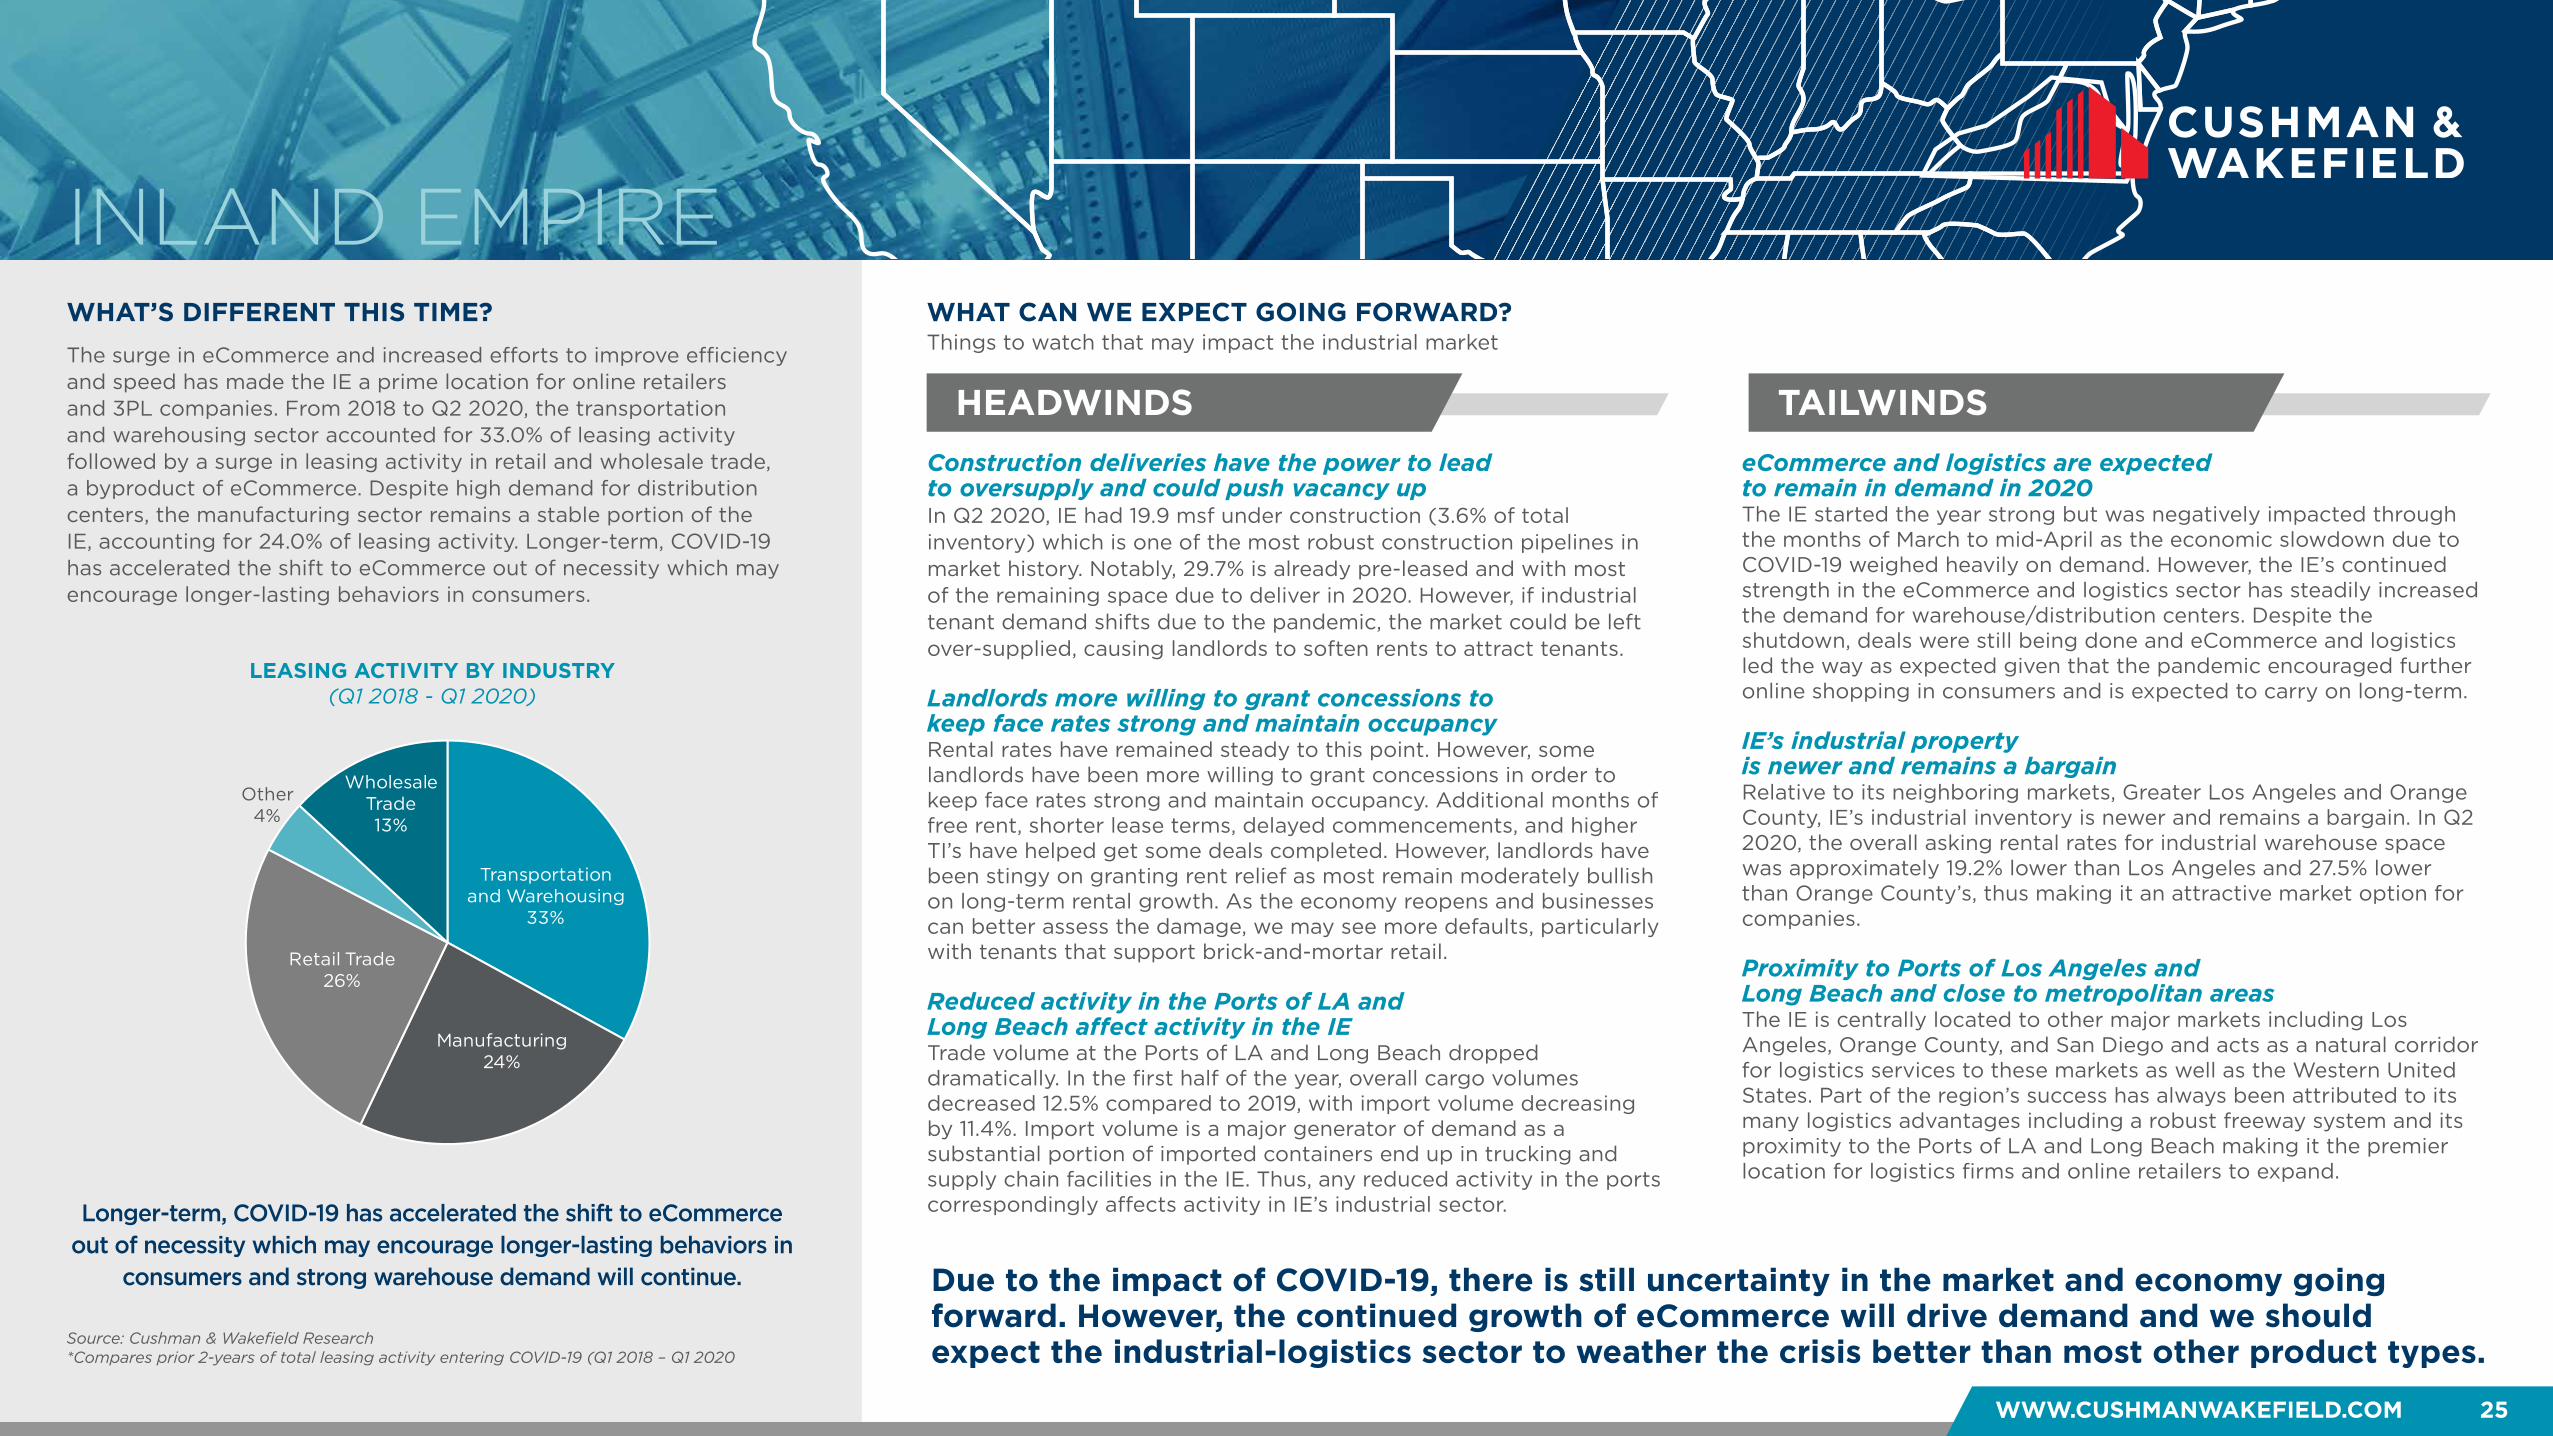
WHAT’S DIFFERENT THIS TIME?
HEADWINDS TAILWINDS
WHAT CAN WE EXPECT GOING FORWARD?
WWW.CUSHMANWAKEFIELD.COM 25
Things to watch that may impact the industrial market
INLAND EMPIRE
Due to the impact of COVID-19, there is still uncertainty in the market and economy going forward. However, the continued growth of eCommerce will drive demand and we should expect the industrial-logistics sector to weather the crisis better than most other product types.
Construction deliveries have the power to lead to oversupply and could push vacancy up In Q2 2020, IE had 19.9 msf under construction (3.6% of total inventory) which is one of the most robust construction pipelines in market history. Notably, 29.7% is already pre-leased and with most of the remaining space due to deliver in 2020. However, if industrial tenant demand shifts due to the pandemic, the market could be left over-supplied, causing landlords to soften rents to attract tenants. Landlords more willing to grant concessions to keep face rates strong and maintain occupancy Rental rates have remained steady to this point. However, some landlords have been more willing to grant concessions in order to keep face rates strong and maintain occupancy. Additional months of free rent, shorter lease terms, delayed commencements, and higher TI’s have helped get some deals completed. However, landlords have been stingy on granting rent relief as most remain moderately bullish on long-term rental growth. As the economy reopens and businesses can better assess the damage, we may see more defaults, particularly with tenants that support brick-and-mortar retail. Reduced activity in the Ports of LA and Long Beach affect activity in the IE Trade volume at the Ports of LA and Long Beach dropped dramatically. In the first half of the year, overall cargo volumes decreased 12.5% compared to 2019, with import volume decreasing by 11.4%. Import volume is a major generator of demand as a substantial portion of imported containers end up in trucking and supply chain facilities in the IE. Thus, any reduced activity in the ports correspondingly affects activity in IE’s industrial sector.
eCommerce and logistics are expected to remain in demand in 2020 The IE started the year strong but was negatively impacted through the months of March to mid-April as the economic slowdown due to COVID-19 weighed heavily on demand. However, the IE’s continued strength in the eCommerce and logistics sector has steadily increased the demand for warehouse/distribution centers. Despite the shutdown, deals were still being done and eCommerce and logistics led the way as expected given that the pandemic encouraged further online shopping in consumers and is expected to carry on long-term. IE’s industrial property is newer and remains a bargain Relative to its neighboring markets, Greater Los Angeles and Orange County, IE’s industrial inventory is newer and remains a bargain. In Q2 2020, the overall asking rental rates for industrial warehouse space was approximately 19.2% lower than Los Angeles and 27.5% lower than Orange County’s, thus making it an attractive market option for companies. Proximity to Ports of Los Angeles and Long Beach and close to metropolitan areas The IE is centrally located to other major markets including Los Angeles, Orange County, and San Diego and acts as a natural corridor for logistics services to these markets as well as the Western United States. Part of the region’s success has always been attributed to its many logistics advantages including a robust freeway system and its proximity to the Ports of LA and Long Beach making it the premier location for logistics firms and online retailers to expand.
Longer-term, COVID-19 has accelerated the shift to eCommerce out of necessity which may encourage longer-lasting behaviors in
consumers and strong warehouse demand will continue.
The surge in eCommerce and increased efforts to improve efficiency and speed has made the IE a prime location for online retailers and 3PL companies. From 2018 to Q2 2020, the transportation and warehousing sector accounted for 33.0% of leasing activity followed by a surge in leasing activity in retail and wholesale trade, a byproduct of eCommerce. Despite high demand for distribution centers, the manufacturing sector remains a stable portion of the IE, accounting for 24.0% of leasing activity. Longer-term, COVID-19 has accelerated the shift to eCommerce out of necessity which may encourage longer-lasting behaviors in consumers.
Source: Cushman & Wakefield Research*Compares prior 2-years of total leasing activity entering COVID-19 (Q1 2018 – Q1 2020
LEASING ACTIVITY BY INDUSTRY (Q1 2018 - Q1 2020)
Transportation and Warehousing
33%
Manufacturing24%
Retail Trade26%
Other4%
Wholesale Trade13% Transportation and
WarehousingManufacturing
Retail Trade
Other
Wholesale Trade
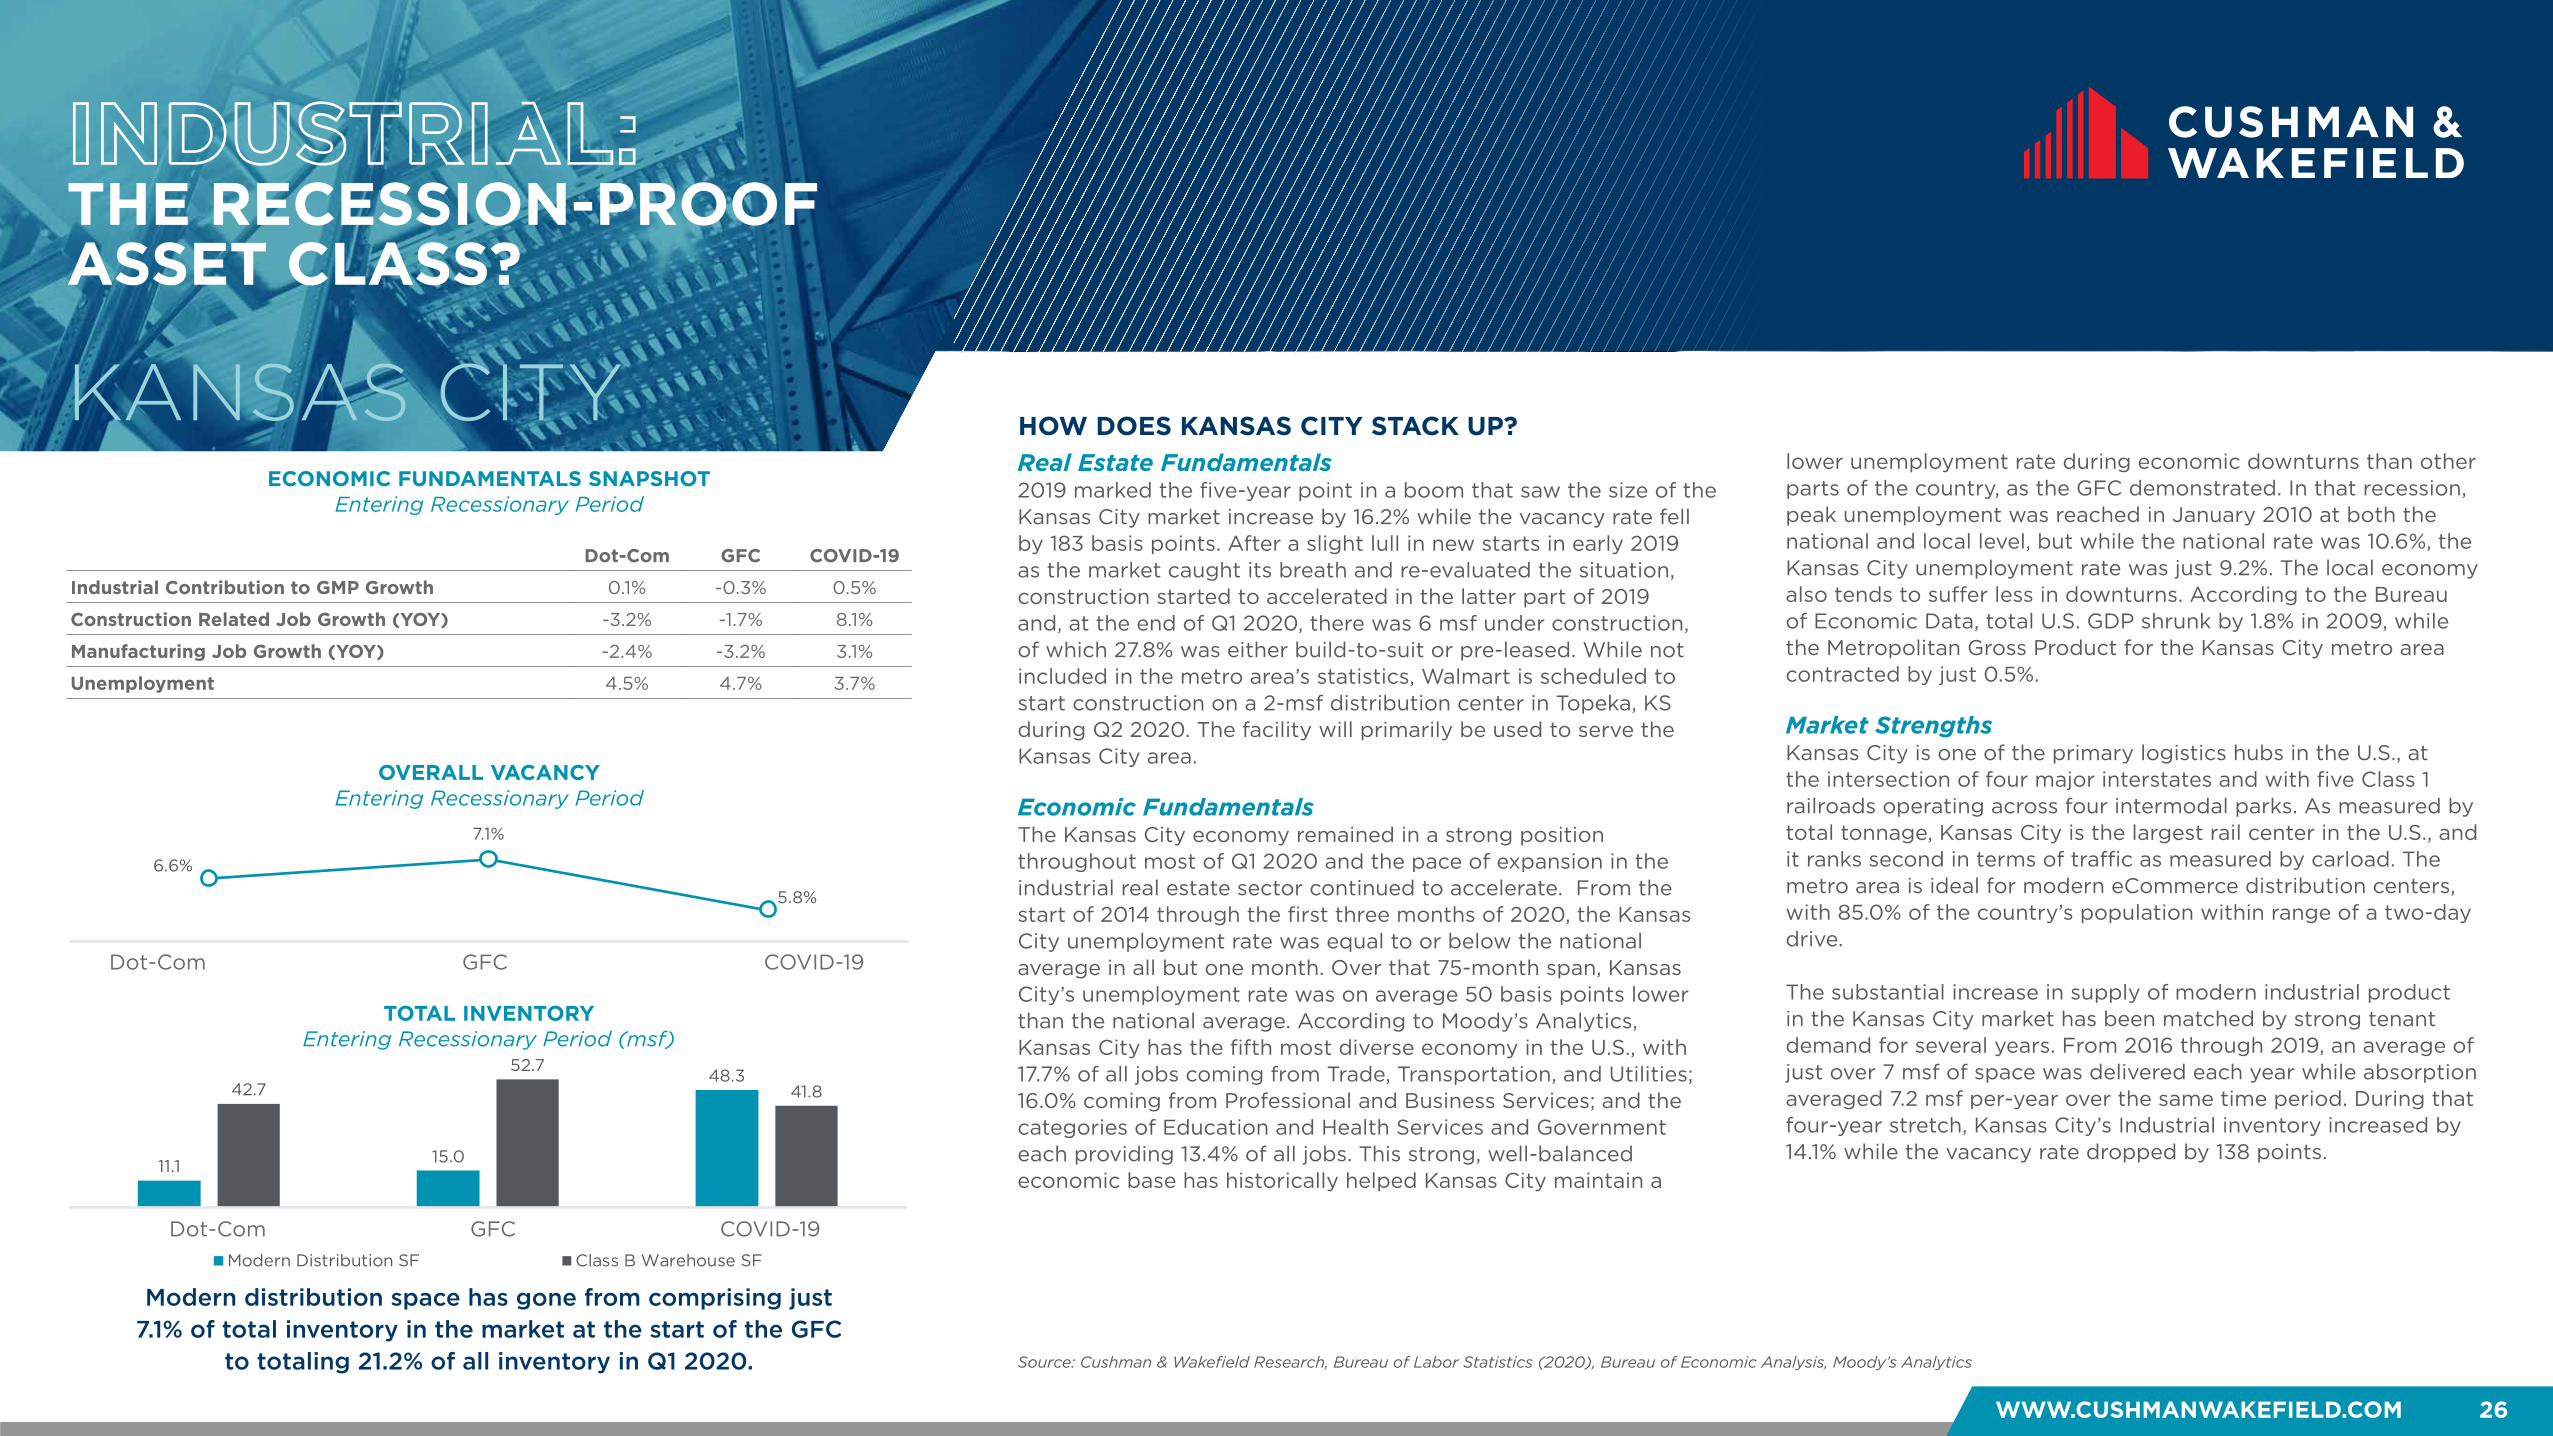
WWW.CUSHMANWAKEFIELD.COM 26
INDUSTRIAL: THE RECESSION-PROOF ASSET CLASS?
HOW DOES KANSAS CITY STACK UP?KANSAS CITY
Dot-Com GFC COVID-19
Industrial Contribution to GMP Growth 0.1% -0.3% 0.5%
Construction Related Job Growth (YOY) -3.2% -1.7% 8.1%
Manufacturing Job Growth (YOY) -2.4% -3.2% 3.1%
Unemployment 4.5% 4.7% 3.7%
Modern distribution space has gone from comprising just 7.1% of total inventory in the market at the start of the GFC
to totaling 21.2% of all inventory in Q1 2020.
Real Estate Fundamentals2019 marked the five-year point in a boom that saw the size of the Kansas City market increase by 16.2% while the vacancy rate fell by 183 basis points. After a slight lull in new starts in early 2019 as the market caught its breath and re-evaluated the situation, construction started to accelerated in the latter part of 2019 and, at the end of Q1 2020, there was 6 msf under construction, of which 27.8% was either build-to-suit or pre-leased. While not included in the metro area’s statistics, Walmart is scheduled to start construction on a 2-msf distribution center in Topeka, KS during Q2 2020. The facility will primarily be used to serve the Kansas City area.
Economic FundamentalsThe Kansas City economy remained in a strong position throughout most of Q1 2020 and the pace of expansion in the industrial real estate sector continued to accelerate. From the start of 2014 through the first three months of 2020, the Kansas City unemployment rate was equal to or below the national average in all but one month. Over that 75-month span, Kansas City’s unemployment rate was on average 50 basis points lower than the national average. According to Moody’s Analytics, Kansas City has the fifth most diverse economy in the U.S., with 17.7% of all jobs coming from Trade, Transportation, and Utilities; 16.0% coming from Professional and Business Services; and the categories of Education and Health Services and Government each providing 13.4% of all jobs. This strong, well-balanced economic base has historically helped Kansas City maintain a
lower unemployment rate during economic downturns than other parts of the country, as the GFC demonstrated. In that recession, peak unemployment was reached in January 2010 at both the national and local level, but while the national rate was 10.6%, the Kansas City unemployment rate was just 9.2%. The local economy also tends to suffer less in downturns. According to the Bureau of Economic Data, total U.S. GDP shrunk by 1.8% in 2009, while the Metropolitan Gross Product for the Kansas City metro area contracted by just 0.5%.
Market StrengthsKansas City is one of the primary logistics hubs in the U.S., at the intersection of four major interstates and with five Class 1 railroads operating across four intermodal parks. As measured by total tonnage, Kansas City is the largest rail center in the U.S., and it ranks second in terms of traffic as measured by carload. The metro area is ideal for modern eCommerce distribution centers, with 85.0% of the country’s population within range of a two-day drive. The substantial increase in supply of modern industrial product in the Kansas City market has been matched by strong tenant demand for several years. From 2016 through 2019, an average of just over 7 msf of space was delivered each year while absorption averaged 7.2 msf per-year over the same time period. During that four-year stretch, Kansas City’s Industrial inventory increased by 14.1% while the vacancy rate dropped by 138 points.
Source: Cushman & Wakefield Research, Bureau of Labor Statistics (2020), Bureau of Economic Analysis, Moody’s Analytics
OVERALL VACANCYEntering Recessionary Period
TOTAL INVENTORY Entering Recessionary Period (msf)
6.6%
7.1%
5.8%
Dot.Com Financial Crisis COVID-19
ECONOMIC FUNDAMENTALS SNAPSHOTEntering Recessionary Period
11.1 15.0
48.342.7
52.7
41.8
Dot.Com Financial Crisis COVID-19
Modern Distribution SF Class B Warehouse SF
Dot-Com GFC COVID-19
Dot-Com GFC COVID-19
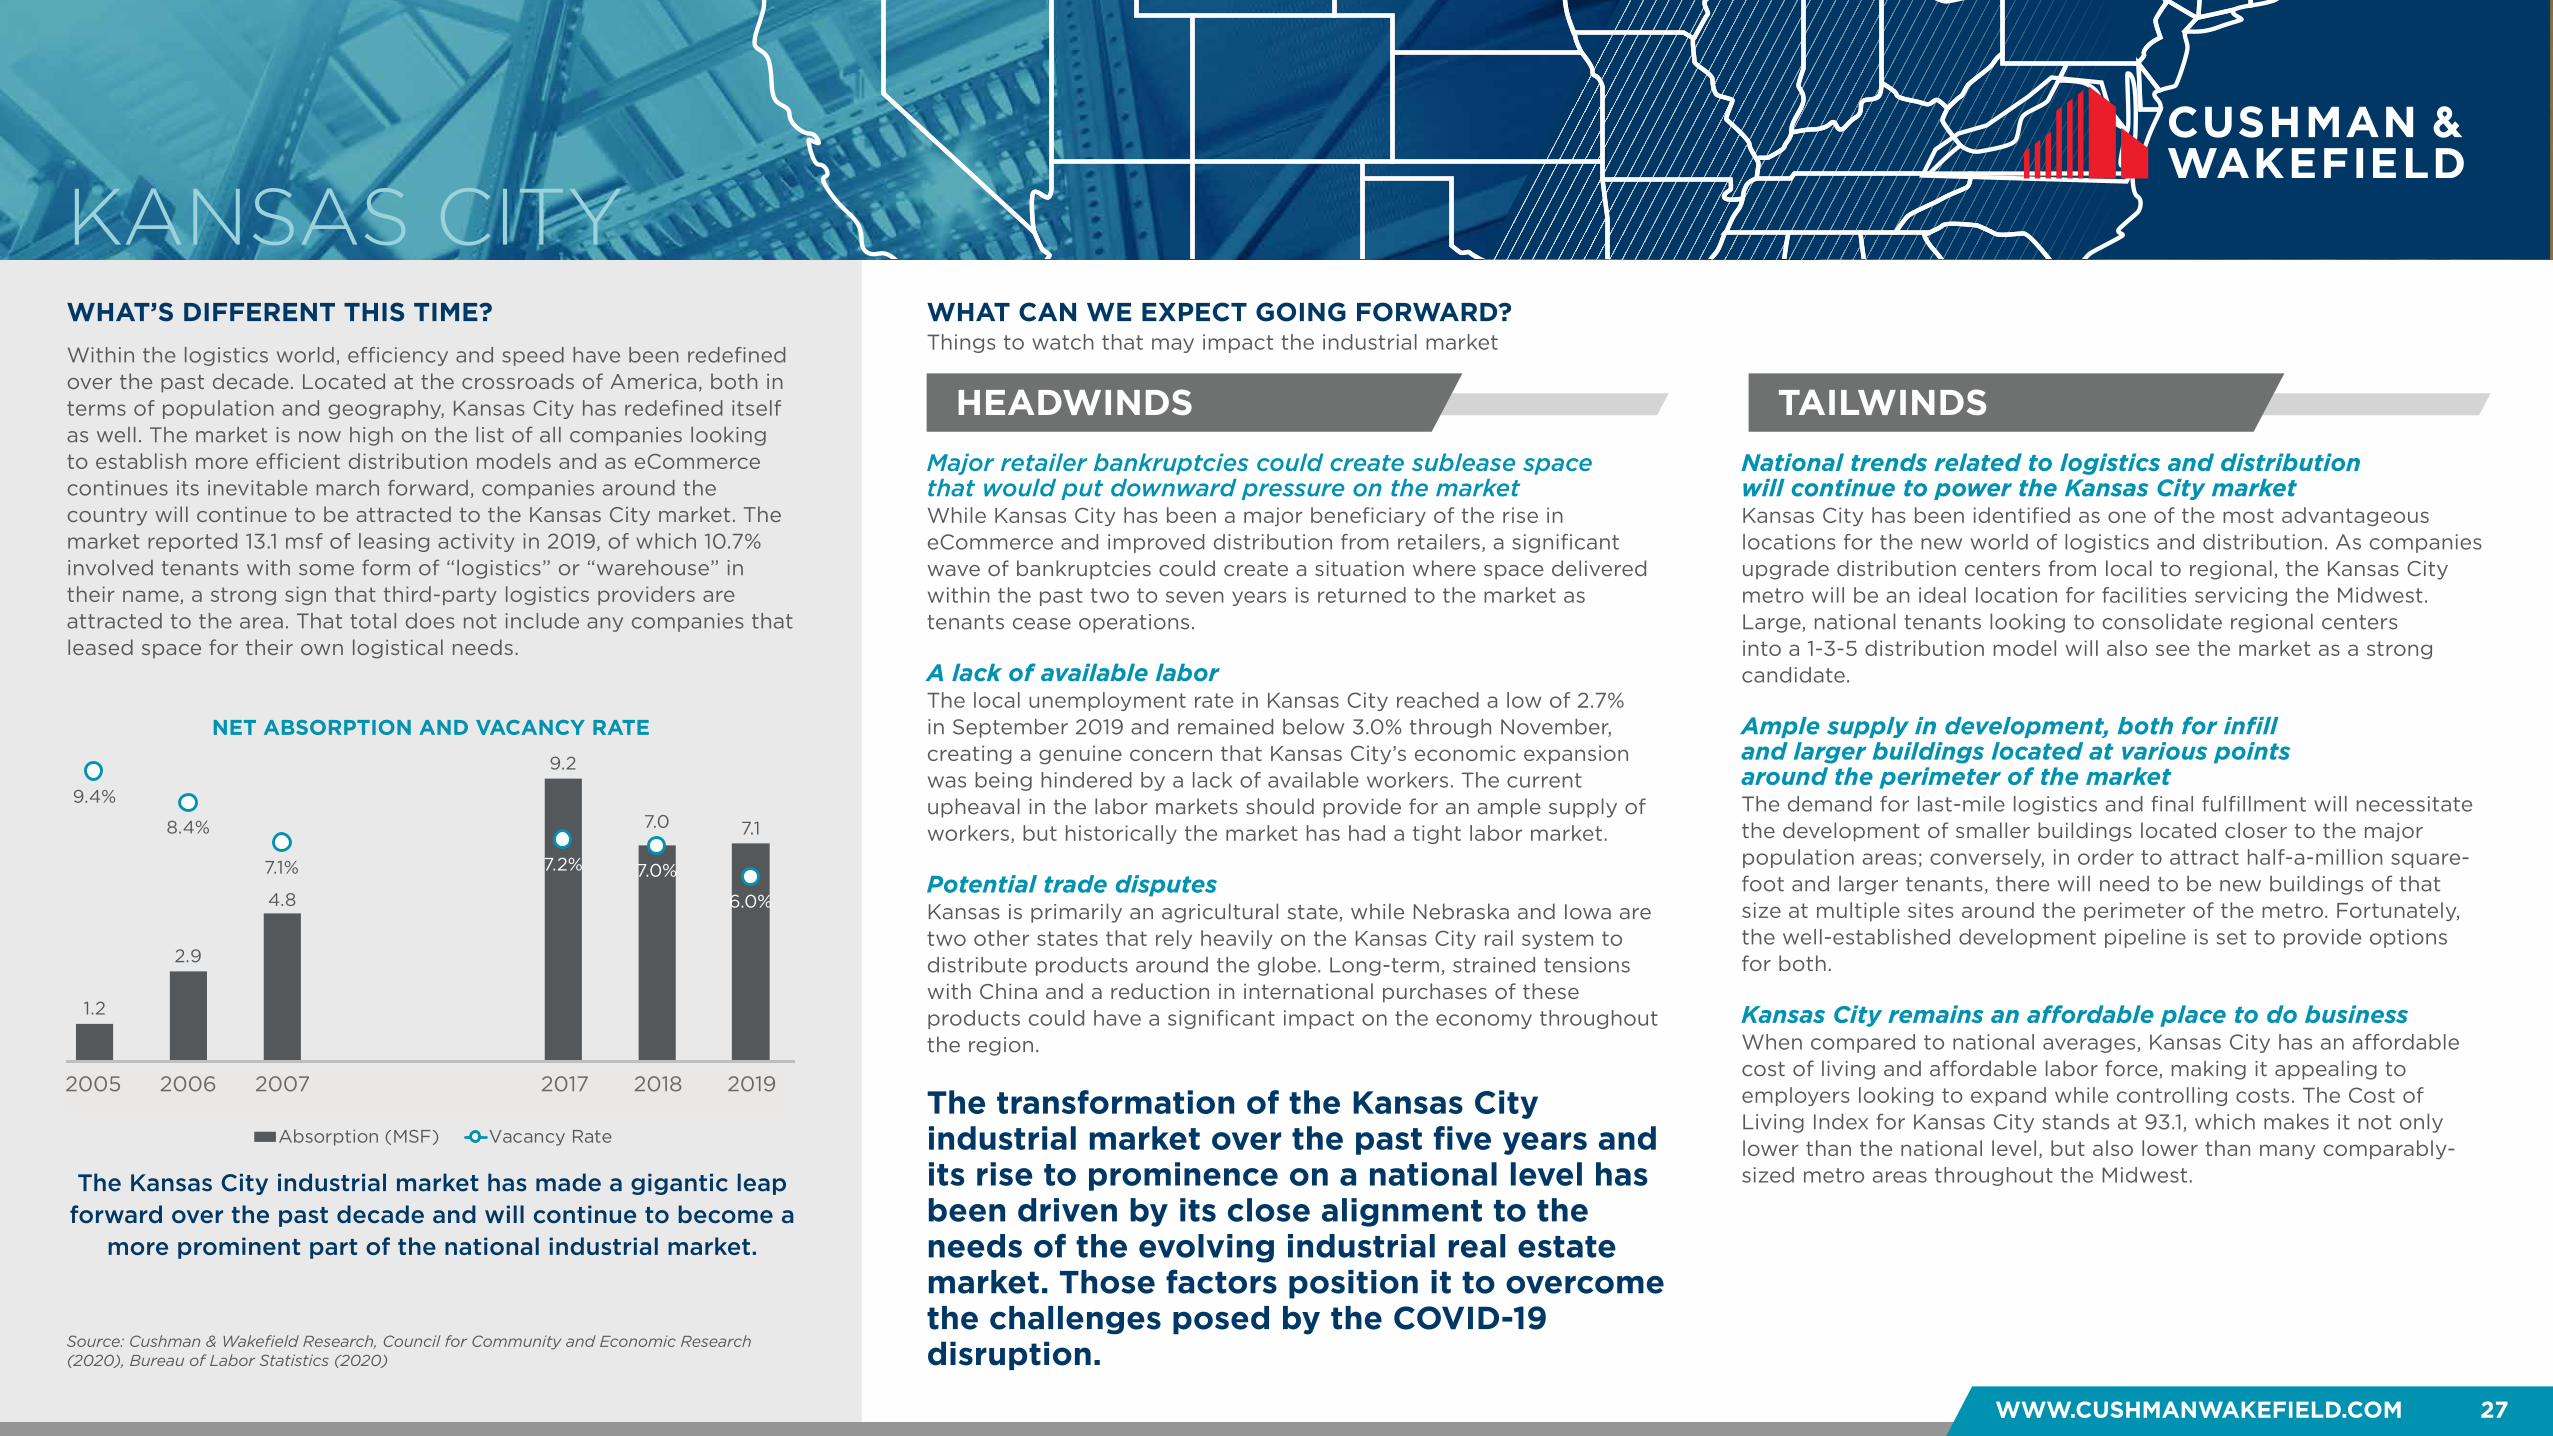
WHAT’S DIFFERENT THIS TIME?
HEADWINDS TAILWINDS
WHAT CAN WE EXPECT GOING FORWARD?
WWW.CUSHMANWAKEFIELD.COM 27
Things to watch that may impact the industrial market
KANSAS CITY
The transformation of the Kansas City industrial market over the past five years and its rise to prominence on a national level has been driven by its close alignment to the needs of the evolving industrial real estate market. Those factors position it to overcome the challenges posed by the COVID-19 disruption.
Major retailer bankruptcies could create sublease space that would put downward pressure on the market While Kansas City has been a major beneficiary of the rise in eCommerce and improved distribution from retailers, a significant wave of bankruptcies could create a situation where space delivered within the past two to seven years is returned to the market as tenants cease operations. A lack of available labor The local unemployment rate in Kansas City reached a low of 2.7% in September 2019 and remained below 3.0% through November, creating a genuine concern that Kansas City’s economic expansion was being hindered by a lack of available workers. The current upheaval in the labor markets should provide for an ample supply of workers, but historically the market has had a tight labor market. Potential trade disputes Kansas is primarily an agricultural state, while Nebraska and Iowa are two other states that rely heavily on the Kansas City rail system to distribute products around the globe. Long-term, strained tensions with China and a reduction in international purchases of these products could have a significant impact on the economy throughout the region.
National trends related to logistics and distribution will continue to power the Kansas City market Kansas City has been identified as one of the most advantageous locations for the new world of logistics and distribution. As companies upgrade distribution centers from local to regional, the Kansas City metro will be an ideal location for facilities servicing the Midwest. Large, national tenants looking to consolidate regional centers into a 1-3-5 distribution model will also see the market as a strong candidate. Ample supply in development, both for infill and larger buildings located at various points around the perimeter of the market The demand for last-mile logistics and final fulfillment will necessitate the development of smaller buildings located closer to the major population areas; conversely, in order to attract half-a-million square-foot and larger tenants, there will need to be new buildings of that size at multiple sites around the perimeter of the metro. Fortunately, the well-established development pipeline is set to provide options for both. Kansas City remains an affordable place to do business When compared to national averages, Kansas City has an affordable cost of living and affordable labor force, making it appealing to employers looking to expand while controlling costs. The Cost of Living Index for Kansas City stands at 93.1, which makes it not only lower than the national level, but also lower than many comparably-sized metro areas throughout the Midwest. The Kansas City industrial market has made a gigantic leap
forward over the past decade and will continue to become a more prominent part of the national industrial market.
Within the logistics world, efficiency and speed have been redefined over the past decade. Located at the crossroads of America, both in terms of population and geography, Kansas City has redefined itself as well. The market is now high on the list of all companies looking to establish more efficient distribution models and as eCommerce continues its inevitable march forward, companies around the country will continue to be attracted to the Kansas City market. The market reported 13.1 msf of leasing activity in 2019, of which 10.7% involved tenants with some form of “logistics” or “warehouse” in their name, a strong sign that third-party logistics providers are attracted to the area. That total does not include any companies that leased space for their own logistical needs.
Source: Cushman & Wakefield Research, Council for Community and Economic Research (2020), Bureau of Labor Statistics (2020)
NET ABSORPTION AND VACANCY RATE
1.2
2.9
4.8
9.2
7.0 7.1
9.4%
8.4%
7.1% 7.2% 7.0%
6.0%
0.0%
1.0%
2.0%
3.0%
4.0%
5.0%
6.0%
7.0%
8.0%
9.0%
10.0%
0.0
2.0
4.0
6.0
8.0
10.0
1 2 3 4 5 6 7 8
Absorption (MSF) Vacancy Rate
2005 2006 2007 2017 2018 2019
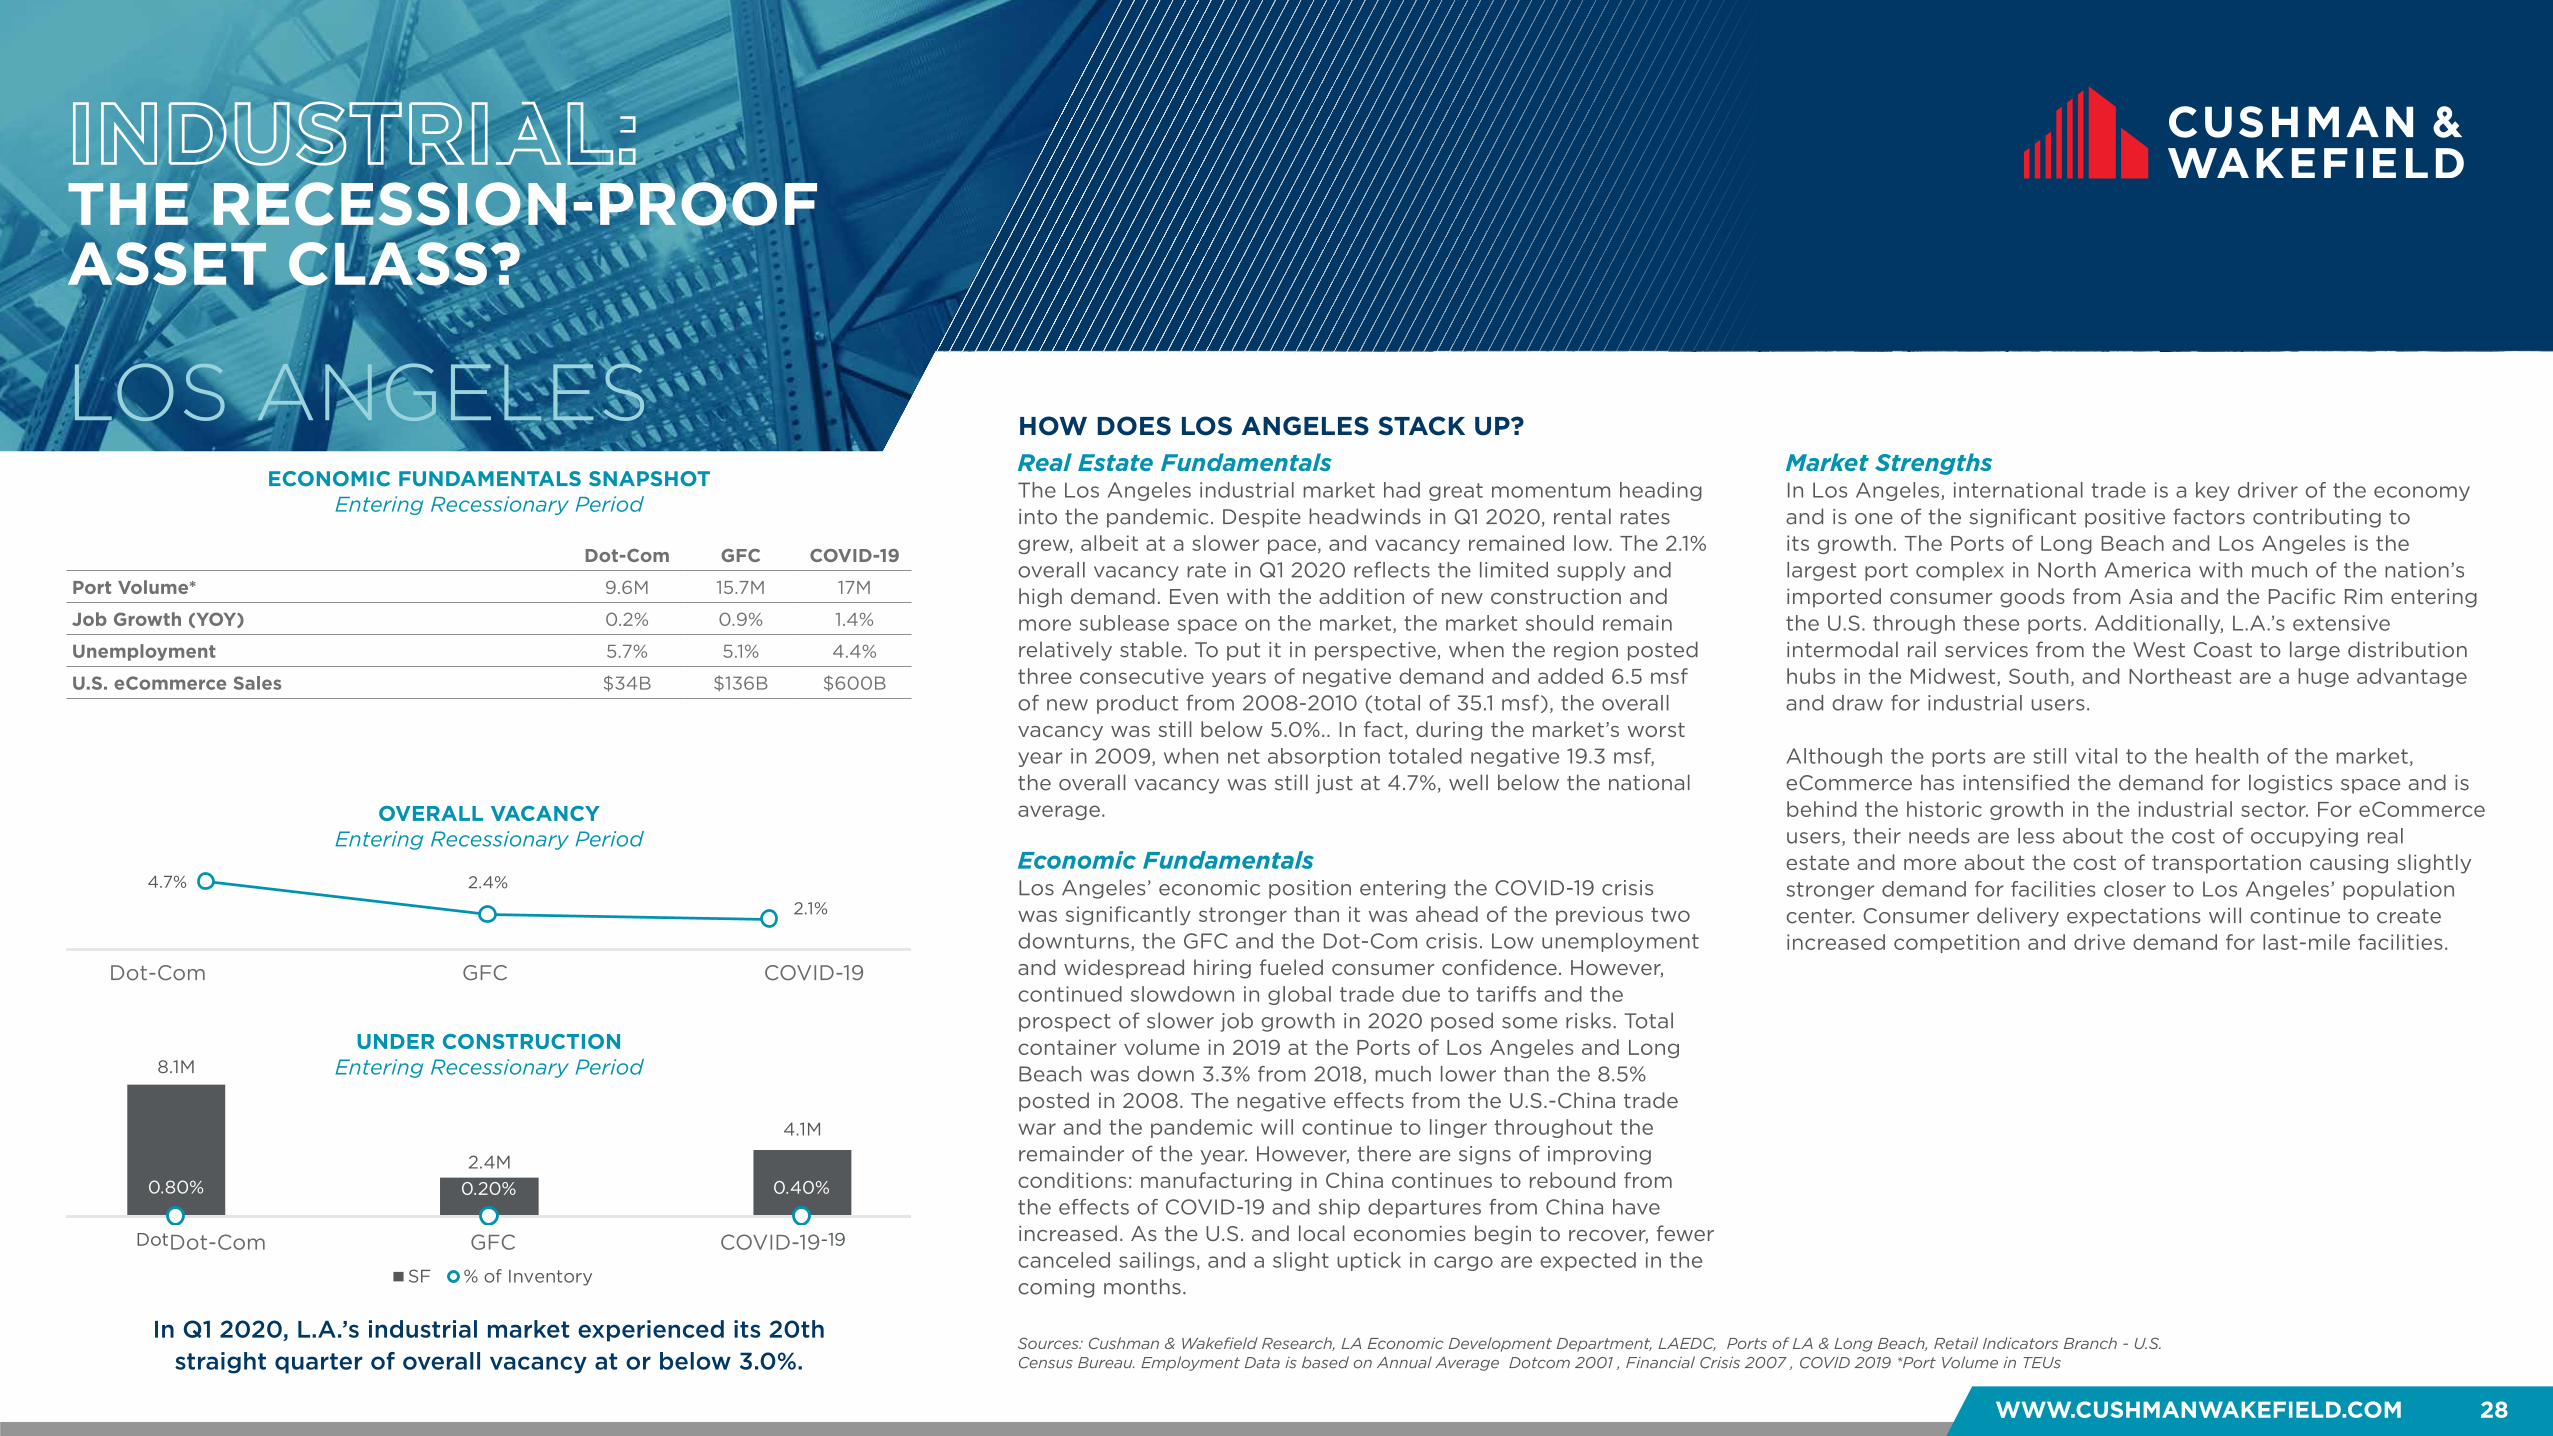
WWW.CUSHMANWAKEFIELD.COM 28
INDUSTRIAL: THE RECESSION-PROOF ASSET CLASS?
HOW DOES LOS ANGELES STACK UP?LOS ANGELES
UNDER CONSTRUCTION Entering Recessionary Period
In Q1 2020, L.A.’s industrial market experienced its 20th straight quarter of overall vacancy at or below 3.0%.
Real Estate FundamentalsThe Los Angeles industrial market had great momentum heading into the pandemic. Despite headwinds in Q1 2020, rental rates grew, albeit at a slower pace, and vacancy remained low. The 2.1% overall vacancy rate in Q1 2020 reflects the limited supply and high demand. Even with the addition of new construction and more sublease space on the market, the market should remain relatively stable. To put it in perspective, when the region posted three consecutive years of negative demand and added 6.5 msf of new product from 2008-2010 (total of 35.1 msf), the overall vacancy was still below 5.0%.. In fact, during the market’s worst year in 2009, when net absorption totaled negative 19.3 msf, the overall vacancy was still just at 4.7%, well below the national average.
Economic FundamentalsLos Angeles’ economic position entering the COVID-19 crisis was significantly stronger than it was ahead of the previous two downturns, the GFC and the Dot-Com crisis. Low unemployment and widespread hiring fueled consumer confidence. However, continued slowdown in global trade due to tariffs and the prospect of slower job growth in 2020 posed some risks. Total container volume in 2019 at the Ports of Los Angeles and Long Beach was down 3.3% from 2018, much lower than the 8.5% posted in 2008. The negative effects from the U.S.-China trade war and the pandemic will continue to linger throughout the remainder of the year. However, there are signs of improving conditions: manufacturing in China continues to rebound from the effects of COVID-19 and ship departures from China have increased. As the U.S. and local economies begin to recover, fewer canceled sailings, and a slight uptick in cargo are expected in the coming months.
Market StrengthsIn Los Angeles, international trade is a key driver of the economy and is one of the significant positive factors contributing to its growth. The Ports of Long Beach and Los Angeles is the largest port complex in North America with much of the nation’s imported consumer goods from Asia and the Pacific Rim entering the U.S. through these ports. Additionally, L.A.’s extensive intermodal rail services from the West Coast to large distribution hubs in the Midwest, South, and Northeast are a huge advantage and draw for industrial users. Although the ports are still vital to the health of the market, eCommerce has intensified the demand for logistics space and is behind the historic growth in the industrial sector. For eCommerce users, their needs are less about the cost of occupying real estate and more about the cost of transportation causing slightly stronger demand for facilities closer to Los Angeles’ population center. Consumer delivery expectations will continue to create increased competition and drive demand for last-mile facilities.
Sources: Cushman & Wakefield Research, LA Economic Development Department, LAEDC, Ports of LA & Long Beach, Retail Indicators Branch - U.S. Census Bureau. Employment Data is based on Annual Average Dotcom 2001 , Financial Crisis 2007 , COVID 2019 *Port Volume in TEUs
OVERALL VACANCYEntering Recessionary Period
ECONOMIC FUNDAMENTALS SNAPSHOTEntering Recessionary Period
Dot-Com GFC COVID-19
Port Volume* 9.6M 15.7M 17M
Job Growth (YOY) 0.2% 0.9% 1.4%
Unemployment 5.7% 5.1% 4.4%
U.S. eCommerce Sales $34B $136B $600B
4.7% 2.4%2.1%
Dot Com Financial Crisis COVID-19
8.1M
2.4M
4.1M
0.80% 0.20% 0.40%
Dot Com Financial Crisis COVID-19
SF % of Inventory
Dot-Com GFC COVID-19
Dot-Com GFC COVID-19
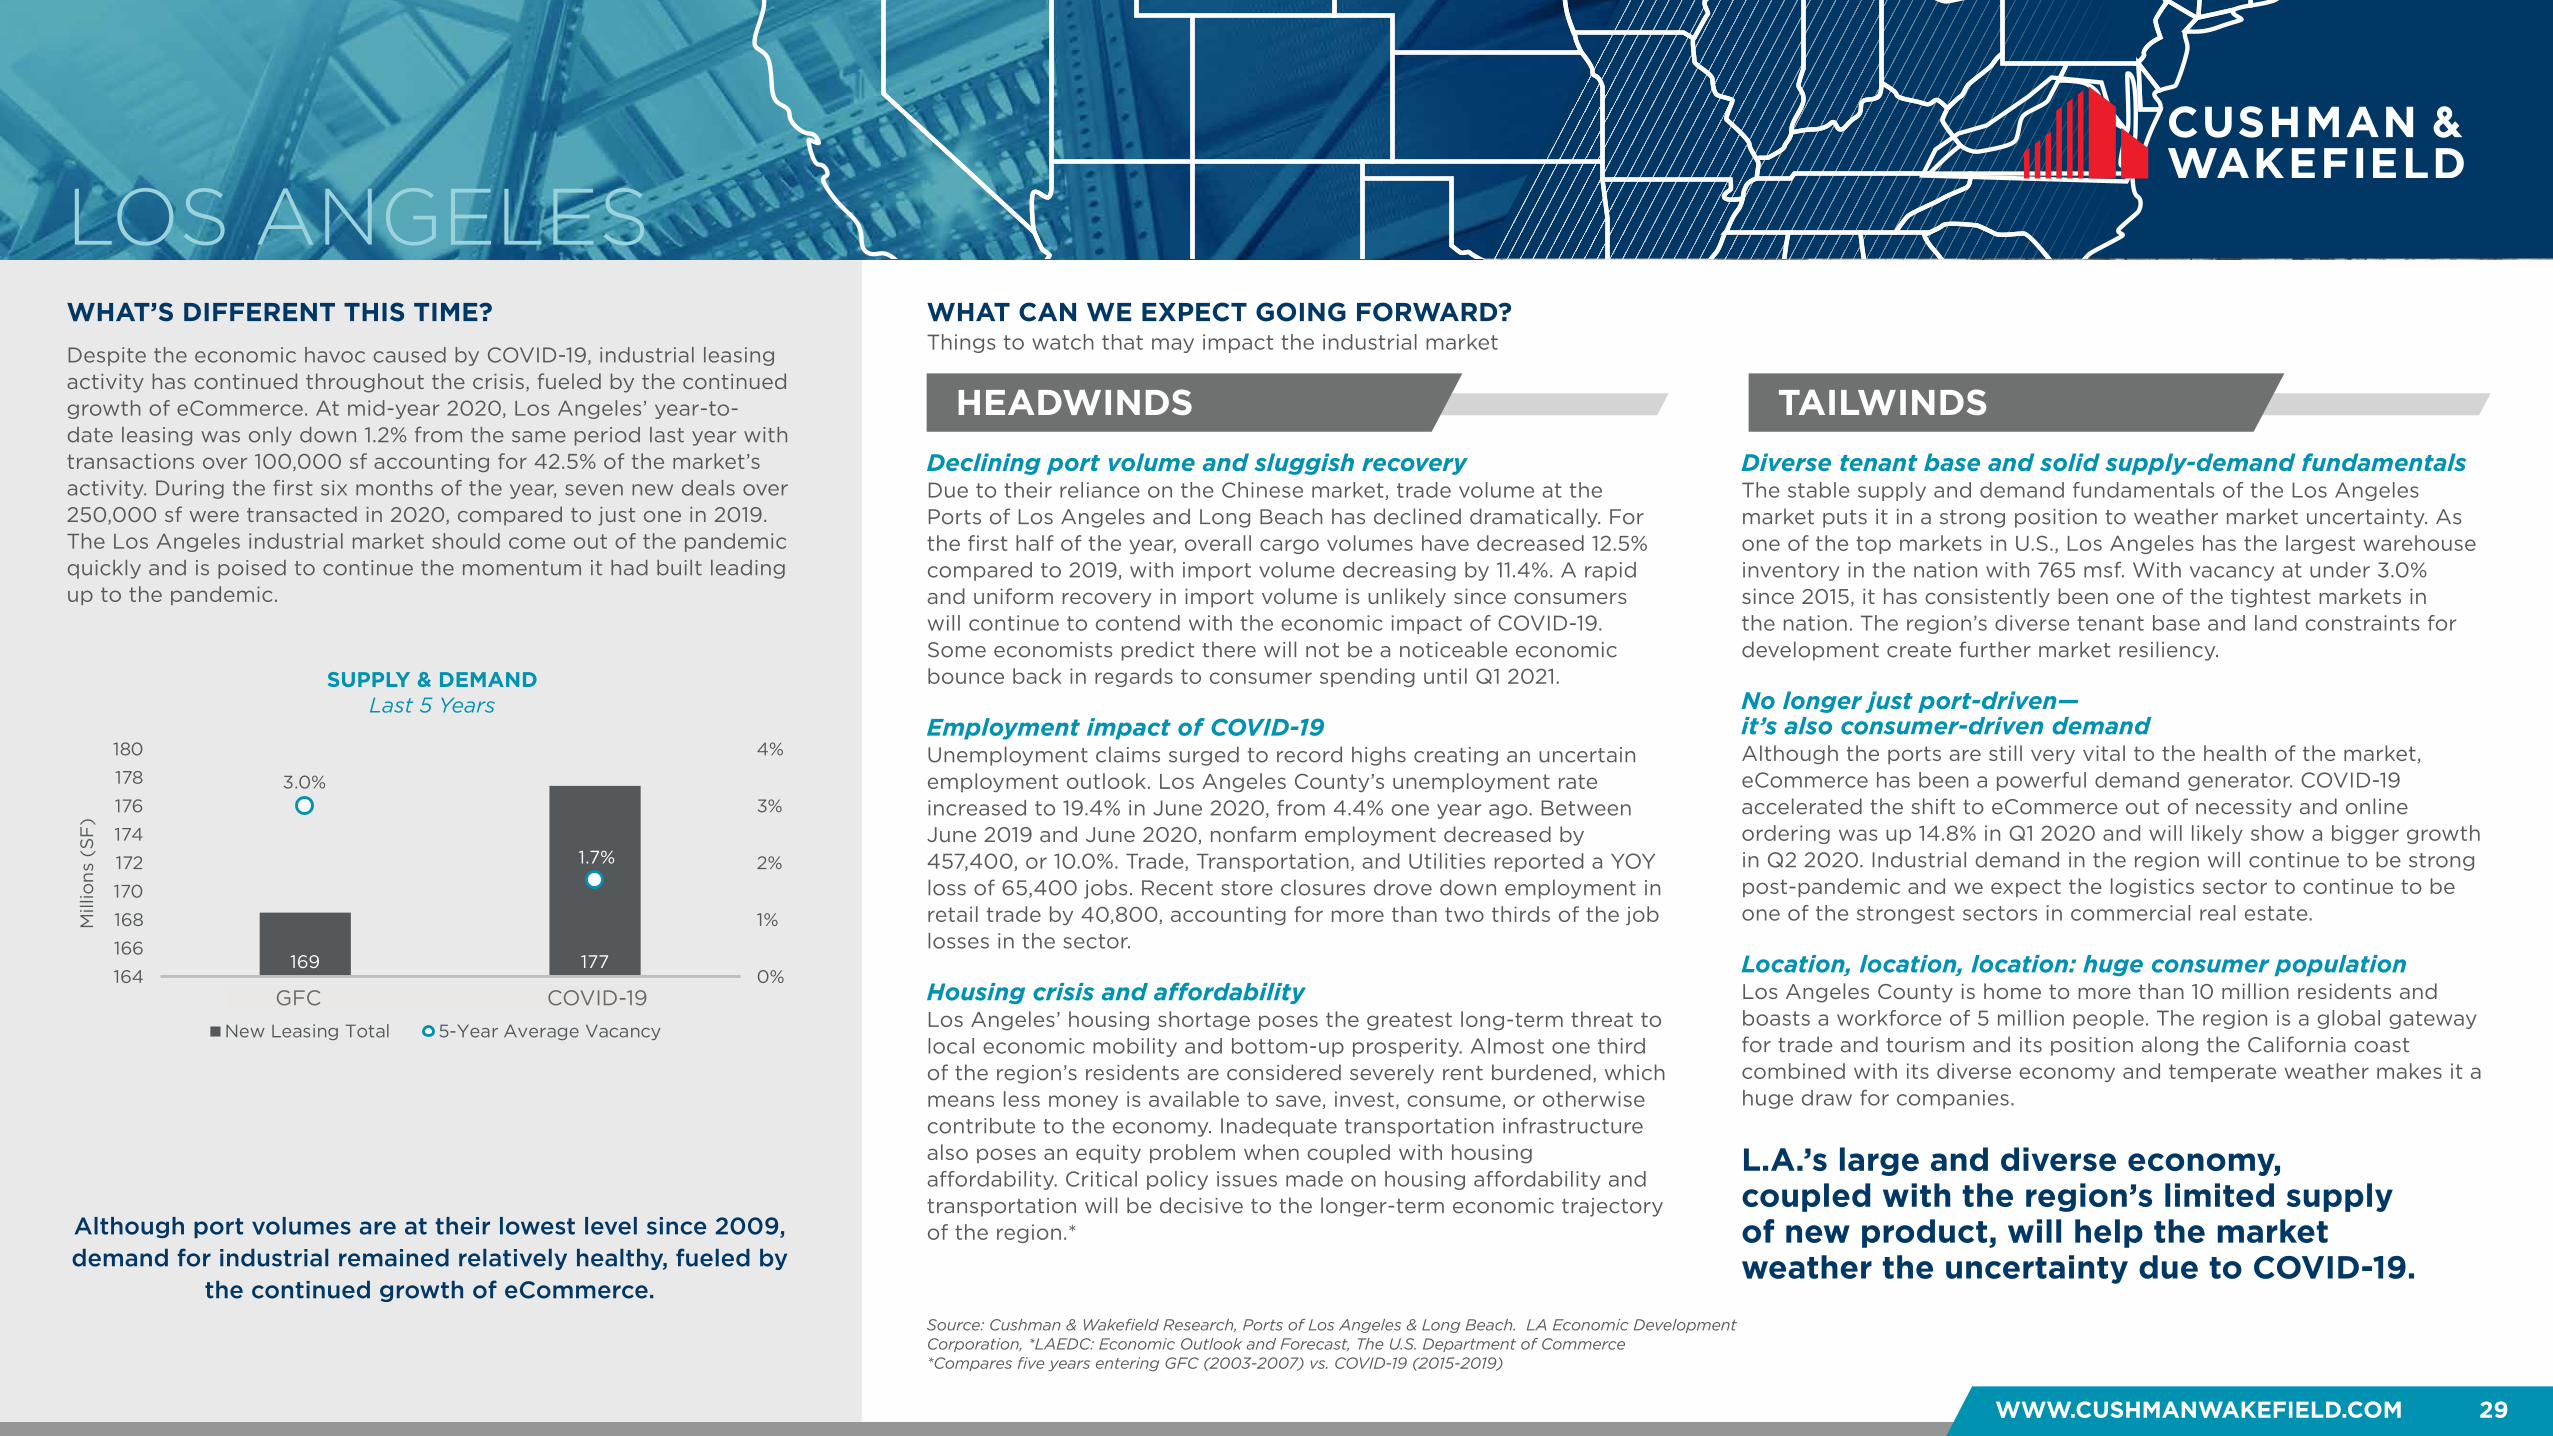
WHAT’S DIFFERENT THIS TIME?
HEADWINDS TAILWINDS
WHAT CAN WE EXPECT GOING FORWARD?
WWW.CUSHMANWAKEFIELD.COM 29
Things to watch that may impact the industrial market
LOS ANGELES
Declining port volume and sluggish recovery Due to their reliance on the Chinese market, trade volume at the Ports of Los Angeles and Long Beach has declined dramatically. For the first half of the year, overall cargo volumes have decreased 12.5% compared to 2019, with import volume decreasing by 11.4%. A rapid and uniform recovery in import volume is unlikely since consumers will continue to contend with the economic impact of COVID-19. Some economists predict there will not be a noticeable economic bounce back in regards to consumer spending until Q1 2021. Employment impact of COVID-19 Unemployment claims surged to record highs creating an uncertain employment outlook. Los Angeles County’s unemployment rate increased to 19.4% in June 2020, from 4.4% one year ago. Between June 2019 and June 2020, nonfarm employment decreased by 457,400, or 10.0%. Trade, Transportation, and Utilities reported a YOY loss of 65,400 jobs. Recent store closures drove down employment in retail trade by 40,800, accounting for more than two thirds of the job losses in the sector. Housing crisis and affordability Los Angeles’ housing shortage poses the greatest long-term threat to local economic mobility and bottom-up prosperity. Almost one third of the region’s residents are considered severely rent burdened, which means less money is available to save, invest, consume, or otherwise contribute to the economy. Inadequate transportation infrastructure also poses an equity problem when coupled with housing affordability. Critical policy issues made on housing affordability and transportation will be decisive to the longer-term economic trajectory of the region.*
Diverse tenant base and solid supply-demand fundamentals The stable supply and demand fundamentals of the Los Angeles market puts it in a strong position to weather market uncertainty. As one of the top markets in U.S., Los Angeles has the largest warehouse inventory in the nation with 765 msf. With vacancy at under 3.0% since 2015, it has consistently been one of the tightest markets in the nation. The region’s diverse tenant base and land constraints for development create further market resiliency. No longer just port-driven— it’s also consumer-driven demand Although the ports are still very vital to the health of the market, eCommerce has been a powerful demand generator. COVID-19 accelerated the shift to eCommerce out of necessity and online ordering was up 14.8% in Q1 2020 and will likely show a bigger growth in Q2 2020. Industrial demand in the region will continue to be strong post-pandemic and we expect the logistics sector to continue to be one of the strongest sectors in commercial real estate. Location, location, location: huge consumer population Los Angeles County is home to more than 10 million residents and boasts a workforce of 5 million people. The region is a global gateway for trade and tourism and its position along the California coast combined with its diverse economy and temperate weather makes it a huge draw for companies.
L.A.’s large and diverse economy, coupled with the region’s limited supply of new product, will help the market weather the uncertainty due to COVID-19.
Although port volumes are at their lowest level since 2009, demand for industrial remained relatively healthy, fueled by
the continued growth of eCommerce.
Despite the economic havoc caused by COVID-19, industrial leasing activity has continued throughout the crisis, fueled by the continued growth of eCommerce. At mid-year 2020, Los Angeles’ year-to-date leasing was only down 1.2% from the same period last year with transactions over 100,000 sf accounting for 42.5% of the market’s activity. During the first six months of the year, seven new deals over 250,000 sf were transacted in 2020, compared to just one in 2019. The Los Angeles industrial market should come out of the pandemic quickly and is poised to continue the momentum it had built leading up to the pandemic.
Source: Cushman & Wakefield Research, Ports of Los Angeles & Long Beach. LA Economic Development Corporation, *LAEDC: Economic Outlook and Forecast, The U.S. Department of Commerce*Compares five years entering GFC (2003-2007) vs. COVID-19 (2015-2019)
SUPPLY & DEMAND Last 5 Years
169 177
3.0%
1.7%
0%
1%
2%
3%
4%
164
166
168
170
172
174
176
178
180
Financial Crisis COVID-19
Mill
ion
s (S
F)
New Leasing Total 5-Year Average Vacancy
GFC COVID-19
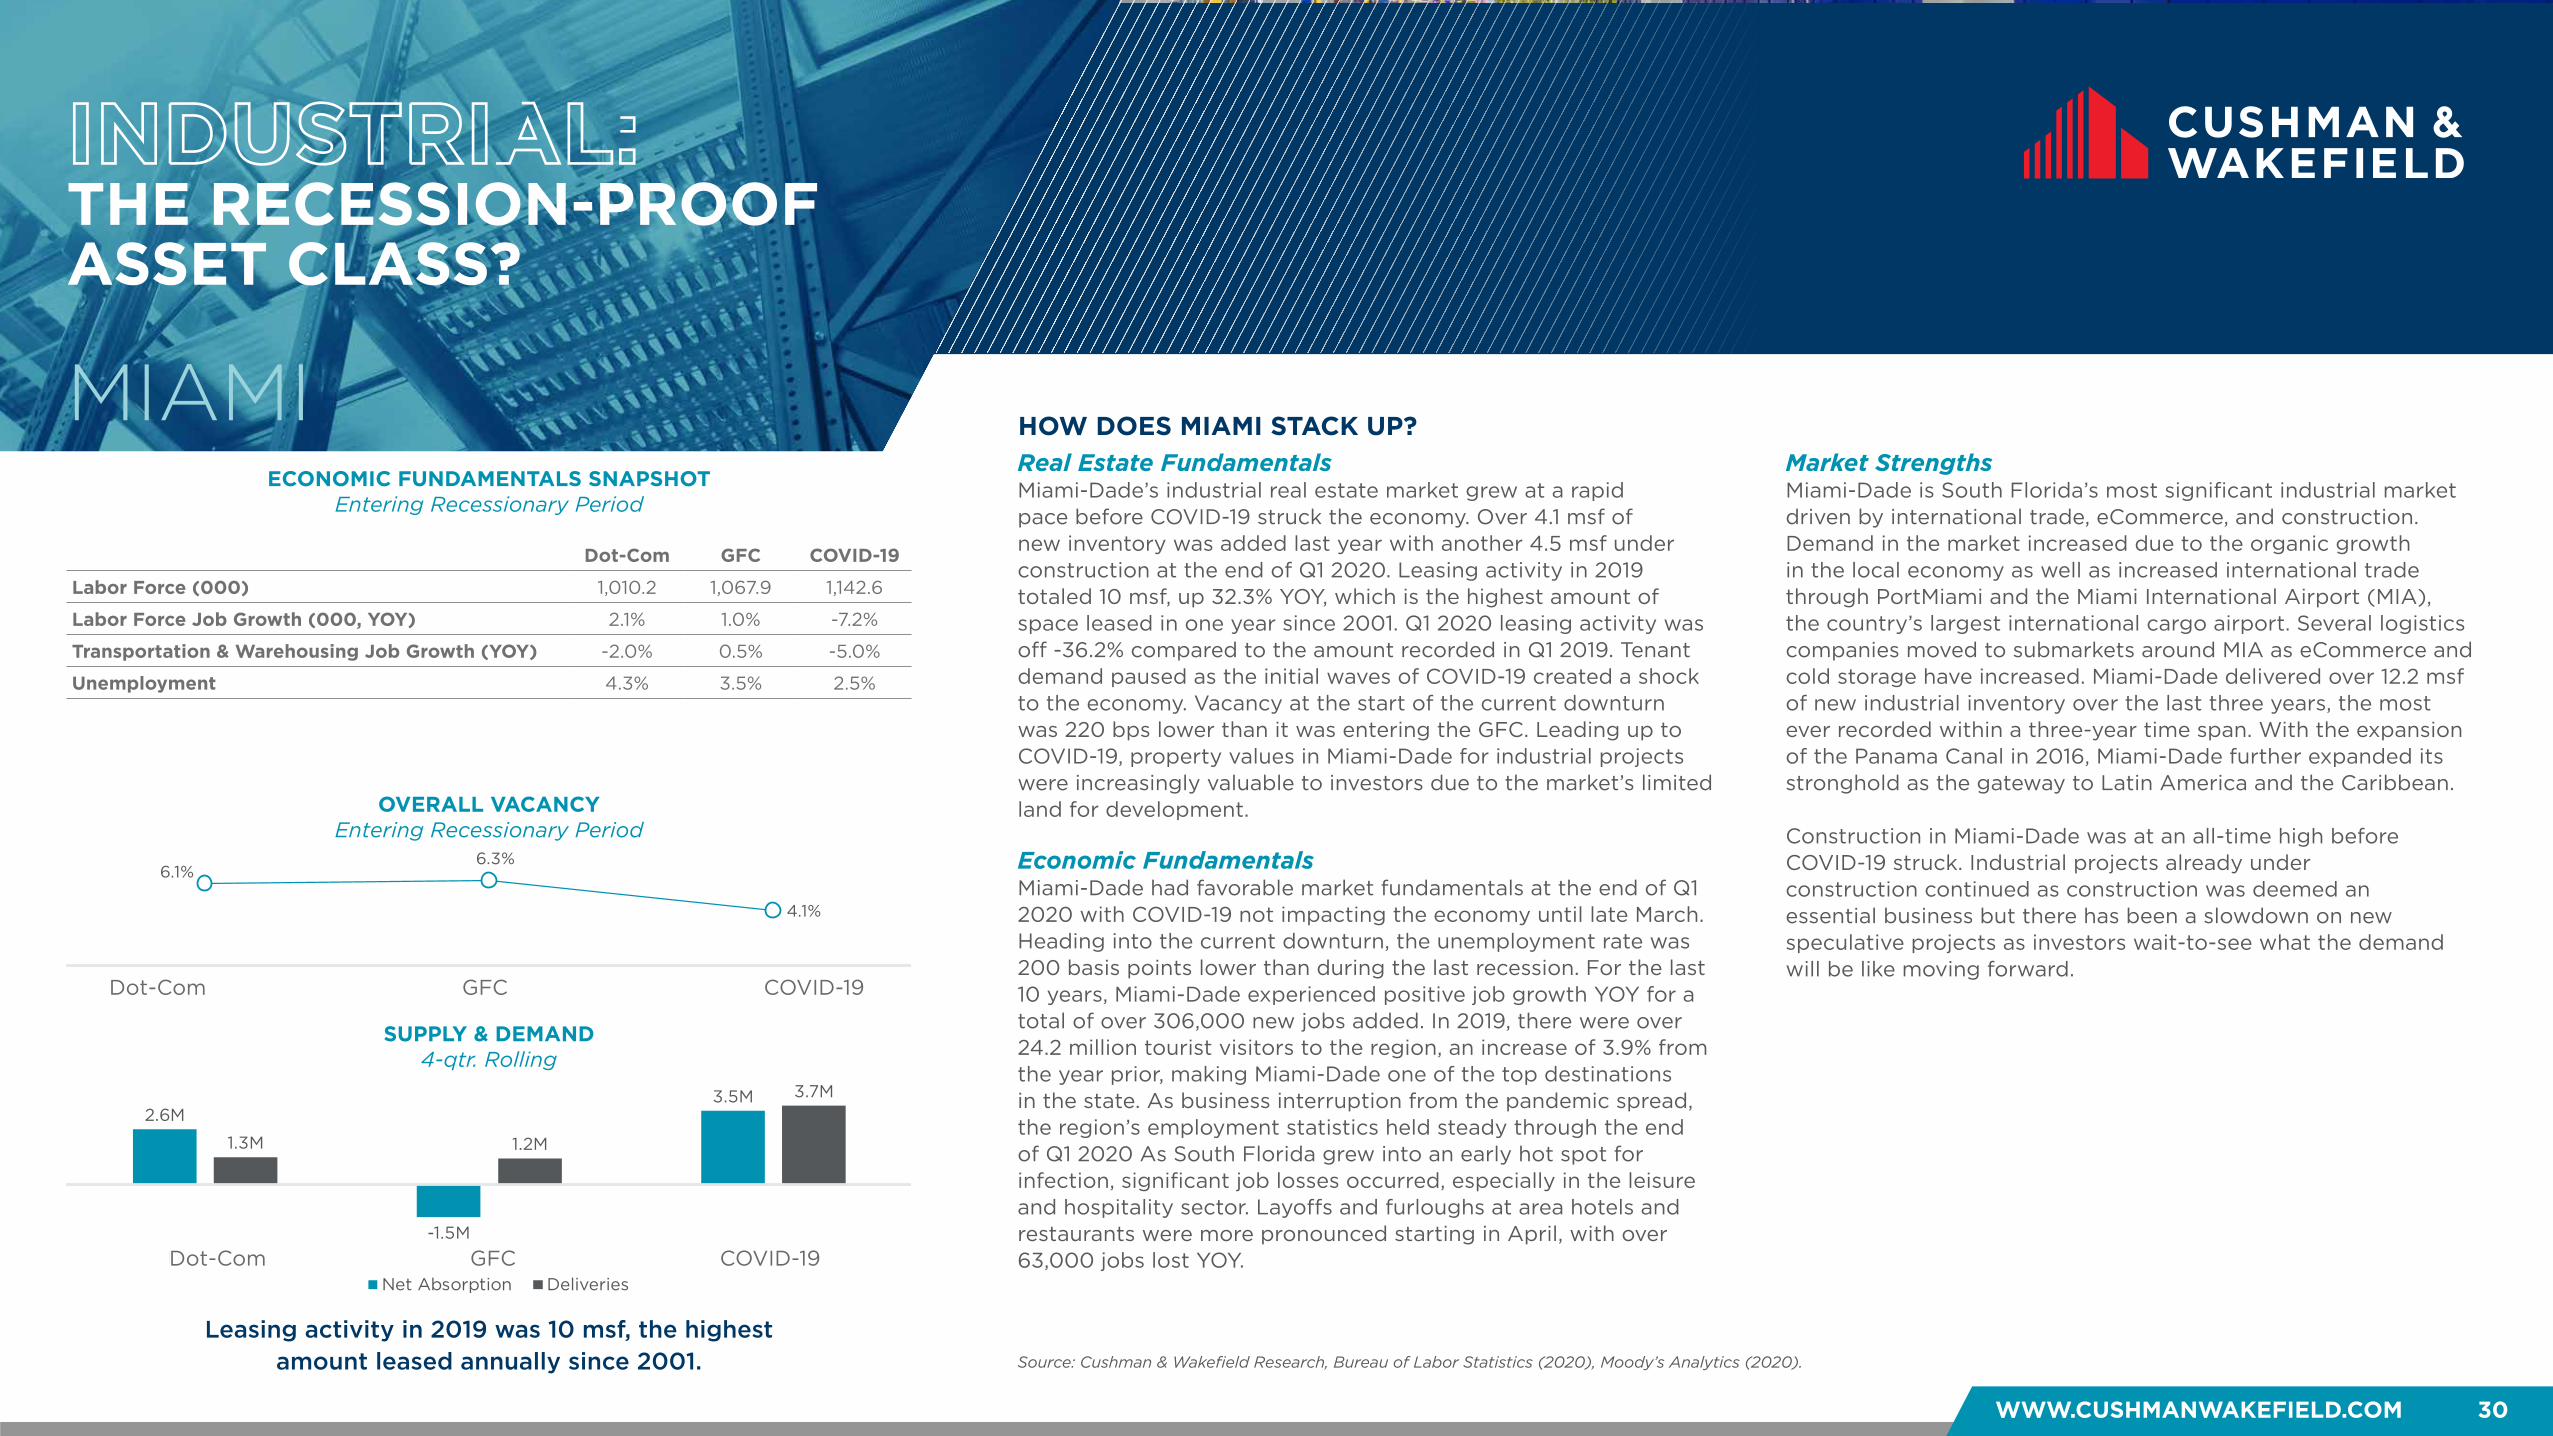
WWW.CUSHMANWAKEFIELD.COM 30
INDUSTRIAL: THE RECESSION-PROOF ASSET CLASS?
HOW DOES MIAMI STACK UP?MIAMI
Leasing activity in 2019 was 10 msf, the highest amount leased annually since 2001.
Real Estate FundamentalsMiami-Dade’s industrial real estate market grew at a rapid pace before COVID-19 struck the economy. Over 4.1 msf of new inventory was added last year with another 4.5 msf under construction at the end of Q1 2020. Leasing activity in 2019 totaled 10 msf, up 32.3% YOY, which is the highest amount of space leased in one year since 2001. Q1 2020 leasing activity was off -36.2% compared to the amount recorded in Q1 2019. Tenant demand paused as the initial waves of COVID-19 created a shock to the economy. Vacancy at the start of the current downturn was 220 bps lower than it was entering the GFC. Leading up to COVID-19, property values in Miami-Dade for industrial projects were increasingly valuable to investors due to the market’s limited land for development.
Economic FundamentalsMiami-Dade had favorable market fundamentals at the end of Q1 2020 with COVID-19 not impacting the economy until late March. Heading into the current downturn, the unemployment rate was 200 basis points lower than during the last recession. For the last 10 years, Miami-Dade experienced positive job growth YOY for a total of over 306,000 new jobs added. In 2019, there were over 24.2 million tourist visitors to the region, an increase of 3.9% from the year prior, making Miami-Dade one of the top destinations in the state. As business interruption from the pandemic spread, the region’s employment statistics held steady through the end of Q1 2020 As South Florida grew into an early hot spot for infection, significant job losses occurred, especially in the leisure and hospitality sector. Layoffs and furloughs at area hotels and restaurants were more pronounced starting in April, with over 63,000 jobs lost YOY.
Market StrengthsMiami-Dade is South Florida’s most significant industrial market driven by international trade, eCommerce, and construction. Demand in the market increased due to the organic growth in the local economy as well as increased international trade through PortMiami and the Miami International Airport (MIA), the country’s largest international cargo airport. Several logistics companies moved to submarkets around MIA as eCommerce and cold storage have increased. Miami-Dade delivered over 12.2 msf of new industrial inventory over the last three years, the most ever recorded within a three-year time span. With the expansion of the Panama Canal in 2016, Miami-Dade further expanded its stronghold as the gateway to Latin America and the Caribbean. Construction in Miami-Dade was at an all-time high before COVID-19 struck. Industrial projects already under construction continued as construction was deemed an essential business but there has been a slowdown on new speculative projects as investors wait-to-see what the demand will be like moving forward.
Source: Cushman & Wakefield Research, Bureau of Labor Statistics (2020), Moody’s Analytics (2020).
OVERALL VACANCYEntering Recessionary Period
SUPPLY & DEMAND 4-qtr. Rolling
ECONOMIC FUNDAMENTALS SNAPSHOTEntering Recessionary Period
Dot-Com GFC COVID-19
Labor Force (000) 1,010.2 1,067.9 1,142.6
Labor Force Job Growth (000, YOY) 2.1% 1.0% -7.2%
Transportation & Warehousing Job Growth (YOY) -2.0% 0.5% -5.0%
Unemployment 4.3% 3.5% 2.5%
6.1%6.3%
4.1%
Dot Com Financial Crisis COVID-19
2.6M
-1.5M
3.5M
1.3M 1.2M
3.7M
Dot Com Financial Crisis COVID-19
Net Absorption Deliveries
Dot-Com GFC COVID-19
Dot-Com GFC COVID-19
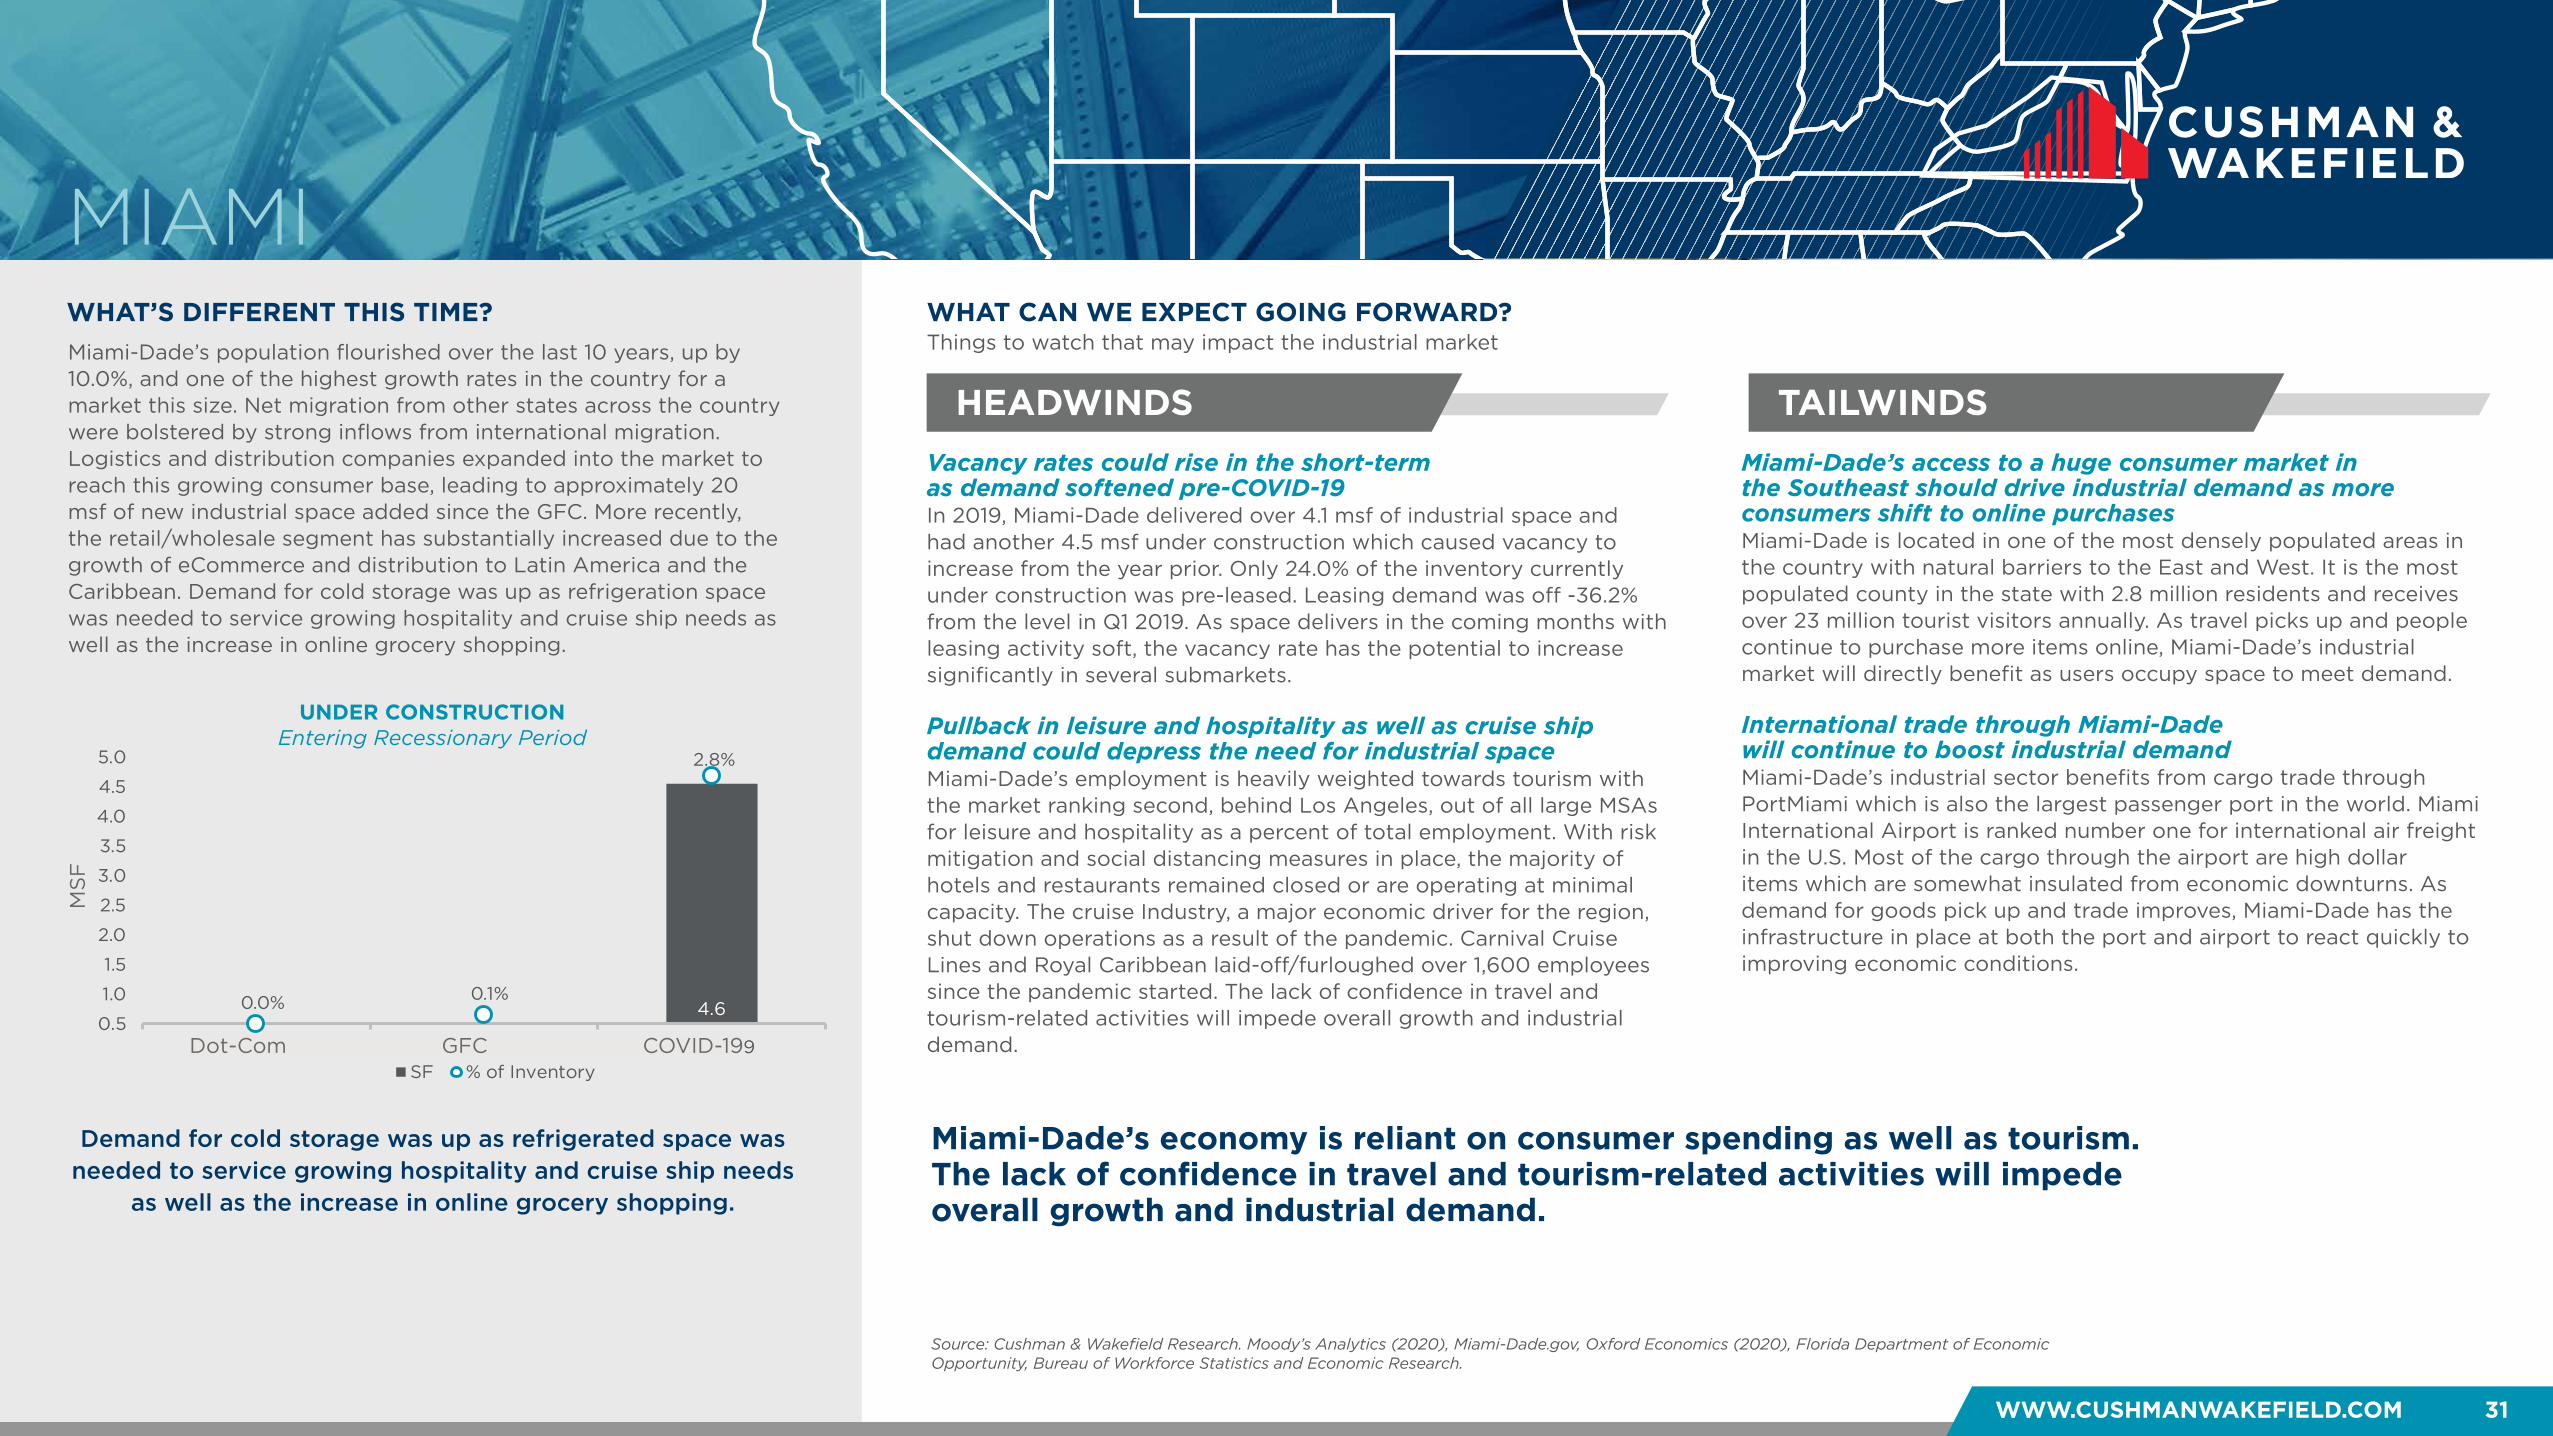
WHAT’S DIFFERENT THIS TIME?
HEADWINDS TAILWINDS
WHAT CAN WE EXPECT GOING FORWARD?
WWW.CUSHMANWAKEFIELD.COM 31
Things to watch that may impact the industrial market
MIAMI
Miami-Dade’s economy is reliant on consumer spending as well as tourism. The lack of confidence in travel and tourism-related activities will impede overall growth and industrial demand.
Vacancy rates could rise in the short-term as demand softened pre-COVID-19 In 2019, Miami-Dade delivered over 4.1 msf of industrial space and had another 4.5 msf under construction which caused vacancy to increase from the year prior. Only 24.0% of the inventory currently under construction was pre-leased. Leasing demand was off -36.2% from the level in Q1 2019. As space delivers in the coming months with leasing activity soft, the vacancy rate has the potential to increase significantly in several submarkets. Pullback in leisure and hospitality as well as cruise ship demand could depress the need for industrial space Miami-Dade’s employment is heavily weighted towards tourism with the market ranking second, behind Los Angeles, out of all large MSAs for leisure and hospitality as a percent of total employment. With risk mitigation and social distancing measures in place, the majority of hotels and restaurants remained closed or are operating at minimal capacity. The cruise Industry, a major economic driver for the region, shut down operations as a result of the pandemic. Carnival Cruise Lines and Royal Caribbean laid-off/furloughed over 1,600 employees since the pandemic started. The lack of confidence in travel and tourism-related activities will impede overall growth and industrial demand.
Miami-Dade’s access to a huge consumer market in the Southeast should drive industrial demand as more consumers shift to online purchases Miami-Dade is located in one of the most densely populated areas in the country with natural barriers to the East and West. It is the most populated county in the state with 2.8 million residents and receives over 23 million tourist visitors annually. As travel picks up and people continue to purchase more items online, Miami-Dade’s industrial market will directly benefit as users occupy space to meet demand. International trade through Miami-Dade will continue to boost industrial demand Miami-Dade’s industrial sector benefits from cargo trade through PortMiami which is also the largest passenger port in the world. Miami International Airport is ranked number one for international air freight in the U.S. Most of the cargo through the airport are high dollar items which are somewhat insulated from economic downturns. As demand for goods pick up and trade improves, Miami-Dade has the infrastructure in place at both the port and airport to react quickly to improving economic conditions.
Demand for cold storage was up as refrigerated space was needed to service growing hospitality and cruise ship needs
as well as the increase in online grocery shopping.
Miami-Dade’s population flourished over the last 10 years, up by 10.0%, and one of the highest growth rates in the country for a market this size. Net migration from other states across the country were bolstered by strong inflows from international migration. Logistics and distribution companies expanded into the market to reach this growing consumer base, leading to approximately 20 msf of new industrial space added since the GFC. More recently, the retail/wholesale segment has substantially increased due to the growth of eCommerce and distribution to Latin America and the Caribbean. Demand for cold storage was up as refrigeration space was needed to service growing hospitality and cruise ship needs as well as the increase in online grocery shopping.
Source: Cushman & Wakefield Research. Moody’s Analytics (2020), Miami-Dade.gov, Oxford Economics (2020), Florida Department of Economic Opportunity, Bureau of Workforce Statistics and Economic Research.
UNDER CONSTRUCTION Entering Recessionary Period
4.60.0% 0.1%
2.8%
0.0%
0.5%
1.0%
1.5%
2.0%
2.5%
3.0%
0.5
1.0
1.5
2.0
2.5
3.0
3.5
4.0
4.5
5.0
Dot Com Financial Crisis COVID-19
Mill
ion
s
SF % of InventoryDot-Com GFC COVID-19
MS
F
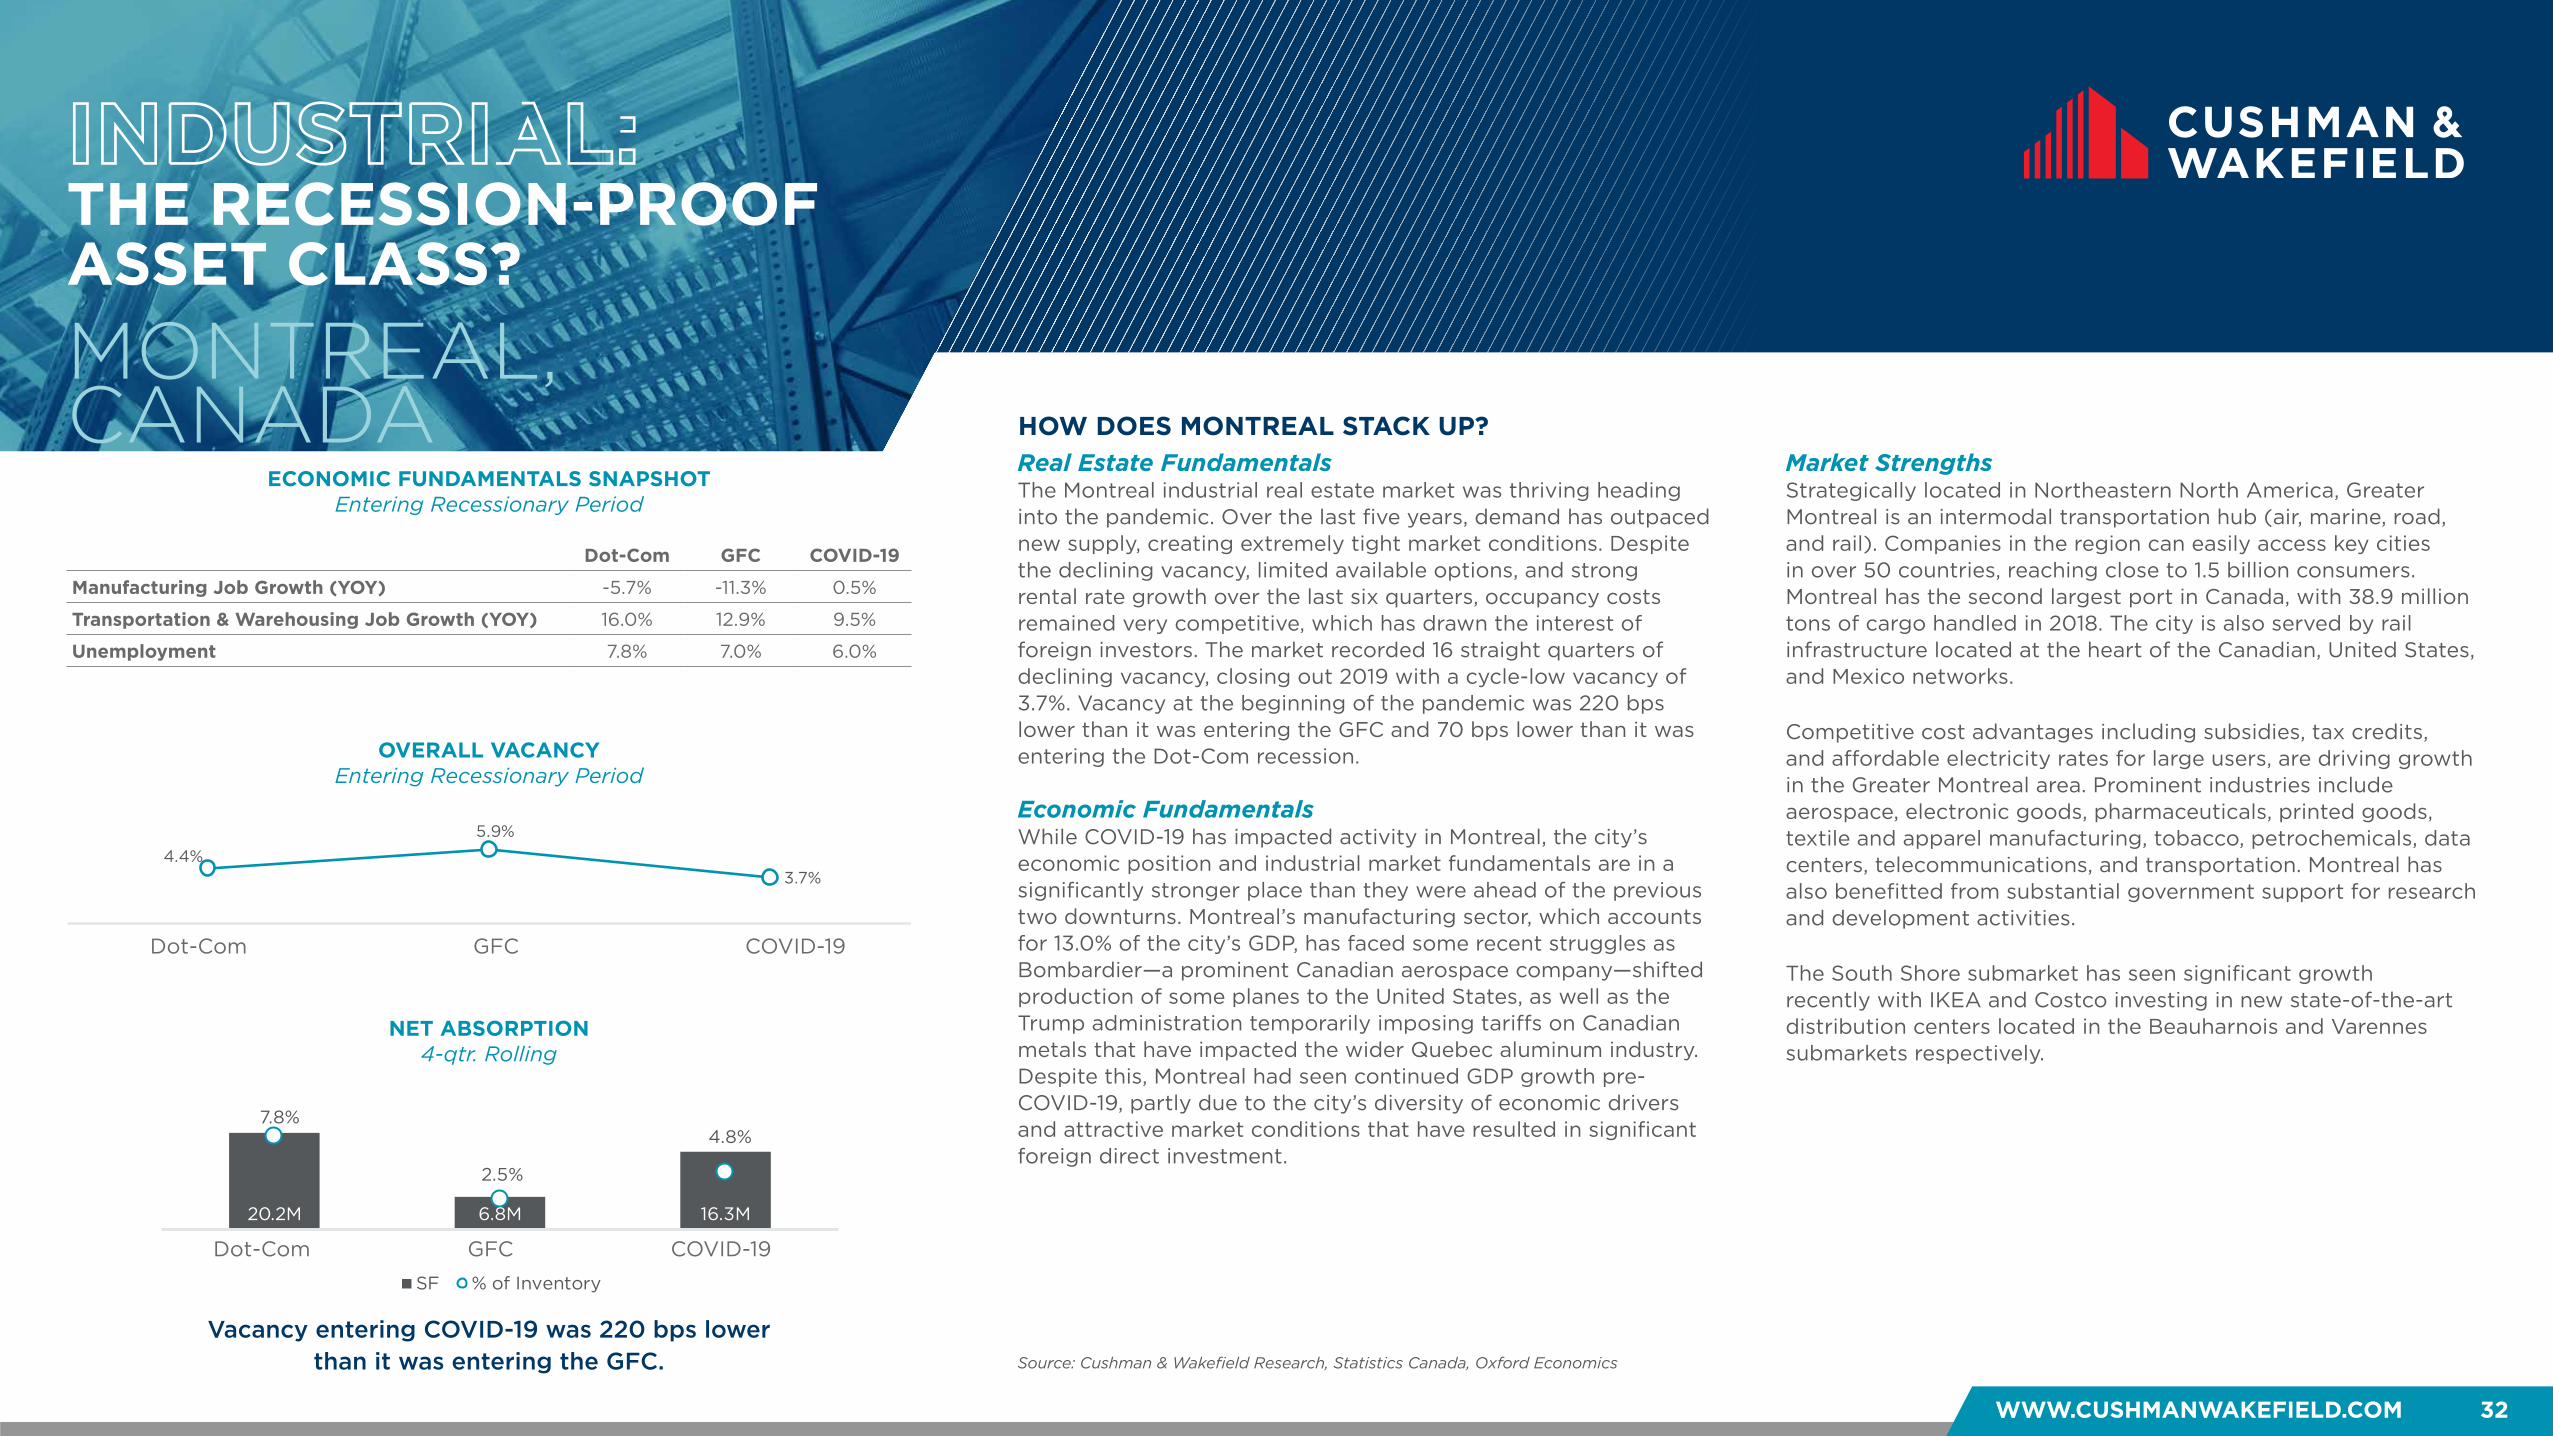
WWW.CUSHMANWAKEFIELD.COM 32
INDUSTRIAL: THE RECESSION-PROOF ASSET CLASS?
HOW DOES MONTREAL STACK UP?
MONTREAL, CANADA
Dot-Com GFC COVID-19
Manufacturing Job Growth (YOY) -5.7% -11.3% 0.5%
Transportation & Warehousing Job Growth (YOY) 16.0% 12.9% 9.5%
Unemployment 7.8% 7.0% 6.0%
Vacancy entering COVID-19 was 220 bps lower than it was entering the GFC.
Real Estate FundamentalsThe Montreal industrial real estate market was thriving heading into the pandemic. Over the last five years, demand has outpaced new supply, creating extremely tight market conditions. Despite the declining vacancy, limited available options, and strong rental rate growth over the last six quarters, occupancy costs remained very competitive, which has drawn the interest of foreign investors. The market recorded 16 straight quarters of declining vacancy, closing out 2019 with a cycle-low vacancy of 3.7%. Vacancy at the beginning of the pandemic was 220 bps lower than it was entering the GFC and 70 bps lower than it was entering the Dot-Com recession.
Economic FundamentalsWhile COVID-19 has impacted activity in Montreal, the city’s economic position and industrial market fundamentals are in a significantly stronger place than they were ahead of the previous two downturns. Montreal’s manufacturing sector, which accounts for 13.0% of the city’s GDP, has faced some recent struggles as Bombardier—a prominent Canadian aerospace company—shifted production of some planes to the United States, as well as the Trump administration temporarily imposing tariffs on Canadian metals that have impacted the wider Quebec aluminum industry. Despite this, Montreal had seen continued GDP growth pre-COVID-19, partly due to the city’s diversity of economic drivers and attractive market conditions that have resulted in significant foreign direct investment.
Market StrengthsStrategically located in Northeastern North America, Greater Montreal is an intermodal transportation hub (air, marine, road, and rail). Companies in the region can easily access key cities in over 50 countries, reaching close to 1.5 billion consumers. Montreal has the second largest port in Canada, with 38.9 million tons of cargo handled in 2018. The city is also served by rail infrastructure located at the heart of the Canadian, United States, and Mexico networks. Competitive cost advantages including subsidies, tax credits, and affordable electricity rates for large users, are driving growth in the Greater Montreal area. Prominent industries include aerospace, electronic goods, pharmaceuticals, printed goods, textile and apparel manufacturing, tobacco, petrochemicals, data centers, telecommunications, and transportation. Montreal has also benefitted from substantial government support for research and development activities. The South Shore submarket has seen significant growth recently with IKEA and Costco investing in new state-of-the-art distribution centers located in the Beauharnois and Varennes submarkets respectively.
Source: Cushman & Wakefield Research, Statistics Canada, Oxford Economics
OVERALL VACANCYEntering Recessionary Period
NET ABSORPTION 4-qtr. Rolling
ECONOMIC FUNDAMENTALS SNAPSHOTEntering Recessionary Period
4.4%5.9%
3.7%
Dot Com Financial Crisis COVID-19
20.2M 6.8M 16.3M
7.8%
2.5%
4.8%
00.020.040.060.080.1
M5 M
10 M15 M
20 M25 M
Dot Com Financial Crisis COVID-19
SF % of Inventory
Dot-Com GFC COVID-19
Dot-Com GFC COVID-19
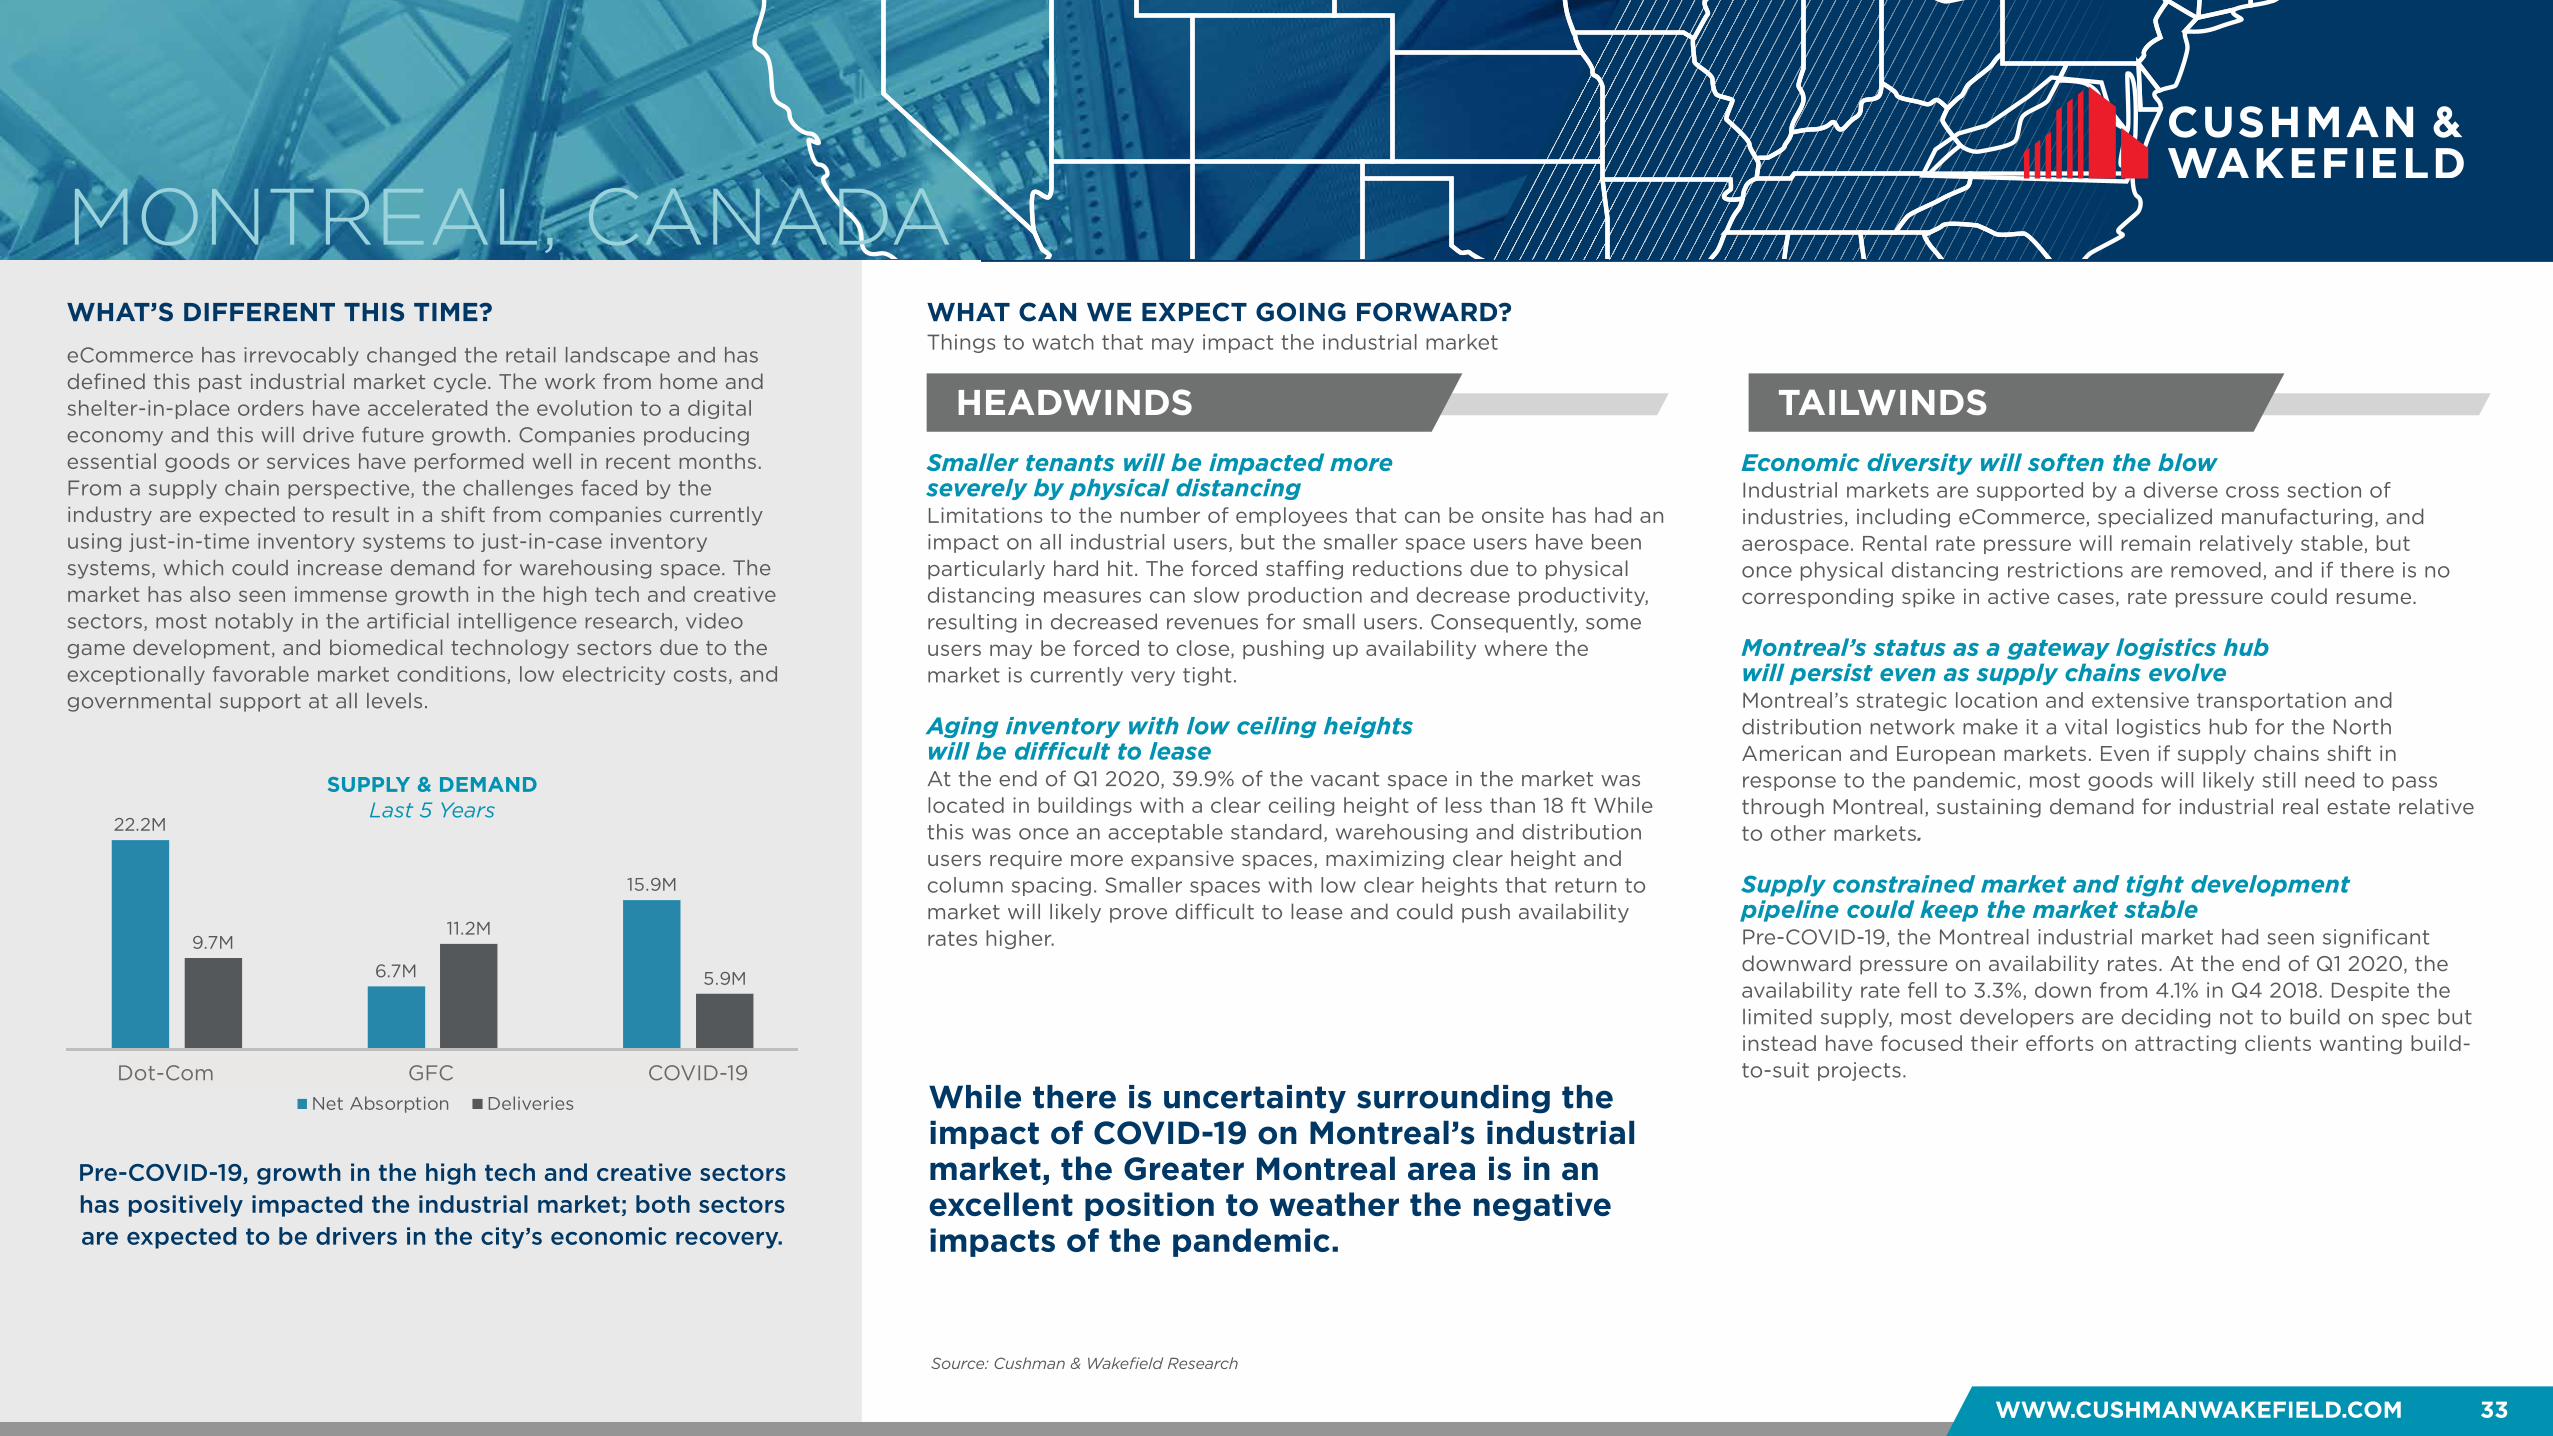
WHAT’S DIFFERENT THIS TIME?
HEADWINDS TAILWINDS
WHAT CAN WE EXPECT GOING FORWARD?
WWW.CUSHMANWAKEFIELD.COM 33
Things to watch that may impact the industrial market
MONTREAL, CANADA
While there is uncertainty surrounding the impact of COVID-19 on Montreal’s industrial market, the Greater Montreal area is in an excellent position to weather the negative impacts of the pandemic.
Smaller tenants will be impacted more severely by physical distancing Limitations to the number of employees that can be onsite has had an impact on all industrial users, but the smaller space users have been particularly hard hit. The forced staffing reductions due to physical distancing measures can slow production and decrease productivity, resulting in decreased revenues for small users. Consequently, some users may be forced to close, pushing up availability where the market is currently very tight. Aging inventory with low ceiling heights will be difficult to lease At the end of Q1 2020, 39.9% of the vacant space in the market was located in buildings with a clear ceiling height of less than 18 ft While this was once an acceptable standard, warehousing and distribution users require more expansive spaces, maximizing clear height and column spacing. Smaller spaces with low clear heights that return to market will likely prove difficult to lease and could push availability rates higher.
Economic diversity will soften the blow Industrial markets are supported by a diverse cross section of industries, including eCommerce, specialized manufacturing, and aerospace. Rental rate pressure will remain relatively stable, but once physical distancing restrictions are removed, and if there is no corresponding spike in active cases, rate pressure could resume. Montreal’s status as a gateway logistics hub will persist even as supply chains evolve Montreal’s strategic location and extensive transportation and distribution network make it a vital logistics hub for the North American and European markets. Even if supply chains shift in response to the pandemic, most goods will likely still need to pass through Montreal, sustaining demand for industrial real estate relative to other markets. Supply constrained market and tight development pipeline could keep the market stable Pre-COVID-19, the Montreal industrial market had seen significant downward pressure on availability rates. At the end of Q1 2020, the availability rate fell to 3.3%, down from 4.1% in Q4 2018. Despite the limited supply, most developers are deciding not to build on spec but instead have focused their efforts on attracting clients wanting build-to-suit projects.
Pre-COVID-19, growth in the high tech and creative sectors has positively impacted the industrial market; both sectors are expected to be drivers in the city’s economic recovery.
eCommerce has irrevocably changed the retail landscape and has defined this past industrial market cycle. The work from home and shelter-in-place orders have accelerated the evolution to a digital economy and this will drive future growth. Companies producing essential goods or services have performed well in recent months. From a supply chain perspective, the challenges faced by the industry are expected to result in a shift from companies currently using just-in-time inventory systems to just-in-case inventory systems, which could increase demand for warehousing space. The market has also seen immense growth in the high tech and creative sectors, most notably in the artificial intelligence research, video game development, and biomedical technology sectors due to the exceptionally favorable market conditions, low electricity costs, and governmental support at all levels.
Source: Cushman & Wakefield Research
SUPPLY & DEMAND Last 5 Years
22.2M
6.7M
15.9M
9.7M11.2M
5.9M
Dot Com Financial Crisis COVID-19
Net Absorption Deliveries
Dot-Com GFC COVID-19

WWW.CUSHMANWAKEFIELD.COM 34
INDUSTRIAL: THE RECESSION-PROOF ASSET CLASS?
HOW DOES NASHVILLE STACK UP?NASHVILLE
Vacancy entering COVID-19 was 270 bps lower than it was entering the GFC.
Real Estate FundamentalsNashville’s industrial market position has grown in size, number of occupiers, and investment activity since the previous two downturns. In 2019, Nashville set records with over 8 msf of new leasing activity and 8.7 msf of positive absorption. Demand, which was primarily driven by distribution and eCommerce tenants, remained consistent and active through Q1 2020. More than 1.8 msf of leasing activity was recorded in Q1 2020 a 35.0% increase from Q1 2019. More than 7.7 msf were under construction during Q1 2020, a 92.0% increase from the quarter leading into the GFC. While new supply reached over 7.5 msf in 2019, the market was not at risk for becoming oversupplied. In fact, industrial vacancy dipped to a market low of 2.5% in Q1 2020, putting Nashville in a very strong position compared to previous downturns.
Economic FundamentalsSince the GFC, Nashville’s economy has gained tremendous momentum with job growth, company relocations, development, and international attraction. With an average of 83 people moving to Nashville per day, Music City boasted one of the lowest unemployment rates in the country at 2.1%. Known for its diverse and strong economy, both Trade and Transportation and Manufacturing job growth in Nashville are in a significantly better position compared to the Dot-Com and GFC downturns with 0.4% and 4.6% YOY growth.
Market StrengthsNashville’s location and expansive modes of transportation allow manufacturing, distribution, and logistics companies to reach U.S. and international locations with ease and affordability. Tennessee shares a border with eight different states, providing connectivity to the Southeast region and beyond. Nashville is one of only six U.S. cities at the convergence of three major interstate highways—I-40, I-65, and I-24 and the city’s highway systems in Tennessee are rated among the nation’s best, offering exceptional connections for freight and commuting. Furthermore, Middle Tennessee is within 250 miles of one-third of all car and truck assembly in the U.S., offering an ideal location for vehicle shipment. Unmatched access to North American markets delivers bottom-line advantage in overall freight costs. The Nashville industrial market continues to grow at a rapid pace with over 20 msf being delivered within the last four years and vacancy dropping to a record low of 2.5%. With strong growth in eCommerce, manufacturing, and distribution, demand still outpaces supply with high leasing activity, strong absorption, and record-breaking vacancy in Q1 2020.
Source: Cushman & Wakefield Research, Nashville Chamber of Commerce (2019)
OVERALL VACANCYEntering Recessionary Period
UNDER CONSTRUCTION Entering Recessionary Period
ECONOMIC FUNDAMENTALS SNAPSHOTEntering Recessionary Period
4.0%
5.2%
2.5%
Dot Com Financial Crisis COVID-19
Dot-com GFC COVID-19
Manufacturing Job Growth (YOY) -4.6% -13.2% 0.4%
Transportation & Warehousing Job Growth (YOY) 1.5% 1.1% 4.6%
Unemployment 3.3% 4.7% 2.1%
3.8M 4.0M 7.7M
2.3% 2.2%
3.6%
0
0.01
0.02
0.03
0.04
500,000
2,500,000
4,500,000
6,500,000
8,500,000
Dot Com Financial Crisis COVID-19
SF % of Inventory
Dot-Com GFC COVID-19
Dot-Com GFC COVID-19
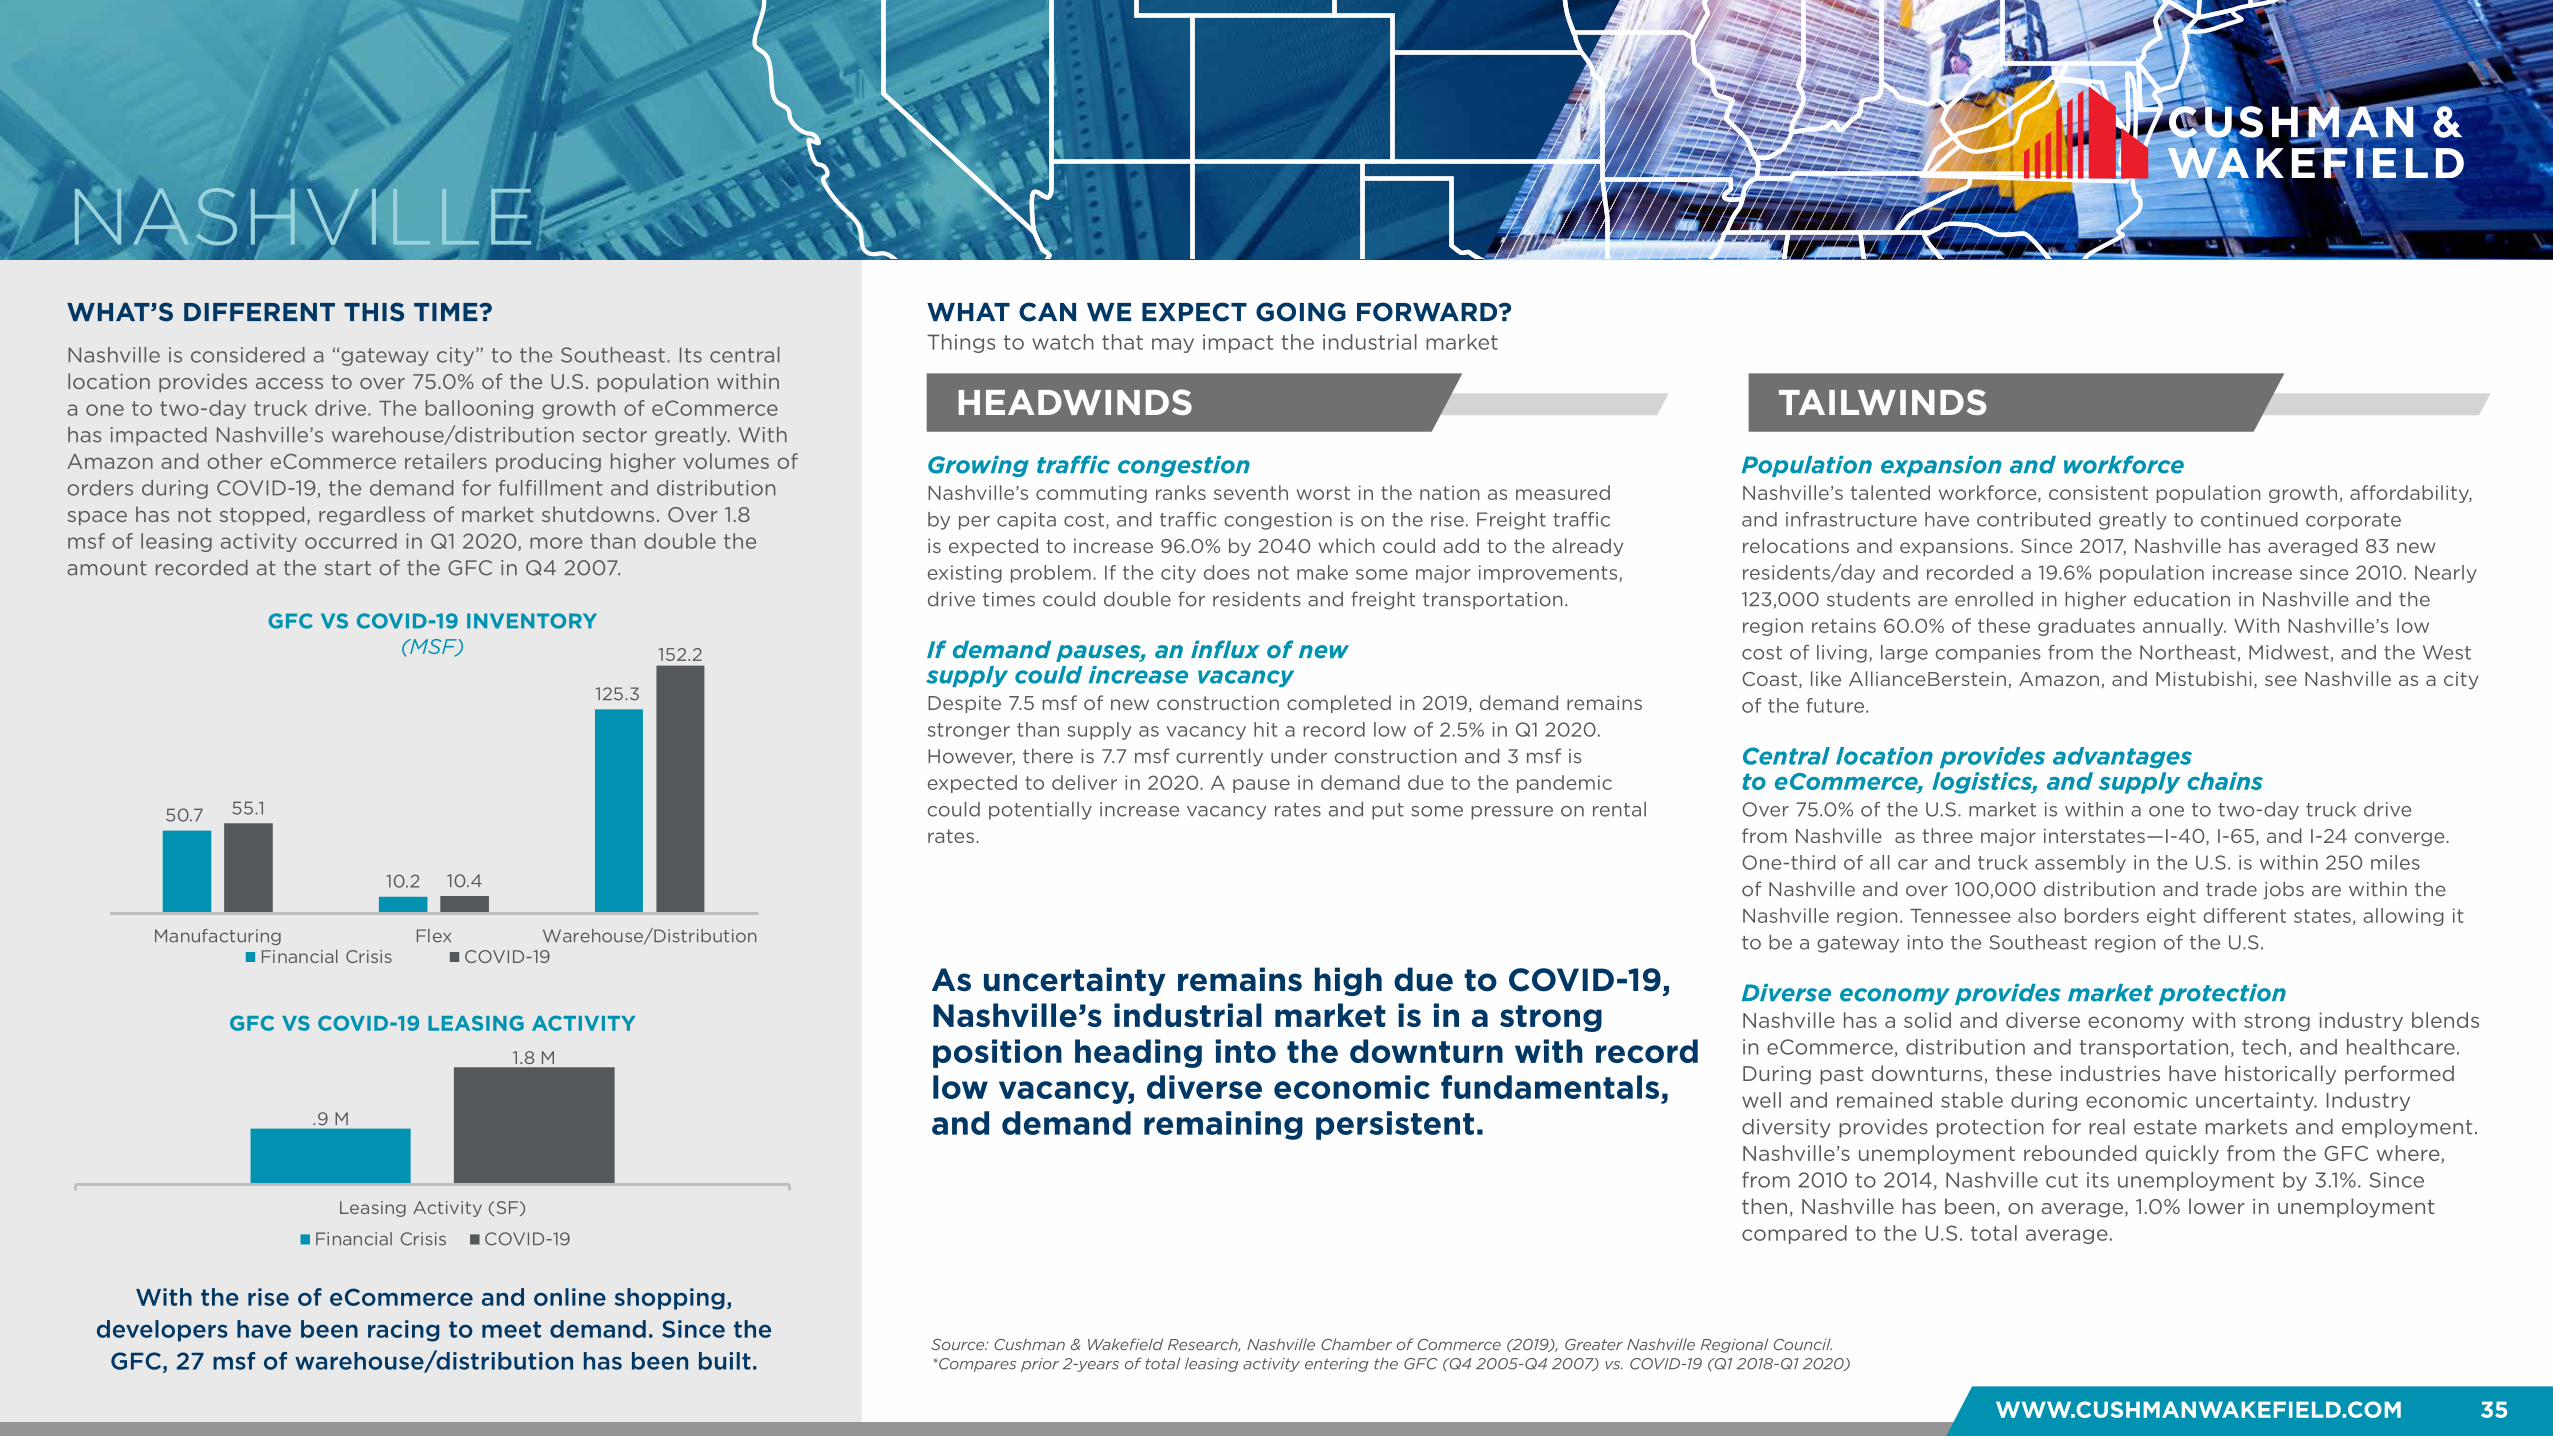
WHAT’S DIFFERENT THIS TIME?
HEADWINDS TAILWINDS
WHAT CAN WE EXPECT GOING FORWARD?
WWW.CUSHMANWAKEFIELD.COM 35
Things to watch that may impact the industrial market
NASHVILLE
As uncertainty remains high due to COVID-19, Nashville’s industrial market is in a strong position heading into the downturn with record low vacancy, diverse economic fundamentals, and demand remaining persistent.
Growing traffic congestion Nashville’s commuting ranks seventh worst in the nation as measured by per capita cost, and traffic congestion is on the rise. Freight traffic is expected to increase 96.0% by 2040 which could add to the already existing problem. If the city does not make some major improvements, drive times could double for residents and freight transportation. If demand pauses, an influx of new supply could increase vacancy Despite 7.5 msf of new construction completed in 2019, demand remains stronger than supply as vacancy hit a record low of 2.5% in Q1 2020. However, there is 7.7 msf currently under construction and 3 msf is expected to deliver in 2020. A pause in demand due to the pandemic could potentially increase vacancy rates and put some pressure on rental rates.
Population expansion and workforce Nashville’s talented workforce, consistent population growth, affordability, and infrastructure have contributed greatly to continued corporate relocations and expansions. Since 2017, Nashville has averaged 83 new residents/day and recorded a 19.6% population increase since 2010. Nearly 123,000 students are enrolled in higher education in Nashville and the region retains 60.0% of these graduates annually. With Nashville’s low cost of living, large companies from the Northeast, Midwest, and the West Coast, like AllianceBerstein, Amazon, and Mistubishi, see Nashville as a city of the future.
Central location provides advantages to eCommerce, logistics, and supply chains Over 75.0% of the U.S. market is within a one to two-day truck drive from Nashville as three major interstates—I-40, I-65, and I-24 converge. One-third of all car and truck assembly in the U.S. is within 250 miles of Nashville and over 100,000 distribution and trade jobs are within the Nashville region. Tennessee also borders eight different states, allowing it to be a gateway into the Southeast region of the U.S. Diverse economy provides market protection Nashville has a solid and diverse economy with strong industry blends in eCommerce, distribution and transportation, tech, and healthcare. During past downturns, these industries have historically performed well and remained stable during economic uncertainty. Industry diversity provides protection for real estate markets and employment. Nashville’s unemployment rebounded quickly from the GFC where, from 2010 to 2014, Nashville cut its unemployment by 3.1%. Since then, Nashville has been, on average, 1.0% lower in unemployment compared to the U.S. total average.
With the rise of eCommerce and online shopping, developers have been racing to meet demand. Since the GFC, 27 msf of warehouse/distribution has been built.
Nashville is considered a “gateway city” to the Southeast. Its central location provides access to over 75.0% of the U.S. population within a one to two-day truck drive. The ballooning growth of eCommerce has impacted Nashville’s warehouse/distribution sector greatly. With Amazon and other eCommerce retailers producing higher volumes of orders during COVID-19, the demand for fulfillment and distribution space has not stopped, regardless of market shutdowns. Over 1.8 msf of leasing activity occurred in Q1 2020, more than double the amount recorded at the start of the GFC in Q4 2007.
Source: Cushman & Wakefield Research, Nashville Chamber of Commerce (2019), Greater Nashville Regional Council. *Compares prior 2-years of total leasing activity entering the GFC (Q4 2005-Q4 2007) vs. COVID-19 (Q1 2018-Q1 2020)
GFC VS COVID-19 LEASING ACTIVITY
.9 M
1.8 M
Leasing Activity (SF)
Financial Crisis COVID-19
50.7
10.2
125.3
55.1
10.4
152.2
0.0
20.0
40.0
60.0
80.0
100.0
120.0
140.0
160.0
Manufacturing Flex Warehouse/DistributionFinancial Crisis COVID-19
GFC VS COVID-19 INVENTORY (MSF)
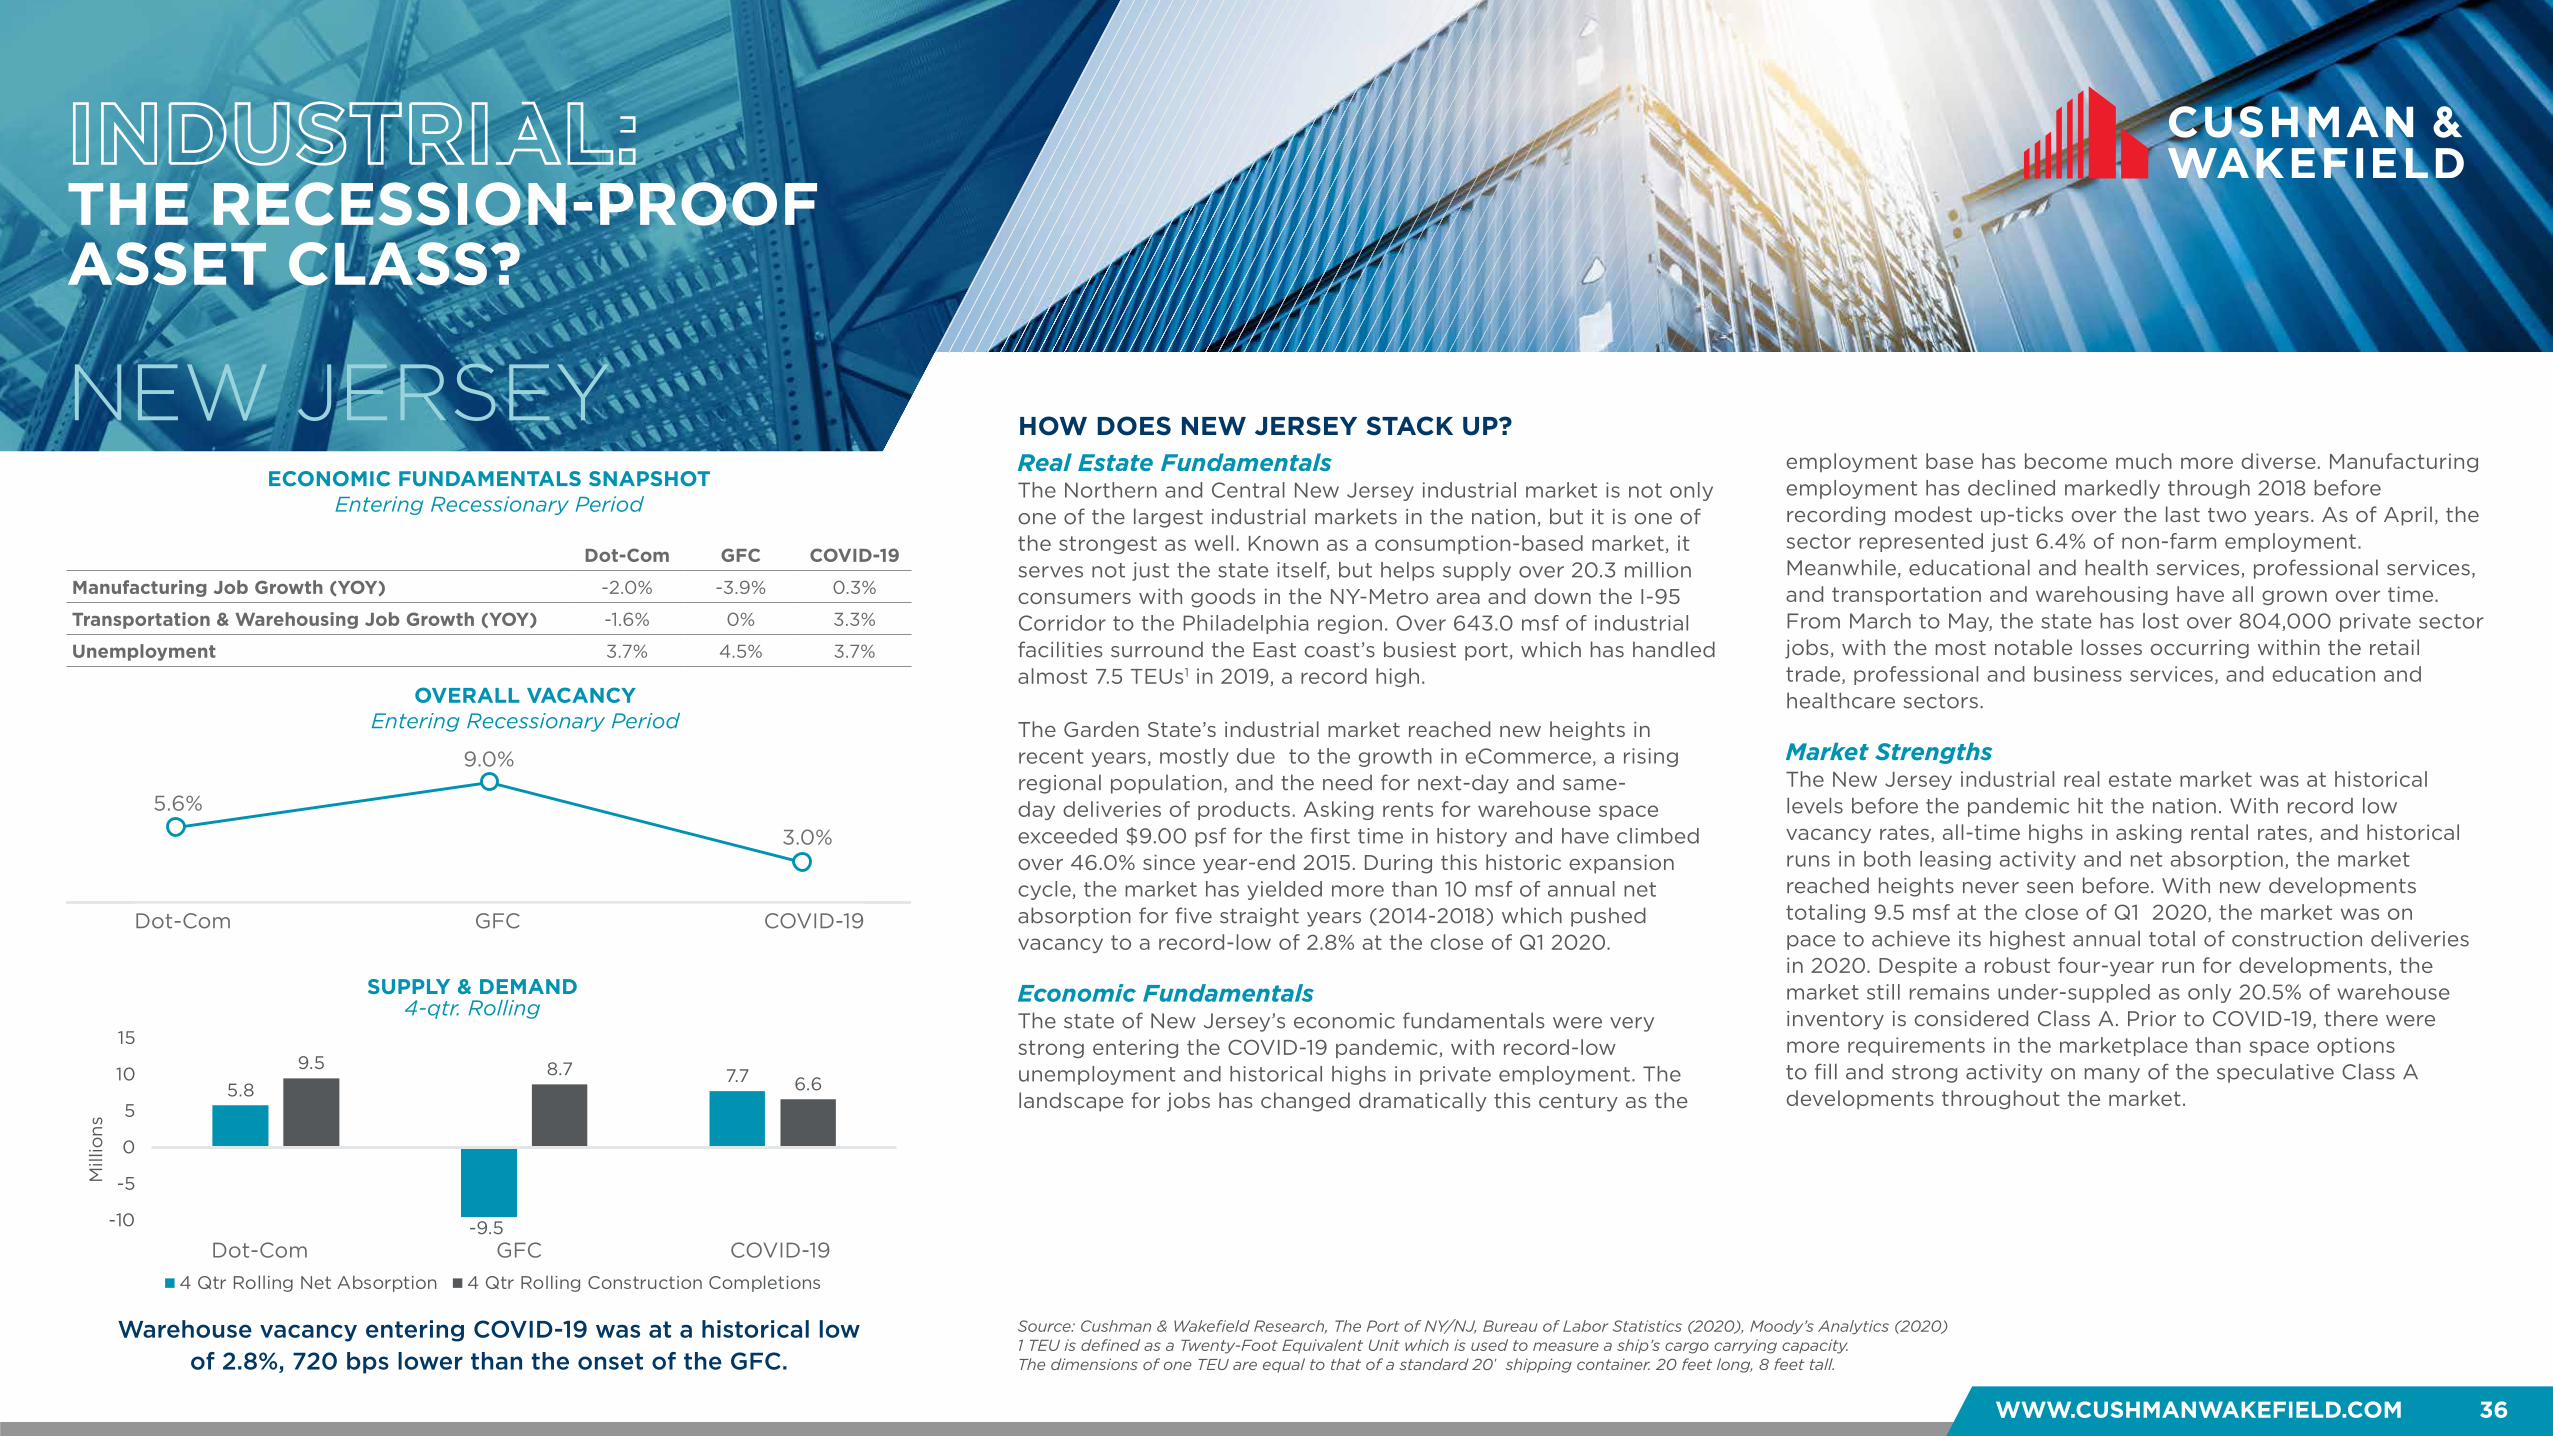
WWW.CUSHMANWAKEFIELD.COM 36
INDUSTRIAL: THE RECESSION-PROOF ASSET CLASS?
HOW DOES NEW JERSEY STACK UP?NEW JERSEY
Warehouse vacancy entering COVID-19 was at a historical low of 2.8%, 720 bps lower than the onset of the GFC.
Real Estate FundamentalsThe Northern and Central New Jersey industrial market is not only one of the largest industrial markets in the nation, but it is one of the strongest as well. Known as a consumption-based market, it serves not just the state itself, but helps supply over 20.3 million consumers with goods in the NY-Metro area and down the I-95 Corridor to the Philadelphia region. Over 643.0 msf of industrial facilities surround the East coast’s busiest port, which has handled almost 7.5 TEUs1 in 2019, a record high.
The Garden State’s industrial market reached new heights in recent years, mostly due to the growth in eCommerce, a rising regional population, and the need for next-day and same-day deliveries of products. Asking rents for warehouse space exceeded $9.00 psf for the first time in history and have climbed over 46.0% since year-end 2015. During this historic expansion cycle, the market has yielded more than 10 msf of annual net absorption for five straight years (2014-2018) which pushed vacancy to a record-low of 2.8% at the close of Q1 2020.
Economic FundamentalsThe state of New Jersey’s economic fundamentals were very strong entering the COVID-19 pandemic, with record-low unemployment and historical highs in private employment. The landscape for jobs has changed dramatically this century as the
employment base has become much more diverse. Manufacturing employment has declined markedly through 2018 before recording modest up-ticks over the last two years. As of April, the sector represented just 6.4% of non-farm employment. Meanwhile, educational and health services, professional services, and transportation and warehousing have all grown over time. From March to May, the state has lost over 804,000 private sector jobs, with the most notable losses occurring within the retail trade, professional and business services, and education and healthcare sectors.
Market StrengthsThe New Jersey industrial real estate market was at historical levels before the pandemic hit the nation. With record low vacancy rates, all-time highs in asking rental rates, and historical runs in both leasing activity and net absorption, the market reached heights never seen before. With new developments totaling 9.5 msf at the close of Q1 2020, the market was on pace to achieve its highest annual total of construction deliveries in 2020. Despite a robust four-year run for developments, the market still remains under-suppled as only 20.5% of warehouse inventory is considered Class A. Prior to COVID-19, there were more requirements in the marketplace than space options to fill and strong activity on many of the speculative Class A developments throughout the market.
Source: Cushman & Wakefield Research, The Port of NY/NJ, Bureau of Labor Statistics (2020), Moody’s Analytics (2020)1 TEU is defined as a Twenty-Foot Equivalent Unit which is used to measure a ship’s cargo carrying capacity. The dimensions of one TEU are equal to that of a standard 20� shipping container. 20 feet long, 8 feet tall.
Dot-Com GFC COVID-19
Manufacturing Job Growth (YOY) -2.0% -3.9% 0.3%
Transportation & Warehousing Job Growth (YOY) -1.6% 0% 3.3%
Unemployment 3.7% 4.5% 3.7%
ECONOMIC FUNDAMENTALS SNAPSHOTEntering Recessionary Period
5.8
-9.5
7.79.5 8.7
6.6
-10
-5
0
5
10
15
Dot Com Financial Crisis COVID-19
Mill
ion
s
4 Qtr Rolling Net Absorption 4 Qtr Rolling Construction Completions
SUPPLY & DEMAND4-qtr. Rolling
Dot Com Financial Crisis COVID-19
OVERALL VACANCYEntering Recessionary Period
Dot-Com GFC COVID-19
Dot-Com GFC COVID-19
5.6%
9.0%
3.0%
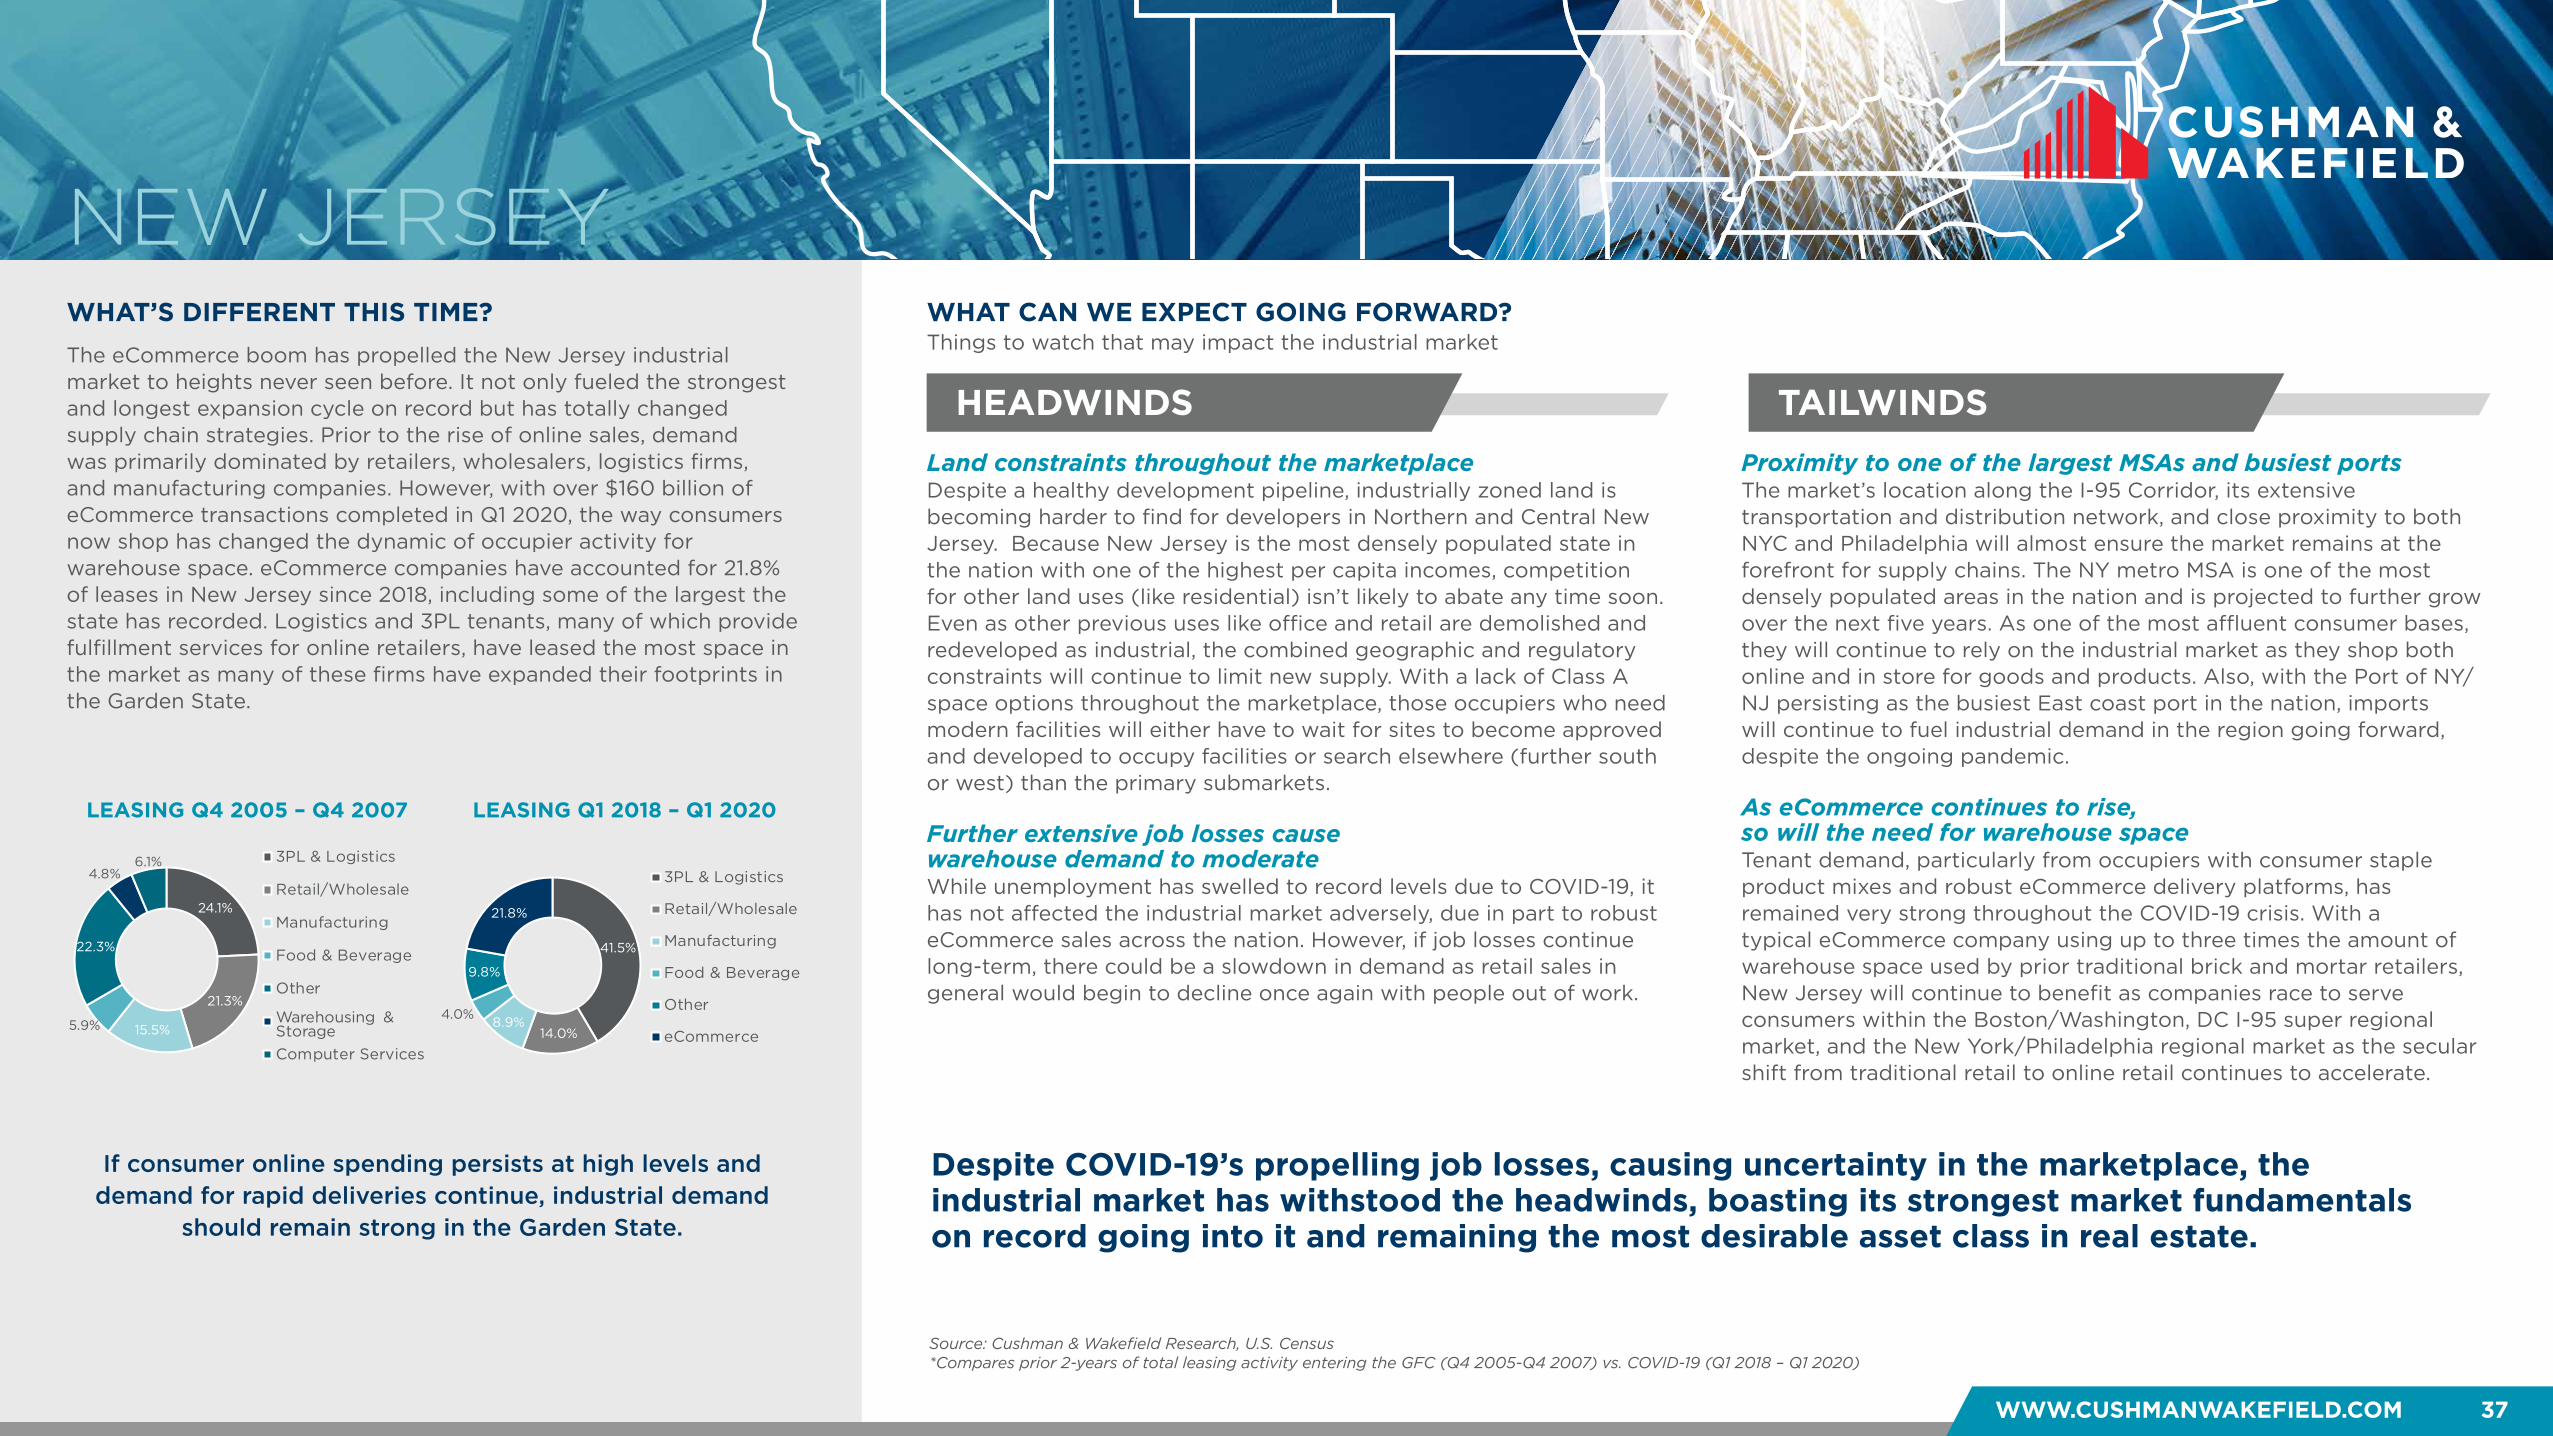
WHAT’S DIFFERENT THIS TIME?
HEADWINDS TAILWINDS
WHAT CAN WE EXPECT GOING FORWARD?
WWW.CUSHMANWAKEFIELD.COM 37
PLACEHOLDER (4-qtr r.0olling)
Things to watch that may impact the industrial market
NEW JERSEY
Despite COVID-19’s propelling job losses, causing uncertainty in the marketplace, the industrial market has withstood the headwinds, boasting its strongest market fundamentals on record going into it and remaining the most desirable asset class in real estate.
Land constraints throughout the marketplace Despite a healthy development pipeline, industrially zoned land is becoming harder to find for developers in Northern and Central New Jersey. Because New Jersey is the most densely populated state in the nation with one of the highest per capita incomes, competition for other land uses (like residential) isn’t likely to abate any time soon. Even as other previous uses like office and retail are demolished and redeveloped as industrial, the combined geographic and regulatory constraints will continue to limit new supply. With a lack of Class A space options throughout the marketplace, those occupiers who need modern facilities will either have to wait for sites to become approved and developed to occupy facilities or search elsewhere (further south or west) than the primary submarkets. Further extensive job losses cause warehouse demand to moderate While unemployment has swelled to record levels due to COVID-19, it has not affected the industrial market adversely, due in part to robust eCommerce sales across the nation. However, if job losses continue long-term, there could be a slowdown in demand as retail sales in general would begin to decline once again with people out of work.
Proximity to one of the largest MSAs and busiest ports The market’s location along the I-95 Corridor, its extensive transportation and distribution network, and close proximity to both NYC and Philadelphia will almost ensure the market remains at the forefront for supply chains. The NY metro MSA is one of the most densely populated areas in the nation and is projected to further grow over the next five years. As one of the most affluent consumer bases, they will continue to rely on the industrial market as they shop both online and in store for goods and products. Also, with the Port of NY/NJ persisting as the busiest East coast port in the nation, imports will continue to fuel industrial demand in the region going forward, despite the ongoing pandemic. As eCommerce continues to rise, so will the need for warehouse space Tenant demand, particularly from occupiers with consumer staple product mixes and robust eCommerce delivery platforms, has remained very strong throughout the COVID-19 crisis. With a typical eCommerce company using up to three times the amount of warehouse space used by prior traditional brick and mortar retailers, New Jersey will continue to benefit as companies race to serve consumers within the Boston/Washington, DC I-95 super regional market, and the New York/Philadelphia regional market as the secular shift from traditional retail to online retail continues to accelerate.
If consumer online spending persists at high levels and demand for rapid deliveries continue, industrial demand
should remain strong in the Garden State.
The eCommerce boom has propelled the New Jersey industrial market to heights never seen before. It not only fueled the strongest and longest expansion cycle on record but has totally changed supply chain strategies. Prior to the rise of online sales, demand was primarily dominated by retailers, wholesalers, logistics firms, and manufacturing companies. However, with over $160 billion of eCommerce transactions completed in Q1 2020, the way consumers now shop has changed the dynamic of occupier activity for warehouse space. eCommerce companies have accounted for 21.8% of leases in New Jersey since 2018, including some of the largest the state has recorded. Logistics and 3PL tenants, many of which provide fulfillment services for online retailers, have leased the most space in the market as many of these firms have expanded their footprints in the Garden State.
Source: Cushman & Wakefield Research, U.S. Census*Compares prior 2-years of total leasing activity entering the GFC (Q4 2005-Q4 2007) vs. COVID-19 (Q1 2018 – Q1 2020)
LEASING Q4 2005 – Q4 2007 LEASING Q1 2018 – Q1 2020
41.5%
14.0%8.9%4.0%
9.8%
21.8%
3PL & Logistics
Retail/Wholesale
Manufacturing
Food & Beverage
Other
eCommerce
24.1%
21.3%
15.5%5.9%
22.3%
4.8%6.1% 3PL & Logistics
Retail/Wholesale
Manufacturing
Food & Beverage
Other
Warehousing & StorageComputer Services
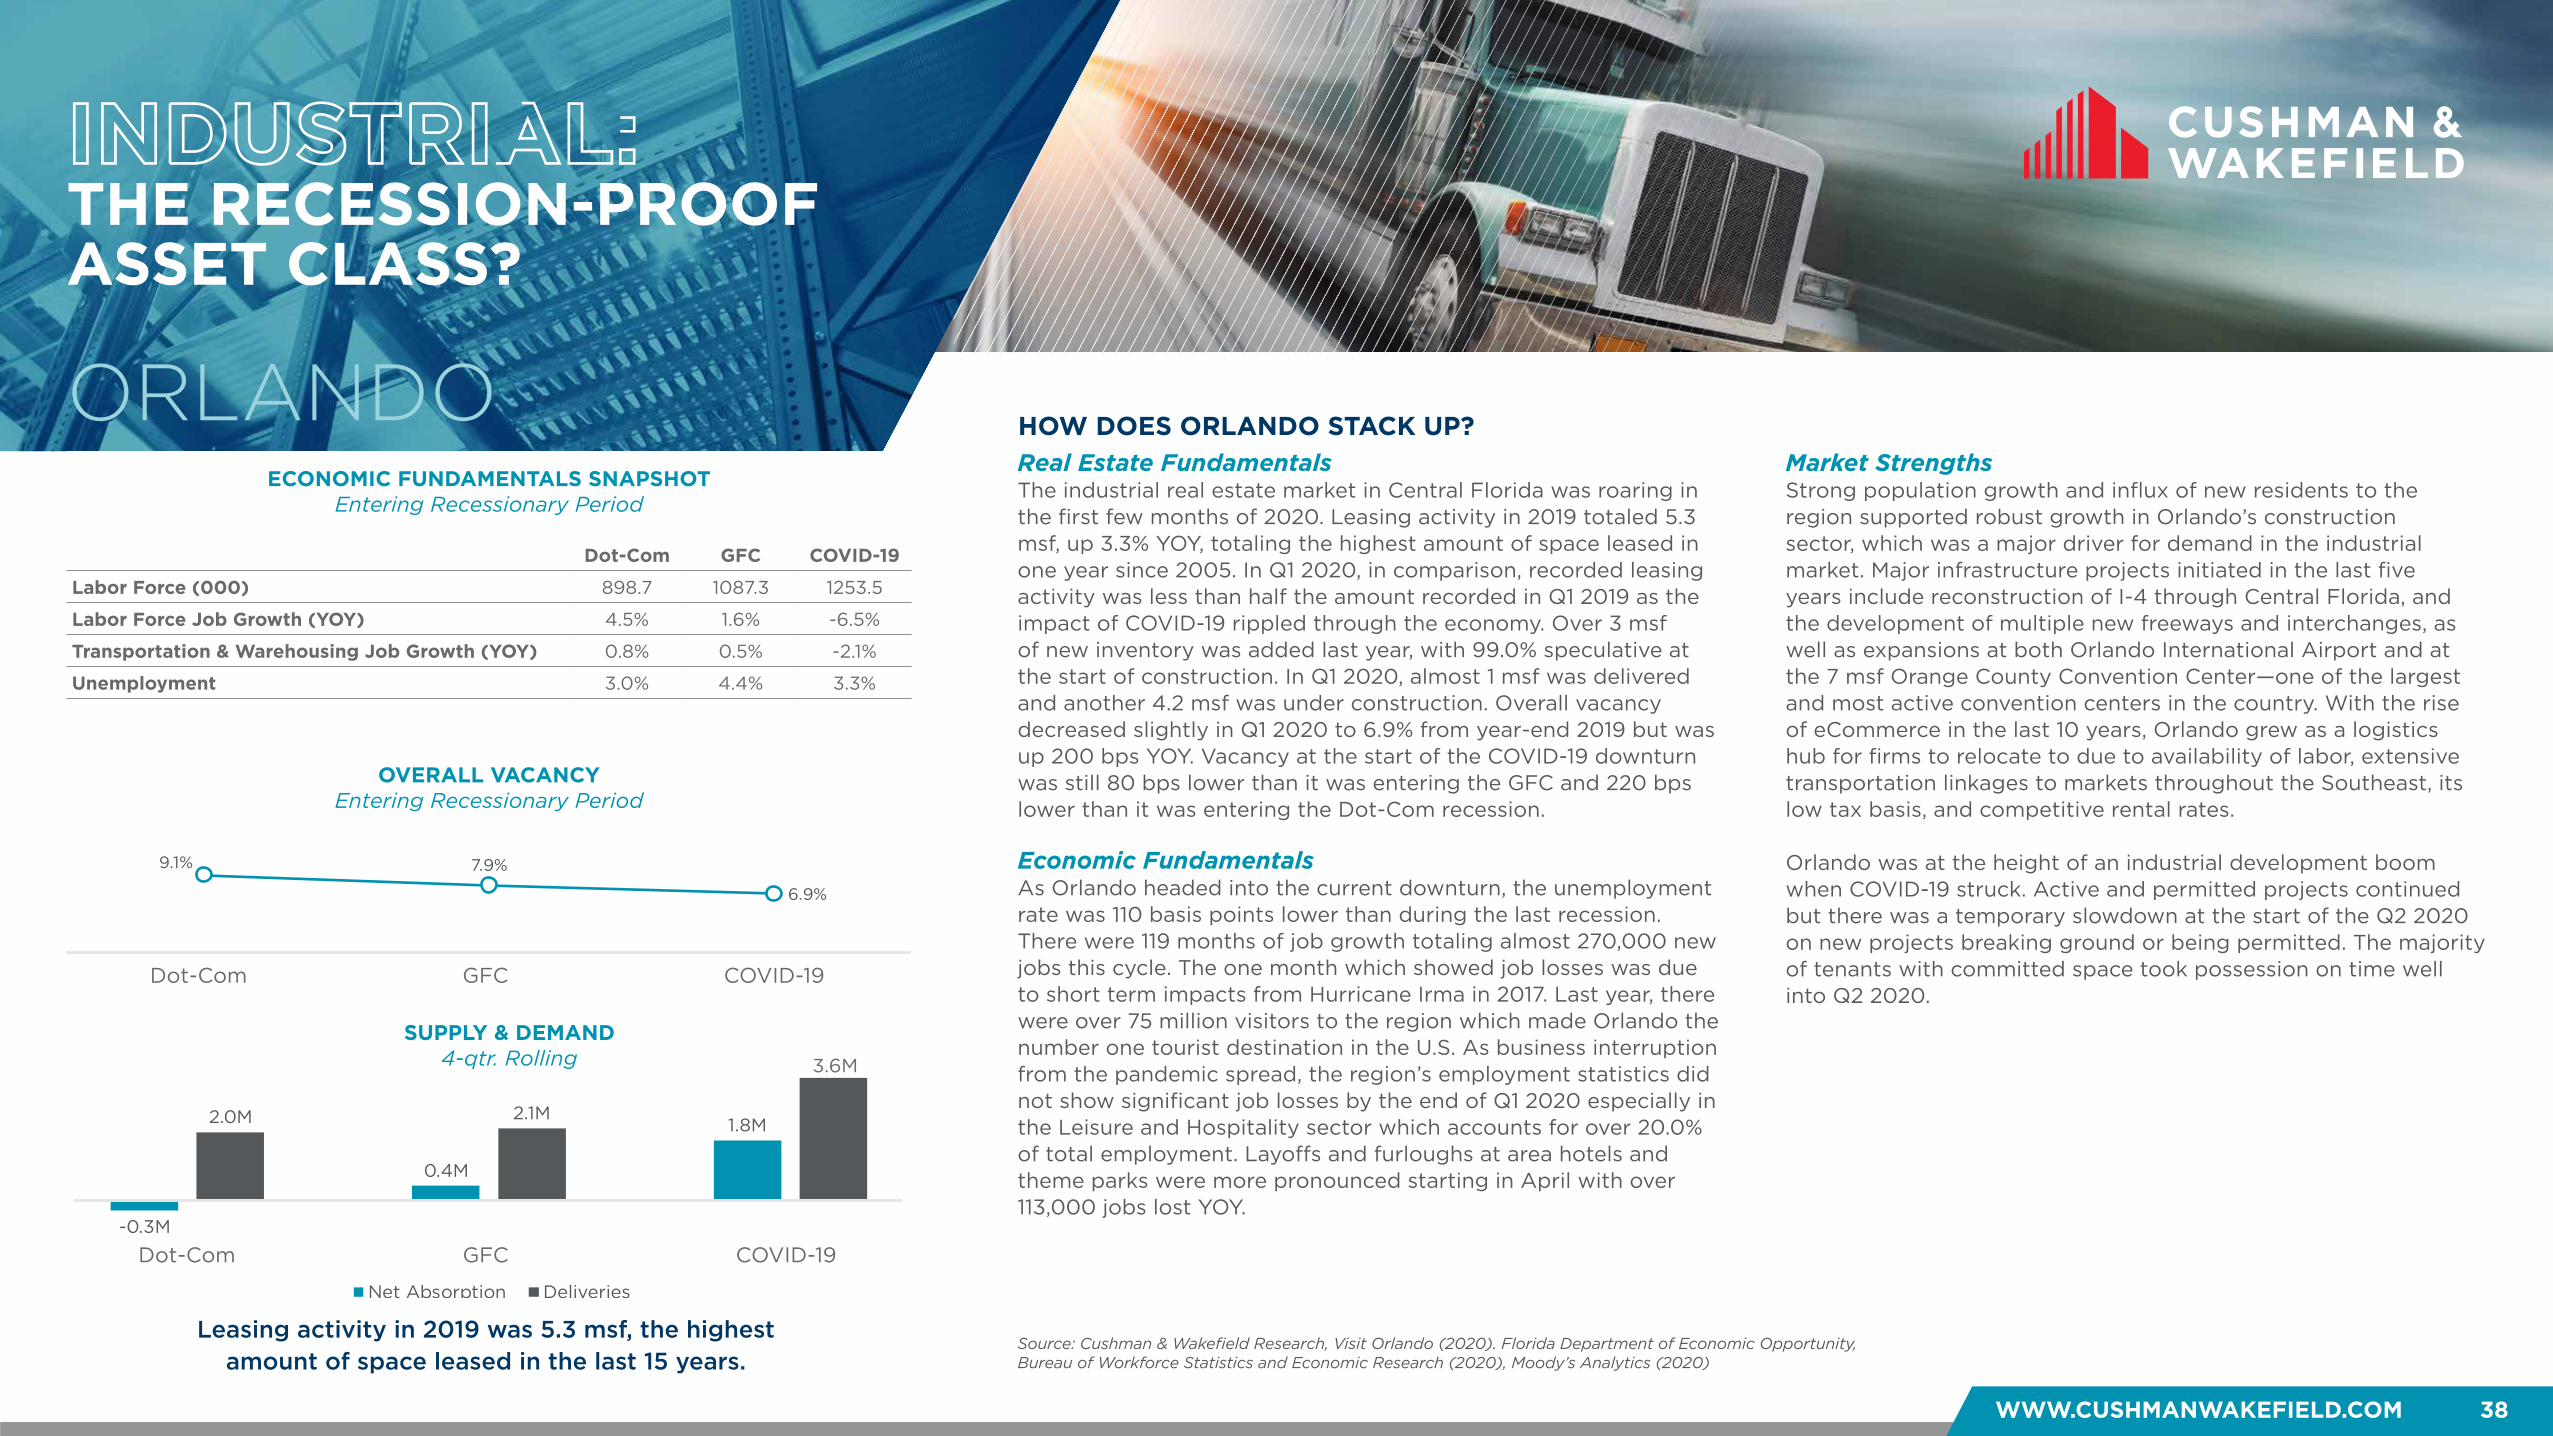
WWW.CUSHMANWAKEFIELD.COM 38
OVERALL VACANCYEntering Recessionary Period
SUPPLY & DEMANDLast 5 Years
ECONOMIC FUNDAMENTALS SNAPSHOTEntering Recessionary Period
INDUSTRIAL: THE RECESSION-PROOF ASSET CLASS?
HOW DOES ORLANDO STACK UP?ORLANDO
Leasing activity in 2019 was 5.3 msf, the highest amount of space leased in the last 15 years.
Real Estate FundamentalsThe industrial real estate market in Central Florida was roaring in the first few months of 2020. Leasing activity in 2019 totaled 5.3 msf, up 3.3% YOY, totaling the highest amount of space leased in one year since 2005. In Q1 2020, in comparison, recorded leasing activity was less than half the amount recorded in Q1 2019 as the impact of COVID-19 rippled through the economy. Over 3 msf of new inventory was added last year, with 99.0% speculative at the start of construction. In Q1 2020, almost 1 msf was delivered and another 4.2 msf was under construction. Overall vacancy decreased slightly in Q1 2020 to 6.9% from year-end 2019 but was up 200 bps YOY. Vacancy at the start of the COVID-19 downturn was still 80 bps lower than it was entering the GFC and 220 bps lower than it was entering the Dot-Com recession.
Economic FundamentalsAs Orlando headed into the current downturn, the unemployment rate was 110 basis points lower than during the last recession. There were 119 months of job growth totaling almost 270,000 new jobs this cycle. The one month which showed job losses was due to short term impacts from Hurricane Irma in 2017. Last year, there were over 75 million visitors to the region which made Orlando the number one tourist destination in the U.S. As business interruption from the pandemic spread, the region’s employment statistics did not show significant job losses by the end of Q1 2020 especially in the Leisure and Hospitality sector which accounts for over 20.0% of total employment. Layoffs and furloughs at area hotels and theme parks were more pronounced starting in April with over 113,000 jobs lost YOY.
Market StrengthsStrong population growth and influx of new residents to the region supported robust growth in Orlando’s construction sector, which was a major driver for demand in the industrial market. Major infrastructure projects initiated in the last five years include reconstruction of I-4 through Central Florida, and the development of multiple new freeways and interchanges, as well as expansions at both Orlando International Airport and at the 7 msf Orange County Convention Center—one of the largest and most active convention centers in the country. With the rise of eCommerce in the last 10 years, Orlando grew as a logistics hub for firms to relocate to due to availability of labor, extensive transportation linkages to markets throughout the Southeast, its low tax basis, and competitive rental rates. Orlando was at the height of an industrial development boom when COVID-19 struck. Active and permitted projects continued but there was a temporary slowdown at the start of the Q2 2020 on new projects breaking ground or being permitted. The majority of tenants with committed space took possession on time well into Q2 2020.
Source: Cushman & Wakefield Research, Visit Orlando (2020). Florida Department of Economic Opportunity, Bureau of Workforce Statistics and Economic Research (2020), Moody’s Analytics (2020)
ECONOMIC FUNDAMENTALS SNAPSHOTEntering Recessionary Period
Dot-Com GFC COVID-19
Labor Force (000) 898.7 1087.3 1253.5
Labor Force Job Growth (YOY) 4.5% 1.6% -6.5%
Transportation & Warehousing Job Growth (YOY) 0.8% 0.5% -2.1%
Unemployment 3.0% 4.4% 3.3%
OVERALL VACANCYEntering Recessionary Period
9.1% 7.9%
6.9%
Dot Com Financial Crisis COVID-19
-0.3M
0.4M
1.8M2.0M 2.1M
Dot Com Financial Crisis COVID-19
Net Absorption Deliveries
SUPPLY & DEMAND 4-qtr. Rolling
Dot-Com GFC COVID-19
Dot-Com GFC COVID-19
3.6M
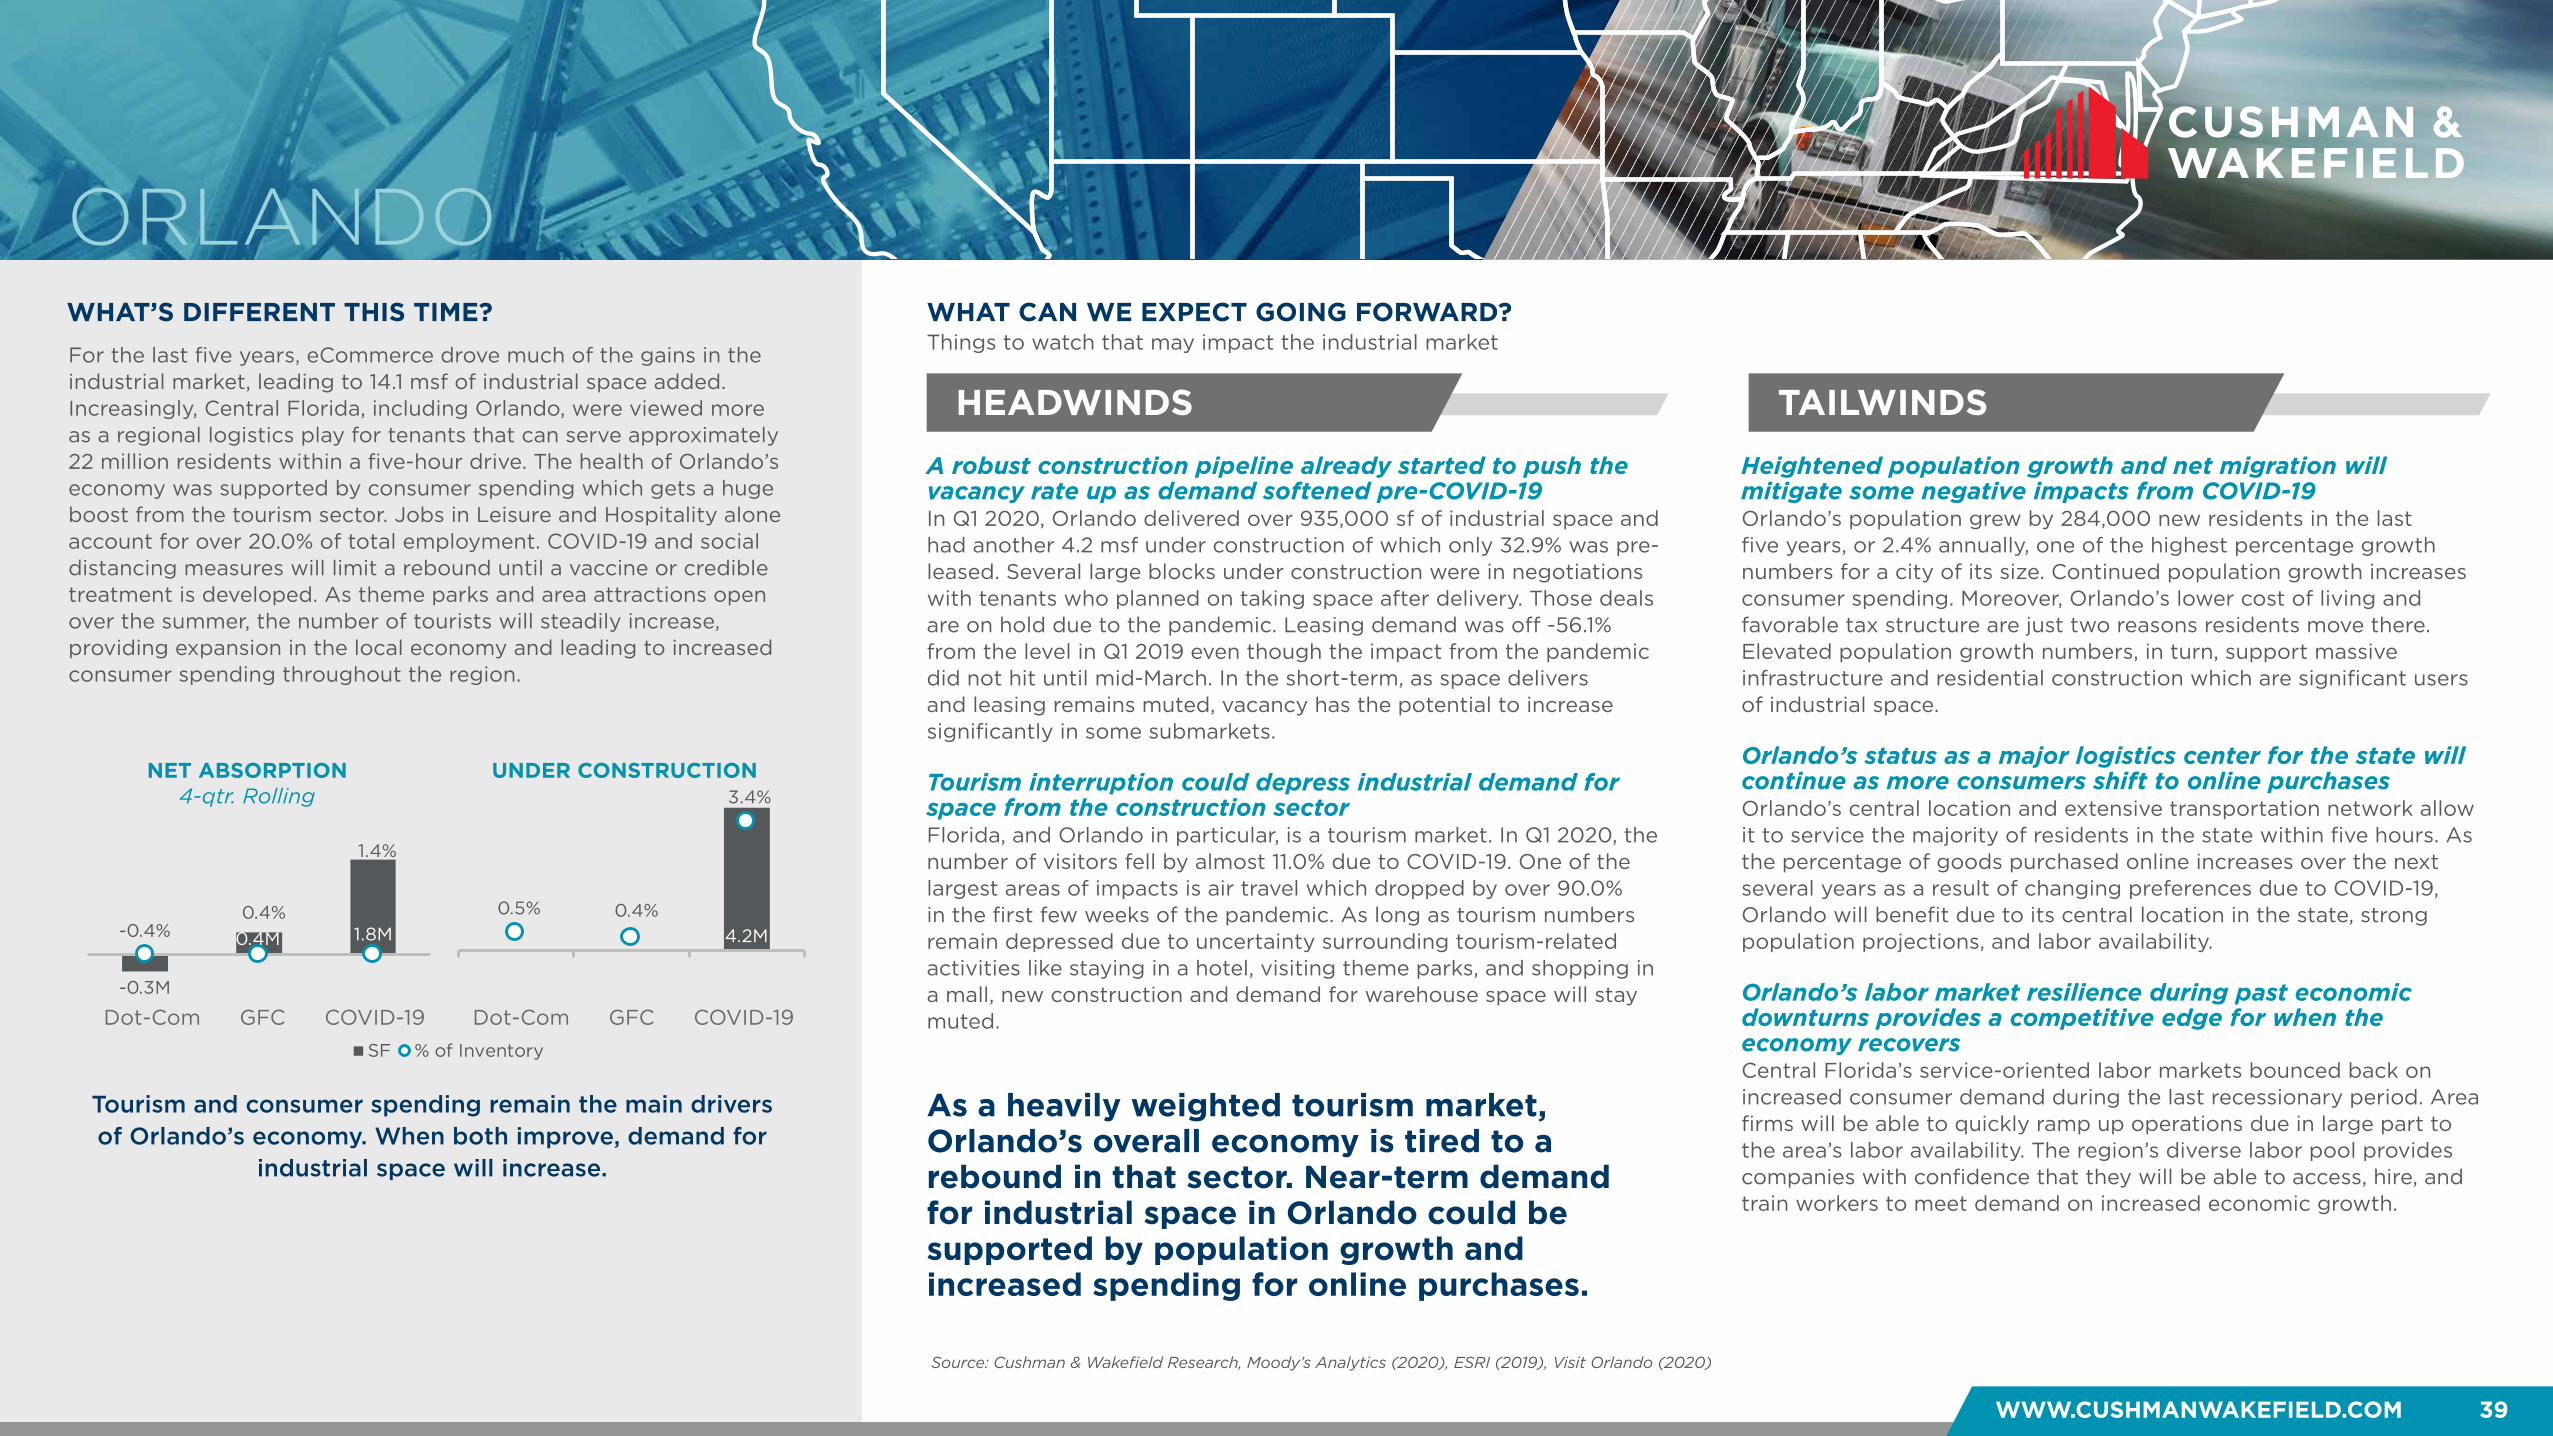
WHAT’S DIFFERENT THIS TIME?
HEADWINDS TAILWINDS
WHAT CAN WE EXPECT GOING FORWARD?
WWW.CUSHMANWAKEFIELD.COM 39
Things to watch that may impact the industrial market
ORLANDO
A robust construction pipeline already started to push the vacancy rate up as demand softened pre-COVID-19 In Q1 2020, Orlando delivered over 935,000 sf of industrial space and had another 4.2 msf under construction of which only 32.9% was pre-leased. Several large blocks under construction were in negotiations with tenants who planned on taking space after delivery. Those deals are on hold due to the pandemic. Leasing demand was off -56.1% from the level in Q1 2019 even though the impact from the pandemic did not hit until mid-March. In the short-term, as space delivers and leasing remains muted, vacancy has the potential to increase significantly in some submarkets. Tourism interruption could depress industrial demand for space from the construction sector Florida, and Orlando in particular, is a tourism market. In Q1 2020, the number of visitors fell by almost 11.0% due to COVID-19. One of the largest areas of impacts is air travel which dropped by over 90.0% in the first few weeks of the pandemic. As long as tourism numbers remain depressed due to uncertainty surrounding tourism-related activities like staying in a hotel, visiting theme parks, and shopping in a mall, new construction and demand for warehouse space will stay muted.
Heightened population growth and net migration will mitigate some negative impacts from COVID-19 Orlando’s population grew by 284,000 new residents in the last five years, or 2.4% annually, one of the highest percentage growth numbers for a city of its size. Continued population growth increases consumer spending. Moreover, Orlando’s lower cost of living and favorable tax structure are just two reasons residents move there. Elevated population growth numbers, in turn, support massive infrastructure and residential construction which are significant users of industrial space. Orlando’s status as a major logistics center for the state will continue as more consumers shift to online purchases Orlando’s central location and extensive transportation network allow it to service the majority of residents in the state within five hours. As the percentage of goods purchased online increases over the next several years as a result of changing preferences due to COVID-19, Orlando will benefit due to its central location in the state, strong population projections, and labor availability. Orlando’s labor market resilience during past economic downturns provides a competitive edge for when the economy recovers Central Florida’s service-oriented labor markets bounced back on increased consumer demand during the last recessionary period. Area firms will be able to quickly ramp up operations due in large part to the area’s labor availability. The region’s diverse labor pool provides companies with confidence that they will be able to access, hire, and train workers to meet demand on increased economic growth.
Tourism and consumer spending remain the main drivers of Orlando’s economy. When both improve, demand for
industrial space will increase.
For the last five years, eCommerce drove much of the gains in the industrial market, leading to 14.1 msf of industrial space added. Increasingly, Central Florida, including Orlando, were viewed more as a regional logistics play for tenants that can serve approximately 22 million residents within a five-hour drive. The health of Orlando’s economy was supported by consumer spending which gets a huge boost from the tourism sector. Jobs in Leisure and Hospitality alone account for over 20.0% of total employment. COVID-19 and social distancing measures will limit a rebound until a vaccine or credible treatment is developed. As theme parks and area attractions open over the summer, the number of tourists will steadily increase, providing expansion in the local economy and leading to increased consumer spending throughout the region.
Source: Cushman & Wakefield Research, Moody’s Analytics (2020), ESRI (2019), Visit Orlando (2020)
NET ABSORPTION 4-qtr. Rolling
UNDER CONSTRUCTION
As a heavily weighted tourism market, Orlando’s overall economy is tired to a rebound in that sector. Near-term demand for industrial space in Orlando could be supported by population growth and increased spending for online purchases.
-0.3M
0.4M 1.8M-0.4%0.4%
1.4%
Dot Com FinancialCrisis
COVID-19SF % of Inventory
4.2M0.5% 0.4%
3.4%
Dot Com Financial Crisis
COVID-19
SF % of Inventory-0.3M
0.4M 1.8M-0.4%0.4%
1.4%
Dot Com FinancialCrisis
COVID-19SF % of Inventory
4.2M0.5% 0.4%
3.4%
Dot Com Financial Crisis
COVID-19
SF % of Inventory-0.3M
0.4M 1.8M-0.4%0.4%
1.4%
Dot Com FinancialCrisis
COVID-19SF % of Inventory
4.2M0.5% 0.4%
3.4%
Dot Com Financial Crisis
COVID-19
SF % of Inventory-0.3M
0.4M 1.8M-0.4%0.4%
1.4%
Dot Com FinancialCrisis
COVID-19SF % of Inventory
4.2M0.5% 0.4%
3.4%
Dot Com Financial Crisis
COVID-19
SF % of Inventory
Dot-Com GFC COVID-19 Dot-Com GFC COVID-19
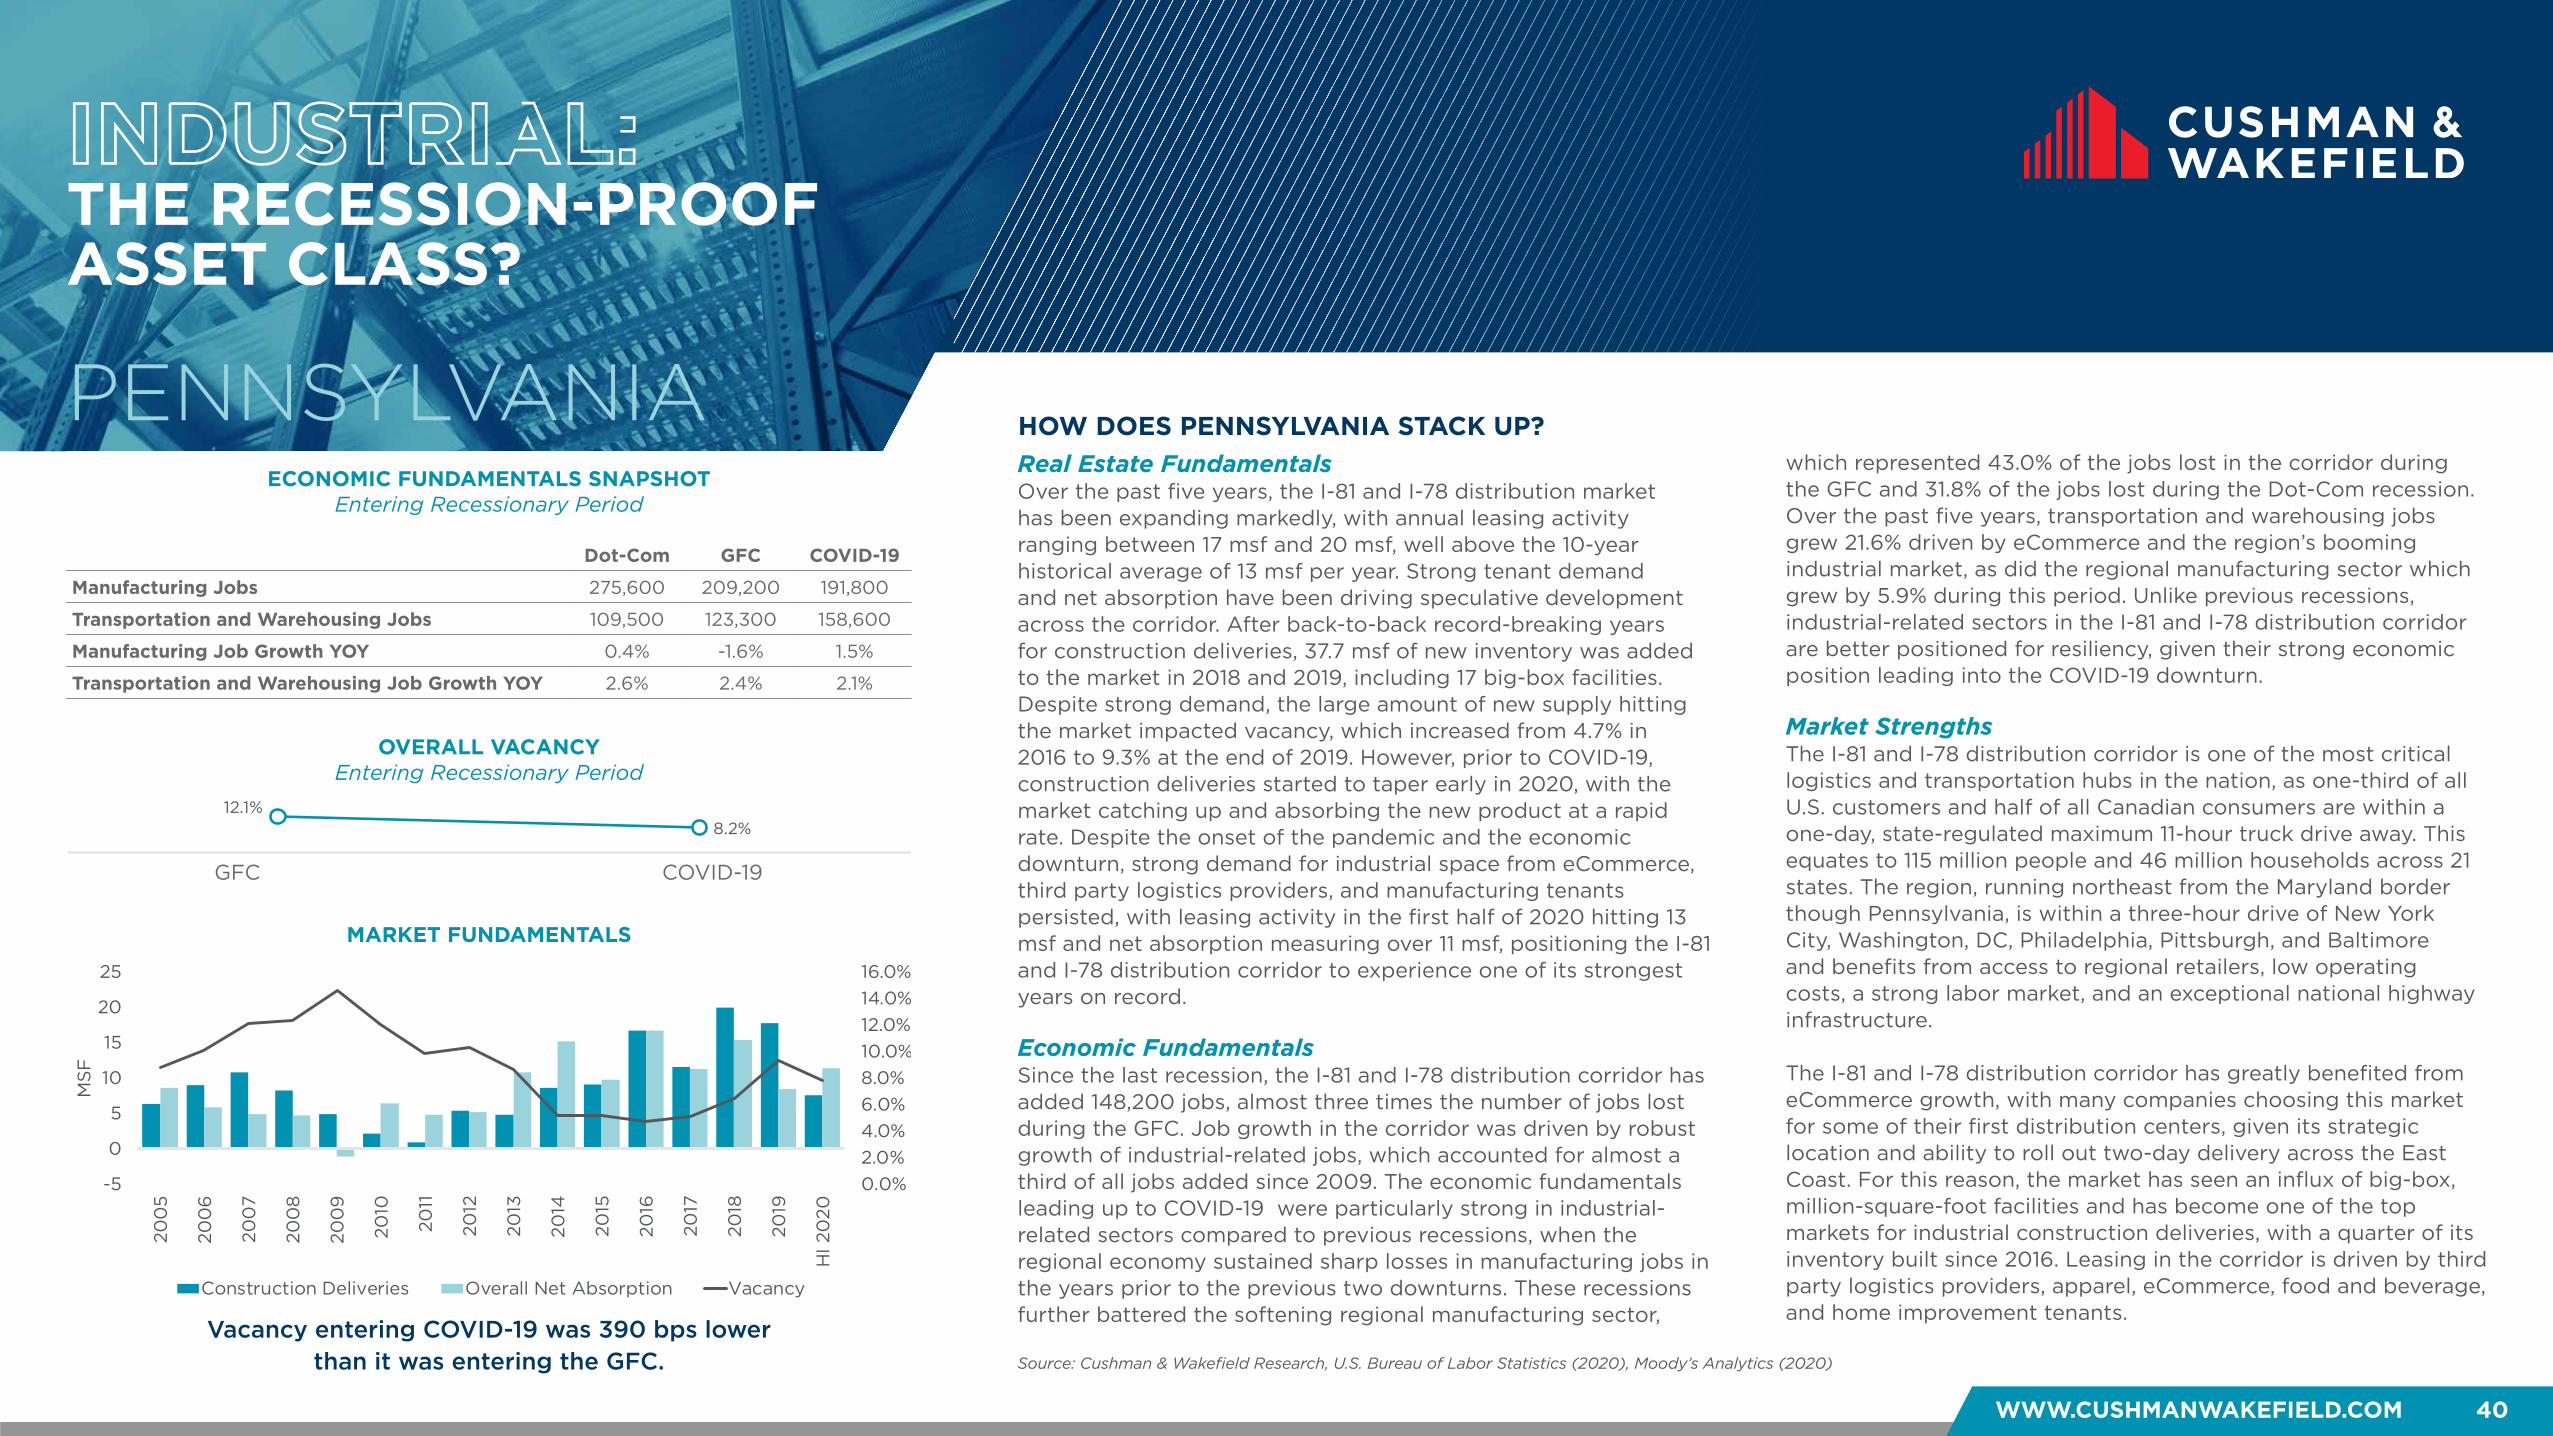
WWW.CUSHMANWAKEFIELD.COM 40
OVERALL VACANCY
SUPPLY & DEMAND4-qtr. Rolling
ECONOMIC FUNDAMENTALS SNAPSHOTEntering Recessionary Period
INDUSTRIAL: THE RECESSION-PROOF ASSET CLASS?
0.0%2.0%4.0%6.0%8.0%10.0%12.0%14.0%16.0%
-5
0
5
10
15
20
25
200
5
200
6
200
7
200
8
200
9
2010
2011
2012
2013
2014
2015
2016
2017
2018
2019
HI 2
020
MS
F
Construction Deliveries Overall Net Absorption Vacancy
HOW DOES PENNSYLVANIA STACK UP?PENNSYLVANIA
Vacancy entering COVID-19 was 390 bps lower than it was entering the GFC.
Real Estate FundamentalsOver the past five years, the I-81 and I-78 distribution market has been expanding markedly, with annual leasing activity ranging between 17 msf and 20 msf, well above the 10-year historical average of 13 msf per year. Strong tenant demand and net absorption have been driving speculative development across the corridor. After back-to-back record-breaking years for construction deliveries, 37.7 msf of new inventory was added to the market in 2018 and 2019, including 17 big-box facilities. Despite strong demand, the large amount of new supply hitting the market impacted vacancy, which increased from 4.7% in 2016 to 9.3% at the end of 2019. However, prior to COVID-19, construction deliveries started to taper early in 2020, with the market catching up and absorbing the new product at a rapid rate. Despite the onset of the pandemic and the economic downturn, strong demand for industrial space from eCommerce, third party logistics providers, and manufacturing tenants persisted, with leasing activity in the first half of 2020 hitting 13 msf and net absorption measuring over 11 msf, positioning the I-81 and I-78 distribution corridor to experience one of its strongest years on record.
Economic FundamentalsSince the last recession, the I-81 and I-78 distribution corridor has added 148,200 jobs, almost three times the number of jobs lost during the GFC. Job growth in the corridor was driven by robust growth of industrial-related jobs, which accounted for almost a third of all jobs added since 2009. The economic fundamentals leading up to COVID-19 were particularly strong in industrial-related sectors compared to previous recessions, when the regional economy sustained sharp losses in manufacturing jobs in the years prior to the previous two downturns. These recessions further battered the softening regional manufacturing sector,
which represented 43.0% of the jobs lost in the corridor during the GFC and 31.8% of the jobs lost during the Dot-Com recession. Over the past five years, transportation and warehousing jobs grew 21.6% driven by eCommerce and the region’s booming industrial market, as did the regional manufacturing sector which grew by 5.9% during this period. Unlike previous recessions, industrial-related sectors in the I-81 and I-78 distribution corridor are better positioned for resiliency, given their strong economic position leading into the COVID-19 downturn.
Market StrengthsThe I-81 and I-78 distribution corridor is one of the most critical logistics and transportation hubs in the nation, as one-third of all U.S. customers and half of all Canadian consumers are within a one-day, state-regulated maximum 11-hour truck drive away. This equates to 115 million people and 46 million households across 21 states. The region, running northeast from the Maryland border though Pennsylvania, is within a three-hour drive of New York City, Washington, DC, Philadelphia, Pittsburgh, and Baltimore and benefits from access to regional retailers, low operating costs, a strong labor market, and an exceptional national highway infrastructure.
The I-81 and I-78 distribution corridor has greatly benefited from eCommerce growth, with many companies choosing this market for some of their first distribution centers, given its strategic location and ability to roll out two-day delivery across the East Coast. For this reason, the market has seen an influx of big-box, million-square-foot facilities and has become one of the top markets for industrial construction deliveries, with a quarter of its inventory built since 2016. Leasing in the corridor is driven by third party logistics providers, apparel, eCommerce, food and beverage, and home improvement tenants.
Source: Cushman & Wakefield Research, U.S. Bureau of Labor Statistics (2020), Moody’s Analytics (2020)
ECONOMIC FUNDAMENTALS SNAPSHOTEntering Recessionary Period
OVERALL VACANCYEntering Recessionary Period
MARKET FUNDAMENTALS
Dot-Com GFC COVID-19
Manufacturing Jobs 275,600 209,200 191,800
Transportation and Warehousing Jobs 109,500 123,300 158,600
Manufacturing Job Growth YOY 0.4% -1.6% 1.5%
Transportation and Warehousing Job Growth YOY 2.6% 2.4% 2.1%
12.1%8.2%
Financial Crisis COVID-19GFC COVID-19
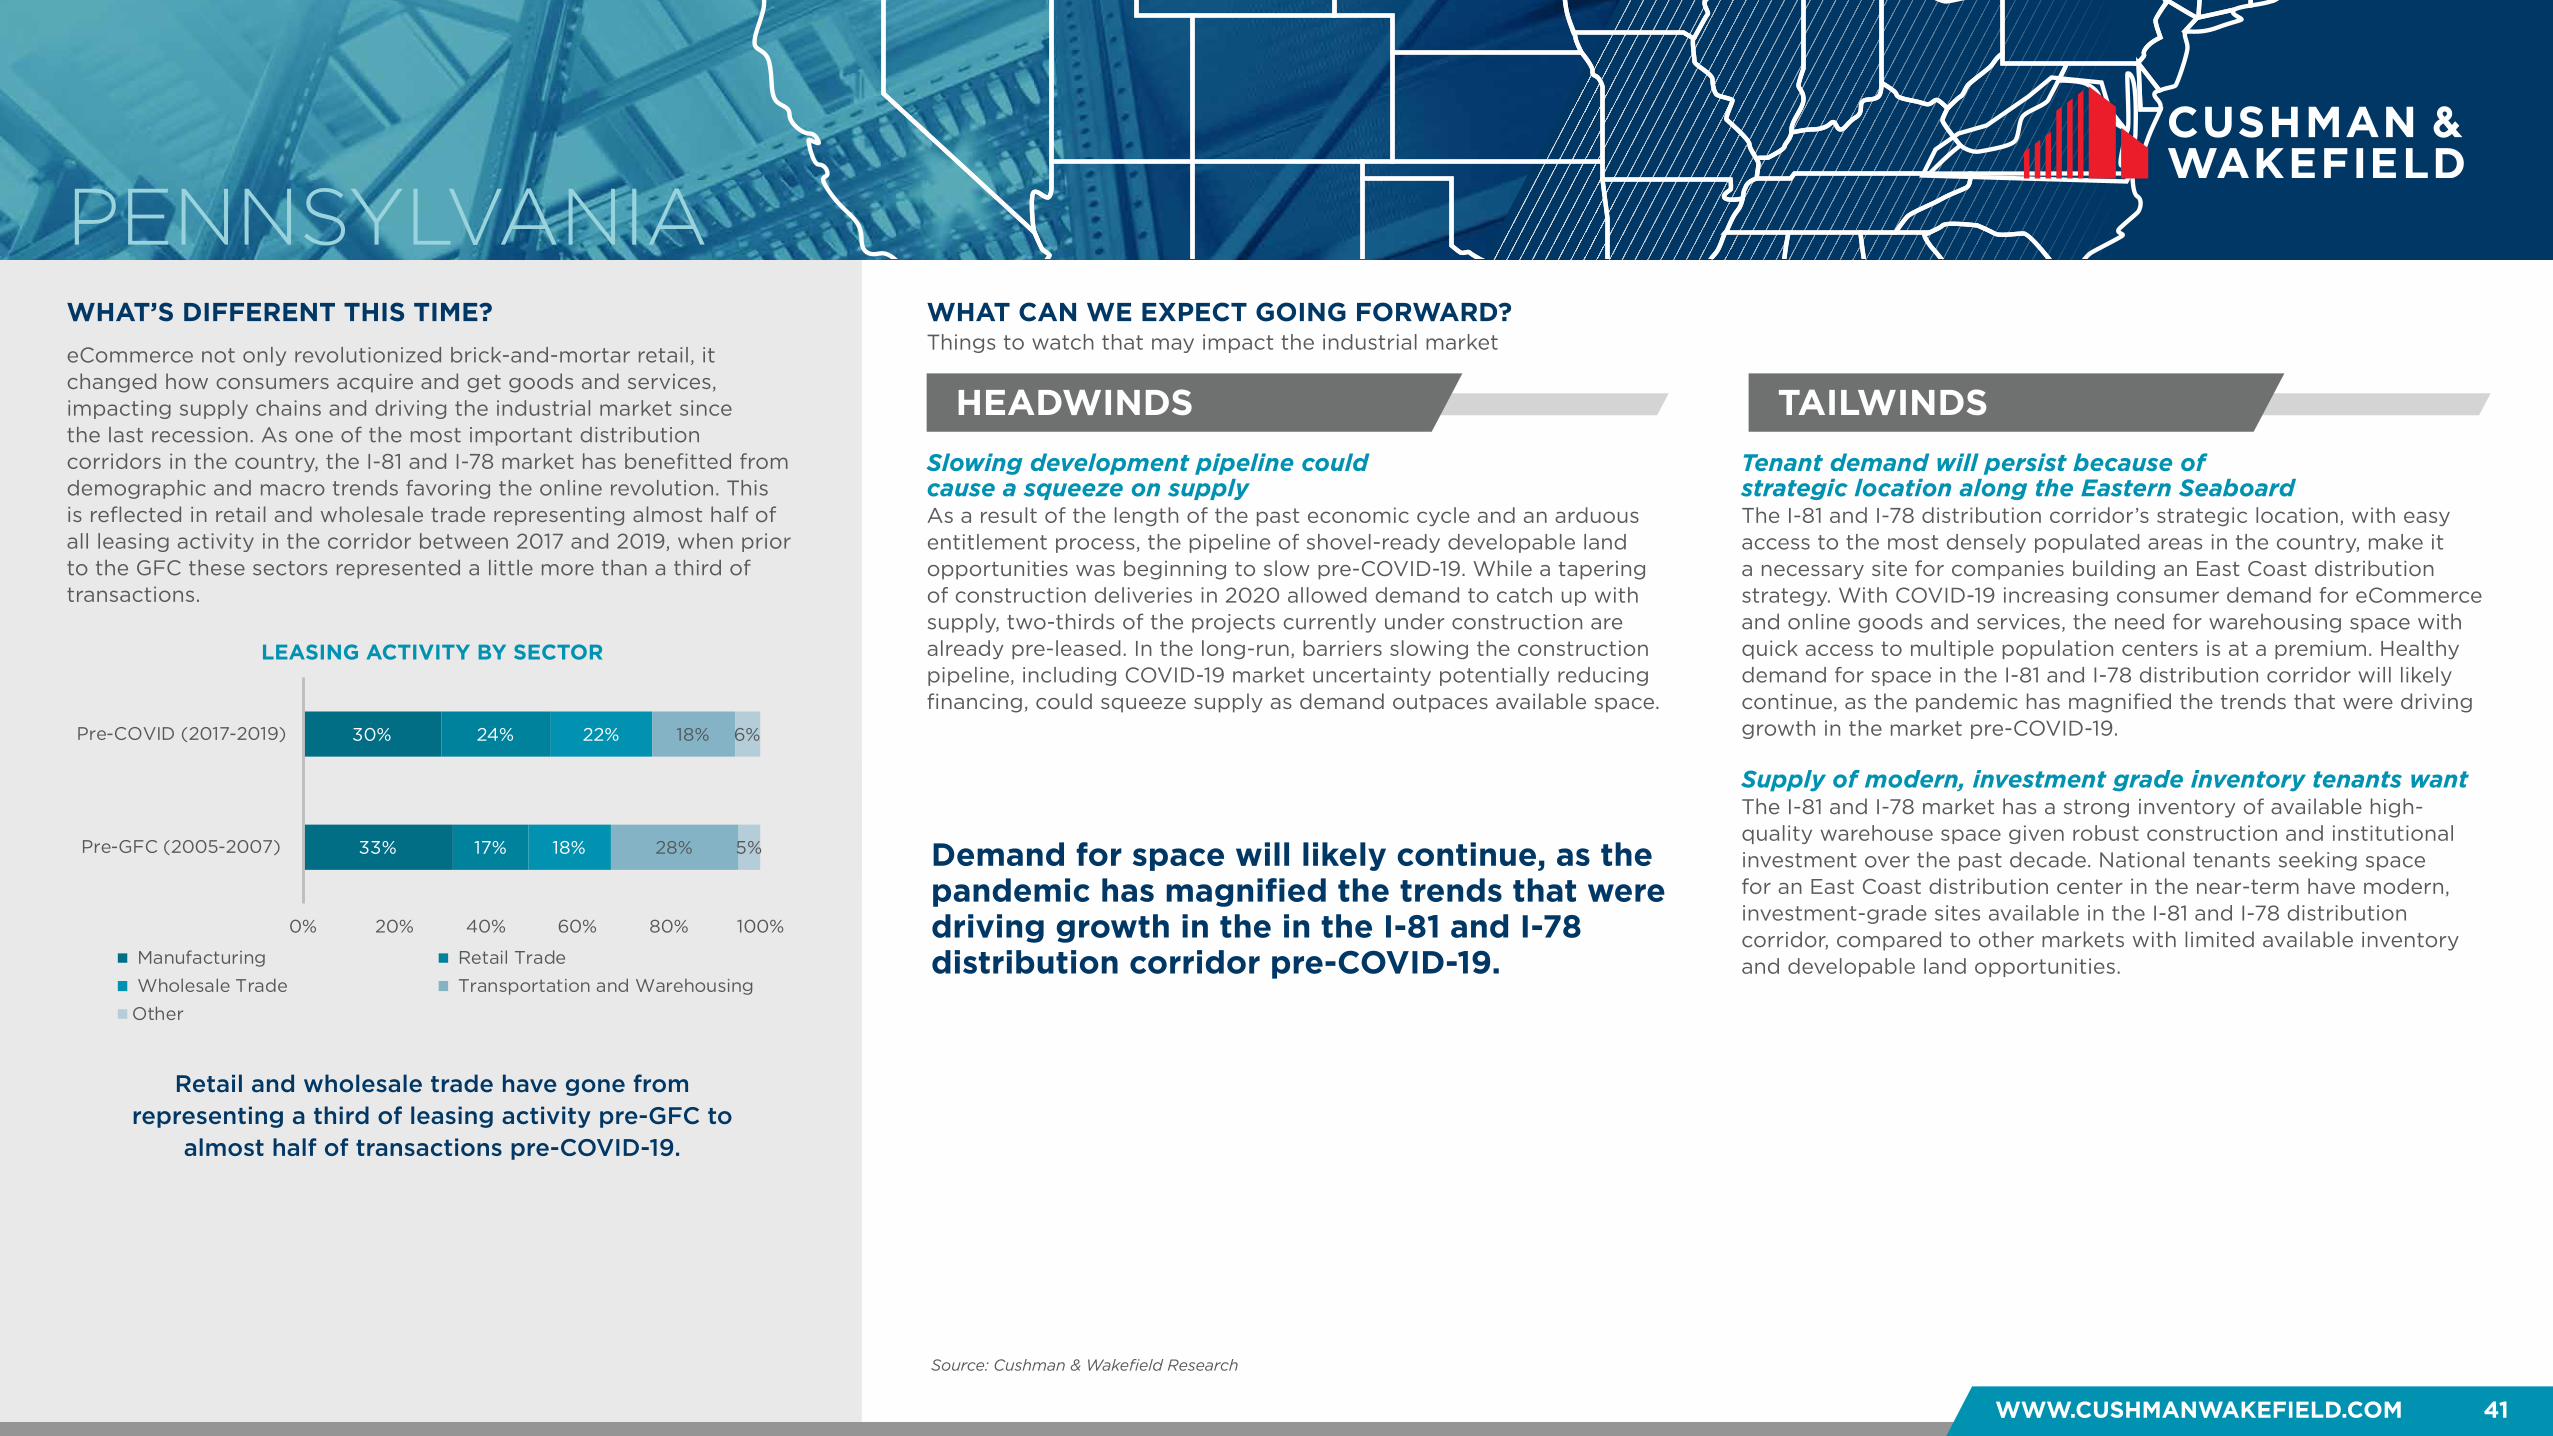
WHAT’S DIFFERENT THIS TIME?
HEADWINDS TAILWINDS
WHAT CAN WE EXPECT GOING FORWARD?
WWW.CUSHMANWAKEFIELD.COM 41
PLACEHOLDER (4-qtr rolling)
Things to watch that may impact the industrial market
PENNSYLVANIA
Slowing development pipeline could cause a squeeze on supplyAs a result of the length of the past economic cycle and an arduous entitlement process, the pipeline of shovel-ready developable land opportunities was beginning to slow pre-COVID-19. While a tapering of construction deliveries in 2020 allowed demand to catch up with supply, two-thirds of the projects currently under construction are already pre-leased. In the long-run, barriers slowing the construction pipeline, including COVID-19 market uncertainty potentially reducing financing, could squeeze supply as demand outpaces available space.
Tenant demand will persist because of strategic location along the Eastern SeaboardThe I-81 and I-78 distribution corridor’s strategic location, with easy access to the most densely populated areas in the country, make it a necessary site for companies building an East Coast distribution strategy. With COVID-19 increasing consumer demand for eCommerce and online goods and services, the need for warehousing space with quick access to multiple population centers is at a premium. Healthy demand for space in the I-81 and I-78 distribution corridor will likely continue, as the pandemic has magnified the trends that were driving growth in the market pre-COVID-19.
Supply of modern, investment grade inventory tenants wantThe I-81 and I-78 market has a strong inventory of available high-quality warehouse space given robust construction and institutional investment over the past decade. National tenants seeking space for an East Coast distribution center in the near-term have modern, investment-grade sites available in the I-81 and I-78 distribution corridor, compared to other markets with limited available inventory and developable land opportunities.
Retail and wholesale trade have gone from representing a third of leasing activity pre-GFC to
almost half of transactions pre-COVID-19.
eCommerce not only revolutionized brick-and-mortar retail, it changed how consumers acquire and get goods and services, impacting supply chains and driving the industrial market since the last recession. As one of the most important distribution corridors in the country, the I-81 and I-78 market has benefitted from demographic and macro trends favoring the online revolution. This is reflected in retail and wholesale trade representing almost half of all leasing activity in the corridor between 2017 and 2019, when prior to the GFC these sectors represented a little more than a third of transactions.
Source: Cushman & Wakefield Research
Demand for space will likely continue, as the pandemic has magnified the trends that were driving growth in the in the I-81 and I-78 distribution corridor pre-COVID-19.
33%
30%
17%
24%
18%
22%
28%
18%
5%
6%
0% 20% 40% 60% 80% 100%
Pre-GFC (2005-2007)
Pre-COVID (2017-2019)
Manufacturing Retail Trade Wholesale Trade Transportation and WarehousingOther
LEASING ACTIVITY BY SECTOR
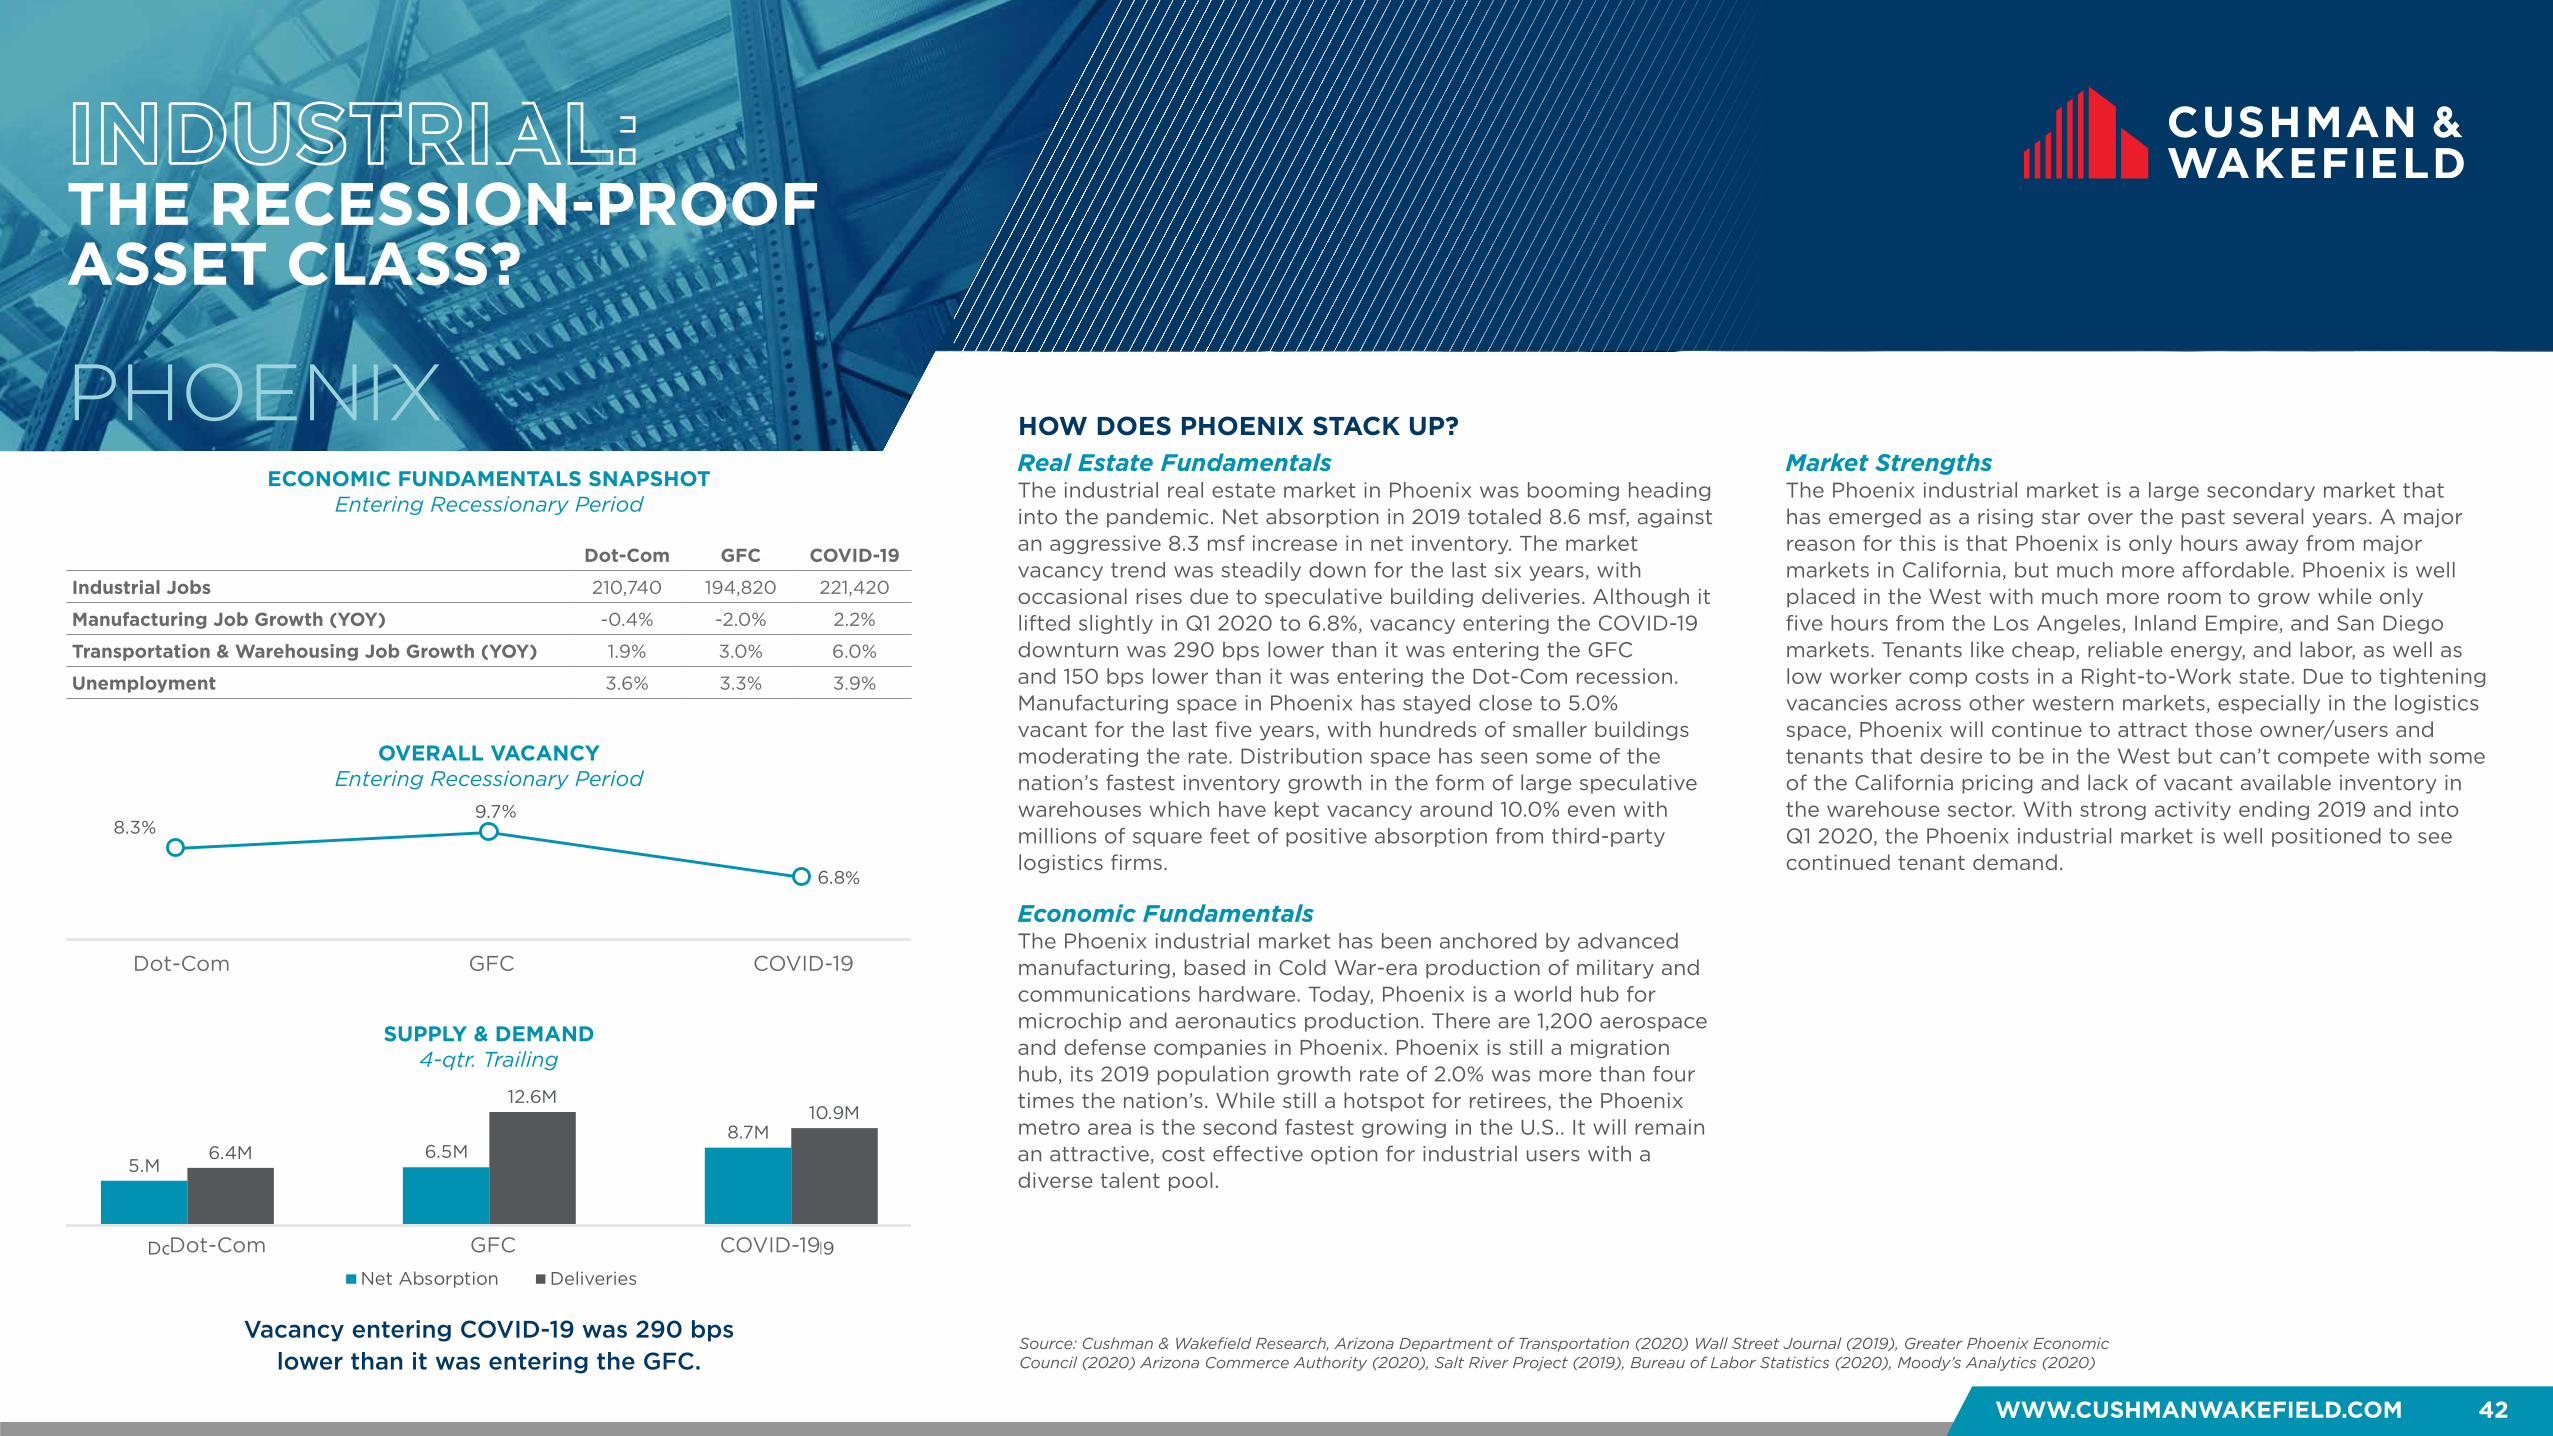
WWW.CUSHMANWAKEFIELD.COM 42
INDUSTRIAL: THE RECESSION-PROOF ASSET CLASS?
HOW DOES PHOENIX STACK UP?PHOENIX
Vacancy entering COVID-19 was 290 bps lower than it was entering the GFC.
Real Estate FundamentalsThe industrial real estate market in Phoenix was booming heading into the pandemic. Net absorption in 2019 totaled 8.6 msf, against an aggressive 8.3 msf increase in net inventory. The market vacancy trend was steadily down for the last six years, with occasional rises due to speculative building deliveries. Although it lifted slightly in Q1 2020 to 6.8%, vacancy entering the COVID-19 downturn was 290 bps lower than it was entering the GFC and 150 bps lower than it was entering the Dot-Com recession. Manufacturing space in Phoenix has stayed close to 5.0% vacant for the last five years, with hundreds of smaller buildings moderating the rate. Distribution space has seen some of the nation’s fastest inventory growth in the form of large speculative warehouses which have kept vacancy around 10.0% even with millions of square feet of positive absorption from third-party logistics firms.
Economic FundamentalsThe Phoenix industrial market has been anchored by advanced manufacturing, based in Cold War-era production of military and communications hardware. Today, Phoenix is a world hub for microchip and aeronautics production. There are 1,200 aerospace and defense companies in Phoenix. Phoenix is still a migration hub, its 2019 population growth rate of 2.0% was more than four times the nation’s. While still a hotspot for retirees, the Phoenix metro area is the second fastest growing in the U.S.. It will remain an attractive, cost effective option for industrial users with a diverse talent pool.
Market StrengthsThe Phoenix industrial market is a large secondary market that has emerged as a rising star over the past several years. A major reason for this is that Phoenix is only hours away from major markets in California, but much more affordable. Phoenix is well placed in the West with much more room to grow while only five hours from the Los Angeles, Inland Empire, and San Diego markets. Tenants like cheap, reliable energy, and labor, as well as low worker comp costs in a Right-to-Work state. Due to tightening vacancies across other western markets, especially in the logistics space, Phoenix will continue to attract those owner/users and tenants that desire to be in the West but can’t compete with some of the California pricing and lack of vacant available inventory in the warehouse sector. With strong activity ending 2019 and into Q1 2020, the Phoenix industrial market is well positioned to see continued tenant demand.
Source: Cushman & Wakefield Research, Arizona Department of Transportation (2020) Wall Street Journal (2019), Greater Phoenix Economic Council (2020) Arizona Commerce Authority (2020), Salt River Project (2019), Bureau of Labor Statistics (2020), Moody’s Analytics (2020)
ECONOMIC FUNDAMENTALS SNAPSHOTEntering Recessionary Period
OVERALL VACANCYEntering Recessionary Period
SUPPLY & DEMAND 4-qtr. Trailing
Dot-Com GFC COVID-19
Industrial Jobs 210,740 194,820 221,420
Manufacturing Job Growth (YOY) -0.4% -2.0% 2.2%
Transportation & Warehousing Job Growth (YOY) 1.9% 3.0% 6.0%
Unemployment 3.6% 3.3% 3.9%
8.3%9.7
6.8
Dot Com Financial Crisis COVID-19
%
%
5.M6.5M
8.7M6.4M
12.6M10.9M
Dot Com GFC COVID-19
Net Absorption Deliveries
Dot-Com GFC COVID-19
Dot-Com GFC COVID-19

WHAT’S DIFFERENT THIS TIME?
HEADWINDS TAILWINDS
WHAT CAN WE EXPECT GOING FORWARD?
WWW.CUSHMANWAKEFIELD.COM 43
Things to watch that may impact the industrial market
PHOENIX
Phoenix anticipates strong growth in industrial manufacturing and logistics. Any of the four megaprojects planned will employ tens of thousands of workers directly and indirectly.
A robust development pipeline could place pressure on rents and vacancy In Q1 2020, Phoenix had 10.2 msf under construction (3.1% of total inventory) of which 30.5% was pre-leased. Demand this cycle has outstripped new supply. With tenants quickly leasing new space as it comes to market, industrial tenant demand may shift in response to the pandemic. If supply overshoots demand, vacancy will rise and rents will decline. Oil demand shock would hit Arizona hard Phoenix has very little in the way of rail compared to most major industrial markets and is reliant on trucking to connect it to Southern California ports and Texas cities. A large and sustained increase in the price of gasoline would blunt the price discount to other markets. Shift in global supply chain reduces traffic at West Coast ports If the long-term result of COVID-19 is a shift to production in India or any market west of Singapore, then the swiftest path to the U.S. will be through the Suez Canal and East Coast ports. If Long Beach sees less traffic, then a reduced demand for warehouse in Southern California will also affect demand in Phoenix.
Proximity and discount to California Phoenix is close to Southern California’s huge and expensive market. Los Angeles has had sustained industrial vacancy below 3.0%. Many firms migrate from Los Angeles to find less expensive labor, real estate, and cost of doing business. There is still an enormous price gap between the two, which will exist regardless of the economic cycle. Phoenix has affordable labor and cheap sustainable energy Phoenix’s manufacturing strengths are an experienced, low-cost workforce and abundant, inexpensive electricity from hydroelectric, nuclear, and solar plants. While it is located in a desert, the city has abundant water resources. The transition of land use from agriculture in the first half of the 20th century to homes and industry today means that Phoenix uses less water now than it did in 1957. 21st Century megaprojects and mid-term goals Phoenix recently announced four large projects: a $12 billion microchip factory from TASC, a $1.2 billion natural gas refinery project, an autonomous truck factory for Nikola, and an electric car factory for Lucid. If any of these four projects are successful, they will create ecosystems of suppliers and absorb millions of square feet in warehouse, manufacturing, and flex space.
The majority of new buildings in Phoenix’s industrial pipeline are warehouse/distribution buildings. With eCommerce
driving much of the demand, it is safe to say that supply will continue to be warehouse heavy, but with a good spec/BTS
balance to maintain a healthy supply.
Phoenix was badly burned by overbuilding of both housing and commercial buildings prior to the GFC. The following decade saw a constrained and disciplined pipeline for industrial buildings, with a larger proportion of BTS space. This narrowed pipeline kept vacancy low and pre-leasing high. The speculative construction in Phoenix is based in areas that we believe will grow regardless of the economic cycle.
Source: Cushman & Wakefield Research, American Community Survey (2019), Association of American Railroads (2019), Site Selection Magazine (2020)*Compares prior 2-years of total leasing activity entering the GFC (Q4 2005-Q4 2007) vs. COVID-19 (Q1 2018-Q1 2020)
PHOENIX NEW INDUSTRIAL BUILDING DELIVERIES
0
2
4
6
8
10
12
14
200
2
200
3
200
4
200
5
200
6
200
7
200
8
200
9
2010
2011
2012
2013
2014
2015
2016
2017
2018
2019
2020
MS
F Historical Average = 5.9 MSF
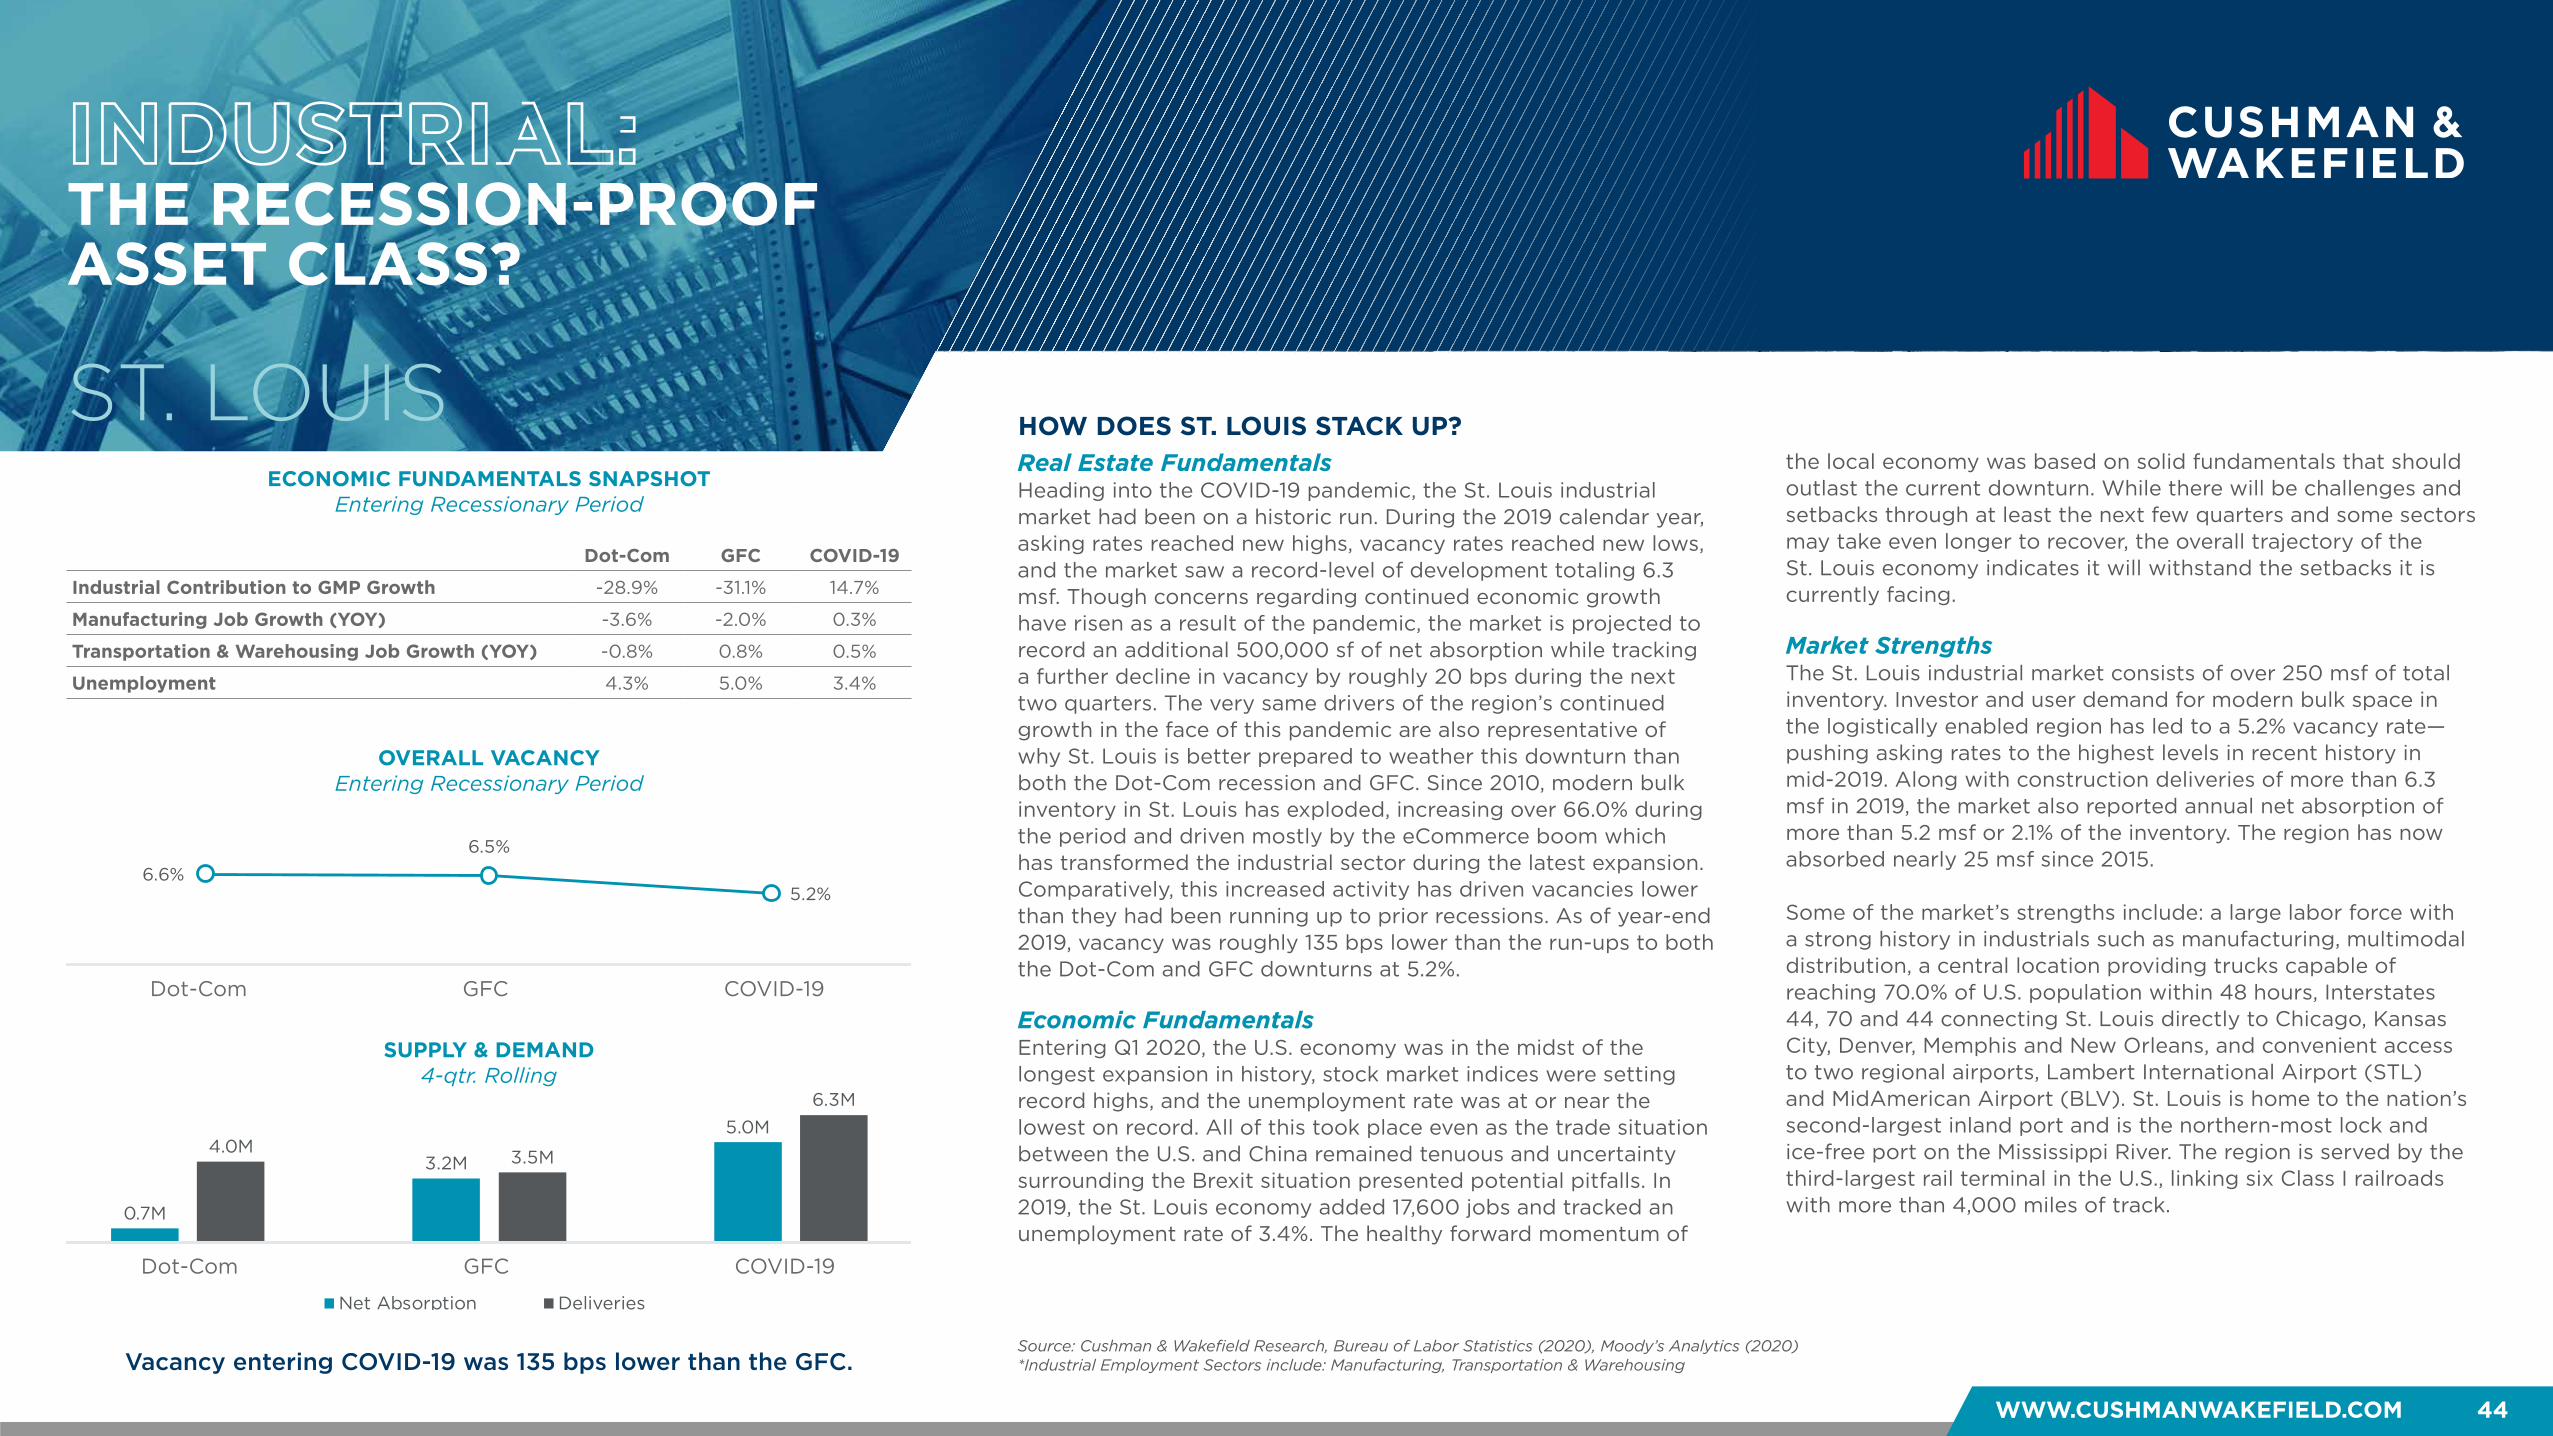
WWW.CUSHMANWAKEFIELD.COM 44
INDUSTRIAL: THE RECESSION-PROOF ASSET CLASS?
HOW DOES ST. LOUIS STACK UP?ST. LOUIS
Vacancy entering COVID-19 was 135 bps lower than the GFC.
Real Estate FundamentalsHeading into the COVID-19 pandemic, the St. Louis industrial market had been on a historic run. During the 2019 calendar year, asking rates reached new highs, vacancy rates reached new lows, and the market saw a record-level of development totaling 6.3 msf. Though concerns regarding continued economic growth have risen as a result of the pandemic, the market is projected to record an additional 500,000 sf of net absorption while tracking a further decline in vacancy by roughly 20 bps during the next two quarters. The very same drivers of the region’s continued growth in the face of this pandemic are also representative of why St. Louis is better prepared to weather this downturn than both the Dot-Com recession and GFC. Since 2010, modern bulk inventory in St. Louis has exploded, increasing over 66.0% during the period and driven mostly by the eCommerce boom which has transformed the industrial sector during the latest expansion. Comparatively, this increased activity has driven vacancies lower than they had been running up to prior recessions. As of year-end 2019, vacancy was roughly 135 bps lower than the run-ups to both the Dot-Com and GFC downturns at 5.2%.
Economic FundamentalsEntering Q1 2020, the U.S. economy was in the midst of the longest expansion in history, stock market indices were setting record highs, and the unemployment rate was at or near the lowest on record. All of this took place even as the trade situation between the U.S. and China remained tenuous and uncertainty surrounding the Brexit situation presented potential pitfalls. In 2019, the St. Louis economy added 17,600 jobs and tracked an unemployment rate of 3.4%. The healthy forward momentum of
the local economy was based on solid fundamentals that should outlast the current downturn. While there will be challenges and setbacks through at least the next few quarters and some sectors may take even longer to recover, the overall trajectory of the St. Louis economy indicates it will withstand the setbacks it is currently facing.
Market StrengthsThe St. Louis industrial market consists of over 250 msf of total inventory. Investor and user demand for modern bulk space in the logistically enabled region has led to a 5.2% vacancy rate—pushing asking rates to the highest levels in recent history in mid-2019. Along with construction deliveries of more than 6.3 msf in 2019, the market also reported annual net absorption of more than 5.2 msf or 2.1% of the inventory. The region has now absorbed nearly 25 msf since 2015. Some of the market’s strengths include: a large labor force with a strong history in industrials such as manufacturing, multimodal distribution, a central location providing trucks capable of reaching 70.0% of U.S. population within 48 hours, Interstates 44, 70 and 44 connecting St. Louis directly to Chicago, Kansas City, Denver, Memphis and New Orleans, and convenient access to two regional airports, Lambert International Airport (STL) and MidAmerican Airport (BLV). St. Louis is home to the nation’s second-largest inland port and is the northern-most lock and ice-free port on the Mississippi River. The region is served by the third-largest rail terminal in the U.S., linking six Class I railroads with more than 4,000 miles of track.
Source: Cushman & Wakefield Research, Bureau of Labor Statistics (2020), Moody’s Analytics (2020)*Industrial Employment Sectors include: Manufacturing, Transportation & Warehousing
ECONOMIC FUNDAMENTALS SNAPSHOTEntering Recessionary Period
OVERALL VACANCYEntering Recessionary Period
SUPPLY & DEMAND 4-qtr. Rolling
Dot-Com GFC COVID-19
Industrial Contribution to GMP Growth -28.9% -31.1% 14.7%
Manufacturing Job Growth (YOY) -3.6% -2.0% 0.3%
Transportation & Warehousing Job Growth (YOY) -0.8% 0.8% 0.5%
Unemployment 4.3% 5.0% 3.4%
6.6%
6.5%
5.2%
Dot Com Financial Crisis COVID-19
0.7M
3.2M
5.0M4.0M 3.5M
6.3M
Dot Com Financial Crisis COVID-19
Net Absorption Deliveries
Dot-Com GFC COVID-19
Dot-Com GFC COVID-19
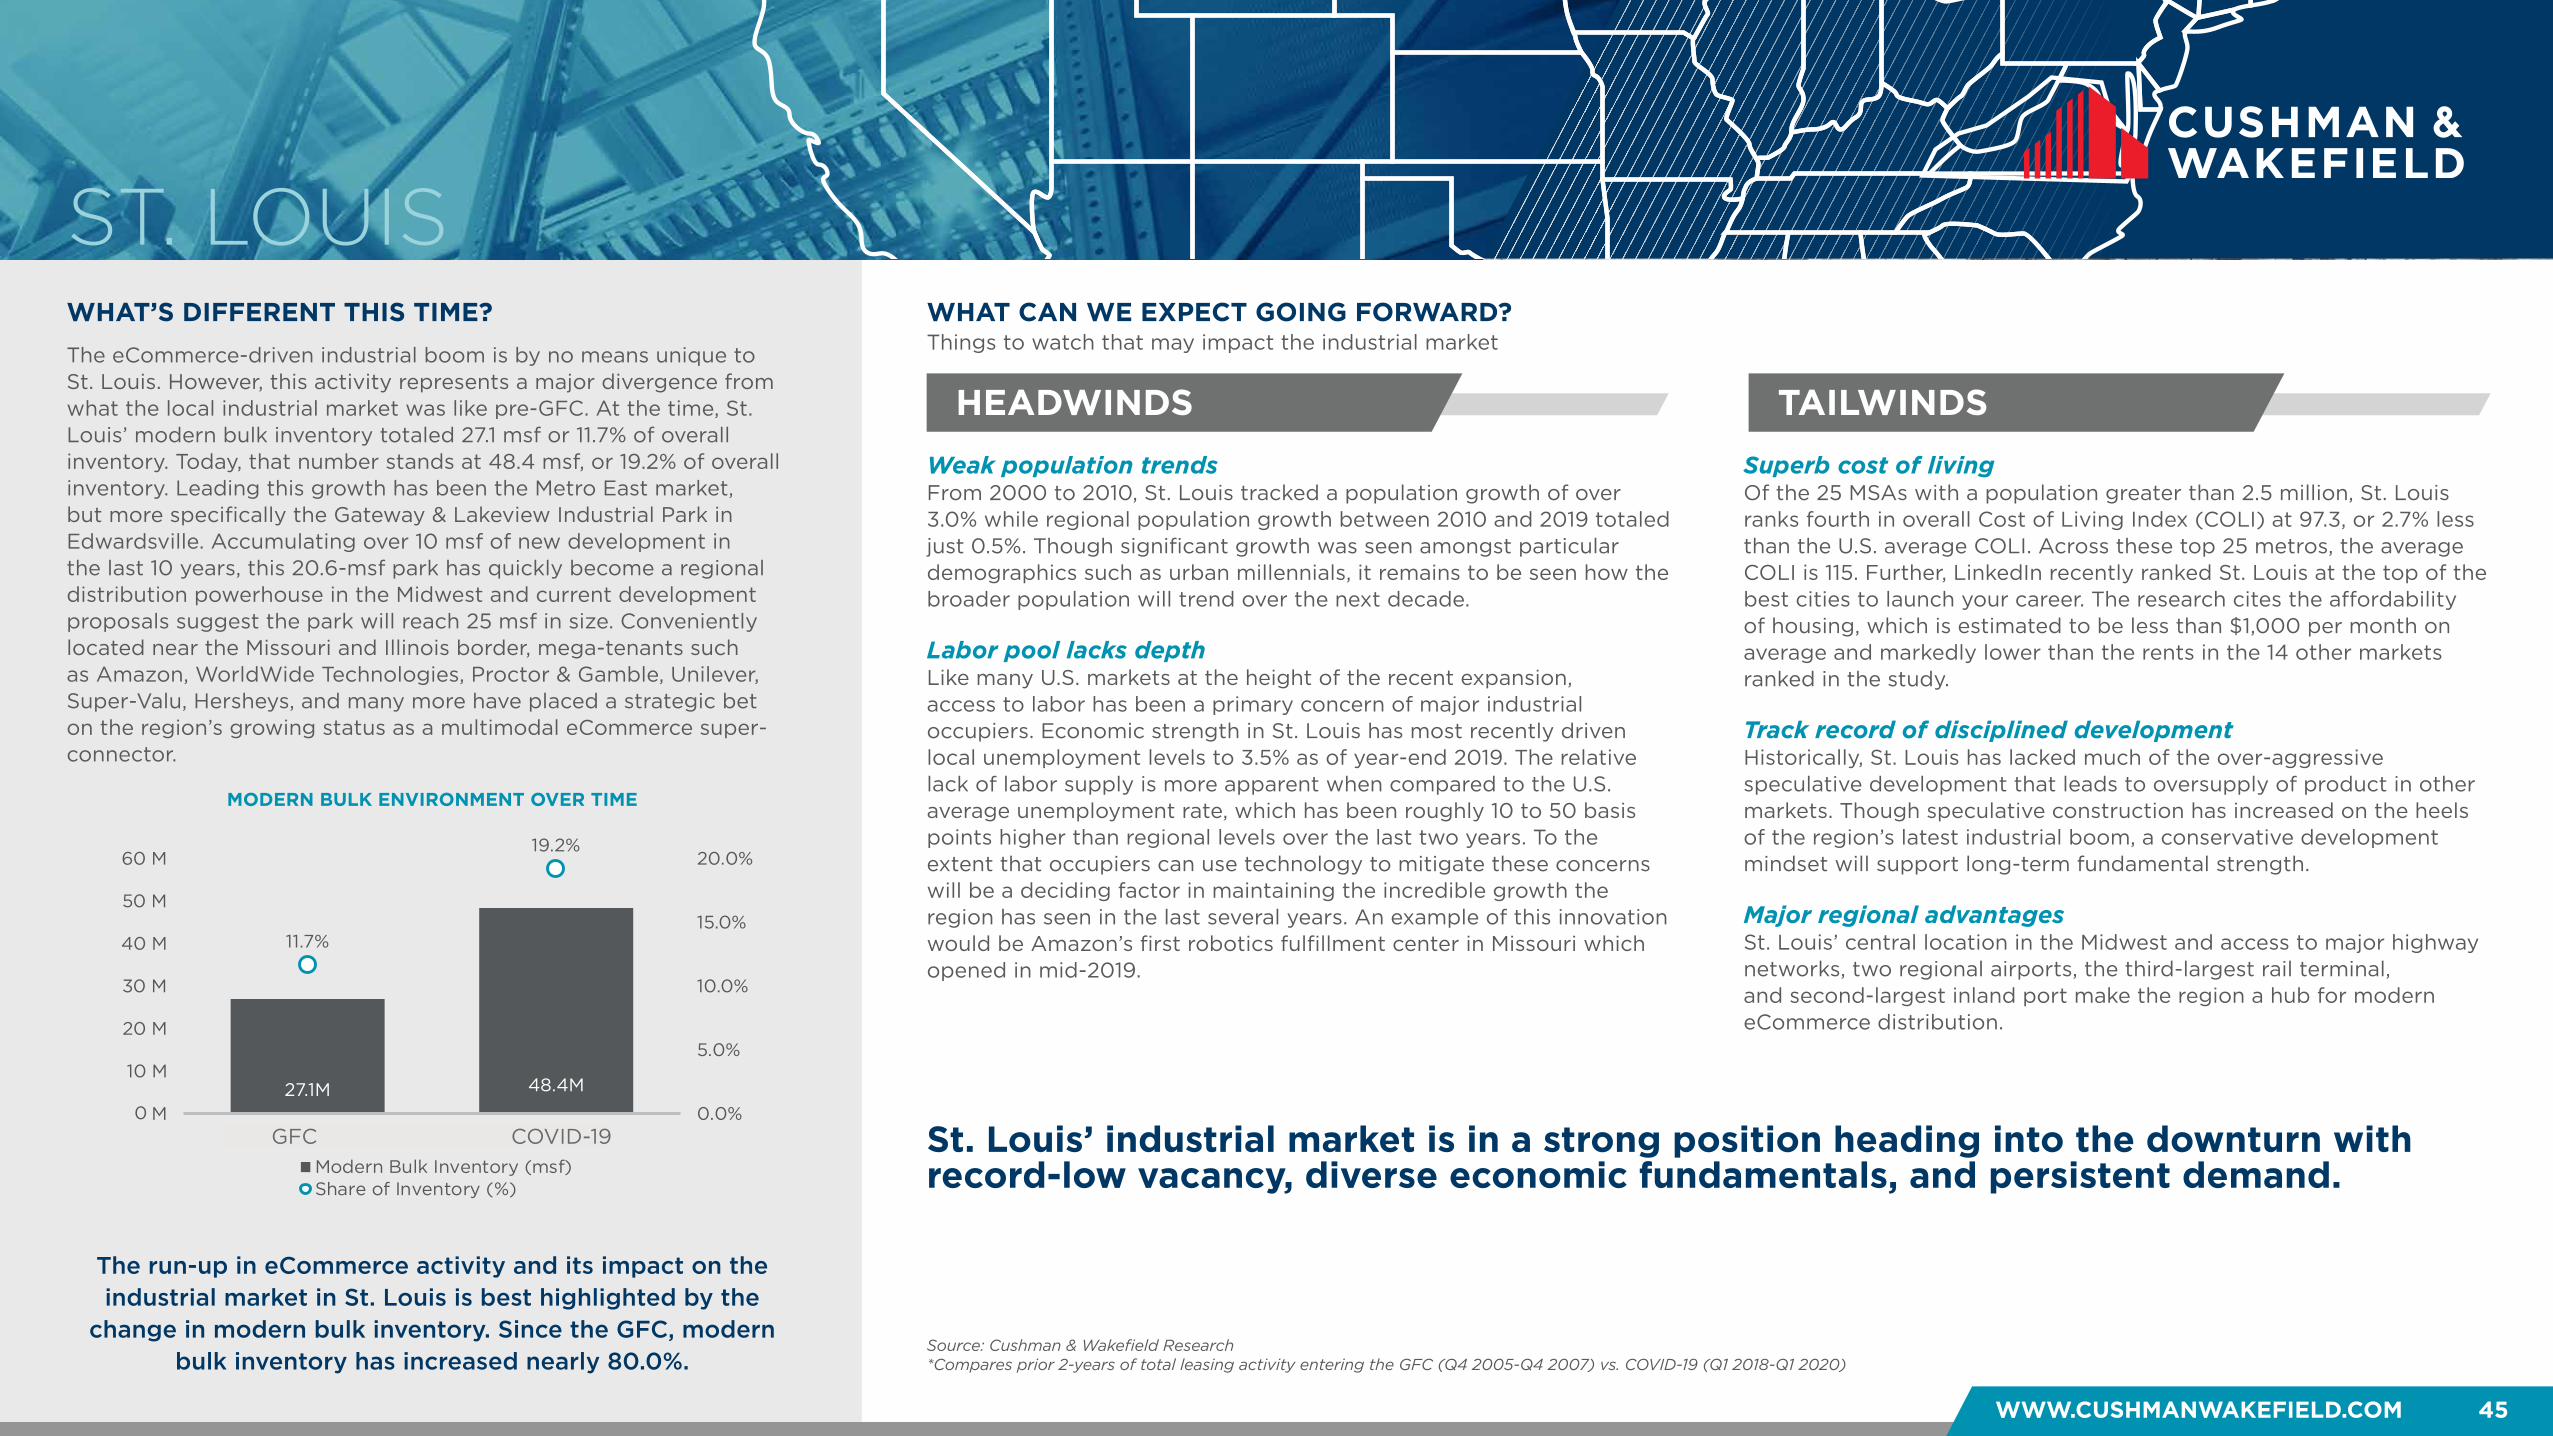
WHAT’S DIFFERENT THIS TIME?
HEADWINDS TAILWINDS
WHAT CAN WE EXPECT GOING FORWARD?
WWW.CUSHMANWAKEFIELD.COM 45
Things to watch that may impact the industrial market
ST. LOUIS
St. Louis’ industrial market is in a strong position heading into the downturn with record-low vacancy, diverse economic fundamentals, and persistent demand.
Weak population trendsFrom 2000 to 2010, St. Louis tracked a population growth of over 3.0% while regional population growth between 2010 and 2019 totaled just 0.5%. Though significant growth was seen amongst particular demographics such as urban millennials, it remains to be seen how the broader population will trend over the next decade.
Labor pool lacks depth Like many U.S. markets at the height of the recent expansion, access to labor has been a primary concern of major industrial occupiers. Economic strength in St. Louis has most recently driven local unemployment levels to 3.5% as of year-end 2019. The relative lack of labor supply is more apparent when compared to the U.S. average unemployment rate, which has been roughly 10 to 50 basis points higher than regional levels over the last two years. To the extent that occupiers can use technology to mitigate these concerns will be a deciding factor in maintaining the incredible growth the region has seen in the last several years. An example of this innovation would be Amazon’s first robotics fulfillment center in Missouri which opened in mid-2019.
Superb cost of livingOf the 25 MSAs with a population greater than 2.5 million, St. Louis ranks fourth in overall Cost of Living Index (COLI) at 97.3, or 2.7% less than the U.S. average COLI. Across these top 25 metros, the average COLI is 115. Further, LinkedIn recently ranked St. Louis at the top of the best cities to launch your career. The research cites the affordability of housing, which is estimated to be less than $1,000 per month on average and markedly lower than the rents in the 14 other markets ranked in the study.
Track record of disciplined developmentHistorically, St. Louis has lacked much of the over-aggressive speculative development that leads to oversupply of product in other markets. Though speculative construction has increased on the heels of the region’s latest industrial boom, a conservative development mindset will support long-term fundamental strength.
Major regional advantagesSt. Louis’ central location in the Midwest and access to major highway networks, two regional airports, the third-largest rail terminal, and second-largest inland port make the region a hub for modern eCommerce distribution.
The run-up in eCommerce activity and its impact on the industrial market in St. Louis is best highlighted by the
change in modern bulk inventory. Since the GFC, modern bulk inventory has increased nearly 80.0%.
The eCommerce-driven industrial boom is by no means unique to St. Louis. However, this activity represents a major divergence from what the local industrial market was like pre-GFC. At the time, St. Louis’ modern bulk inventory totaled 27.1 msf or 11.7% of overall inventory. Today, that number stands at 48.4 msf, or 19.2% of overall inventory. Leading this growth has been the Metro East market, but more specifically the Gateway & Lakeview Industrial Park in Edwardsville. Accumulating over 10 msf of new development in the last 10 years, this 20.6-msf park has quickly become a regional distribution powerhouse in the Midwest and current development proposals suggest the park will reach 25 msf in size. Conveniently located near the Missouri and Illinois border, mega-tenants such as Amazon, WorldWide Technologies, Proctor & Gamble, Unilever, Super-Valu, Hersheys, and many more have placed a strategic bet on the region’s growing status as a multimodal eCommerce super-connector.
Source: Cushman & Wakefield Research*Compares prior 2-years of total leasing activity entering the GFC (Q4 2005-Q4 2007) vs. COVID-19 (Q1 2018-Q1 2020)
MODERN BULK ENVIRONMENT OVER TIME
27.1M 48.4M
11.7%
19.2%
0.0%
5.0%
10.0%
15.0%
20.0%
M
10 M
20 M
30 M
40 M
50 M
60 M
Financial Crisis COVID-19
Modern Bulk Inventory (msf)Share of Inventory (%)
0 GFC COVID-19

WWW.CUSHMANWAKEFIELD.COM 46
INDUSTRIAL: THE RECESSION-PROOF ASSET CLASS?
HOW DOES TAMPA STACK UP?TAMPA
Over 3 msf was delivered in 2019, the most in one year since Cushman & Wakefield started tracking the market in the mid-90s.
Real Estate FundamentalsThe industrial real estate market in Tampa was thriving in the first few months of 2020. Leasing activity in 2019 totaled 3.7 msf. In Q1 2020, recorded leasing activity nearly double the amount recorded in Q1 2019 with over 675,000 sf leased. Over 3 msf of new inventory was added last year followed by an additional 50,000 sf that was delivered in Q1 2020. The pipeline remained robust with 2.6 msf under construction, approximately 70.0% of which is speculative. Overall vacancy decreased in Q1 2020 to 6.2% from year-end 2019 but was up 20 basis points YOY.
Economic FundamentalsTampa’s industrial market fundamentals were solid through Q1 2020 and did not show an immediate impact for business interruptions from COVID-19. Heading into the current downturn, there were 119 months of uninterrupted job growth totaling almost 315,500 new jobs this cycle. Only one month showed job losses due to Hurricane Irma in 2017. As business interruption from the pandemic spread, the region’s employment statistics at the end of Q1 2020 did not show significant job losses, especially from the Leisure and Hospitality sector. Layoffs and furloughs at area hotels and restaurants were more pronounced starting in April with over 77,000 jobs lost YOY, accounting for 60.0% of total job losses.
Market StrengthsTampa’s two main drivers for the industrial market are construction and eCommerce. Strong population growth and influx of out-of-state residents to the area supported robust construction in the housing and commercial sectors. Tampa was at the height of an industrial development boom when COVID-19 struck. In 2019, approximately 3.4 msf of warehouse/distribution space was delivered, the most new construction in a single year since Cushman & Wakefield began tracking the market in the mid-90’s. With the rise of eCommerce, Tampa solidified its position as a logistics hub for large national and regional firms to relocate due to abundant labor options and an extensive logistics network to markets throughout the Southeast.
Source: Cushman & Wakefield Research, Bureau of Labor Statistics (2020), Moody’s Analytics (2020), Visit Tampa Bay (2019), Florida Jobs June 2020
ECONOMIC FUNDAMENTALS SNAPSHOTEntering Recessionary Period
OVERALL VACANCYEntering Recessionary Period
SUPPLY & DEMAND 4-qtr. Rolling
Dot-Com GFC COVID-19
Labor Force (000) 591.3 645.9 717.2
Labor Force Job Growth (000, YOY) 20.9 16.2 22.7
Transportation & Warehousing Job Growth (YOY) -1.3% -7.0% -0.1%
Unemployment 3.5 4.7 3.3%
-0.5M
1.0M
2.5M
1.5M 1.5M
3.3M
Dot Com Financial Crisis COVID-19
Net Absorption Deliveries
7.9%
4.0% 6.2%
Dot Com Financial Crisis COVID-19Dot-Com GFC COVID-19
Dot-Com GFC COVID-19
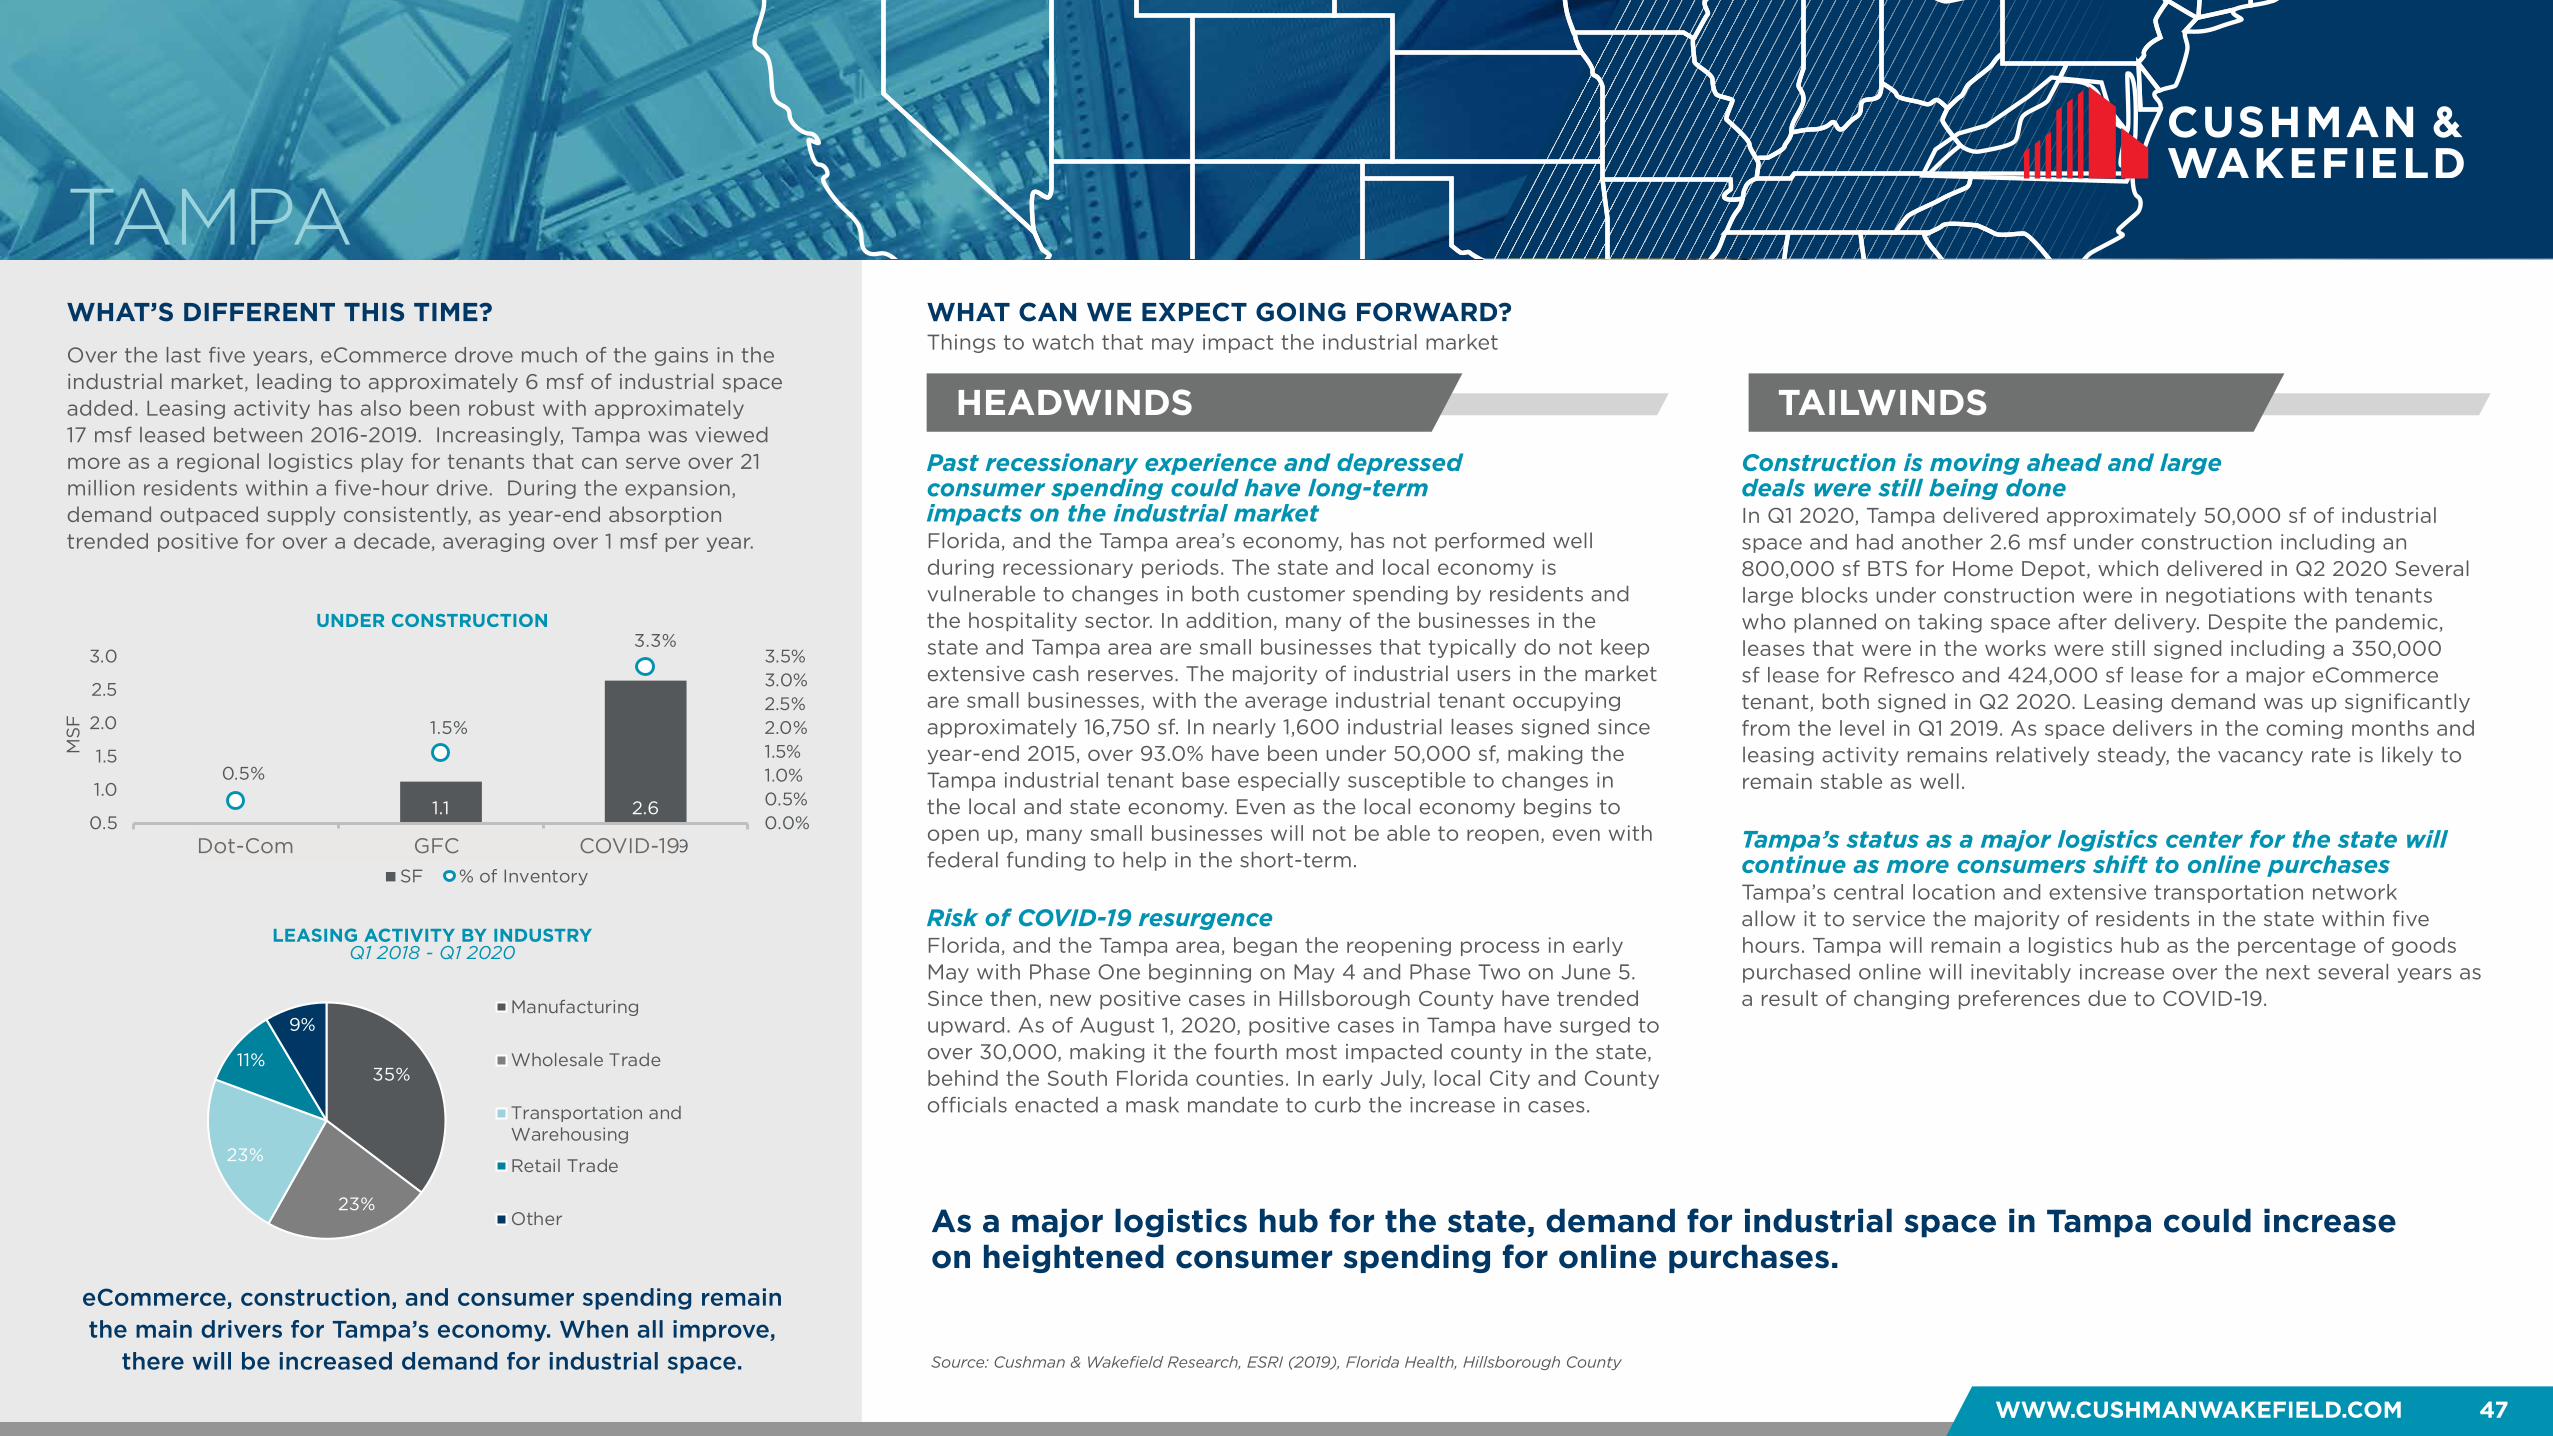
WHAT’S DIFFERENT THIS TIME?
HEADWINDS TAILWINDS
WHAT CAN WE EXPECT GOING FORWARD?
WWW.CUSHMANWAKEFIELD.COM 47
Things to watch that may impact the industrial market
TAMPA
As a major logistics hub for the state, demand for industrial space in Tampa could increase on heightened consumer spending for online purchases.
Past recessionary experience and depressed consumer spending could have long-term impacts on the industrial market Florida, and the Tampa area’s economy, has not performed well during recessionary periods. The state and local economy is vulnerable to changes in both customer spending by residents and the hospitality sector. In addition, many of the businesses in the state and Tampa area are small businesses that typically do not keep extensive cash reserves. The majority of industrial users in the market are small businesses, with the average industrial tenant occupying approximately 16,750 sf. In nearly 1,600 industrial leases signed since year-end 2015, over 93.0% have been under 50,000 sf, making the Tampa industrial tenant base especially susceptible to changes in the local and state economy. Even as the local economy begins to open up, many small businesses will not be able to reopen, even with federal funding to help in the short-term. Risk of COVID-19 resurgence Florida, and the Tampa area, began the reopening process in early May with Phase One beginning on May 4 and Phase Two on June 5. Since then, new positive cases in Hillsborough County have trended upward. As of August 1, 2020, positive cases in Tampa have surged to over 30,000, making it the fourth most impacted county in the state, behind the South Florida counties. In early July, local City and County officials enacted a mask mandate to curb the increase in cases.
Construction is moving ahead and large deals were still being done In Q1 2020, Tampa delivered approximately 50,000 sf of industrial space and had another 2.6 msf under construction including an 800,000 sf BTS for Home Depot, which delivered in Q2 2020 Several large blocks under construction were in negotiations with tenants who planned on taking space after delivery. Despite the pandemic, leases that were in the works were still signed including a 350,000 sf lease for Refresco and 424,000 sf lease for a major eCommerce tenant, both signed in Q2 2020. Leasing demand was up significantly from the level in Q1 2019. As space delivers in the coming months and leasing activity remains relatively steady, the vacancy rate is likely to remain stable as well. Tampa’s status as a major logistics center for the state will continue as more consumers shift to online purchases Tampa’s central location and extensive transportation network allow it to service the majority of residents in the state within five hours. Tampa will remain a logistics hub as the percentage of goods purchased online will inevitably increase over the next several years as a result of changing preferences due to COVID-19.
eCommerce, construction, and consumer spending remain the main drivers for Tampa’s economy. When all improve,
there will be increased demand for industrial space.
Over the last five years, eCommerce drove much of the gains in the industrial market, leading to approximately 6 msf of industrial space added. Leasing activity has also been robust with approximately 17 msf leased between 2016-2019. Increasingly, Tampa was viewed more as a regional logistics play for tenants that can serve over 21 million residents within a five-hour drive. During the expansion, demand outpaced supply consistently, as year-end absorption trended positive for over a decade, averaging over 1 msf per year.
Source: Cushman & Wakefield Research, ESRI (2019), Florida Health, Hillsborough County
UNDER CONSTRUCTION
1.1 2.6
0.5%
1.5%
3.3%
0.0%0.5%1.0%1.5%2.0%2.5%3.0%3.5%
0.5
1.0
1.5
2.0
2.5
3.0
Dot Com Financial Crisis COVID-19
Mill
ion
s
SF % of Inventory
MS
F
LEASING ACTIVITY BY INDUSTRY Q1 2018 - Q1 2020
35%
23%
23%
11%
9%Manufacturing
Wholesale Trade
Transportation andWarehousing
Retail Trade
Other
Dot-Com GFC COVID-19
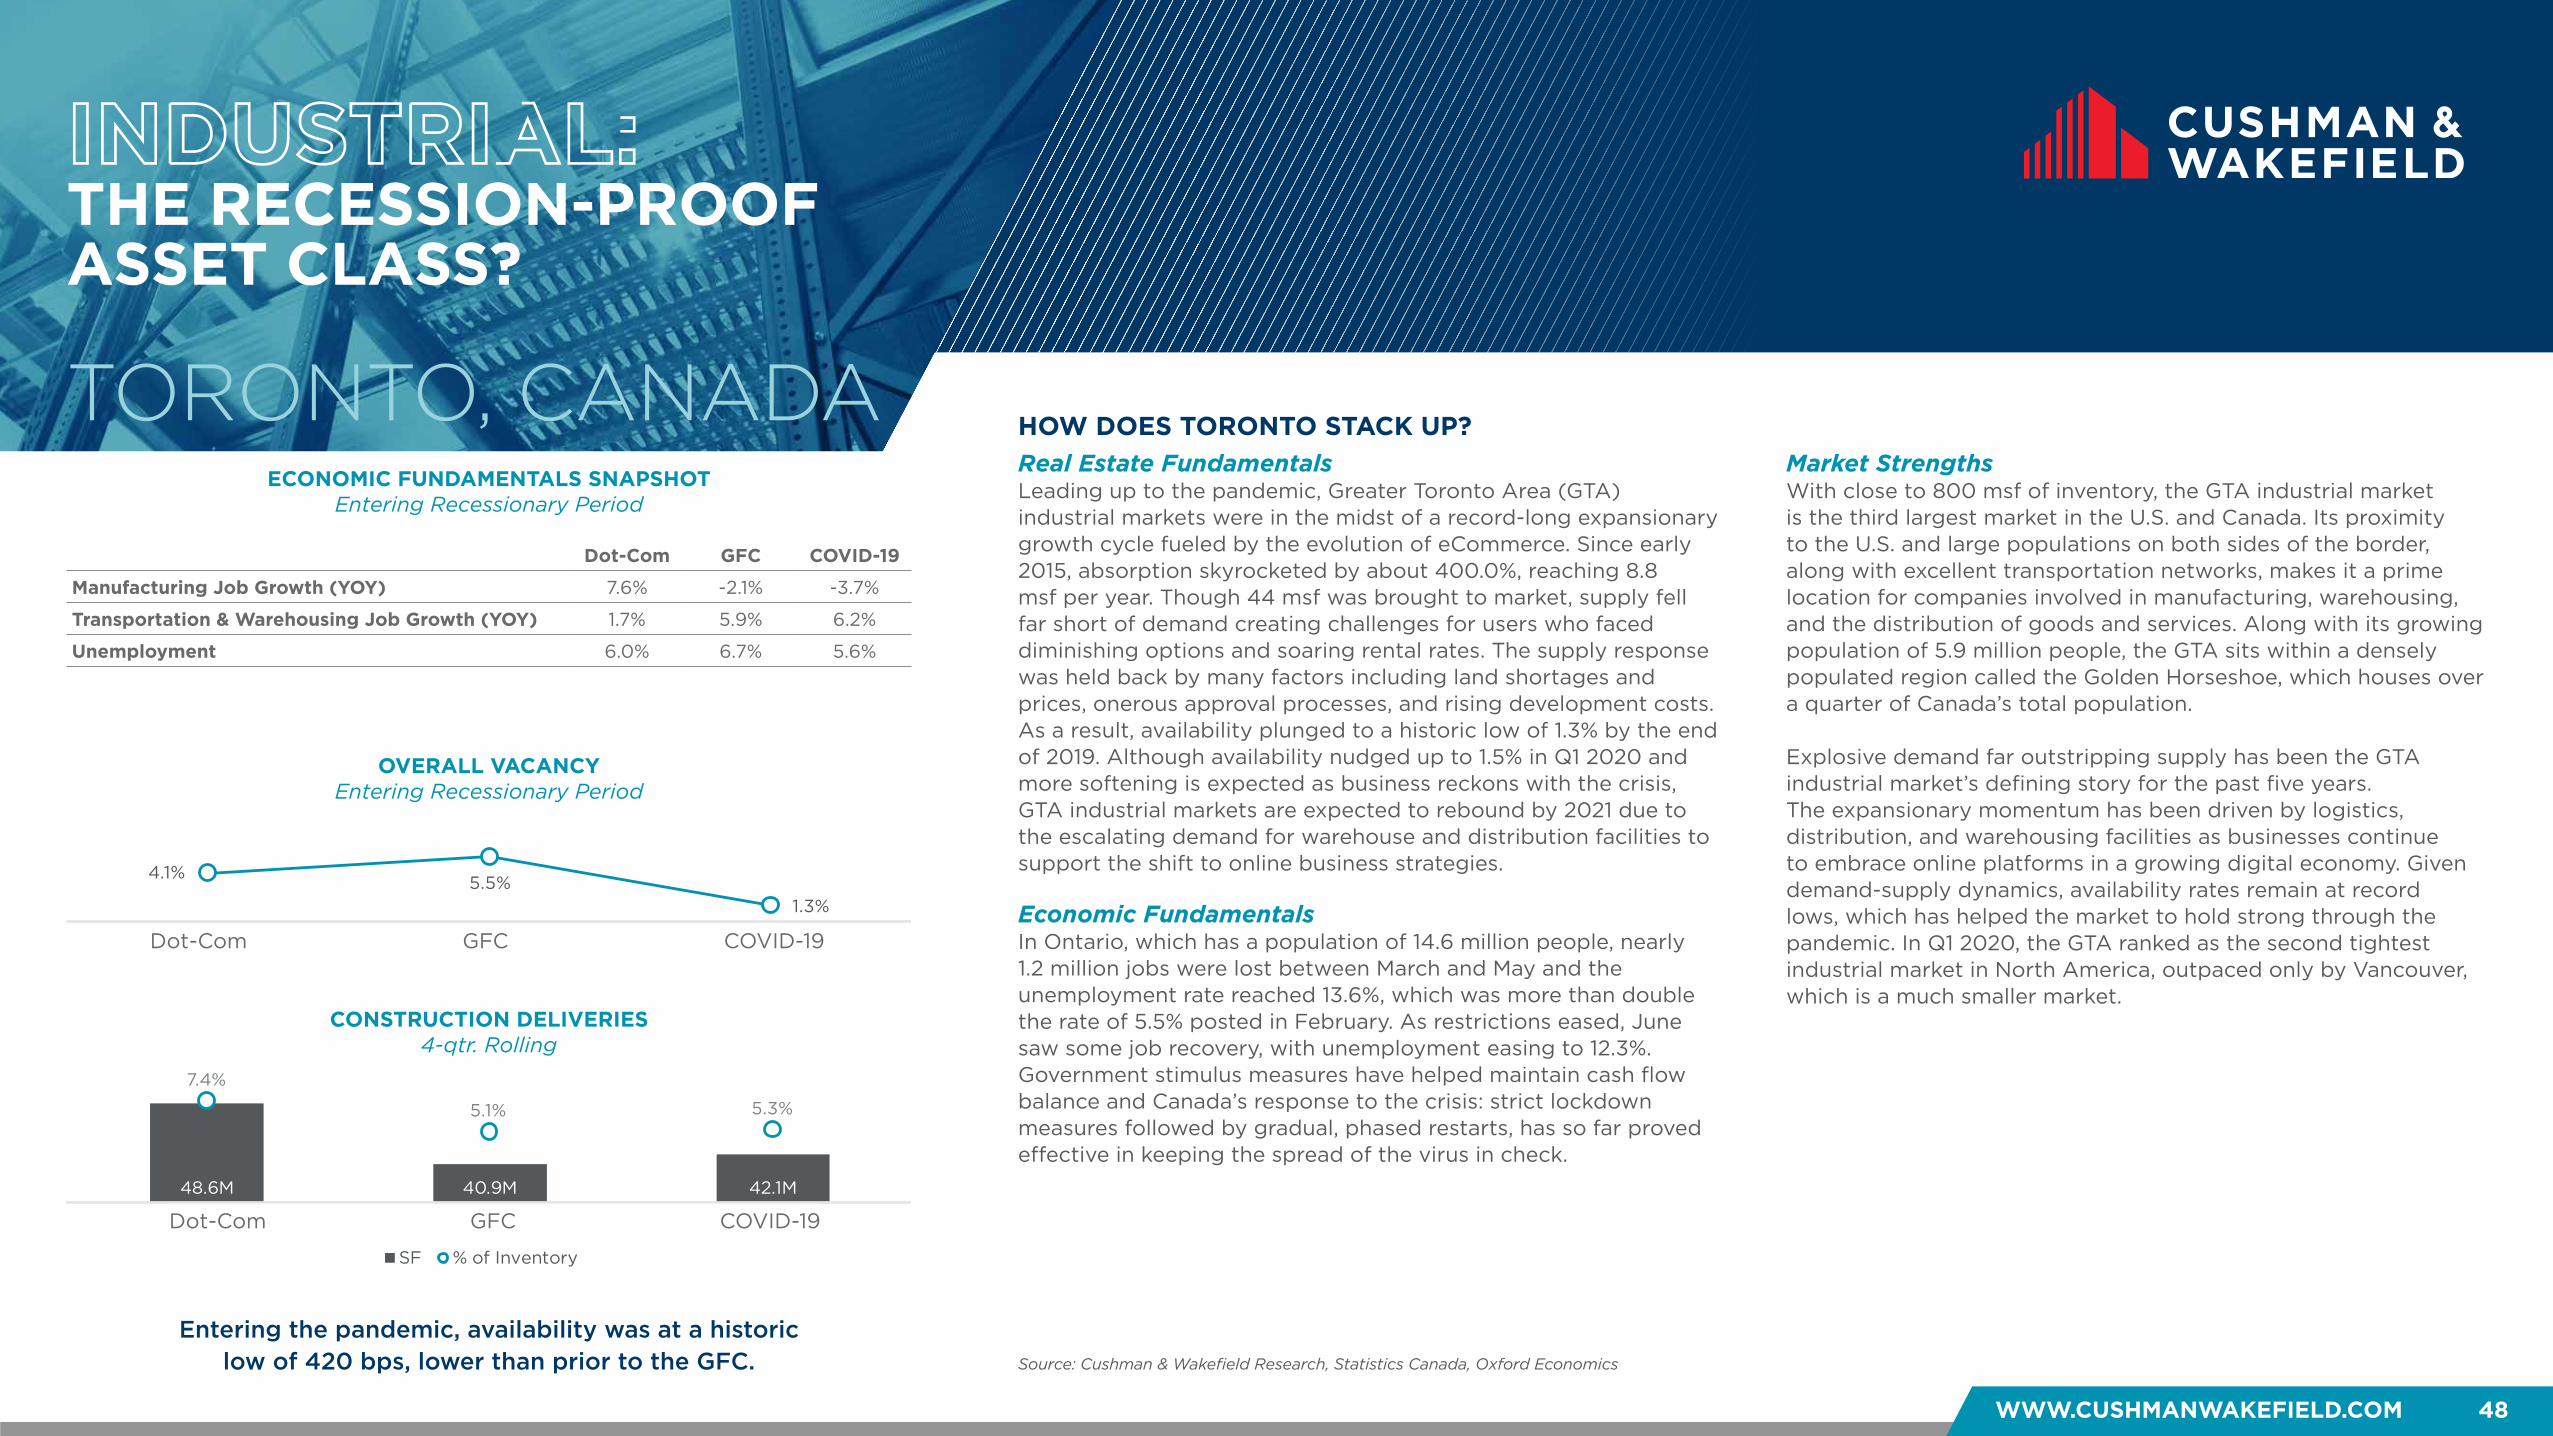
WWW.CUSHMANWAKEFIELD.COM 48
INDUSTRIAL: THE RECESSION-PROOF ASSET CLASS?
HOW DOES TORONTO STACK UP?TORONTO, CANADA
Entering the pandemic, availability was at a historic low of 420 bps, lower than prior to the GFC.
Real Estate FundamentalsLeading up to the pandemic, Greater Toronto Area (GTA) industrial markets were in the midst of a record-long expansionary growth cycle fueled by the evolution of eCommerce. Since early 2015, absorption skyrocketed by about 400.0%, reaching 8.8 msf per year. Though 44 msf was brought to market, supply fell far short of demand creating challenges for users who faced diminishing options and soaring rental rates. The supply response was held back by many factors including land shortages and prices, onerous approval processes, and rising development costs. As a result, availability plunged to a historic low of 1.3% by the end of 2019. Although availability nudged up to 1.5% in Q1 2020 and more softening is expected as business reckons with the crisis, GTA industrial markets are expected to rebound by 2021 due to the escalating demand for warehouse and distribution facilities to support the shift to online business strategies.
Economic FundamentalsIn Ontario, which has a population of 14.6 million people, nearly 1.2 million jobs were lost between March and May and the unemployment rate reached 13.6%, which was more than double the rate of 5.5% posted in February. As restrictions eased, June saw some job recovery, with unemployment easing to 12.3%. Government stimulus measures have helped maintain cash flow balance and Canada’s response to the crisis: strict lockdown measures followed by gradual, phased restarts, has so far proved effective in keeping the spread of the virus in check.
Market StrengthsWith close to 800 msf of inventory, the GTA industrial market is the third largest market in the U.S. and Canada. Its proximity to the U.S. and large populations on both sides of the border, along with excellent transportation networks, makes it a prime location for companies involved in manufacturing, warehousing, and the distribution of goods and services. Along with its growing population of 5.9 million people, the GTA sits within a densely populated region called the Golden Horseshoe, which houses over a quarter of Canada’s total population.
Explosive demand far outstripping supply has been the GTA industrial market’s defining story for the past five years. The expansionary momentum has been driven by logistics, distribution, and warehousing facilities as businesses continue to embrace online platforms in a growing digital economy. Given demand-supply dynamics, availability rates remain at record lows, which has helped the market to hold strong through the pandemic. In Q1 2020, the GTA ranked as the second tightest industrial market in North America, outpaced only by Vancouver, which is a much smaller market.
Source: Cushman & Wakefield Research, Statistics Canada, Oxford Economics
ECONOMIC FUNDAMENTALS SNAPSHOTEntering Recessionary Period
OVERALL VACANCYEntering Recessionary Period
CONSTRUCTION DELIVERIES 4-qtr. Rolling
Dot-Com GFC COVID-19
Manufacturing Job Growth (YOY) 7.6% -2.1% -3.7%
Transportation & Warehousing Job Growth (YOY) 1.7% 5.9% 6.2%
Unemployment 6.0% 6.7% 5.6%
4.1% 5.5%1.3%
Dot Com Financial Crisis COVID-19
48.6M 40.9M 42.1M
7.4%
5.1% 5.3%
00.010.020.030.040.050.060.070.08
3600000038000000400000004200000044000000460000004800000050000000
Dot Com Financial Crisis COVID-19
SF % of Inventory
Dot-Com GFC COVID-19
Dot-Com GFC COVID-19
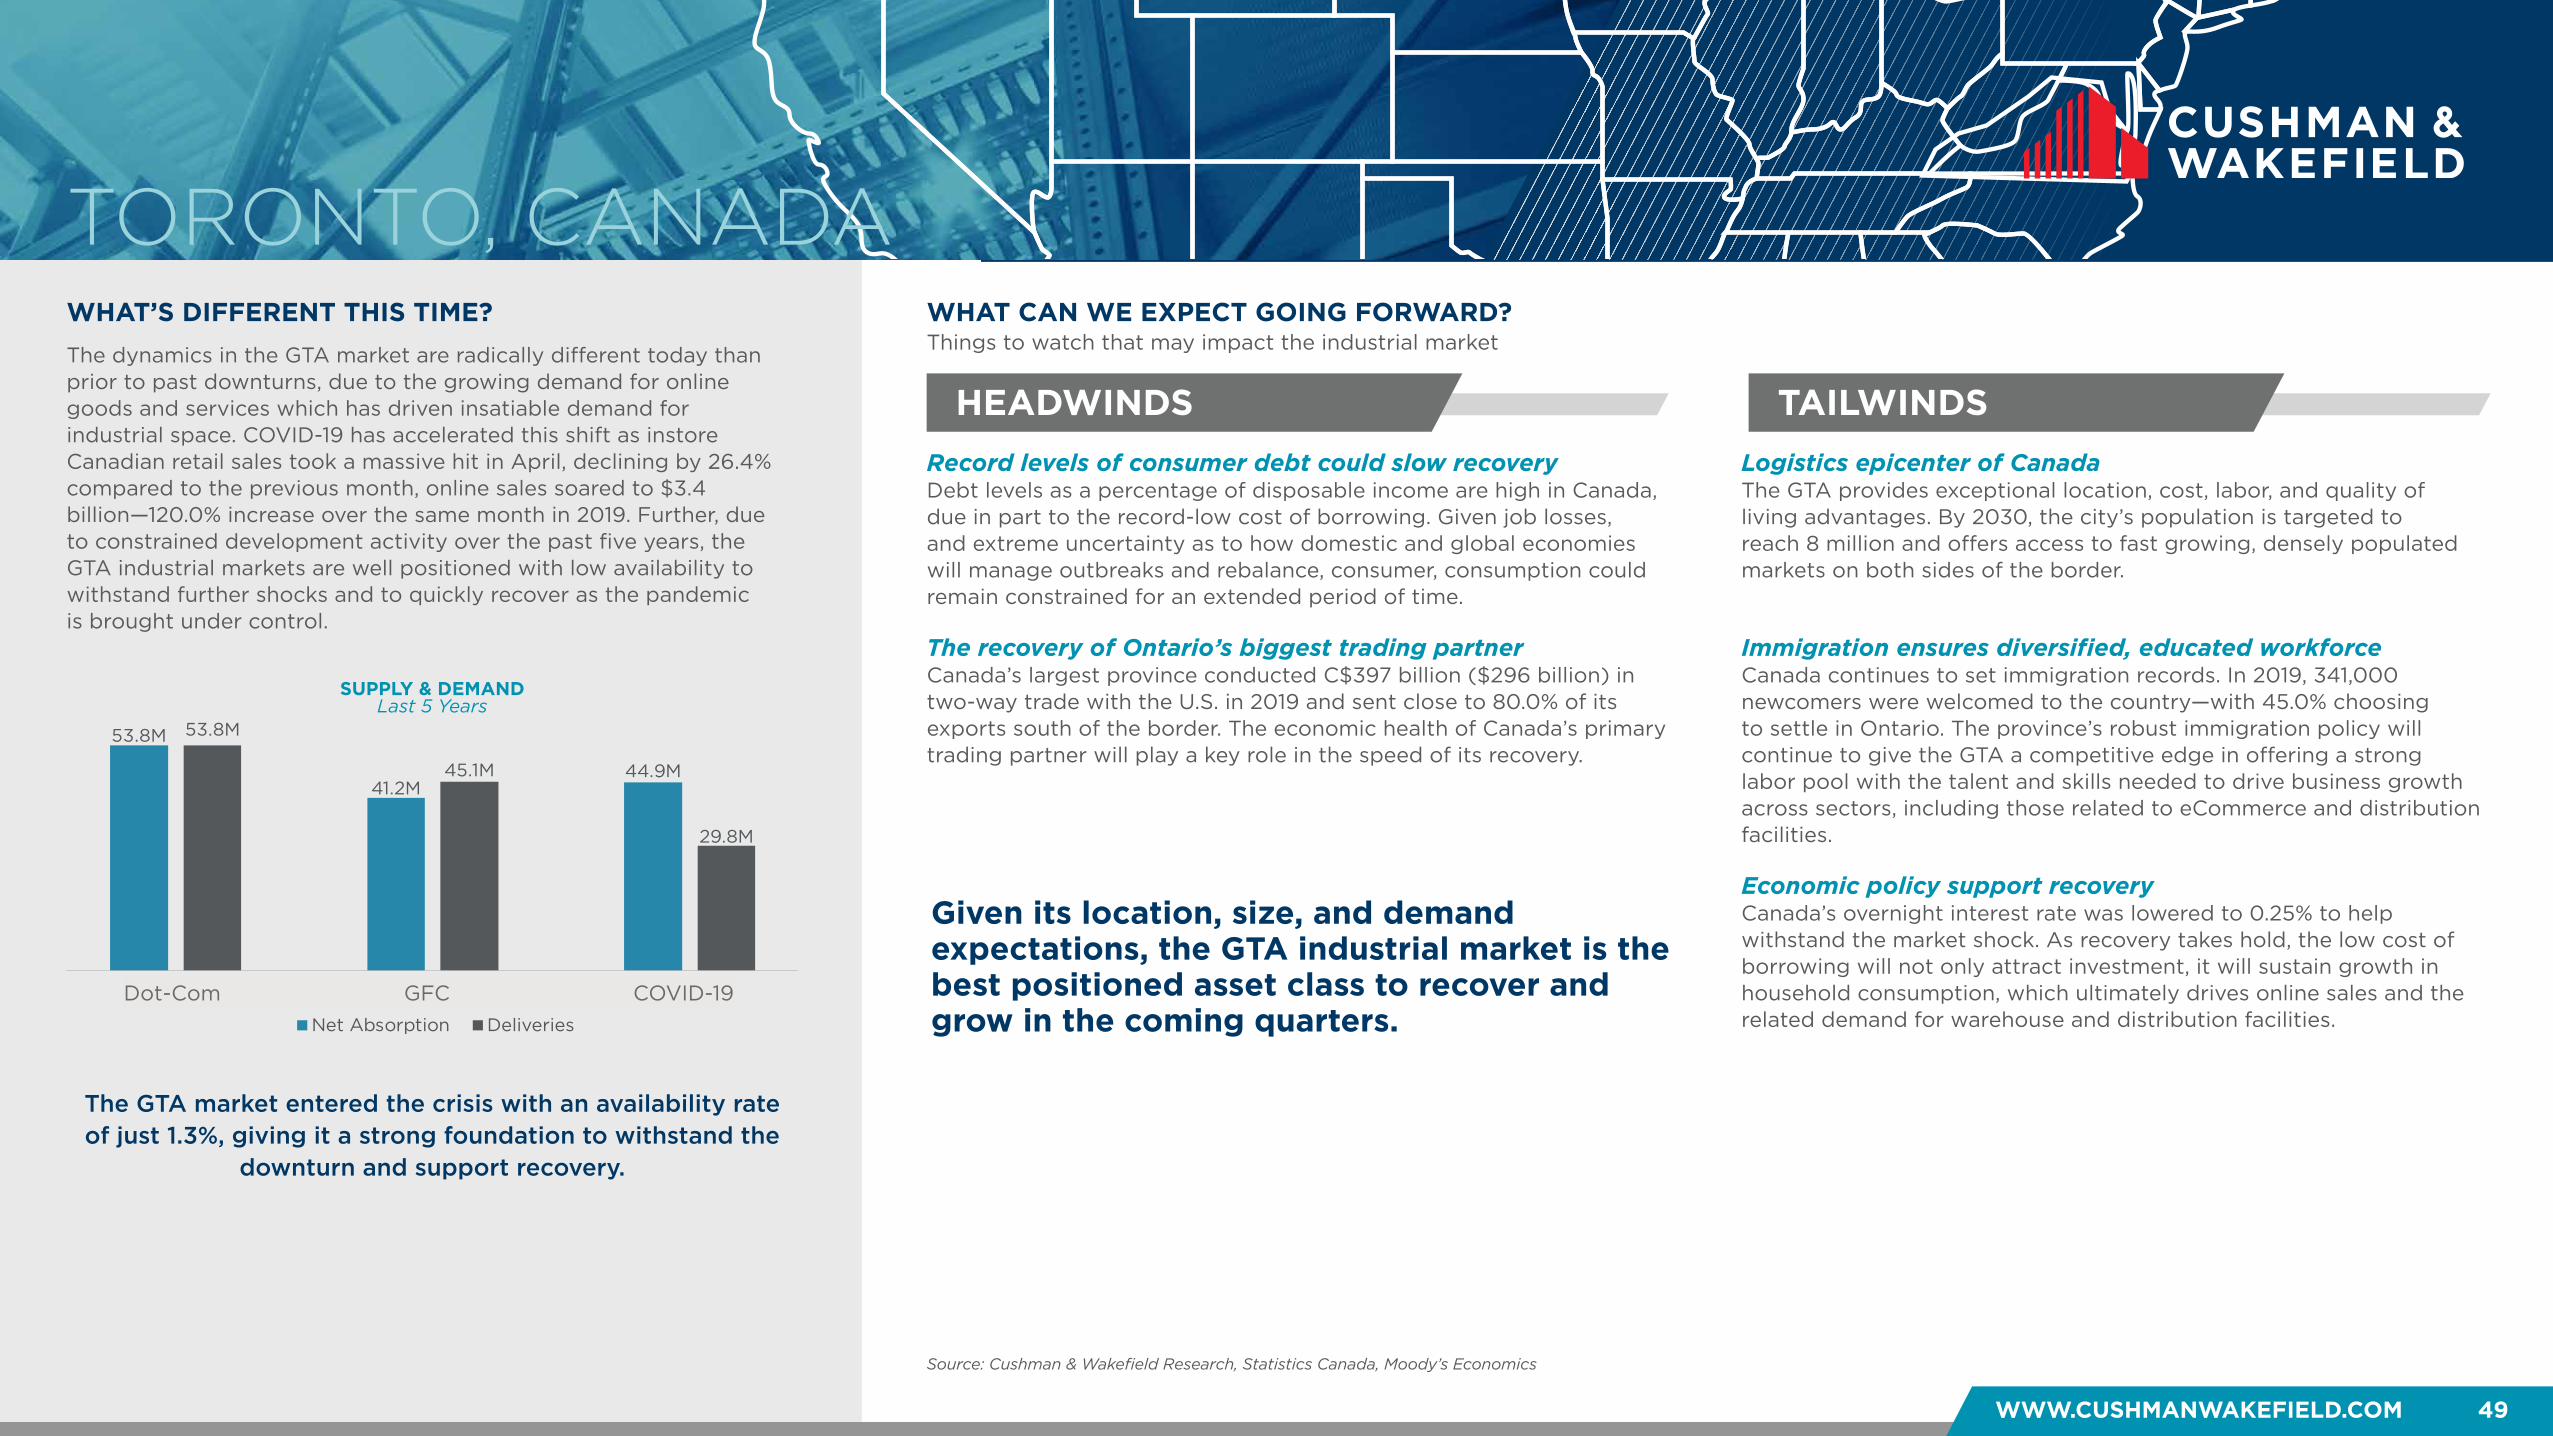
WHAT’S DIFFERENT THIS TIME?
HEADWINDS TAILWINDS
WHAT CAN WE EXPECT GOING FORWARD?
WWW.CUSHMANWAKEFIELD.COM 49
Things to watch that may impact the industrial market
TORONTO, CANADA
Record levels of consumer debt could slow recovery Debt levels as a percentage of disposable income are high in Canada, due in part to the record-low cost of borrowing. Given job losses, and extreme uncertainty as to how domestic and global economies will manage outbreaks and rebalance, consumer, consumption could remain constrained for an extended period of time. The recovery of Ontario’s biggest trading partner Canada’s largest province conducted C$397 billion ($296 billion) in two-way trade with the U.S. in 2019 and sent close to 80.0% of its exports south of the border. The economic health of Canada’s primary trading partner will play a key role in the speed of its recovery.
Logistics epicenter of Canada The GTA provides exceptional location, cost, labor, and quality of living advantages. By 2030, the city’s population is targeted to reach 8 million and offers access to fast growing, densely populated markets on both sides of the border. Immigration ensures diversified, educated workforce Canada continues to set immigration records. In 2019, 341,000 newcomers were welcomed to the country—with 45.0% choosing to settle in Ontario. The province’s robust immigration policy will continue to give the GTA a competitive edge in offering a strong labor pool with the talent and skills needed to drive business growth across sectors, including those related to eCommerce and distribution facilities. Economic policy support recovery Canada’s overnight interest rate was lowered to 0.25% to help withstand the market shock. As recovery takes hold, the low cost of borrowing will not only attract investment, it will sustain growth in household consumption, which ultimately drives online sales and the related demand for warehouse and distribution facilities.
The GTA market entered the crisis with an availability rate of just 1.3%, giving it a strong foundation to withstand the
downturn and support recovery.
The dynamics in the GTA market are radically different today than prior to past downturns, due to the growing demand for online goods and services which has driven insatiable demand for industrial space. COVID-19 has accelerated this shift as instore Canadian retail sales took a massive hit in April, declining by 26.4% compared to the previous month, online sales soared to $3.4 billion—120.0% increase over the same month in 2019. Further, due to constrained development activity over the past five years, the GTA industrial markets are well positioned with low availability to withstand further shocks and to quickly recover as the pandemic is brought under control.
Source: Cushman & Wakefield Research, Statistics Canada, Moody’s Economics
SUPPLY & DEMAND Last 5 Years
53.8M
41.2M44.9M
53.8M
45.1M
29.8M
Dot Com Financial Crisis COVID-19
Net Absorption Deliveries
Dot-Com GFC COVID-19
Given its location, size, and demand expectations, the GTA industrial market is the best positioned asset class to recover and grow in the coming quarters.
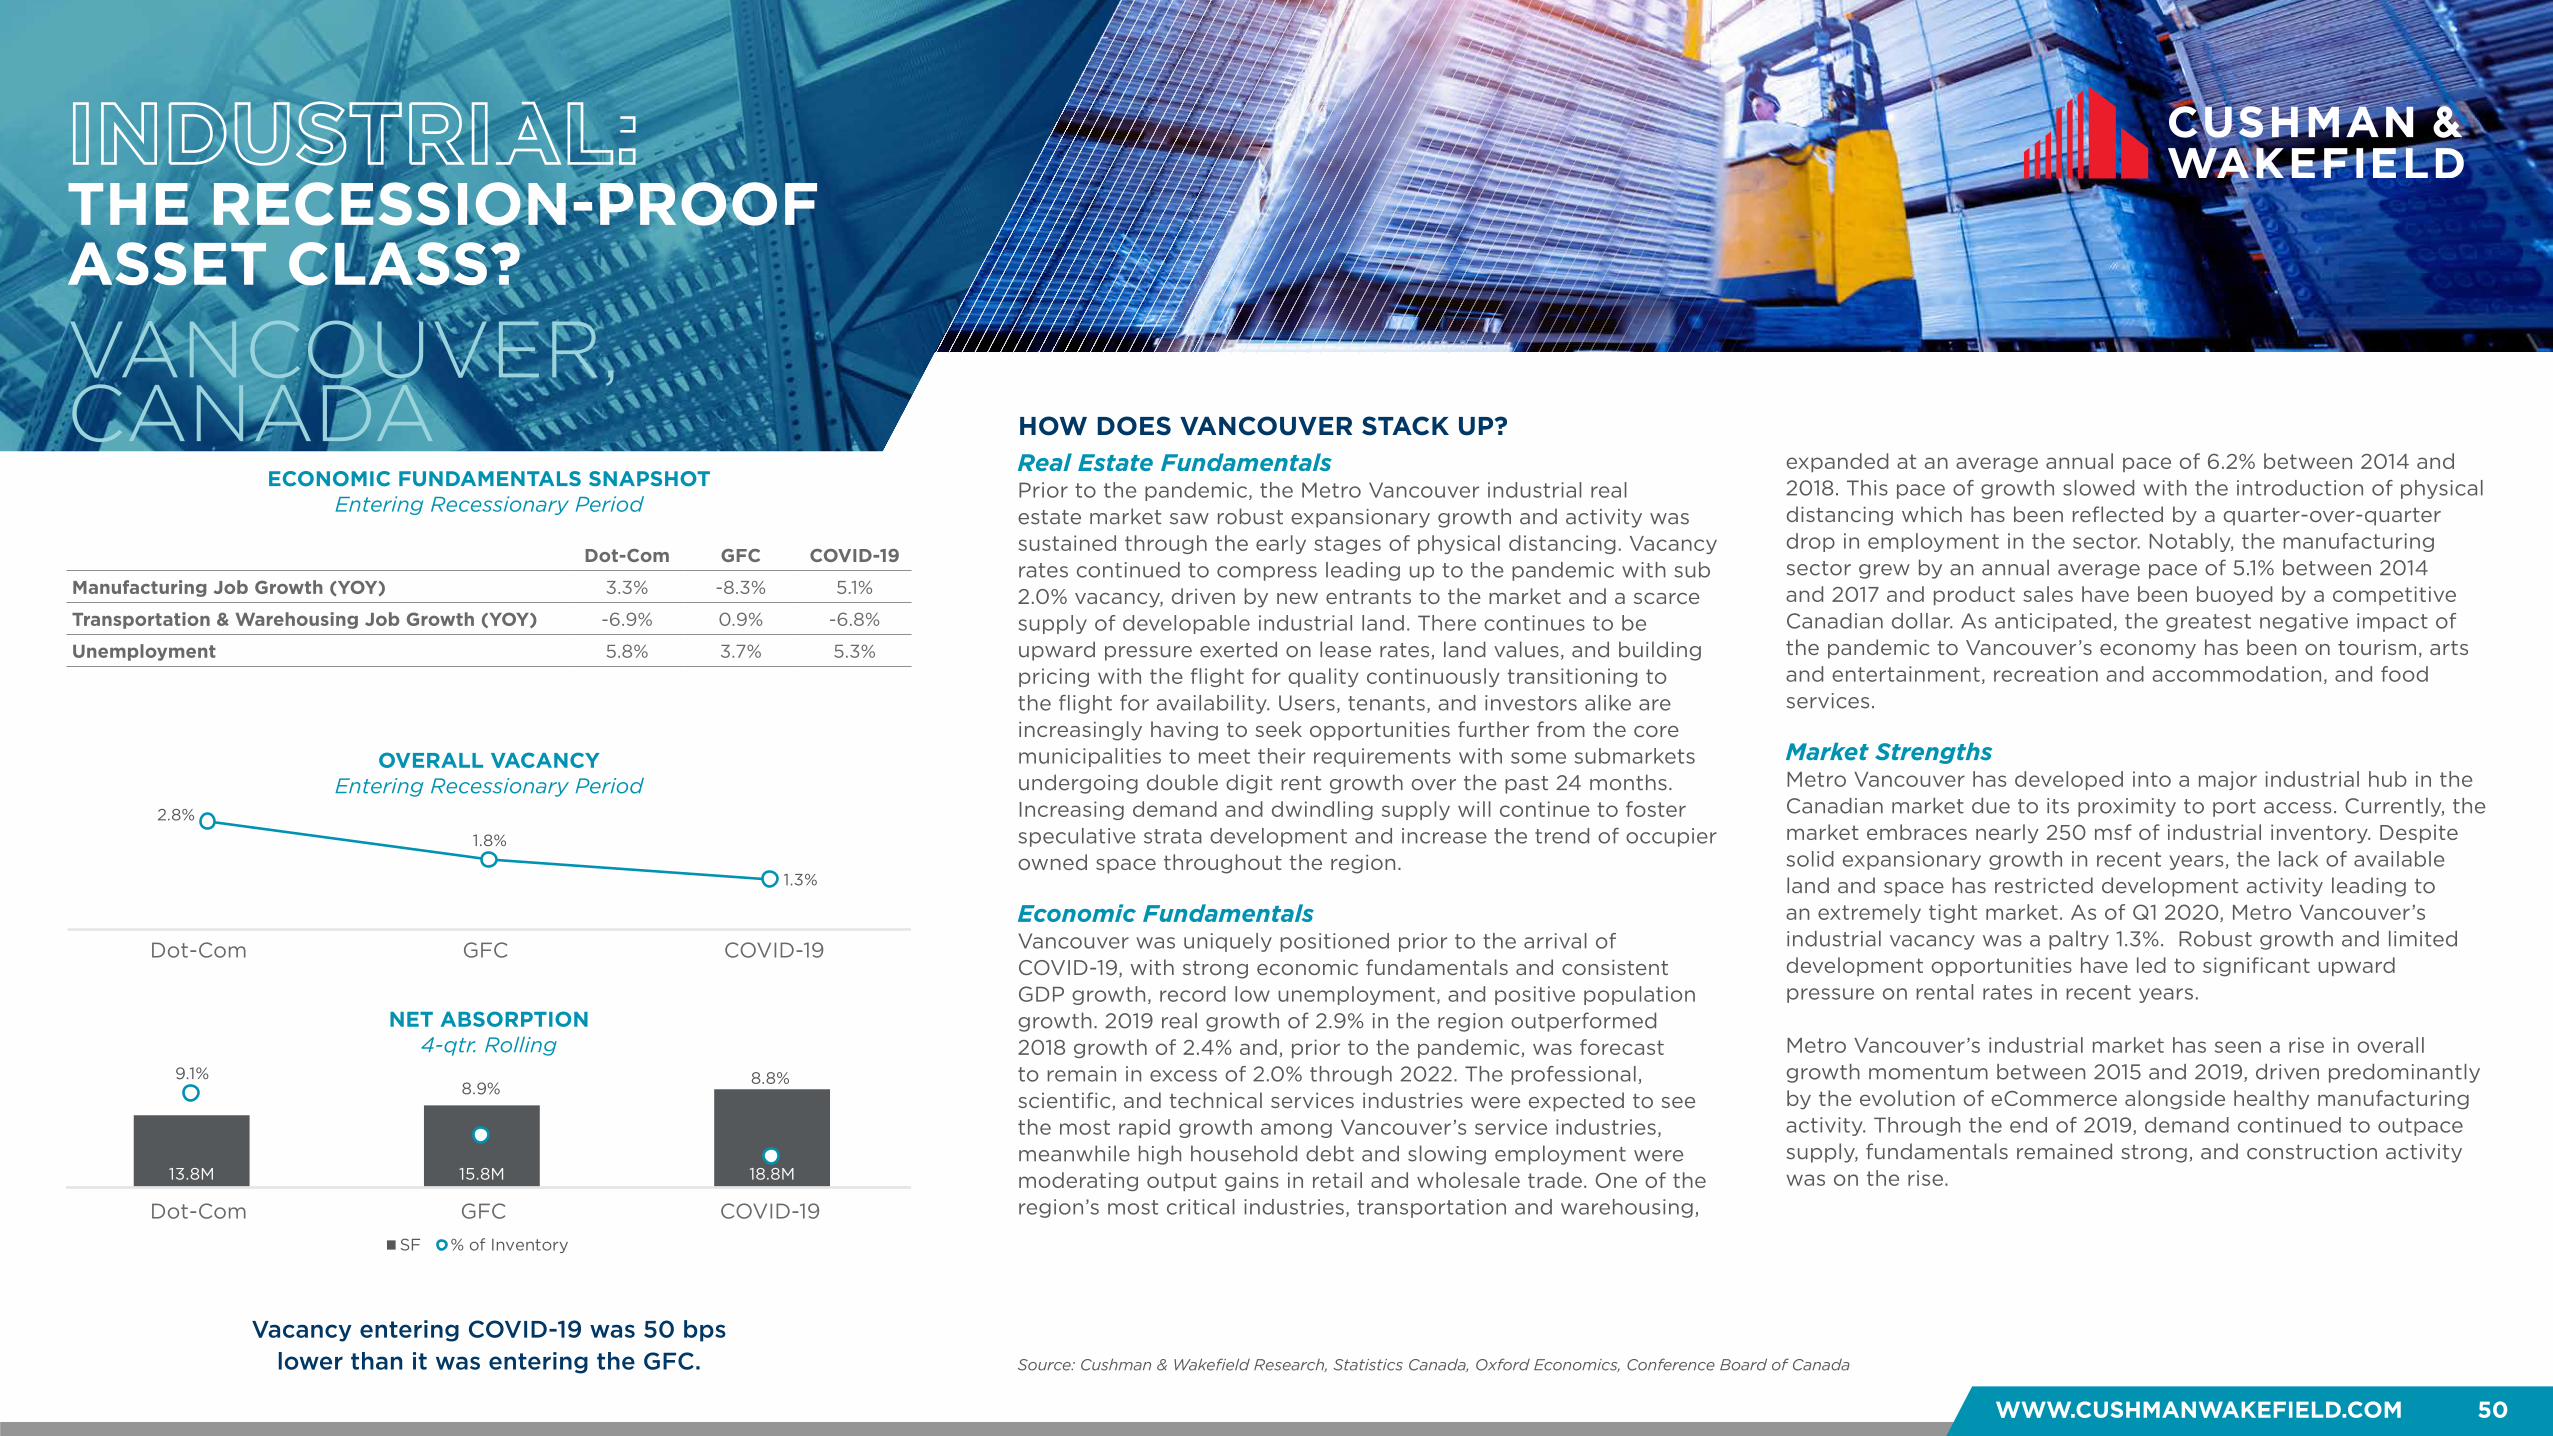
WWW.CUSHMANWAKEFIELD.COM 50
INDUSTRIAL: THE RECESSION-PROOF ASSET CLASS?
HOW DOES VANCOUVER STACK UP?
VANCOUVER, CANADA
Vacancy entering COVID-19 was 50 bps lower than it was entering the GFC.
Real Estate FundamentalsPrior to the pandemic, the Metro Vancouver industrial real estate market saw robust expansionary growth and activity was sustained through the early stages of physical distancing. Vacancy rates continued to compress leading up to the pandemic with sub 2.0% vacancy, driven by new entrants to the market and a scarce supply of developable industrial land. There continues to be upward pressure exerted on lease rates, land values, and building pricing with the flight for quality continuously transitioning to the flight for availability. Users, tenants, and investors alike are increasingly having to seek opportunities further from the core municipalities to meet their requirements with some submarkets undergoing double digit rent growth over the past 24 months. Increasing demand and dwindling supply will continue to foster speculative strata development and increase the trend of occupier owned space throughout the region.
Economic FundamentalsVancouver was uniquely positioned prior to the arrival of COVID-19, with strong economic fundamentals and consistent GDP growth, record low unemployment, and positive population growth. 2019 real growth of 2.9% in the region outperformed 2018 growth of 2.4% and, prior to the pandemic, was forecast to remain in excess of 2.0% through 2022. The professional, scientific, and technical services industries were expected to see the most rapid growth among Vancouver’s service industries, meanwhile high household debt and slowing employment were moderating output gains in retail and wholesale trade. One of the region’s most critical industries, transportation and warehousing,
expanded at an average annual pace of 6.2% between 2014 and 2018. This pace of growth slowed with the introduction of physical distancing which has been reflected by a quarter-over-quarter drop in employment in the sector. Notably, the manufacturing sector grew by an annual average pace of 5.1% between 2014 and 2017 and product sales have been buoyed by a competitive Canadian dollar. As anticipated, the greatest negative impact of the pandemic to Vancouver’s economy has been on tourism, arts and entertainment, recreation and accommodation, and food services.
Market StrengthsMetro Vancouver has developed into a major industrial hub in the Canadian market due to its proximity to port access. Currently, the market embraces nearly 250 msf of industrial inventory. Despite solid expansionary growth in recent years, the lack of available land and space has restricted development activity leading to an extremely tight market. As of Q1 2020, Metro Vancouver’s industrial vacancy was a paltry 1.3%. Robust growth and limited development opportunities have led to significant upward pressure on rental rates in recent years. Metro Vancouver’s industrial market has seen a rise in overall growth momentum between 2015 and 2019, driven predominantly by the evolution of eCommerce alongside healthy manufacturing activity. Through the end of 2019, demand continued to outpace supply, fundamentals remained strong, and construction activity was on the rise.
Source: Cushman & Wakefield Research, Statistics Canada, Oxford Economics, Conference Board of Canada
ECONOMIC FUNDAMENTALS SNAPSHOTEntering Recessionary Period
OVERALL VACANCYEntering Recessionary Period
NET ABSORPTION 4-qtr. Rolling
Dot-Com GFC COVID-19
Manufacturing Job Growth (YOY) 3.3% -8.3% 5.1%
Transportation & Warehousing Job Growth (YOY) -6.9% 0.9% -6.8%
Unemployment 5.8% 3.7% 5.3%
2.8%
1.8%
1.3%
Dot Com Financial Crisis COVID-19
13.8M 15.8M 18.8M
9.1%8.9%
8.8%
0.08650.0870.08750.0880.08850.0890.08950.090.09050.0910.0915
02000000400000060000008000000
100000001200000014000000160000001800000020000000
Dot Com Financial Crisis COVID-19
SF % of Inventory
Dot-Com GFC COVID-19
Dot-Com GFC COVID-19

WHAT’S DIFFERENT THIS TIME?
HEADWINDS TAILWINDS
WHAT CAN WE EXPECT GOING FORWARD?
WWW.CUSHMANWAKEFIELD.COM 51
Things to watch that may impact the industrial market
VANCOUVER, CANADA
While there is uncertainty surrounding the impact of COVID-19 on Vancouver’s industrial market, Metro Vancouver is in a strong position to weather any oncoming challenges that may arise.
Delays in construction deliveries may impact the occupancy of new users COVID-19 has presented issues in terms of construction, which has delayed the delivery of Metro Vancouver’s industrial projects. The increase in demand for warehouse space may push the vacancy rate below 1.0% Metro Vancouver’s vacancy rate was 1.3% in Q1 2020. Due to rising demand for warehouse space for distribution uses related to eCommerce, the market could potentially see a large increase in absorption. This would mean that options for tenants in the market would become even more scarce leaving few opportunities for tenants seeking space across Greater Vancouver. Metro Vancouver is experiencing a significant industrial land shortage Land scarcity has been an ongoing headwind for commercial development, with the average per acre asking price surging over C$2 million. This has led to numerous implications such as decreased vacancy which has been a main driver for the rapid increase in industrial lease rates.
Economic diversity will soften the blow Vancouver is a highly diverse economy with a blend of industries from technology to advanced manufacturing to logistics. This diversity keeps the real estate market better protected in a downturn. Increased construction projects in the Fraser Valley will aid near-term future industrial requirements The Fraser Valley is becoming an industrial hot spot in the Metro Vancouver market, with over 1 msf of inventory currently under construction. The demand for distribution center warehouse space will fuel the industrial market The use of eCommerce platforms to buy goods and pay for services has grown tremendously in popularity and usage. Such platforms have become an essential service as part of the growing digital economy. The evolution of eCommerce has driven substantial growth across Vancouver’s industrial markets with major tenants seeking space in numerous submarkets.
As long as consumers continue to flock online to order food, basic household items, clothing, and more, demand for
industrial space in Metro Vancouver will persist.
eCommerce has proved to be a crucial driver in Metro Vancouver’s high growth industrial market. In past recessions, eCommerce was in its infancy. In today’s market, eCommerce is a significant contributor to overall growth in the economy and the trade of goods. With the expectation of continued growth driven by eCommerce, and in part by the physical distancing caused by the COVID-19 crisis, the industrial market is expected to thrive. Vancouver’s impressive performance in past downturns and general economic stability supported by the movement of goods out of Canada’s largest port in combination with a strong tourism industry, will ensure a healthy economy in the years to come.
Source: Cushman & Wakefield Research, , Statistics Canada, Moody’s Economics
SUPPLY & DEMANDLast 5 Years
15.8M17.4M
21.3M
15.5M
22.5M
17.2M
Dot Com Financial Crisis COVID-19
Net Absorption Deliveries
Dot-Com GFC COVID-19
CONTRIBUTORSKaren Adame, Inland [email protected]
Tina Arambulo, Inland Empire, Los [email protected]
Michael Coppola, [email protected]
Trey Davis, [email protected]
Christa DiLalo, [email protected]
Casandra Dominguez, [email protected]
Zander El-hindi, [email protected]
Kyle Grundy, [email protected]
Jarrett Hicks, Cincinnati, [email protected]
David Hoebbel, St. [email protected]
Michelle McMurray, [email protected]
Ronan McNulty, [email protected]
George Meletakos, [email protected]
Cammie Moise, [email protected]
Matt Nevinger, Kansas [email protected]
Summer Newman, [email protected]
Matt Niehoff, [email protected]
Chris Owen, [email protected]
Jason Price, New [email protected]
Michael Sabatini, [email protected]
Carolyn Salzer, Industrial [email protected]
Linsey Smith, PhD, [email protected]
Juana Ross, [email protected]
Ching-Ting Wang, Dallas-Fort [email protected]
FOR MORE INFORMATIONJason TolliverManaging Director, Investor ServicesGlobal Head of newCommerce [email protected]
©2020 Cushman & Wakefield. All rights reserved. The information contained within this report is gathered from multiple sources believed to be reliable. The information may contain errors or omissions and is presented without any warranty or representations as to its accuracy.
Cushman & Wakefield (NYSE: CWK) is a leading global real estate services firm that delivers exceptional value for real estate occupiers
and owners. Cushman & Wakefield is among the largest real estate services firms with approximately 53,000 employees in 400 offices
and 60 countries. In 2019, the firm had revenue of $8.8 billion across core services of property, facilities and project management, leasing,
capital markets, valuation and other services. To learn more, visit www.cushmanwakefield.com or follow @CushWake on Twitter.
Cushman & Wakefield is a leading global real estate services firm that helps clients transform
the way people work, shop, and live.