Industrial & Commercial demand-side response in GB ...
32
Analysis of Ofgem’s surveys of demand-side response (DSR) provision by large Industrial and Commercial (I&C) consumers October 2016 Industrial & Commercial demand-side response in GB: barriers and potential
Transcript of Industrial & Commercial demand-side response in GB ...

Analysis of Ofgem’s surveys of demand-side response (DSR) provision by large Industrial and Commercial (I&C) consumers
October 2016
Industrial & Commercial demand-side response in GB: barriers and potential

Executive Summary
• We conducted the research to explore the current and potential DSR provision by I&C electricity consumers in GB and the barriers preventing greater flexibility.
• We issued two questionnaires, addressing I&C consumers and DSR procurers, respectively.
• Responses came from I&C consumers providing DSR and those not yet providing DSR.
• Most of the I&C consumers currently providing DSR are industrial customers and have relatively high electricity consumption and peak demand.
• Respondents cited a wide variety of sources for flexibility provision within their processes.
• Respondents currently provide around 350 MW of demand reduction with over 400 MW of technically and commercially viable additional demand reduction potentially available.
• Translated to a GB scale, the survey responses suggest a far greater untapped flexibility potential (c.3 GW for reducing demand and c.2 GW for increasing demand as a rough estimate).
• However, several barriers are currently preventing a greater provision of flexibility, principally: a perceived risk to primary business, difficulty in understanding the monetary value of DSR options, and commercial and technical DSR requirements not fitting the business.
• From a financial point of view, the majority of DSR providers value availability payments over utilisation payments, while for nearly half of non-providers there currently seems to be no financial incentive that would lead them to offering DSR services, possibly owing to concerns about potential disruption to business.
• I&C customers generally have multiple routes to market for DSR services.
• Procurers identified a variety of barriers to greater DSR, predominately regulatory and commercial.
• This report presents our initial analysis of the responses. Further analysis of the evidence gathered from these surveys, along with responses to our forthcoming Call for Evidence with BEIS, will help inform our subsequent route map.
2

Contents
Background ……………………………………………………………………………………………………………………..4-7
Survey of I&C consumers
– Key findings …………………………………………………………………………………………………………… 8
– Respondents’ characteristics ……………………………………………………………………………..9-12
– Sources of potential flexibility ……………………………………………………………………………....13
– DSR and onsite generation……………………………………………………………………………..........14
– Procurers: flexibility promotion and contracts…………………………………………………..15-16
– Aggregators: customer satisfaction and perceived competition…………………………17-18
– DSR: current and potential provision.…………………………………………………………………19-22
– DSR: financial incentives ……………………………………………………………………………………23-24
– Barriers to DSR provision for I&C consumers …….……………………………………………………25
Survey of DSR procurers:
– Summary ………………………………………………….……………………………………………………….26-27
– DSR services by procurers………………………..……………………………………………………………..28
– Barriers to DSR provision for procurers …………….……………………………………………….29-31
3

Background (1)
• Flexibility programme: launched by Ofgem in January 2015, it aims at developing, through an holistic view of system flexibility, a strategy to enable and enhance the efficient provision and use of flexibility sources in the GB electricity system. Two of the programme’s current areas of focus (relevant for this survey) are:
• exploring whether there is a rationale for regulatory involvement to support more large I&C consumers to provide DSR; and
• clarifying the role of aggregators and their relationship with other electricity industry parties.
• Demand-side response (DSR): includes all customers’ responses to a signal to alter, or shift, the amount of energy they draw from the grid at a specific time, in order to make savings on their electricity costs. DSR includes both demand-led (eg turn-up or turn-down of processes) and generation-led (eg use of standby generation) DSR.
• Large industrial and commercial (I&C) consumers: are the largest energy consumers. They have historically had half-hourly metering which facilitates DSR provision.
• Aggregators: not defined in the survey. Aggregation can be provided by suppliers or by third parties.
• Call for evidence (CfE): The Department for Business, Energy & Industrial Strategy (BEIS) and Ofgem will be publishing a CfE in order to gather stakeholders’ views on how to create a smarter, more flexible system. The results of this survey will be further analysed alongside responses to the CfE in formulating our next steps in this area.
• Power Responsive : a stakeholder-led collaborative programme of work, led by National Grid, that aims to grow participation of DSR in the UK by 2020.
4
Programme and terminology

During spring 2016, we conducted two concurrent online surveys using two distinct questionnaires
1. I&C consumers
– More than 100 responses.
– Well-completed by most responses and the focus of this report.
2. Procurers of DSR (suppliers, aggregators, network operators)
– More than 80 responses (around 30 respondents answered most of the questions).
– Issues with the amount of quantitative information requested meant that it was not fully-completed by most respondents.
– This report includes some quantitative data but focuses on the qualitative responses.
5
Background (2) Survey structure and participation

Survey methodology
• The survey was conducted online and in an anonymous format; all questions were optional.
• We consulted on the content of the questionnaires with various stakeholders* before issuing.
• These stakeholders helped to promote the survey to their relevant contacts/ members.
• As with any voluntary survey, the results inevitably present a somewhat partial picture. Nonetheless we consider it contributes valuable evidence on DSR potential and barriers.
* Association for Decentralised Energy; Energy Intensive Users Group; Energy Managers Association; Energy Networks Association; Energy UK; Major Energy Users’ Council; National Grid DSR Provider Group; Power Responsive.
6
Background (3) Survey methodology

Next steps
• This report presents our initial analysis of the responses, which we are keen to share
with stakeholders in advance of the CfE. Alongside this report, we have published the quantitative I&C consumer survey responses in an aggregated and anonymised form to allow stakeholders to perform their own analysis to better understand the state of I&C DSR.
• We will conduct further analysis of the surveys alongside responses to the
forthcoming CfE. The CfE will seek a greater diversity of respondents and on a wider range of topics, giving us a fuller understanding of the issues and in a broader context. The evidence gathered from the surveys and CfE will help inform our subsequent route map with BEIS.
• In the meantime, we will use the survey results to inform our ongoing work in this area, including our involvement on the Power Responsive Steering Group.
• We are planning on conducting a follow-up survey next year to check the progress on
DSR provision and potential, as well as remaining barriers. We would welcome views on questions you think we should include (please send suggestions to [email protected]).
7
Background (4) Next steps

1. Survey of I&C consumers
8
Key Findings
• Around 60% of DSR non-providers* identified potential for demand reduction DSR, while just under half identified potential to increase demand, without affecting their business.
• For those currently providing DSR, the majority consider they could offer more flexibility without affecting their businesses.
• This survey suggests over 400 MW of potential additional demand reduction and around 250 MW of additional demand increase being available from respondents.
• This could translate to potential of around 3 GW for reducing and demand and 1.9 GW for increasing demand on a GB-scale. However, owing to the small sample size and potential self-selection bias, this extrapolation should be treated with caution.
• Three-quarters of DSR providers prefer availability payments to utilisation payments, while almost half of DSR non-providers currently consider that no financial incentive would be enough to encourage them to offer DSR, possibly owing to concerns about potential disruption to business.
• Respondents identified multiple barriers to DSR provision, indicating where changes are needed to increase participation.
• A more comprehensive analysis will help inform Ofgem’s future work (and National Grid’s Power Responsive campaign).
For each question, we have indicated the proportion of respondents answering that question, using pie charts at the bottom right-hand side of each slide. The blue charts refer to current DSR providers and the red charts to DSR non-providers. The violet charts refer to the overall participation to the question, with no distinction based on DSR participation.
Question participation
* Throughout the report, the terms ‘DSR providers‘ and ‘DSR non-providers‘ have been adopted instead of DSR provider respondents and DSR non-provider respondents.
Context Most of the respondents belong to the industrial sector
9
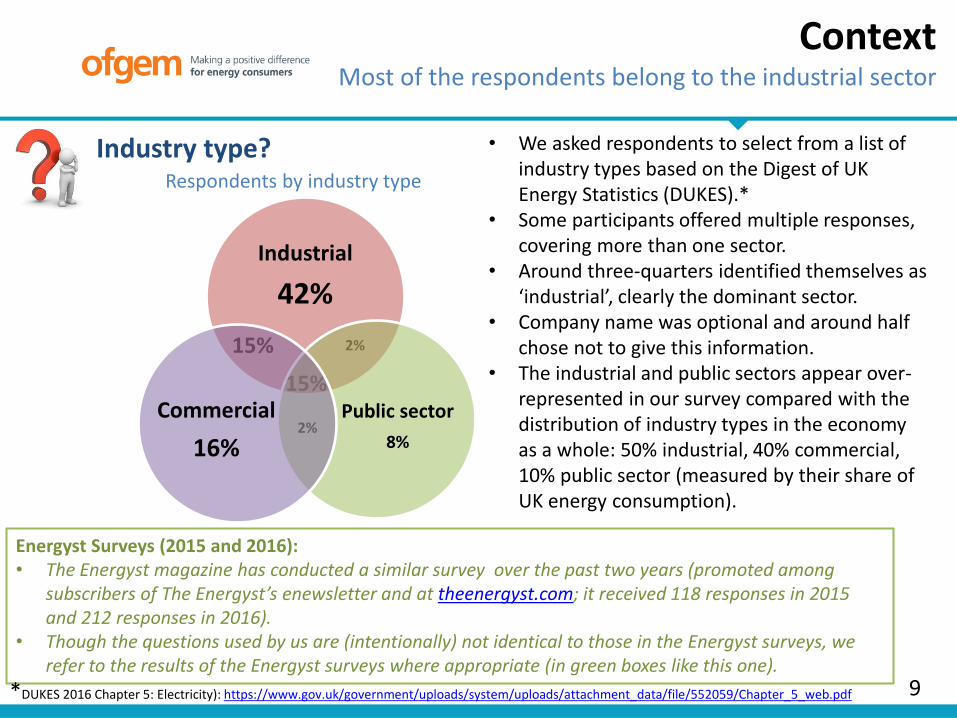
• We asked respondents to select from a list of industry types based on the Digest of UK Energy Statistics (DUKES).*
• Some participants offered multiple responses, covering more than one sector.
• Around three-quarters identified themselves as ‘industrial’, clearly the dominant sector.
• Company name was optional and around half chose not to give this information.
• The industrial and public sectors appear over-represented in our survey compared with the distribution of industry types in the economy as a whole: 50% industrial, 40% commercial, 10% public sector (measured by their share of UK energy consumption).
Industry type?
Energyst Surveys (2015 and 2016): • The Energyst magazine has conducted a similar survey over the past two years (promoted among
subscribers of The Energyst’s enewsletter and at theenergyst.com; it received 118 responses in 2015 and 212 responses in 2016).
• Though the questions used by us are (intentionally) not identical to those in the Energyst surveys, we refer to the results of the Energyst surveys where appropriate (in green boxes like this one).
*DUKES 2016 Chapter 5: Electricity): https://www.gov.uk/government/uploads/system/uploads/attachment_data/file/552059/Chapter_5_web.pdf
Respondents by industry type
15%
15%
2%
2%
Industrial
42%
Public sector
8%
Commercial
16%

Fewer than a third of respondents participate in DSR
The majority of participants are industrial consumers
10
Does your organisation participate in DSR?
Yes No
29% 71%
Participation by industry type
• Of the 92 respondents that answered this question, only 27 participate in DSR.
• The subsequent question-by-question analysis showing the breakdown by participation is based on these 92 respondents.
• The overall participation rate is perhaps relatively low given the survey was about DSR, but the responses of non-participants are helpful to provide an idea of the untapped interest and potential.
• The respondents are unlikely to be representative of the I&C customer base broadly (owing to sample bias). I&C-wide participation may be far lower as a proportion of all users, though we do not have reliable figures on this.
• Among the sectors, industrial consumers are most likely to participate in DSR, with over a third participating. Historically industrial consumers have been most prominent in DSR owing to their relatively high energy demand and costs.
• In contrast, only around one in ten commercial and public sector consumers are currently participating – indicating a potential growth area (and one that new contracts/procurers are beginning to target).
36%
13% 8%
64%
87% 92%
0%
20%
40%
60%
80%
100%
Industrial Commercial Public sector
Participating in DSR Not participating in DSR
Participation levels similar to the Energyst surveys in 2015 (33%) and 2016 (27%). Question participation
The majority of respondents are predominately half-hourly metered
There are no significant metering differences based on DSR participation
11
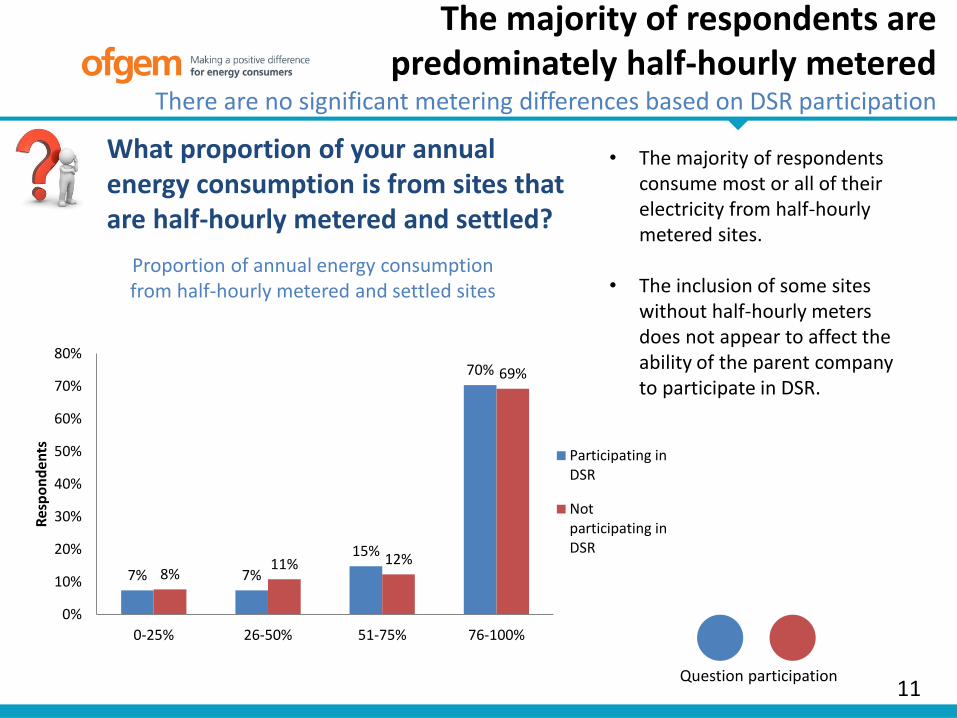
• The majority of respondents consume most or all of their electricity from half-hourly metered sites.
• The inclusion of some sites without half-hourly meters does not appear to affect the ability of the parent company to participate in DSR.
Proportion of annual energy consumption from half-hourly metered and settled sites
What proportion of your annual energy consumption is from sites that are half-hourly metered and settled?
Question participation
7% 7%
15%
70%
8% 11% 12%
69%
0%
10%
20%
30%
40%
50%
60%
70%
80%
0-25% 26-50% 51-75% 76-100%
Res
po
nd
ents
Participating inDSR
Notparticipating inDSR

DSR providers typically have higher electricity consumption and peak demand
Though there are some significant loads not participating
Approximate annual electricity usage
12
• The likelihood of providing DSR tends to rise with electricity consumption and peak demand.
• This is to be expected in terms of both overall energy costs and potential scale of demand-side provision.
• Though, in our survey, of those with the highest peak demand, more are not participating in DSR than are participating. This could be due to some of them being multi-site (no evidence of this was provided by the survey, though).
• Our sample represents around 15% of total GB I&C consumers, based on annual energy usage.
Approximate peak demand
0
2
4
6
8
10
12
14
16
18
<1MW 1-9MW 10-49MW 50-99MW 100-250MW >250MW
Nu
mb
er o
f re
spo
nd
en
ts
Peak demand
Participating in DSR
Not participating inDSR
Question participation
0 10 20 30 40
< 30 GWh
30-99 GWh
100-199 GWh
200-299 GWh
300-500 GWh
>500 GWh
Number of respondents
An
nu
al e
lect
rici
ty u
sage
Participating in DSR
Not participating inDSR

A diversity of sources of potential flexibility are available
Especially among those not providing DSR
Which part of your operations do you think you could use electricity most flexibly for?
13
• Nearly all respondents identified more than one process.
• Motors and pumps were identified as the most flexible processes overall (often cited together).
• There is diversity in the potential for flexibility, particularly for DSR non-providers.
• Lighting appears to offer flexibility potential to a large number of respondents but is not typically used (perhaps because it generally accounts for a relatively low proportion of consumption).
0 5 10 15 20 25 30
Pumps
Motors
Lighting
Space heating
Fans
Compressors
Refrigeration
High temperature processes
Other
Drying
Low temperature processes
None
Number of respondents
Not participating inDSR
Participating in DSR
• Pumps, compressors, motors and low temperature processes are associated with the companies that have highest demand and largest potential flexibility.
• The majority of the companies with the highest electricity usage and peak demand indicated flexibility potential for most of the processes.
• Responses under ‘Other’ included: blowers; critical stand-up generators; electric arc furnaces; IT; Heating, Ventilation and Air Conditioning (HVAC); data centre cooling; Combined Heat and Power (CHP); electrolysis.
Question participation

Regardless of DSR provision, two-thirds of respondents have on-site generation
But those not participating are more likely to use this for baseload
14
Do/can you generate any of your own electricity?
DSR Yes No
Participate 67% 33%
Don’t participate 68% 32%
• There is no discernible difference in the ability to generate electricity between the two groups (around two-thirds in each being able to generate their own electricity).
• Non-providers with on-site generation are more likely to use that electricity for baseload (40%) than those providing DSR (6%), limiting the potential flexibility.
6%
40% 44%
45%
50%
15%
0%
10%
20%
30%
40%
50%
60%
70%
80%
90%
100%
Participating in DSR Not participating in DSR
Both
Back-up
Baseload
Of those answering yes…
Question participation
We didn’t ask how DSR is provided, but the Energyst surveys found that the majority of DSR providers used standby generation as part of their DSR provision (66% in 2015 and 76% in 2016).

Three-quarters of respondents have been contacted about flexibility
Most commonly by suppliers and aggregators
Have any of the following spoken to you about the advantages of flexibility in your energy consumption?
15
• Three-quarters of respondents had been contacted about flexibility, mostly by suppliers, then aggregators (with these groups covering two-thirds of respondents).
• Of those reporting contact, 64% were contacted by more than one organisation.
• We are aware of distribution network operators (DNOs) increasingly contracting directly with I&C consumers and would be interested to see how this changes over time.
• ‘Others’ included representative groups such as trade associations and consultants or third party intermediaries (TPIs). While this is a useful way of spreading the message of flexibility, this does not appear to yet be resulting in many DSR contracts.
20
24
14 12
1
31
24
13
9 11
Suppliers Aggregators National Grid DNO Other
Participating in DSR
Not participating in DSR
Question participation
Contacted about flexibility by…
The Energyst 2016 survey found that only around half of respondents had been spoken to by a supplier or aggregator about flexibility. This suggests a different cohort of respondents between the Energyst and our survey.
Note: Responses suggest that some respondents might have been unclear on the difference between aggregators and suppliers.

Aggregators are most prevalent in procuring DSR
Suppliers typically serve smaller customers
16
(Of those participating) how do you currently provide DSR?
• Aggregators appear to have the highest ‘conversion rate’ (ie the ability to turn conversations into contracts).
• A third of consumers use at least two routes to market for their DSR.
• Suppliers seem to facilitate the flexibility of smaller customers compared with aggregators, National Grid and DNOs (7 of 9 of suppliers’ customer base have an annual energy consumption of less than 100 GWh).
Question participation
The Energyst 2016 survey presented a similar picture –79% through an aggregator; 23% direct with National Grid; 10% with a DNO (the supplier option was not given).
30%
74%
22% 19%
4%
12%
49%
21%
12%
5%
0%
10%
20%
30%
40%
50%
60%
70%
80%
Suppliers Aggregators National Grid DNO Other
By number ofrespondents
By annualconsumption ofrespondents
Currently provide flexibility through…

Aggregators: customers’ satisfaction Respondents reported a mixed level of
satisfaction with aggregators
17
• We asked this (and the next) question because it relates to the aggregator workstream within the Flexibility Programme.
• There was a relatively low sample size for both questions (16 respondents).
• Overall, 44% of respondents were satisfied (or very satisfied) with aggregators, while 19% were dissatisfied (or very dissatisfied).
• Those satisfied with aggregators cited: o good and open relationships based on mutual
benefits; o the ability of aggregators to navigate the
complexity of the process.
• Those dissatisfied with aggregators were more vocal and identified two key issues: o relationship and quality of service (eg limited
transparency of payments); o a perception that aggregators ask for a big
proportion of revenue.
(Of those using aggregators) how satisfied have you been with aggregators when you have used them?
Question participation
While not entirely equivalent, the 2016 Energyst survey respondents reported higher overall satisfaction (86%) with the outcome of using DSR (not broken down by route to market).
13% 6% 38% 38% 6%
0% 20% 40% 60% 80% 100%
Number of respondents (%)
Satisfaction with aggregators
Very dissatisfied Dissatisfied Neither
Satisfied Very satisfied

Aggregators: perception of competition Respondents perceived a mixed picture
in terms of competition among aggregators
18
(Of those using aggregators) how much do you agree with the statement "there is enough competition among aggregators"?
• Over a third of respondents think that there is enough competition among aggregators, while around a quarter disagree.
• Given that there are around 30 aggregators in GB, the response to this question is likely to reflect individual experience of engaging with aggregators.
• We were unable to detect a direct correlation between responses to the previous question and this one. However, none of those who were satisfied with aggregators felt that there was insufficient competition among aggregators.
Question participation
13% 13% 38% 6% 31%
0% 20% 40% 60% 80% 100%
Number of respondents (%)
I&C customers' perceived competition among aggregators
Strongly disagree Disagree
Neither agree nor disagree Agree
Strongly agree

DSR potential – decreasing load Current providers appear to be able to
offer further load reduction
• 38% of respondents can currently reduce load by up to 10% of their peak demand, and 15% of respondents currently provide over 50% demand reduction relative to peak.
• This more than doubles in terms of those who think they can potentially reduce load over 50% of their peak demand without affecting their business, indicating untapped potential among current providers.
• 75% of those currently providing and 45% of those potentially providing over 50% demand reduction do not have onsite generation, suggesting that the flexibility in these cases will be less than 100%.
19
(As a current provider) what is the maximum change in load that you can offer at any one time as a percentage of your peak demand, without this affecting your business?
Question participation
The Energyst survey 2016 asked how much consumption respondents’ used for DSR (it’s unclear if this was peak demand). It identified a similar distribution in terms of current flexibility to that among our respondents.
Current and potential load reduction
38%
15% 15% 15%
12%
19% 19%
12%
38%
4%
0%
5%
10%
15%
20%
25%
30%
35%
40%
45%
0% 1-10% 11-25% 26-50% 51-100% Don’t know
Res
po
nd
ents
Load reduction
Actual loadreduction
Potential loadreduction

DSR potential – increasing load Current providers appear to be able to
offer further load increases
20
• 26% of respondents can currently increase load by up to 10%, of their peak demand. None provides over 50%.
• A higher potential than current flexibility emerges with respect to load increase in all the ranges.
• The current and potential flexibility appear to be much lower for increasing demand than decreasing it, consistent with the historical use of DSR.
(As a current provider) what is the maximum change in load that you can offer at any one time as a percentage of your peak demand, without this affecting your business?
Question participation
Current and potential load increase
Note: some responses (to both this and the previous question) indicate possible ambiguity on what potential flexibility means. Some reported potential as additional to current while others presented the cumulative effect. Where possible, we have adjusted the answers to be on a consistent basis.
26% 26%
3% 3% 0%
12% 17%
43%
22%
4%
9%
4%
0%
5%
10%
15%
20%
25%
30%
35%
40%
45%
50%
0% 1-10% 11-25% 26-50% 51-100% Don't know
Res
po
nd
ents
Load reduction
Currentloadincrease
Potentialloadincrease
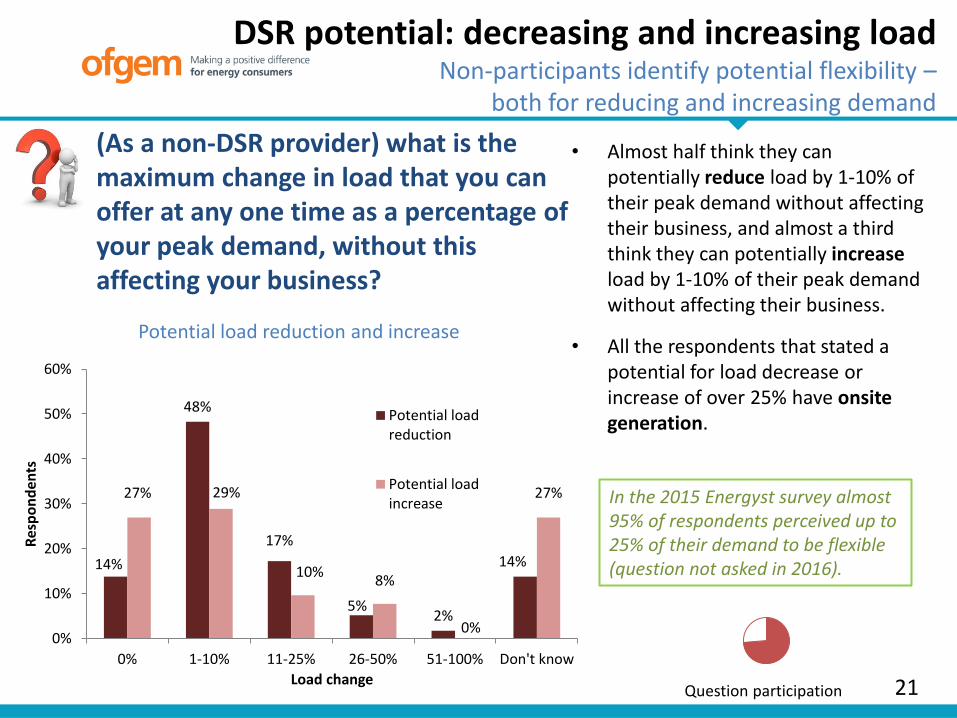
DSR potential: decreasing and increasing load Non-participants identify potential flexibility –
both for reducing and increasing demand
21
• Almost half think they can potentially reduce load by 1-10% of their peak demand without affecting their business, and almost a third think they can potentially increase load by 1-10% of their peak demand without affecting their business.
• All the respondents that stated a potential for load decrease or increase of over 25% have onsite generation.
Question participation
(As a non-DSR provider) what is the maximum change in load that you can offer at any one time as a percentage of your peak demand, without this affecting your business?
Potential load reduction and increase
In the 2015 Energyst survey almost 95% of respondents perceived up to 25% of their demand to be flexible (question not asked in 2016). 14%
48%
17%
5% 2%
14%
27% 29%
10% 8%
0%
27%
0%
10%
20%
30%
40%
50%
60%
0% 1-10% 11-25% 26-50% 51-100% Don't know
Res
po
nd
ents
Load change
Potential loadreduction
Potential loadincrease

DSR overall potential We estimate potential flexibility of over 400 MW
demand reduction among survey respondents
22
Estimation of flexibility untapped potential in MW • We estimate that around 350 MW of flexibility in reducing load and 85 MW in increasing load are currently
provided by survey respondents.
• Moreover, we estimate:
Calculation of estimate of untapped potential (with caveats): • We only included respondents that answered the peak demand
question. • Where a respondent provided an exact estimate (in MW) for its
flexibility potential, we included these figures. • Where a range was provided for peak demand and/or flexibility
potential, we considered the mid-point of each range, and applied the flexibility potential % to the peak demand.
• In order to isolate the untapped potential from current providers, we summed the individual ly-estimated potential and subtracted the currently provided flexibility.
• In order to translate the potential to a GB-scale, we used the respondents’ overall energy consumption relative to I&C in GB as a whole. We did not have access to an equivalent proportion for scaling peak demand.
0
50
100
150
200
250
300
350
Decreasing demand Increasing demand
Flex
ibili
ty p
ote
nti
al (
MW
)
Participating inDSR
Not participatingin DSR
- Over 400 MW of additional flexibility to be potentially available for reducing load. - Over 250 MW of additional flexibility to be potentially available for increasing load. - The total flexibility potential is higher among existing providers, particularly for demand
reduction. • Extrapolating these figures across the I&C sector more broadly would translate into potentially available
flexibility on a GB scale of: over 3 GW for demand reduction and 1.9 GW for demand increase. Given the inevitable sample bias in this survey, this is likely to be an overestimate.

The majority of DSR providers prefer availability to utilisation payments
Availability payments are preferred in part because they offer more certainty
Which of availability and utilisation payments are more important to you offering DSR?
23
74%
15%
11%
Availability Utilisation Both
• 74% of respondents prefer availability to utilisation payments. This result may reflect the fact that DSR services may be called on infrequently and, therefore, be exposed to a high revenue uncertainty if only utilisation payments are offered.
• Those favouring availability cited the following reasons: certainty of income/investment and
returns/benefits payments are easier to model and build a business
case for allows retention of flexibility allows understanding of competitiveness
compared with other European countries.
• Those favouring utilisation cited the following reasons: incentivises actual running of plant encourages more active participation compensated for actual running of expensive back-
up.
Question participation
Preferred options as payments for DSR provision

The prospect of a financial reward is not enough to encourage 45% of non-providers to offer DSR
Some expectations of the level of incentive are unrealistic
24
(For those not providing DSR) is there any level of financial incentive that would lead to you offering DSR services?
Yes No
55% 45%
• Despite completing a DSR survey, nearly half of respondents not providing DSR said that there was no financial incentive that could persuade them to participate.
• No notable differences emerged between ‘yes’ and ‘no’ respondents in terms of: size of business; identified barriers to flexibility provision; stated potential for flexibility; or having being contacted about flexibility.
• Of those answering ‘yes’, more than two-thirds have onsite generation, compared with more than half of those answering ‘no’.
• Of those answering ‘yes’, some suggested requisite incentive levels of £65-£250/kW and £2-£50/kWh. Such incentives seem unrealistic, given the current values of DSR services – approximately double actual values for £/kW and by an order of magnitude in £/kWh.
Question participation
Higher levels of interest were recorded by the Energyst 2016 survey with 87% answering ‘yes’ to: ‘would you be interested in earning money through DSR if this did not affect your operation?’
One explanation for the difference between our results and that from the Energyst may relate to the question wording. While the Energyst survey includes the proviso of it not affecting business operation, respondents to our question might have interpreted the question as financial compensation for disruption, especially given the concerns over the potential risk to business (see over).
Other explanations for the relatively high proportions of ‘no’s include: • whether or not the person completing the survey is responsible
for profit & loss (we did not collect this information); • wariness of unsolicited contact from potential providers
(though we did emphasise the anonymity of the survey responses).

0% 10% 20% 30% 40% 50% 60%
DSR does not contribute to carbon reductions orconflicts with other environmental measures
Business processes unsuitable for (further) DSR
Difficult to gather information on products availableand how to participate
Technical and commercial requirements for (further)DSR do not fit the business
Costs of (further) participation would outweighbenefits
Difficult to understand monetary value of (further)DSR options
Other
Concerned over impact on business performance
Risk to business from providing (further) DSR,including third party control of processes
Participating in DSR
Not participating in DSR
Barriers to (further) DSR provision tend to be common to providers and non-providers
Most respondents identified multiple barriers
25
*
* Not asked of those already providing DSR
• Barriers are generally common to both those already providing and those not providing DSR.
• Most respondents identified more than one barrier suggesting there is no ‘quick fix’ to increasing participation.
• The barriers provide lessons for both the products available and how they are explained to consumers.
• ‘Other’ includes: short-term contracts; costly metering requirements; smaller loads being proportionally more expensive to participate given overheads; exclusivity/lack of opportunity to stack value.
Question participation

2. Survey of DSR procurers
26
Summary Background
- We asked for data on the services that customers of DSR procurers are currently involved in.
- We also asked about barriers procurers have experienced to contracting with large I&C customers for the provision of DSR.
- Owing to the large amount of data requested, very few companies comprehensively responded to the survey, so our analysis focuses on overall activity by service provision and the barriers faced to contracting with I&C customers.
- We have separated independent aggregators from those with a supply licence; the latter were grouped with suppliers.
- We received 87 responses to the survey.
- We separated the services that customers of DSR procurers are involved in into explicit ones (ie categorised as DSR products) and implicit ones (ie for which DSR is achieved, though by means of tariffs).
- We separated the barriers identified by DSR procurers into four categories (cultural, regulatory, commercial and structural), following the same categorisation in the CfE.

2. Survey of DSR procurers
27
Summary
Key findings
- I&C customers generally have multiple routes to market for DSR services.
- This is the case for both explicit and implicit DSR.
- Procurers identified a variety of barriers, predominantly of a commercial nature.
- The barrier shared by all types of procurer was the lack of knowledge of the technical aspects and potential benefits of DSR among customers.
For each of the results, we have indicated the proportion of respondents answering that question, using a pie chart at the bottom right-hand side of each slide:
Question participation

DSR services provided by procurers I&C customers generally have multiple routes to market for their DSR
28
• We have grouped the services according to the signal (implicit or explicit) and within explicit, the nature of the service being provided.
• I&C customers generally have multiple routes to market for DSR services, with DNO constraints-related contracts the exception, according to our survey.
• Some of the well-established balancing services, such as STOR, have multiple parties involved.
• Implicit services are dominated by suppliers and aggregators but there is also evidence of DNO participation.
Question participation
0 2 4 6 8 10 12
Short term operating reserve (STOR)
Demand-side balancing reserve
Fast Reserve
Demand Turn Up
Firm frequency response
Frequency control by demand management
Capacity Market
Interruptible
Constraint management
Distrubtion use of system red zone avoidance
Triad avoidance
Time of use tariff
Res
erve
Fre
qu
ency
resp
on
se
Bal
anci
ng
serv
ices
Cap
.C
on
stra
ints
Exp
licit
Imp
licit
Aggregators
Suppliers
DNOs
National Grid
No. of procurers engage d in this service

Barriers for procurers by respondent type (I) Lack of knowledge about DSR among customers
emerged as a common barrier across all procurer types
29
Shared among aggregators, suppliers and network operators
Lack of knowledge of the technical aspects and potential benefits of DSR among customers
Shared between aggregators and suppliers
• Commercial uncertainty around DSR contracts
• Customers’ concerns over DSR impact on primary business
• Metering requirements are either unclear or impractically strict
Shared between suppliers and network operators
• Customers concern over non-performance penalties for DSR provision
• Difficulty identifying the right person in the organisation to engage for DSR promotion
Shared between aggregators and network operators
• Generator-centric market unsuitable for DSR participation
Question participation

Barriers for procurers by respondent type (II) Aggregators were the most vocal in identifying key issues
30
Aggregators
• Over-complex process for enrolling new clients • Low value of DSR products (related to opportunity cost of not participating in other
services provision, eg Triad avoidance) • Excessive complexity related to the wide range of DSR services • Unregulated aggregator market leads to wrong information being provided about DSR
benefits (concerns largely focus on third-party aggregators) • Limited access to day-ahead and within-day markets for short-term flexibility provided by
suppliers (no other route to these markets available) • Legislation/regulation does not take into account I&C DSR requirements • On capacity markets: lack of energy payments, excessive testing requirements, lack of
portfolio management flexibility, policy instability
Suppliers
• Unfair competition with aggregators • Long-term commitment required for
most of DSR services • Lack of appropriate market
standards/good practice
Network operators
• Exclusivity of other contracts between providers and (for example) National Grid, prevent provision of DSR services
• Volume of available DSR resources insufficient to address network constraints

Barriers for procurers by category Commercial and regulatory barriers are most numerous
31
Cultural
Regulatory (role of parties)
Commercial (incentives)
Structural (costs)
• Lack of knowledge of the technical aspects and potential benefits of DSR among customers • Excessive complexity related to the wide range of DSR services • Difficulty identifying the right person in the organisation to engage with for promoting DSR
• Customers’ concerns over DSR impact on primary business • Customers concern over non-performance penalties for DSR provision • Volume of available DSR resources insufficient to address network constraints
• Unregulated aggregator market • Unfair competition with aggregators for suppliers • Lack of appropriate market standards/good practice • Legislation/regulation does not take into account I&C DSR requirements • Policy instability of capacity markets • Limited access to day-ahead and within-day markets for short-term flexibility
• Lack of energy payments for capacity markets • Commercial uncertainty around DSR contracts • Low value of DSR products • Over-complex process for enrolling new clients • Long-term commitment required for most DSR services • Generator-centric market unsuitable for DSR participation • Exclusivity of other contracts between providers and (for example) National Grid • Metering requirements either unclear or impractically strict