Indonesia Industry Focus Indonesia Construction - dbs.com Wijaya Karya Beton : Wika beton (a...
51
ed-TH / sa- MA, PY Adjusting expectations Decelerating new contract growth and rising capital needs cap sector’s upside potential; turning Neutral on the sector Contractors with ample balance sheet capacity stand a better chance of winning more projects Execution and earnings are key catalysts. Top picks: PTPP and WTON Turning Neutral on Indonesia’s construction sector; the stock-picking game continues. We are turning Neutral on the sector (from Positive previously) as we expect new contract growth to decelerate while the higher capital needs pose a risk to profitability. We advise investors to stay selective. We like PTPP due to its attractive valuation at 0.34x EV/order book, lower than peers. PTPP also has a smaller capex commitment compared to its peers, and a less leveraged balance sheet to support its future earnings and new contract growth. As the government and project owners accelerate the execution of infrastructure projects, we believe precast producers, including WTON, are in a sweet spot. Contractors with ample balance sheet capacity stand a better chance of winning more projects. Job opportunities are aplenty for contractors given Indonesia’s massive need for infrastructure. Nonetheless, funding remains a challenge with fiscal deficit being capped at 3% by law while the government has been taking a break from injecting capital into SOEs. A number of funding alternatives are taking place but mostly require the contractors to also invest in the infrastructure projects or work under a turnkey scheme. Capital requirements to win a project will continue to rise, hence we prefer contractors with ample balance sheet capacity, established JVs with foreign players and good cash flow management. Where we differ. Consensus' blanket overweight stance on the sector implies an expectation that earnings delivery will be smooth for all listed state-owned contractors, which may not be the case as some contractors are facing land acquisition issues and funding constraints. We also expect new contracts to peak out this year and decline by 6% in 2018. On contrary to consensus Buy call on all listed state-owned contractors, we believe selective investing in the sector is the best approach given the peaking new contract growth and differing risk profile among the contactors. Our top picks in the sector are PTPP and WTON. JCI : 5,825.10 Analyst Chong Tjen-San +60 3 26043972 [email protected] Tiesha PUTRI +6221 30034931 [email protected] STOCKS Source: AllianceDBS, DBSVI, Bloomberg Finance L.P. Closing price as of 5 Jul 2017 Waskita Karya : Waskita Karya is a stated owned construction company engaging in a wide variety of construction activities including highways, bridges, ports, airports, and LRT. Pembangunan Perumahan : PT PP (Persero) is Indonesia's leading construction company with business portfolio encompassing from building and civil infrastructure constructions. Wijaya Karya : Wijaya Karya is a construction company with interests in EPC, civil, building works, precast and realty. Wijaya Karya Beton : Wika beton (a subsidiary of Wikaya Karya) is a leader in precast in Indonesia with c.40% market share. Construction companies’ PE valuation range since 2012 (x) Source: AllianceDBS, DBSVI 5 15 25 35 45 55 65 75 WSKT PTPP WIKA WTON DBS Group Research . Equity 5 Jul 2017 Indonesia Industry Focus Indonesia Construction Refer to important disclosures at the end of this report Price Mkt Cap Target Price Performance (%) Rp US$m Rp 3 mth 12 mth Rating Waskita Karya 2,270 2,306 2,400 (2.1) (6.8) HOLD Pembangunan Perumahan 3,330 1,545 4,100 2.8 (7.2) BUY Wijaya Karya 2,220 1,491 2,050 (4.7) (15.6) HOLD Wijaya Karya Beton 605 395 760 (21.5) (33.7) BUY
Transcript of Indonesia Industry Focus Indonesia Construction - dbs.com Wijaya Karya Beton : Wika beton (a...

ed-TH / sa- MA, PY
Adjusting expectations
Decelerating new contract growth and rising capital needs cap sector’s upside potential; turning Neutral on the sector
Contractors with ample balance sheet capacity stand a better chance of winning more projects
Execution and earnings are key catalysts. Top picks: PTPP and WTON
Turning Neutral on Indonesia’s construction sector; the
stock-picking game continues. We are turning Neutral on the sector (from Positive previously) as we expect new contract growth to decelerate while the higher capital needs pose a risk to profitability. We advise investors to stay selective. We like PTPP due to its attractive valuation at 0.34x EV/order book, lower than peers. PTPP also has a smaller capex commitment compared to its peers, and a less leveraged balance sheet to support its future earnings and new contract growth. As the government and project owners accelerate the execution of infrastructure projects, we believe precast producers, including WTON, are in a sweet spot. Contractors with ample balance sheet capacity stand a
better chance of winning more projects. Job opportunities are aplenty for contractors given Indonesia’s massive need for infrastructure. Nonetheless, funding remains a challenge with fiscal deficit being capped at 3% by law while the government has been taking a break from injecting capital into SOEs. A number of funding alternatives are taking place but mostly require the contractors to also invest in the infrastructure projects or work under a turnkey scheme. Capital requirements to win a project will continue to rise, hence we prefer contractors with ample balance sheet capacity, established JVs with foreign players and good cash flow management. Where we differ. Consensus' blanket overweight stance on the sector implies an expectation that earnings delivery will be smooth for all listed state-owned contractors, which may not be the case as some contractors are facing land acquisition issues and funding constraints. We also expect new contracts to peak out this year and decline by 6% in 2018. On contrary to consensus Buy call on all listed state-owned contractors, we believe selective investing in the sector is the best approach given the peaking new contract growth and differing risk profile among the contactors. Our top picks in the sector are PTPP and WTON.
JCI : 5,825.10
Analyst Chong Tjen-San +60 3 26043972 [email protected] Tiesha PUTRI +6221 30034931 [email protected]
STOCKS
Source: AllianceDBS, DBSVI, Bloomberg Finance L.P. Closing price as of 5 Jul 2017 Waskita Karya : Waskita Karya is a stated owned construction company engaging in a wide variety of construction activities including highways, bridges, ports, airports, and LRT.
Pembangunan Perumahan : PT PP (Persero) is Indonesia's leading construction company with business portfolio encompassing from building and civil infrastructure constructions.
Wijaya Karya : Wijaya Karya is a construction company with interests in EPC, civil, building works, precast and realty.
Wijaya Karya Beton : Wika beton (a subsidiary of Wikaya Karya) is a leader in precast in Indonesia with c.40% market share.
Construction companies’ PE valuation range since 2012 (x)
Source: AllianceDBS, DBSVI
5
15
25
35
45
55
65
75
WSKT PTPP WIKA WTON
DBS Group Research . Equity 5 Jul 2017
Indonesia Industry Focus
Indonesia Construction
Refer to important disclosures at the end of this report
Price Mkt Cap Target Price Performance (%)
Rp US$m Rp 3 mth 12 mth Rating
Waskita Karya 2,270 2,306 2,400 (2.1) (6.8) HOLD Pembangunan Perumahan 3,330 1,545 4,100 2.8 (7.2) BUY
Wijaya Karya 2,220 1,491 2,050 (4.7) (15.6) HOLD Wijaya Karya Beton 605 395 760 (21.5) (33.7) BUY

Industry Focus
Page 2
We identify three key issues that will shape the sector's
performance for the rest of the year:
1) The speed of project execution. The three contractors
under our coverage are now sitting on a record-high order book. After two years of stellar new contract growth, we expect the pace of project awards for the big three state-owned contractors (Wijaya Karya, PT PP and Waskita Karya) to decelerate in the coming months given the already high new contract base last year (Rp157tr vs Rp84tr in 2015). That said, the focus will shift to project delivery, and consequently earnings.
2) Land acquisition funding. A number of land-intensive toll road projects have been awarded by the government and there are more new toll road concessions that are in talks. We identify over 2,500 km toll roads in the pipeline, exceeding the government’s initial target of developing 1,000 km new toll roads by 2019.
Land acquisition for infrastructure projects are typically funded by the government, but the disbursement of the funds has been delayed since last year due to bureaucratic hurdles.
A new scheme that allows the project owner to pre-finance the land acquisition cost while awaiting the government to disburse the funds has been adopted since then. However, this has also become an additional burden for the project owners’ balance sheets.
We believe the fund disbursement would be a positive catalyst for the sector to speed up land acquisition activities and project delivery.
3) Asset recycling and securitisation, particularly for Waskita Karya (WSKT), which has the highest exposure to toll road projects. WSKT has been actively acquiring stakes in greenfield toll road projects with the aim of selling them after the construction works complete. This strategy has also been adopted by other listed contractors, albeit at a much less aggressive pace.
A timely and value-accretive divestment will be a positive catalyst for the contractors. In addition, we estimate that a potential new contract worth Rp80tr would come from JSMR. However, given JSMR’s hefty funding needs, the execution of its securitisation and divestment plans are important to ensure that its new projects would take off.

Industry Focus
Page 3
New contract growth to peak out; execution to take the
spotlight
The three state-owned contractors under our coverage booked Rp47.5tr worth of new contracts in 5M17, a 71% increase y-o-y. This was driven largely by SOE and to some extent private contracts. We nonetheless anticipate the new contract growth to slow down in the coming months with the three contractors only guiding for a 4% increase in new contracts for FY17.
5M17 new contracts
*based on management’s target Source: Company, AllianceDBS, DBSVI Among the three state-owned contractors under our coverage, PTPP is guiding for the highest new contract growth of 25%, coming from a relatively low base last year where it won Rp32.6tr new contracts over the year (vs. WSKT at Rp70tr and WIKA at Rp54.8tr). WSKT announced its ambitious new contract growth of 14% to Rp80tr after more than doubling its new contracts last year. This forecast is above our expectations. WSKT has been able to secure large order books in the past two years by shifting its business model from a pure civil contractor to toll road developer. The company currently owns 18 toll road concessions through its subsidiary Waskita Toll Road. We estimate that most of the construction contracts were awarded and included in WSKT’s 2016 order book. Unlike last year where its new contract target was relatively secured, the company has to resume its toll road acquisition spree. This means that a strong and sustainable new contract growth will likely come at the expense of its balance sheet strength. In our view, this is a key negative given its already poor operating cashflow. Meanhile, WIKA expects its new contracts to decline by 21% due to the high base last year where the company was
awarded the Rp15.8tr Jakarta-Bandung HSR civil works construction contract. As new contracts are peaking out this year, project execution and earnings delivery would take the spotlight. New contract trend
*based on management’s target Source: Company, AllianceDBS, DBSVI New contract growth trend
*based on management’s target Source: Company, AllianceDBS, DBSVI Due to the government’s fiscal constraint, the rule of the game has changed. In the past, contractors were largely dependent on government-funded projects (with the exception of PTPP which in the past won a number of projects from private property developers), specifically infrastructure projects under Ministry of Public Works and Housing and Ministry of Transportation. Nowadays, balance sheet strength is becoming increasingly important as more big-ticket projects are implemented using the Public-Private Partnership (PPP) scheme. That said, contractors typically had to acquire equity stakes in the project to be able to win the civil work contracts.
7.6 7.2 13.0 1.6
20.0 12.6 14.9 2.3
46%
31%
19%
33%
0%5%10%15%20%25%30%35%40%45%50%
-
5.0
10.0
15.0
20.0
25.0
WIKA PTPP WSKT WTON
Rp tr
5M16 new contracts 5M17 new contracts % of FY17 guidance (RHS)
17.6 20.2 22.6
60.5
25.3 27.0
32.1
84.4
54.8
32.6
70.0
157.4
43.2 40.6
80.0
163.9
-
20.0
40.0
60.0
80.0
100.0
120.0
140.0
160.0
180.0
WIKA PTPP WSKT Total
Rp tr
FY14A FY15A FY16A FY17F*
-1%
3%
70%
19%
43%34%
42% 40%
117%
21%
118%
87%
-21%
25%
14%4%
-40%
-20%
0%
20%
40%
60%
80%
100%
120%
140%
WIKA PTPP WSKT Total
FY14A FY15A FY16A FY17F*

Industry Focus
Page 4
Government-funded projects that are up for bidding remain aplenty, but are more prone to delay, especially if the state’s revenue collection falls short of target. Meanwhile, the government’s strategy to decentralise its infrastructure budget from ministries to regional government also means a smaller chance for large-scale state-owned contractors, i.e. WIKA, PTPP and WSKT, to win the projects due to their relatively small ticket size, slower execution and tighter competition against regional players. New contracts from government-funded projects
Source: Company, AllianceDBS, DBSVI Contribution of government-funded projects* to total
new contract
*Excluding projects funded by SOE Source: Company, AllianceDBS, DBSVI Record-high order book to support revenue visibility On the positive side, the three contractors under our coverage are now sitting on a record-high order book. WSKT is leading with Rp92.9tr outstanding order book supported by the greenfield toll road acquisition spree by its 70%-owned subsidiary Waskita Toll Road. In second position is WIKA with
Rp76.2tr backlog contracts, of which 21% comes from the Jakarta-Bandung high-speed railway project (where WIKA has an effective stake of 23%). Meanwhile, PTPP has Rp58.1tr backlog contracts. Among the three contractors, PTPP’s order book is more diverse and least concentrated to a single or one type of project. Note that the majority of WKST’s order book are highly leveraged to toll road projects in Java while 21% of WIKA’s order book is from the Jakarta-Bandung high-speed railway project.
Contractors’ revenue visibility
*As et end of May 2017 Source: Company, AllianceDBS, DBSVI Land acquisition risk – same old story?
The three contractors under our coverage recorded a strong new contract growth of 86% y-o-y in FY16. Nonetheless, execution was slower than expected, particularly in 4Q16 with combined revenue of WSKT, WIKA and PTPP (ex-property and toll road operations) in the quarter only growing by 21% y-o-y, decelerating from the 40% growth booked in 9M16. The deceleration was mostly due to WIKA and PTPP, whose revenue ex-property grew by only 6% and 2% y-o-y respectively. Based on our checks, land acquisition issue remained the key hurdle as most of the contracts awarded in the past 12 months are land-intensive toll road projects. In our view, aside from technical issues, the project execution to some extent hinges on the disbursement of land acquisition funds. Our discussions with industry players suggest that land clearing process is typically faster when the funding is ready.
2.7
10.7 10.9 7.9
9.9 15.6
4.0
5.1
6.1
-
5.0
10.0
15.0
20.0
25.0
30.0
35.0
2014A 2015A 2016A
Rp tr
WIKA WSKT PTPP
15%
35%
20%
24%
43%
31%
19%
30%
20% 22%
19% 21%
-
5%
10%
15%
20%
25%
30%
35%
40%
45%
WIKA WSKT PTPP Total
2014 2015 2016
76.2 58.1
92.9
22.8 21.9
37.7
3.3
2.7
2.5
-
0.5
1.0
1.5
2.0
2.5
3.0
3.5
4.0
-10.0 20.0 30.0 40.0 50.0 60.0 70.0 80.0 90.0
100.0
WIKA PTPP WSKT
(x)Rp tr
Outstanding order book* (LHS)Revenue FY17F (LHS)Outst. order book/revenue FY17F (RHS)

Industry Focus
Page 5
Under the 2016 revised state budget and 2017 state budget, the government allocated Rp16tr and Rp20tr respectively to fund land acquisitions for infrastructure projects. As at the time of writing, a large part of the budget has yet to be disbursed due to bureaucratic and regulatory hurdles. As a result, toll road concession owners are asked to cover for the land costs to speed up execution. Land acquisition bailout fund from project owners
Source: Company, AllianceDBS, DBSVI Our discussions with project owners suggest that reimbursement will likely take time as the claim must be verified by two government agencies, Audit Board (BPK) and State’s Asset Management Agency (BLU LMAN). It is also worth noting that the budget allocation can only cover 57% of land acquisition cost estimated by Ministry of Public Work and Housing. Hence, the concession owners will likely continue to pre-finance the shortage to speed up the project execution. We have highlighted that more capital is required by contractors to grow their order books – either to acquire some stakes in the infrastructure projects they bid for or to work under semi-turnkey or turnkey projects. Given the high capital needs, the disbursement of the land acquisition budget will help to ease the cash flow burden of the project owners and allow them and the contractors to execute more projects.
Projects up for bidding In our past report (Indonesia Construction: Bridging ASEAN connectivity gap through port build-out), we listed down a number of transport-based infrastructure projects in the government’s pipeline. Job opportunities remain aplenty for contractors given Indonesia’s massive need for infrastructure upgrade. We however note that funding remains a challenge
especially with fiscal deficit being capped at 3% by law. In addition, the government is no longer actively injecting capital into SOEs. Alternative funding such as Private-Public Partnership (PPP) is required to enable the project to take off, but bureaucratic bottlenecks and complexity of land acquisition issues may push these projects backward. The government may also be more active in leveraging on foreign funding in line with One Belt One Road where the Jakarta-Bandung High Speed Rail is being financed by the China Development Bank. We narrow down our list to a number of transport-based infrastructure projects that in our view are the most plausible to be executed in the next 12 months based on our checks with contractors and project owners. Toll road – Rp80tr potential new contracts in 2017-2019 The government continues its aggressive rollout of new toll road projects although toll roads entering land acquisition or construction phases already far exceed the initial goal of 1,000 km. At the end of last year, Indonesia’s leading toll road operator Jasa Marga (JSMR) announced its plan to further expand its toll road network by another 800 km. This toll road expansion plan, if realised, will translate to c. Rp80tr worth of new jobs for contractors in 2017-2019. In our previous sector reports, we had noted that among all infrastructure projects, toll roads have shown the best progress among all of the government’s infrastructure initiatives, supported by land acquisition reform, capital injection to infra-related SOEs and given the less complex designing and civil work process. Based on our discussion with JSMR, a number of new toll roads will be rolled out in the near future. However, due to JSMR’s hefty funding needs, most of the projects will adopt contractor pre-financing (CPF) scheme (also known as “turnkey”) where contractors will only receive the payment once the toll road construction is entirely completed. We see a risk that these projects would command a lower profit margin compared to non-CPF toll road projects won in the past due to the higher working capital requirement. Port – eyes on Patimban project Port projects, on the other hand, have moved slower than our expectation. Two key issues are funding and the higher complexity of the projects, particularly on the design. Two port projects are currently in the tender process with one of them being the mega Patimban port project in West Java
16.4
5.4
20.2
7.0 4.7
7.1
43%
86%
35%
-10% 20% 30% 40% 50% 60% 70% 80% 90% 100%
-
5.0
10.0
15.0
20.0
25.0
Jasa Marga* Hutama Karya** Waskita Karya*
Rp tr
Total equity (LHS) Bailout fund (LHS) Bailout fund/total equity (RHS)

Industry Focus
Page 6
worth US$3bn (c. Rp40tr). Japan will likely finance most of the projects with the loan deal expected to be signed this year. Based on our channel check, local contractors can win at least 40% of the total contract value, or approximately Rp16tr, while the remaining will likely be awarded to foreign contractors, depending on the loan term. In a recent Belt and Road Forum in Beijing, there are also two port projects offered to China for financing, namely Kuala Tanjung port and Bitung port. The projects will comprise several phases. Both ports are estimated to cost Rp34tr each. High-speed and urban railway – some changes to the initial plans The likelihood of government expanding the planned Jakarta-Bandung high-speed railway network to Surabaya appears to be lower now. Instead, it is mulling over revitalising the existing railway by building an elevated track. Nevertheless, the potential new order book from this railway revitalisation project would still be sizeable at Rp80tr. The plan to build an LRT in Bandung was also called off. Based on our checks, the project will likely be replaced by metro capsule which has a lower investment cost (c. Rp1tr). Meanwhile, there has been a discussion on LRT development in Surabaya. A feasibility study for the project is currently taking place, however the contract size is estimated to only reach Rp3.8tr. Another urban railway project scheduled to start this year is MRT phase 2. The MRT track will be entirely underground and span 14 km from Hotel Indonesia Roundabout to Ancol. The project is estimated to cost at least Rp22.5tr. Note that WIKA has constructed 15% of the underground portion for the current Jakarta MRT line and should be a front runner for this portion.
We expect 2018 new contracts to start declining. New contracts of the big three state-owned contractors have surged from a mere Rp60.5tr in FY14 to Rp157.3tr in FY16, supported by higher government infrastructure spending, both through ministerial spending and the multiplier of capital injection to SOEs. In 2017, the big three state contractors only guided for a 4% y-o-y growth after almost doubling their new contracts y-o-y in 2016. With the government being less active in injecting capital into SOEs and given that the contractors already have a sizable outstanding order book to be delivered over the next 1-2 years, we think a further surge in new contracts is less likely.
On the subsequent page, we present our new contract estimates after taking into account the contribution from the central government’s annual capex spending. New contracts – what can surprise on the upside? For power plant projects, competition is tighter as state-owned contractors also compete with private players, both from local and foreign countries. As at end of December 2016, only power plants with total capacity of 14.6 GW were still in the initial phase (planning and procurement). Assuming US$1.5m investment per megawatt, this would translate to potential new contracts of Rp291.9tr. However, a big chunk of the investment is related to EPC while for the civil works, the size is typically less than 30% of the total investment. Given the high complexity of power plant projects and intense competition from more experienced foreign EPC players, we only take into account the civil works with 50% winning rate for the three contractors. An increase in winning rate is possible if the contractors actively participate as an equity investor in the power plant projects. Progress of 35 GW programme (as at end of 2016)
Source: PLN
Planning, 5,824
Procurement, 8,810
Power Purchase
Agreement, 10,063
Construction, 10,291
Operational, 707 Start
Industry Focus
Page 7
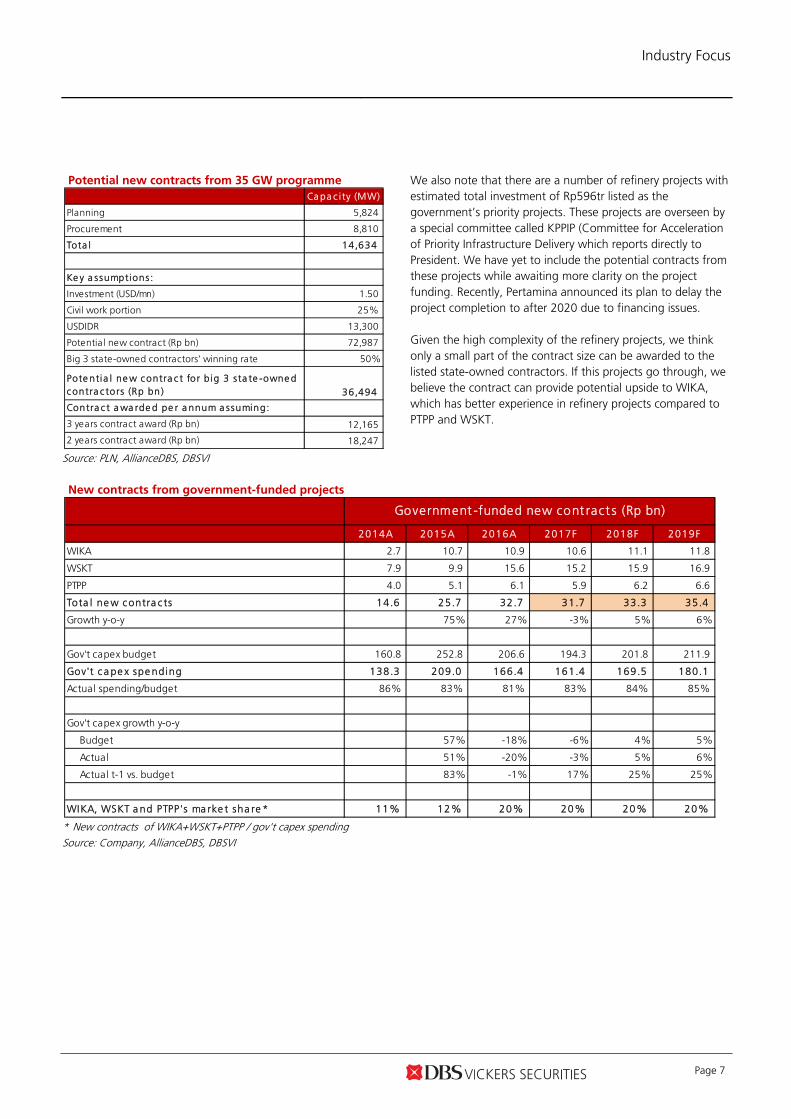
Potential new contracts from 35 GW programme
Source: PLN, AllianceDBS, DBSVI
We also note that there are a number of refinery projects with estimated total investment of Rp596tr listed as the government’s priority projects. These projects are overseen by a special committee called KPPIP (Committee for Acceleration of Priority Infrastructure Delivery which reports directly to President. We have yet to include the potential contracts from these projects while awaiting more clarity on the project funding. Recently, Pertamina announced its plan to delay the project completion to after 2020 due to financing issues. Given the high complexity of the refinery projects, we think only a small part of the contract size can be awarded to the listed state-owned contractors. If this projects go through, we believe the contract can provide potential upside to WIKA, which has better experience in refinery projects compared to PTPP and WSKT.
New contracts from government-funded projects
* New contracts of WIKA+WSKT+PTPP / gov't capex spending Source: Company, AllianceDBS, DBSVI
Ca pa c i ty (MW)
Planning 5,824
Procurement 8,810
Tota l 14,634
Ke y a ssumptions :
Investment (USD/mn) 1.50
Civil work portion 25%
USDIDR 13,300
Potential new contract (Rp bn) 72,987
Big 3 state-owned contractors' winning rate 50%
Pote ntia l ne w contra c t for b ig 3 s ta te -owne d contra c tors (Rp bn) 36,494
Contra c t a wa rde d pe r a nnum a ssuming:
3 years contract award (Rp bn) 12,165
2 years contract award (Rp bn) 18,247
2014A 2015A 2016A 2017F 2018F 2019F
WIKA 2.7 10.7 10.9 10.6 11.1 11.8
WSKT 7.9 9.9 15.6 15.2 15.9 16.9
PTPP 4.0 5.1 6.1 5.9 6.2 6.6
Tota l ne w contra c ts 14.6 25.7 32.7 31.7 33.3 35.4
Growth y-o-y 75% 27% -3% 5% 6%
Gov't capex budget 160.8 252.8 206.6 194.3 201.8 211.9
Gov't c a pe x spe nding 138.3 209.0 166.4 161.4 169.5 180.1
Actual spending/budget 86% 83% 81% 83% 84% 85%
Gov't capex growth y-o-y
Budget 57% -18% -6% 4% 5%
Actual 51% -20% -3% 5% 6%
Actual t-1 vs. budget 83% -1% 17% 25% 25%
WIKA, WSKT a nd PTPP's ma rke t sha re * 11% 12% 20% 20% 20% 20%
Government -funded new cont ract s (Rp bn)

Industry Focus
Page 8
Identifiable projects in 2017F – 2018F
Project Location Investment (Rp bn)
Toll road
Jasa Marga's toll road expansion plan Indonesia 80,000
Railway
Bandung-Surabaya railway revitalisation West Java, East Java 80,000
Bandung Metro Capsule West Java 1,000
Surabaya LRT East Java 3,800
Jakarta MRT Phase 2* Jakarta 3,375
Port
Patimban Port Stage 1 Phase 1* West Java 7,052
Kuala Tanjung Port Phase 2* North Sumatra 3,200
Power
2018F Indonesia 18,247
Government-funded projects
2018F state budget Indonesia 33,281
Total 229,955
2018F new contract assuming two years of contract award 149,955
New contracts
FY15A 84,380
FY16A 157,337
FY17F 159,787
FY18F 149,955
New contract growth y-o-y
FY16A 86%
FY17F 2%
FY18F -6%
* Civil work portion only Source: Company, various media sources, AllianceDBS, DBSVI

Industry Focus
Page 9
On to the next catalysts Below we highlight five upcoming events and two mega projects that will likely become the key catalysts for the sector and the individual companies. 1) 2018 Fiscal Budget proposal (August 2017)
The government is scheduled to submit the budget proposal to parliament in August 2017. The amount the government allocates for infrastructure development and state-owned enterprises (if any) will be important to gauge the direction of contractors’ order book growth in 2018.
2) Waskita Toll Road divestment WSKT plans to further divest its stake, while Waskita Toll Road also plans to sell 3-4 toll roads this year. The contractor has shifted its business model to become a toll road developer, which is highly capital intensive. While the impact on WSKT will depend on the toll road’s valuation, the divestment proceeds should help to ease WSKT’s cash flow burden.
3) CDB loan disbursement for Jakarta-Bandung high-speed railway (HSR) project The construction of Jakarta-Bandung HSR has come to a halt after the groundbreaking ceremony in January 2016 due to prolonged delay on financial close. The loan agreement was finally signed in May 2017. Nonetheless, the disbursement will be pending the verification of land acquisition progress by an independent auditor. WIKA, which leads the local consortium for the project, expects the loan to be disbursed and the construction works to resume in July 2017. The resumption of the project will be positive for both WIKA and WTON.
4) PTPP’s 2Q17 earnings release
After recording a weaker-than-expected construction revenue in the past two consecutive quarters mainly due to land acquisition issue, 2Q17 will be an important quarter to regain investor’s confidence on PTPP’s ability to execute its large outstanding order book. In May 2017 analyst briefing, the management assured investors that the revenue should catch up in 2Q17 with a target revenue of Rp10tr in 1H17. This implies Rp7.1tr revenue target in 2Q17 vs. Rp2.9tr achieved in 1Q16.
5) Jasa Marga’s securitisation and subsidiary IPO plan JSMR is planning to expand its toll road network up to 800 km by 2019, on top of the c. 600 km greenfield toll roads in its existing pipeline. Due to the hefty investment needed, any fund-raising activities, particularly the securitisation of its mature toll roads and divestment of its subsidiaries, will help to ensure that its existing and upcoming pipelines can be executed timely.
6) Patimban port The location of Patimban port has been approved by the government. More clarity on the project should come after the signing of the loan commitment from Japan, which is expected to take place in July 2017. The tender of the project is ongoing. Based on our checks, two contractors under our coverage, PTPP and WIKA, are vying for the project.
7) Jakarta-Surabaya railway revitalisation Given the sizeable project size, that is Rp80tr or approximately 51% of the combined FY16 new contract achievement of WIKA, PTPP and WSKT, more clarity on the project would be positive catalyst for the sector.

Industry Focus
Page 10
What is consensus expecting?
Consensus is expecting 47% y-o-y revenue growth in FY17 for the big three state-owned contractors with net profit growing slower at 33% y-o-y. As a comparison, the big three state-owned contractors booked 34% y-o-y revenue growth and 54% headline net profit growth in FY16. Current consensus’ earnings forecasts imply an expectation that consolidated EBIT and net margin would shrink in FY17. A similar trend was also implied on consensus’ 2018 earnings forecast. We believe this is because the consensus expects competition among contractors to tighten, coupled with higher financing needs. The magnitude of net margin decline in 2017 based on consensus expectation is the largest on WSKT, followed by WIKA. Consensus’ 2017 net profit revision
Source: Bloomberg Finance L.P Consensus’ 2018 net profit revision
Source: Bloomberg Finance L.P
Valuation and recommendation
Construction sector’s 12-month forward PE
Source: Bloomberg Finance L.P, AllianceDBS, DBSVI Construction sector’s 12-month forward PE relative to JCI
Source: Bloomberg Finance L.P, AllianceDBS, DBSVI
We are turning Neutral on Indonesia’s construction sector from Positive previously. The sector’s PE multiple has derated significantly in the past few months. However, we do not see any significant catalyst that will support a broad-based upward re-rating in the near future. We expect new contract growth to decelerate in the coming months and we think government-funded projects are unlikely to provide significant upside potential to our order book forecasts as the government continues to decentralise infrastructure development. As the government seeks funding alternatives and push the PPP scheme, capital requirement to win a project will continue to rise up to the point where contractors have to choose between growing their order books (at the expense of higher interest expense and margins) or coping with a declining order book. We like PTPP due to its attractive valuation and promising growth outlook. The company now trades at 0.34x EV/order
28%27%
15%
-6%
16%
6%
1%-1%1%
-3%
3%
-0.2%
0%
-10%
-5%
0%
5%
10%
15%
20%
25%
30%
35%
WSKT WIKA PTPP WTON
Past 12 months YTD Post FY16 audited results Post 1Q17 results
28%
12%
17%
-18%
14%
5%
-1%
1% -4% 3%-1%
-20%
-10%
0%
10%
20%
30%
40%
WSKT WIKA PTPP WTON
Past 12 months YTD Post FY16 audited results Post 1Q17 results
5
10
15
20
25
30
Jan
-12
Ap
r-1
2
Jul-
12
Oct
-12
Jan
-13
Ap
r-1
3
Jul-
13
Oct
-13
Jan
-14
Ap
r-1
4
Jul-
14
Oct
-14
Jan
-15
Ap
r-1
5
Jul-
15
Oct
-15
Jan
-16
Ap
r-1
6
Jul-
16
Oct
-16
Jan
-17
Ap
r-1
7
+2sd
+1sd
‐1sd
‐2sd
Avg.
-60%
-50%
-40%
-30%
-20%
-10%
0%
10%
20%
30%
40%
5
10
15
20
25
30
Jan-
12
Apr
-12
Jul-1
2
Oct
-12
Jan-
13
Apr
-13
Jul-1
3
Oct
-13
Jan-
14
Apr
-14
Jul-1
4
Oct
-14
Jan-
15
Apr
-15
Jul-1
5
Oct
-15
Jan-
16
Apr
-16
Jul-1
6
Construction PE premium to JCI (RHS) Construction PE
JCI PE Avg. construction PE premium to JCI (RHS)

Industry Focus
Page 11
book, lower than WSKT at 0.61x. It is also worth noting that PTPP has a smaller capex commitment compared to WSKT, and a relatively less leveraged balance sheet to support its future earnings and new contract growth. We forecast PTPP’s net profit to grow at a CAGR of 27% in 2016A-2018F. While WIKA’s EV/order book multiple is on par with PTPP, it is now trading at 17.5x 17F PE (vs. PTPP at 15.4x 17F PE). Given the higher PE multiple and downside risk on earnings, we prefer to wait for the Jakarta-Bandung HSR progress to accelerate before turning more positive on the stock. As work on the projects commence, WTON is in a sweet spot as it starts to receive new orders from contractors/project owners. We view WTON as a good proxy to the infrastructure sector given its strong presence across Indonesia. EV/order book
*As at end of March 2017; ** As of 5 July 2017 Source: Company, AllianceDBS, DBSVI Gross and net gearing*
*As at end of March 2017 Source: Company, AllianceDBS, DBSVI
Where we differ
We are less bullish on the sector compared to the street, particularly on WIKA and WSKT. The consensus Buy call on all listed state-owned contractors (refer to the table below) suggests that a broad-based execution improvement is expected to lift the share prices of all state-owned contractors. On the contrary, given the peaking new contract growth and differing risk profile among the contractors, we believe selective investing in the sector is the best approach. DBS vs. consensus’ recommendation
Source: AllianceDBS, DBSVI, Bloomberg Finance L.P. Our FY17 net profit forecasts for WIKA and WSKT are one of the lowest on the street. We have a HOLD call among consensus Buy calls on both companies. WIKA. WIKA’s FY17 net profit largely depends on the construction progress of Jakarta-Bandung high-speed railway. Assuming 6.3% net margin and 37% progress for FY17, the project (ex-precast) should contribute Rp183bn net profit to WIKA or 30% of management’s net profit target for FY17. We see downside risk on WIKA’s net profit given that the construction work is expected to resume only in July 2017. Our FY17 net profit forecast for WIKA is 9% lower than consensus as we expect higher capital requirement and debt to support its new contract and earnings growth. WSKT. Our net profit forecasts for WSKT are 9%/27% lower relative to consensus as we have factored in potential start-up losses from its toll road business. Summary of net profit forecast changes
Source: AllianceDBS, DBSVI
76.2 58.1 92.9 20.0 19.9
56.8 0.26 0.34
0.61
0.41
-
0.10
0.20
0.30
0.40
0.50
0.60
0.70
-
20.0
40.0
60.0
80.0
100.0
WIKA PTPP WSKT Avg.
(x)Rp tr
Outstanding order book* (LHS) EV** (LHS) EV/outst. order book* (RHS)
0.54 0.47
1.28
0.32
-0.08 -0.16
0.83
0.25
-0.40
-0.20
0.00
0.20
0.40
0.60
0.80
1.00
1.20
1.40
WIKA PTPP WSKT WTON
Gross gearing Net gearing
BUY HOLD SELL
WIKA 32 25 7 0 HOLDPTPP 29 29 0 0 BUYWSKT 29 25 4 0 HOLDWTON 16 14 1 1 BUY
No. of a na lyst
Conse nsus ' re c omme nda tion DBS' re c omme nda tion
Old New Change Old New Change
WSKT 1,824 2,168 19% 1,745 2,209 27%
WIKA 1,111 1,140 3% 1,530 1,595 4%
PTPP 1,331 1,341 1% 1,645 1,644 0%
WTON 366 366 0% 418 418 0%
A ggregate 4,632 5,016 8% 5,338 5,865 10%
F Y17F net prof it F Y18F net prof it
Industry Focus
Page 12
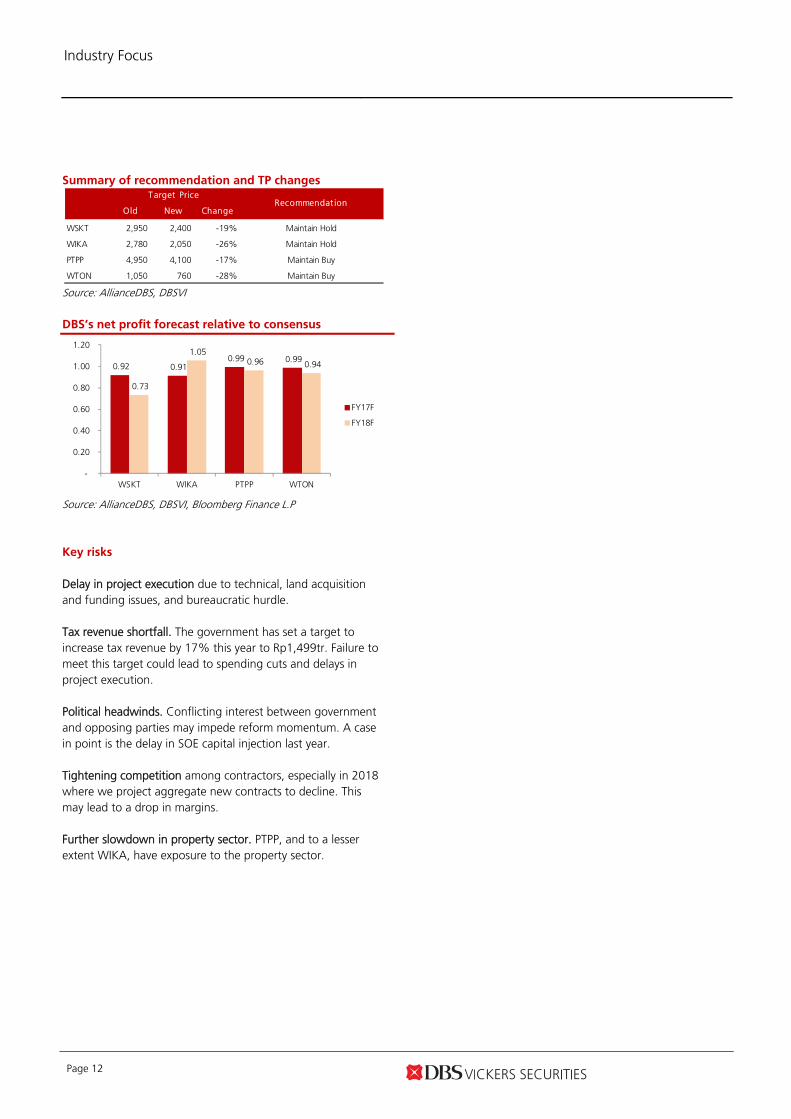
Summary of recommendation and TP changes
Source: AllianceDBS, DBSVI
DBS’s net profit forecast relative to consensus
Source: AllianceDBS, DBSVI, Bloomberg Finance L.P
Key risks
Delay in project execution due to technical, land acquisition and funding issues, and bureaucratic hurdle. Tax revenue shortfall. The government has set a target to increase tax revenue by 17% this year to Rp1,499tr. Failure to meet this target could lead to spending cuts and delays in project execution. Political headwinds. Conflicting interest between government and opposing parties may impede reform momentum. A case in point is the delay in SOE capital injection last year. Tightening competition among contractors, especially in 2018 where we project aggregate new contracts to decline. This may lead to a drop in margins. Further slowdown in property sector. PTPP, and to a lesser extent WIKA, have exposure to the property sector.
Old New Change
WSKT 2,950 2,400 -19% Maintain Hold
WIKA 2,780 2,050 -26% Maintain Hold
PTPP 4,950 4,100 -17% Maintain Buy
WTON 1,050 760 -28% Maintain Buy
T arget PriceRecommendat ion
0.92 0.91 0.99 0.99
0.73
1.05 0.96 0.94
-
0.20
0.40
0.60
0.80
1.00
1.20
WSKT WIKA PTPP WTON
FY17F
FY18F

Industry Focus
Page 13
Valuation summary
*Non-rated; based on Bloomberg consensus **Order book as at end of May 2017 Source: AllianceDBS, DBSVI, Bloomberg Finance L.P
M arketC ap P rice R ec. T P EP S C A GR EV/ N et
( ID R bn) ( ID R ) F Y17 F Y18 F Y17 F Y18 F Y17 F Y18 F Y17 F Y18 F Y16A -18F
o rder bo o k**
Gearing(x)
Wijaya Karya 19,913 2,270 HOLD 2,050 17.5 12.5 1.6 1.5 9.1 7.4 10% 12% 6% 0.26 Net Cash
PT PP (Persero) 20,646 3,330 BUY 4,100 15.4 12.6 1.9 1.7 8.6 7.4 13% 14% 12% 0.34 Net Cash
Waskita Karya 30,813 2,270 HOLD 2,400 14.2 13.9 2.4 2.1 13.0 12.4 18% 16% 14% 0.61 0.83
Adhi Karya* 7,763 2,180 N/R N/A 12.8 8.8 1.3 1.1
Wijaya Karya Beton 5,273 605 BUY 760 14.4 12.6 1.9 1.7 8.4 7.4 14% 15% 24% 1.07 0.25
Simple average 14.8 12.1 1.8 1.6 9.7 8.7 14% 14%
Weighted average 15.1 12.7 2.0 1.7 9.5 8.6 13% 13%
P / B (x)
D ilutedP E (x)
EV/EB IT D A (x) R OA E

Industry Focus
Page 14
Company Guides

ASIAN INSIGHTS VICKERS SECURITIES ed: JS / sa:MA, PY
HOLD
Last Traded Price ( 5 Jul 2017): Rp2,270 (JCI : 5,865.40) Price Target 12-mth: Rp2,400 (6% upside) (Prev Rp2,950) Analyst Chong Tjen-San +60 3 26043972 [email protected] Tiesha PUTRI +6221 30034931 [email protected]
What’s New Funding risk reduced post sale of stake in Waskita
Toll Road but further fund raising required
Maintain HOLD with a lower SOP-based TP of
Rp2,400
Toll road divestment is key catalyst
Price Relative
Forecasts and Valuation FY Dec (Rp m) 2015A 2016A 2017F 2018F Revenue 14,153 23,788 37,666 49,997 EBITDA 2,041 3,527 5,332 6,674 Pre-tax Profit 1,398 2,481 3,688 4,113 Net Profit 1,048 1,713 2,168 2,209 Net Pft (Pre Ex.) 955 1,713 2,168 2,209 Net Pft Gth (Pre-ex) (%) 90.4 79.4 26.6 1.9 EPS (Rp) 77.2 126 160 163 EPS Pre Ex. (Rp) 70.4 126 160 163 EPS Gth Pre Ex (%) 35 79 27 2 Diluted EPS (Rp) 77.2 126 160 163 Net DPS (Rp) 15.4 25.2 32.0 32.5 BV Per Share (Rp) 703 816 950 1,081 PE (X) 29.4 18.0 14.2 13.9 PE Pre Ex. (X) 32.3 18.0 14.2 13.9 P/Cash Flow (X) 46.8 nm nm nm EV/EBITDA (X) 16.4 14.5 13.0 12.4 Net Div Yield (%) 0.7 1.1 1.4 1.4 P/Book Value (X) 3.2 2.8 2.4 2.1 Net Debt/Equity (X) 0.3 0.9 1.7 2.1 ROAE (%) 17.0 16.6 18.1 16.0 Earnings Rev (%): 7 19 27 Consensus EPS (Rp): N/A 181 230 Other Broker Recs: B: 25 S: 0 H: 4
Source of all data on this page: Company, AllianceDBS, DBSVI, Bloomberg Finance L.P
Further fund raising needed Funding risk reduced post sale of stake in Waskita Toll Road but further fund raising is needed. Waskita Karya (WSKT) has shifted to a more capital-intensive business model with 18 toll road concessions in its portfolio (of which 10 concessions are majority owned by WSKT through Waskita Toll Road or WTR). Hefty funding will be required to keep growing its order book and earnings at the current pace. WSKT recently raised Rp3.5tr cash through a 29% stake sale in WTR to SMI and a state-owned pension fund Taspen. We view this positively as it would help to reduce funding concerns and ease potential start-up losses. Nonetheless, further fund raising or divestments would be needed. Post divestment to Taspen and SMI, we estimate that WSKT would still need more than Rp7.2tr cash to fund its equity portion for its toll road concessions over the next three years. Where we differ. We are one of the few houses in the market with a HOLD call compared to Buy calls on the stock. Our earnings forecast for FY17F/FY18F are 8%/27% below consensus as we have factored in potential start-up losses from WSKT’s toll road business. We are also concerned on its persistent negative operating cash flow arising from increasing contribution of turnkey projects. We believe consensus may be over estimating the ease of further equity raising to fund its toll road expansion. This is especially in light of diminishing prospects of more capital injections by the government. Potential catalysts. WSKT plans to further divest its stake in WTR, while its subsidiary Waskita Toll Road also plans to sell 3-4 toll roads this year. While the impact on WSKT will depend on the toll road’s valuation, divestment proceeds should help to ease WSKT’s cash flow burden. Valuation:
We valued WSKT’s construction business at 10x FY17F EPS (-1.5SD below sector historical mean PE), precast business at 15x FY17F EPS and toll road concessions using the DCF method. Our sum-of-the-parts TP of Rp2,400 implies 15x FY17F PE. Key Risks to Our View:
Failure to divest its toll roads could result in lower earnings and an overstretched balance sheet. At A Glance Issued Capital (m shrs) 13,574 Mkt. Cap (Rpbn/US$m) 30,813 / 2,306 Major Shareholders (%) Republic of Indonesia 68.0
Free Float (%) 32.0 3m Avg. Daily Val (US$m) 2.7 ICB Industry : Industrials / Construction & Materials
DBS Group Research . Equity 5 Jul 2017
Indonesia Company Guide
Waskita Karya Version 6 | Bloomberg: WSKT IJ | Reuters: WSKT.JK Refer to important disclosures at the end of this report

ASIAN INSIGHTS VICKERS SECURITIES Page 16
Company Guide
Waskita Karya
WHAT’S NEW
Cutting TP to Rp2,400; further toll road divestment is key catalyst
Order book at record high, boosting its revenue visibility to 2.5 years. We estimate WSKT’s outstanding order book stood at Rp92.9tr as at end of May 2017 after winning Rp14.9tr worth of new contracts in 5M17. WSKT’s sizeable backlog which mainly comprises of Trans Java toll roads and Palembang LRT offers revenue visibility for 2.5 years.
Revised up new contract assumptions and earnings. Due to the strong new contract flows in 4Q17, we raised our FY17F new contract assumption to Rp78tr (from Rp40tr previously). With a higher order book, we revised up our FY17F/FY18F net profit by 19%/27%. Despite the upward revision, our earnings forecast for FY17F/FY18F are 8%/27% below consensus as we have factored in potential start-up losses from WSKT’s toll road business.
Cutting TP to Rp2,400. We updated our sum of parts (SOP) valuation, resulting in a lower TP of Rp2,400, from Rp2,950 previously. We value WSKT’s ex-precast and toll road business at 10x PE 17F (1.5SD below sector’s historical mean). Our PE multiple is at discount to sector’s historical mean PE given the nature of WSKT’s business where the big chunk of the construction earnings can only be converted to cash upon the divestment of its toll road concession.
We pegged Waskita’s precast business, WSBP, at 15x PE FY17F, a 20% discount to our target multiple for Wijaya Karya Beton (WTON). We think the discount is justified
because of its smaller geographical presence, less extensive product range and narrower clientele. Lastly, we value WSKT’s toll road concessions using DCF. We apply 10% WACC and 0% long-term growth as we run our DCF until the end of the concession period. Note that we have yet to take into account WSKT’s five newly acquired toll roads into our calculation i.e. Kuala Tanjung – Tebing Tinggi – Parapat (143 km), Cileunyi – Sumedang – Dawuan (60 km), Cibitung – Cilincing (35 km), Krian – Legundi – Blunder – Manyar (38 km) and Kaya Agung – Palembang – Betung (112 km), as we await more details on these concessions.
Looking beyond this year’s strong earnings outlook. We maintain our Hold call on WSKT. We think the stock is fairly valued at current price, trading at 14.2x 17F PE with net profit CAGR of 14% in 2016-2018F. Despite the strong earnings growth outlook this year (we forecast 27% net profit growth in FY17F), we reserve our concern over the company’s cash flow generation and its high capex commitment to fund its toll road concessions. We believe hefty funding is needed to keep growing its order book and earnings at the current pace. Further divestment of its toll road concession at a favourable price is key catalyst for the stock.
Operating cash flow and capex trend and forecasts
Source: Company, AllianceDBS, DBSVI
Gearing trend and forecasts
Source: Company, AllianceDBS, DBSVI
WSKT’s sum of parts (SOP) valuation
Equity value
(Rp bn)
WSKT's effective
ownership
Equity value (adj. to
ownership)
Equity value per share % of TP Remarks
WSKT ex-precast and toll road business
18,118 100% 18,118 1,335 56% Based on target PE of 10x; -1.5SD below sector historical mean
Precast (WSBP IJ) 14,389 60% 8,633 636 27% Based on target PE of 15x
Toll road (WTR) 5,366 395 16% DCF; 10% WACC
Target price (Rp/share) 2,400
Implied PE 17F (x) 15.0
Source: AllianceDBS, DBSVI
(89) 658
(7,762)
(3,201)(1,747)
1,210
7,086 6,261
13,983
10,661
(10,000)
(5,000)
0
5,000
10,000
15,000
20,000
2014A 2015A 2016A 2017F 2018F
Rp bn
Operating cash flow Capex
0.54
0.26
0.87
1.68
2.05
1.14
0.83
1.50
1.84 2.10
-
0.50
1.00
1.50
2.00
2.50
2014A 2015A 2016A 2017F 2018F
(x)
Net gearing Gross gearing

ASIAN INSIGHTS VICKERS SECURITIES Page 17
Company Guide
Waskita Karya
Earnings revision
2017F 2018F
Old New % change Old New % change
Revenue 32,055 37,666 18% 37,900 49,997 32%
Gross profit 4,687 6,111 30% 5,381 7,699 43%
EBIT 3,767 4,932 31% 4,281 6,141 43%
Net Profit 1,824 2,168 19% 1,745 2,209 27%
GP margin (%) 14.6 16.2 14.2 15.4
EBIT margin (%) 11.8 13.1 11.3 12.3
Net margin (%) 5.7 5.8 4.6 4.4
New contracts (Rp bn) 40,000 78,000 95% 25,000 67,939 172%
Cum. order book (Rp bn) 116,219 155,514 34% 114,361 184,788 62%
Net interest exp. 641 1,245 94% 783 2,029 159%
Source: AllianceDBS, DBSVI

ASIAN INSIGHTS VICKERS SECURITIES Page 18
Company Guide
Waskita Karya
CRITICAL DATA POINTS TO WATCH
Critical Factors
A shift in business model. Following the toll road acquisition spree over the past two years, WSKT has shifted its business model to become more of a toll road developer from a pure civil contractor previously. The company would continue to acquire greenfield toll road concessions in the foreseeable future, build them and divest the stakes after the construction is completed to free up capital. This way, it would be able to secure profit in a shorter time span compared to if it operates the toll roads over the concession period on its own, as the company would be able to reap gains from both the civil work (during construction phase) and the asset divestment. Its subsidiary Waskita Toll Road is the majority stakeholder for nine toll road concessions in Java and one in Sumatra with a total investment value of Rp65tr. It also owns minority stakes in eight other toll road concessions. All eyes on toll road divestment. The change in business model makes toll road divestments crucial for WSKT given the high capital requirements to build the toll roads. Assuming a capital structure of 70% debt and 30% equity for its toll roads, we estimate that WSKT would need to raise Rp7.2tr cash over the next three years to fund its equity stakes. With the current shareholding structure of Waskita Toll Roads, we estimate WSKT would have to raise debt by c.Rp25tr. This would further exacerbate its weak operating cash flow position. Given the potential surge in interest expense, its earnings outlook could be at risk. We believe toll road divestments will remain a key focus from 2017 onwards. New wins from government or external parties. The award of new contracts had been a key positive driver of WSKT’s share price. This was evident where the strong growth in new contracts in 2015-2016 drove the shares’ outperformance in the same period. However, we think the concern over the sustainability of its new contract wins has outweighed the excitement over its recent new contract wins, especially since most of the growth in its order book has been driven by its internal toll road projects instead of the government or external projects. Note that internal toll road projects are riskier in nature as the profit would only fully translate into cash upon the divestment of the concessions – a process that would likely take additional time. This has caused WSKT’s share price to underperform the market despite the company’s relatively strong new contract and earnings growth (refer to Appendix 1) in the past few months.
New Contract Wins (Rp bn)
Carry Over Contract (Rp bn)
Construction Gross Margin (%)
Source: Company, AllianceDBS, DBSVI

ASIAN INSIGHTS VICKERS SECURITIES Page 19
Company Guide
Waskita Karya
Appendix 1: A look at the company's listed history – what drives its share price?
WSKT share price vs. peers*
*Based on the average return of the listed state-owned contractors Source: Company, AllianceDBS, DBSVI A: Rupiah fluctuation WSKT’s share price was hit by concerns over profitability after the sharp depreciation of Rupiah in mid-2013. Investors saw infra project’s cost overrun as a key risk, which could lead to a decline in contractors’ profitability. The risk was deemed higher on WSKT as it was more reliant on government contracts compared to peers. WSKT’s share price vs. Rupiah
Source: Bloomberg Finance L.P. B: Share price moved in line with new contract growth WSKT’s new contracts grew strongly by 70% y-o-y in FY16, outperforming its peers, PT PP (PTPP) and Wijaya Karya (WIKA), whose new contracts were flat y-o-y.
WSKT’s share price vs. growth in new contracts
Source: Company, AllianceDBS, DBSVI, Bloomberg Finance L.P. C: Earnings momentum The company delivered strong earnings in 1H16, fueled by enlarged capital post rights issue. In addition, strong earnings momentum (with consensus upgrading earnings forecasts by 43% in the same period) led to a rally in its share price. WSKT’s share price vs. consensus’ earnings forecasts
Source: Bloomberg Finance L.P.
-
0.5
1.0
1.5
2.0
2.5
0
500
1,000
1,500
2,000
2,500
3,000
Dec-12 Jun-13 Dec-13 Jun-14 Dec-14 Jun-15 Dec-15 Jun-16 Dec-16
WSKT share price (LHS) WSKT share price vs. peers* (RHS)Dec 18, 2012 = 1.0
AB
C
D
E
8,000
9,000
10,000
11,000
12,000
13,000
14,000
15,000
16,000
0
100200
300
400500
600
700800
900
WSKT share price (LHS) USDIDR (RHS)
-50%
0%
50%
100%
150%
200%
-
500
1,000
1,500
2,000
2,500
3,000
Dec
-12
Mar
-13
Jun-
13
Sep-
13
Dec
-13
Mar
-14
Jun-
14
Sep-
14
Dec
-14
Mar
-15
Jun-
15
Sep-
15
Dec
-15
Mar
-16
Jun-
16
Sep-
16
Dec
-16
Mar
-17
WSKT share price (LHS) T12M new contract growth y-o-y (RHS)
50
70
90
110
130
150
170
190
1,000 1,200 1,400 1,600 1,800 2,000 2,200 2,400 2,600 2,800 3,000
WSKT share price (LHS) Consensus EPS 16F (RHS) Consensus EPS 17F (RHS)
ASIAN INSIGHTS VICKERS SECURITIES Page 20
Company Guide
Waskita Karya
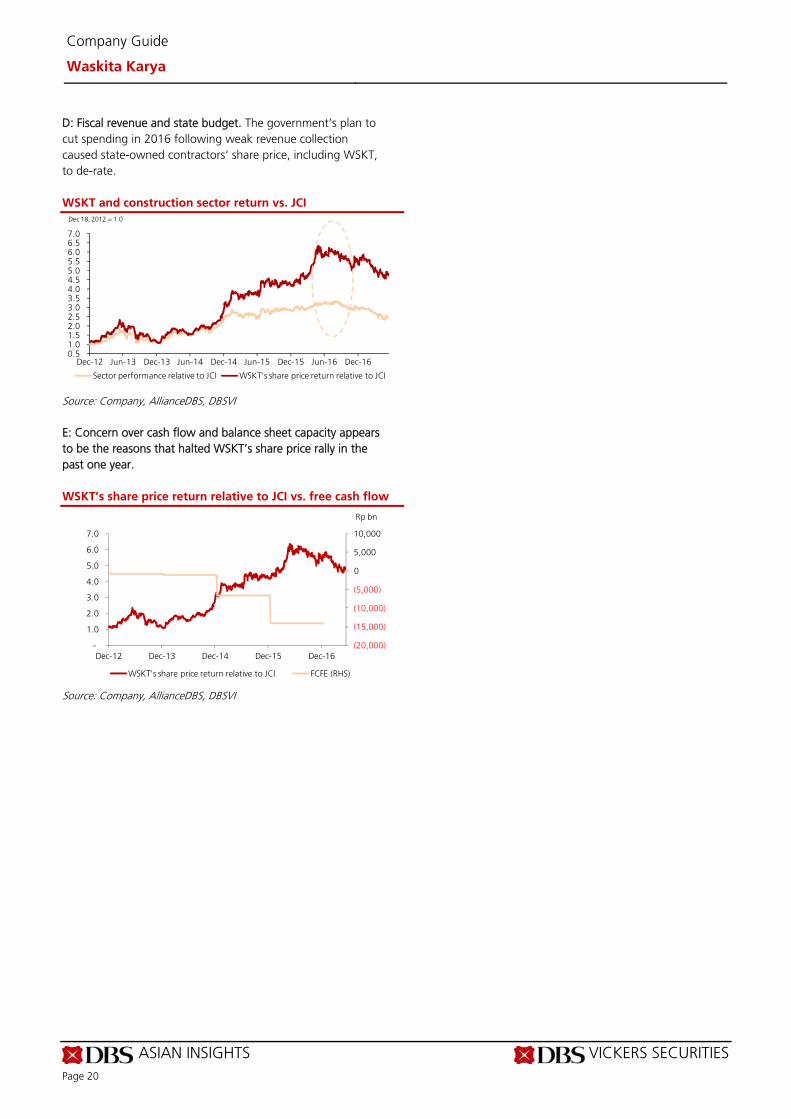
D: Fiscal revenue and state budget. The government’s plan to cut spending in 2016 following weak revenue collection caused state-owned contractors’ share price, including WSKT, to de-rate.
WSKT and construction sector return vs. JCI
Source: Company, AllianceDBS, DBSVI E: Concern over cash flow and balance sheet capacity appears to be the reasons that halted WSKT’s share price rally in the past one year. WSKT’s share price return relative to JCI vs. free cash flow
Source: Company, AllianceDBS, DBSVI
0.5 1.0 1.5 2.0 2.5 3.0 3.5 4.0 4.5 5.0 5.5 6.0 6.5 7.0
Dec-12 Jun-13 Dec-13 Jun-14 Dec-14 Jun-15 Dec-15 Jun-16 Dec-16
Sector performance relative to JCI WSKT's share price return relative to JCI
Dec 18, 2012 = 1.0
(20,000)
(15,000)
(10,000)
(5,000)
0
5,000
10,000
-
1.0
2.0
3.0
4.0
5.0
6.0
7.0
Dec-12 Dec-13 Dec-14 Dec-15 Dec-16
Rp bn
WSKT's share price return relative to JCI FCFE (RHS)

ASIAN INSIGHTS VICKERS SECURITIES Page 21
Company Guide
Waskita Karya
Balance Sheet:
Further fund raising needed. As at end-March 2017, WSKT had a net debt of Rp6.7tr, translating to gross and net gearing of 1.28x and 0.83x respectively. We expect its debt to rise as the company extends its business model to include the capital-intensive toll road operating business and expansion of its precast business. Management has budgeted Rp32tr capex this year, most of which is for toll road expansion. Share Price Drivers:
Award of large-sized infrastructure contracts. The award of large-sized, multi-year projects will improve WSKT’s revenue and earnings visibility, and ultimately lead to an upward re-rating of its share price. Toll road divestment. After divesting a 29% stake in Waskita Toll Road to SMI and Taspen, WSKT is planning to raise more funds by further divesting its stakes in WTR and conducting rights issue. Both corporate actions are targeted to take place this year and are crucial for WSKT given its high capex needs. Key Risks:
Persistently weak operating cash flow. We have yet to see positive operating cash flows at WSKT despite strong contract wins last year. Its venture into the toll road operating business could also deteriorate WSKT’s operating cash flow during the early years of operations. As such, its balance sheet could remain stretched, forcing it to make another rights or bond issue in the future. Delay in toll road divestment. A delay in toll road divestment would be negative for WSKT. As it continues to acquire new greenfield toll road concessions to grow its order book, a timely fund raising is needed to make sure that the projects do not stall due to cash flow constraints. Company Background
PT Waskita Karya Tbk (WSKT) is a state-owned contractor engaged in a wide variety of construction activities including toll roads, bridges, ports and buildings. It is the most leveraged proxy to the Indonesian construction sector, deriving c. 95% of its revenues from construction.
Leverage & Asset Turnover (x)
Capital Expenditure
ROE (%)
Forward PE Band (x)
PB Band (x)
Source: Company, AllianceDBS, DBSVI
Rpbn

ASIAN INSIGHTS VICKERS SECURITIES Page 22
Company Guide
Waskita Karya
Key Assumptions
FY Dec 2014A 2015A 2016A 2017F 2018F New Contract (Rp bn) 22,625 32,084 69,974 78,000 67,940 Carry Over Contr. (Rp bn) 10,516 19,746 34,049 77,514 116,849 Construction GPM (%) 10.1 13.0 16.1 15.0 14.0 Precast Gross Margin (%) 18.2 15.9 22.2 20.0 19.0 Toll road start-up losses (287) (1,282)
Segmental Breakdown
FY Dec 2014A 2015A 2016A 2017F 2018F Revenues (Rpbn) Construction 9,484 12,052 22,373 30,120 40,340 Building rentals/Property 0.30 0.60 46.8 46.8 46.8 Precast 803 2,069 1,149 7,219 8,862 Energy 0.0 0.0 1.80 0.0 0.0 Others 0.0 31.8 218 280 748 Total 10,287 14,153 23,788 37,666 49,997 Gross Profit (Rpbn)
Construction 963 1,561 3,591 4,518 5,648 Building rentals/Property 0.30 0.60 17.7 17.7 17.7 Precast 146 328 255 1,444 1,684 Energy 0.0 0.0 1.70 0.0 0.0 Others 0.0 0.0 102 131 350 Total 1,109 1,889 3,968 6,111 7,699 Gross Profit Margins (%)
Construction 10.1 13.0 16.1 15.0 14.0 Building rentals/Property 99.7 100.0 37.9 37.9 37.9 Precast 18.2 15.9 22.2 20.0 19.0 Energy N/A N/A 94.9 N/A N/A Others N/A 0.0 46.8 46.8 46.8 Total 10.8 13.4 16.7 16.2 15.4
Income Statement (Rpbn)
FY Dec 2014A 2015A 2016A 2017F 2018F Revenue 10,287 14,153 23,788 37,666 49,997 Cost of Goods Sold (9,178) (12,232) (19,821) (31,555) (42,298) Gross Profit 1,109 1,921 3,968 6,111 7,699 Other Opng (Exp)/Inc (431) (518) (788) (1,179) (1,558) Operating Profit 678 1,403 3,180 4,932 6,141 Other Non Opg (Exp)/Inc 20.5 159 103 0.0 0.0 Associates & JV Inc 197 10.1 (7.4) 0.0 0.0 Net Interest (Exp)/Inc (140) (267) (795) (1,245) (2,029) Exceptional Gain/(Loss) 0.0 92.8 0.0 0.0 0.0 Pre-tax Profit 756 1,398 2,481 3,688 4,113 Tax (254) (350) (667) (1,019) (888) Minority Interest 0.30 0.10 (99.8) (500) (1,016) Preference Dividend 0.0 0.0 0.0 0.0 0.0 Net Profit 502 1,048 1,713 2,168 2,209 Net Profit before Except. 502 955 1,713 2,168 2,209 EBITDA 934 2,041 3,527 5,332 6,674 Growth Revenue Gth (%) 6.2 37.6 68.1 58.3 32.7 EBITDA Gth (%) 27.3 118.5 72.9 51.2 25.2 Opg Profit Gth (%) 18.9 106.9 126.6 55.1 24.5 Net Profit Gth (Pre-ex) (%) 36.3 90.4 79.4 26.6 1.9 Margins & Ratio Gross Margins (%) 10.8 13.6 16.7 16.2 15.4 Opg Profit Margin (%) 6.6 9.9 13.4 13.1 12.3 Net Profit Margin (%) 4.9 7.4 7.2 5.8 4.4 ROAE (%) 19.7 17.0 16.6 18.1 16.0 ROA (%) 4.7 4.9 3.7 3.0 2.4 ROCE (%) 8.2 7.8 7.1 6.9 7.5 Div Payout Ratio (%) 20.0 20.0 20.0 20.0 20.0 Net Interest Cover (x) 4.8 5.3 4.0 4.0 3.0
Source: Company, AllianceDBS, DBSVI
Revenue contribution from toll road operation business.

ASIAN INSIGHTS VICKERS SECURITIES Page 23
Company Guide
Waskita Karya
Quarterly / Interim Income Statement (Rpbn)
FY Dec 1Q2016 2Q2016 3Q2016 4Q2016 1Q2017 Revenue 3,072 5,013 5,923 9,780 7,142 Cost of Goods Sold (2,552) (4,043) (4,986) (8,239) (6,107) Gross Profit 520 970 937 1,541 1,034 Other Oper. (Exp)/Inc 58.2 (143) (114) (430) (45.4) Operating Profit 578 827 823 1,111 989 Other Non Opg (Exp)/Inc (151) (1.5) 26.1 70.2 (90.9) Associates & JV Inc (35.2) 27.4 (14.3) 14.7 6.90 Net Interest (Exp)/Inc (132) (190) (225) (249) (287) Exceptional Gain/(Loss) 0.0 0.0 0.0 0.0 0.0 Pre-tax Profit 260 663 610 947 618 Tax (136) (205) (105) (222) (168) Minority Interest 3.20 0.80 (157) 53.4 (43.1) Net Profit 127 459 348 779 407 Net profit bef Except. 127 459 348 779 407 EBITDA 447 900 906 1,273 1,004 Growth Revenue Gth (%) (54.4) 63.2 18.2 65.1 (27.0) EBITDA Gth (%) (65.0) 101.3 0.7 40.5 (21.1) Opg Profit Gth (%) (26.1) 43.1 (0.4) 35.0 (11.0) Net Profit Gth (Pre-ex) (%) (78.0) 260.5 (24.1) 123.6 (47.8) Margins Gross Margins (%) 16.9 19.3 15.8 15.8 14.5 Opg Profit Margins (%) 18.8 16.5 13.9 11.4 13.8 Net Profit Margins (%) 4.1 9.2 5.9 8.0 5.7
Balance Sheet (Rpbn)
FY Dec 2014A 2015A 2016A 2017F 2018F Net Fixed Assets 622 1,923 3,275 16,859 26,988 Invts in Associates & JVs 735 1,572 2,071 2,071 2,071 Other LT Assets 1,080 11,009 19,197 19,197 19,197 Cash & ST Invts 1,700 5,522 10,664 3,122 942 Inventory 327 442 1,819 1,800 2,412 Debtors 6,842 7,824 19,795 31,748 42,142 Other Current Assets 1,237 2,018 4,605 7,021 9,260 Total Assets 12,542 30,309 61,425 81,817 103,011 ST Debt 1,917 3,483 15,344 15,344 15,344 Creditor 5,272 8,773 14,653 22,735 30,478 Other Current Liab 539 1,409 1,464 1,464 1,464 LT Debt 1,246 4,547 9,890 19,875 30,536 Other LT Liabilities 803 2,394 3,300 3,300 3,300 Shareholder’s Equity 2,759 9,547 11,070 12,895 14,670 Minority Interests 5.90 157 5,704 6,204 7,219 Total Cap. & Liab. 12,542 30,309 61,425 81,817 103,011 Non-Cash Wkg. Capital 2,594 102 10,101 16,370 21,873 Net Cash/(Debt) (1,463) (2,508) (14,570) (32,097) (44,939) Debtors Turn (avg days) 220.2 189.1 211.9 249.7 269.7 Creditors Turn (avg days) 186.9 217.9 218.5 219.0 232.5 Inventory Turn (avg days) 12.1 11.9 21.1 21.2 18.4 Asset Turnover (x) 1.0 0.7 0.5 0.5 0.5 Current Ratio (x) 1.3 1.2 1.2 1.1 1.2 Quick Ratio (x) 1.1 1.0 1.0 0.9 0.9 Net Debt/Equity (X) 0.5 0.3 0.9 1.7 2.1 Net Debt/Equity ex MI (X) 0.5 0.3 1.3 2.5 3.1 Capex to Debt (%) 10.4 11.7 2.4 39.7 23.2
Source: Company, AllianceDBS, DBSVI
Net gearing to increase from capex at its toll road subsidiary.

ASIAN INSIGHTS VICKERS SECURITIES Page 24
Company Guide
Waskita Karya
Cash Flow Statement (Rpbn)
FY Dec 2014A 2015A 2016A 2017F 2018F Pre-Tax Profit 756 1,398 2,480 3,687 4,112 Dep. & Amort. 38.0 468 251 400 532 Tax Paid (254) (350) (667) (1,019) (888) Assoc. & JV Inc/(loss) 0.0 0.0 0.0 0.0 0.0 Chg in Wkg.Cap. (417) 2,417 (10,099) (6,269) (5,503) Other Operating CF (211) (3,275) 272 0.0 0.0 Net Operating CF (88.7) 658 (7,762) (3,201) (1,747) Capital Exp.(net) (329) (938) (611) (13,983) (10,661) Other Invts.(net) 0.0 0.0 0.0 0.0 0.0 Invts in Assoc. & JV (755) (498) (172) 0.0 0.0 Div from Assoc & JV 1.10 0.0 0.0 0.0 0.0 Other Investing CF 0.0 (5,491) (8,772) 0.0 0.0 Net Investing CF (1,083) (6,927) (9,555) (13,983) (10,661) Div Paid (110) (100) (210) (343) (434) Chg in Gross Debt 1,782 (729) 17,227 9,985 10,661 Capital Issues 59.2 5,348 0.0 0.0 0.0 Other Financing CF (3.1) 5,580 5,442 0.0 0.0 Net Financing CF 1,728 10,099 22,459 9,642 10,228 Currency Adjustments (1.2) 5.90 0.60 0.0 0.0 Chg in Cash 556 3,836 5,143 (7,542) (2,181) Opg CFPS (Rp) 34.0 (130) 172 226 277 Free CFPS (Rp) (43.2) (20.7) (617) (1,266) (914)
Source: Company, AllianceDBS, DBSVI
Target Price & Ratings History
Source: AllianceDBS, DBSVI
Analyst: Chong Tjen-San
Tiesha PUTRI
We expect operating cash flow to remain negative due to the high contribution of turnkey projects.

ASIAN INSIGHTS VICKERS SECURITIES ed: JS / sa:MA, PY
BUY Last Traded Price ( 5 Jul 2017): Rp3,330 (JCI : 5,825.10) Price Target 12-mth: Rp4,100 (23% upside) (Prev Rp4,950) Analyst Chong Tjen-San +60 3 26043972 [email protected] Tiesha PUTRI +6221 30034931 [email protected]
What’s New New contract flow in line with 5M17 new contract
wins representing 33% of our full-year forecast
Maintain BUY with lower TP of Rp4,100
Price Relative
Forecasts and Valuation FY Dec (Rp m) 2015A 2016A 2017F 2018F Revenue 14,217 16,459 21,911 26,878 EBITDA 1,678 2,071 3,019 3,879 Pre-tax Profit 1,288 1,704 2,207 2,747 Net Profit 740 1,023 1,341 1,644 Net Pft (Pre Ex.) 740 1,023 1,341 1,644 Net Pft Gth (Pre-ex) (%) 38.8 38.2 31.1 22.5 EPS (Rp) 153 211 216 265 EPS Pre Ex. (Rp) 153 211 216 265 EPS Gth Pre Ex (%) 39 38 2 23 Diluted EPS (Rp) 153 165 216 265 Net DPS (Rp) 36.5 39.5 51.7 63.4 BV Per Share (Rp) 911 1,580 1,757 1,970 PE (X) 21.8 15.8 15.4 12.6 PE Pre Ex. (X) 21.8 15.8 15.4 12.6 P/Cash Flow (X) 625.1 16.3 42.0 22.4 EV/EBITDA (X) 10.2 7.0 8.6 7.4 Net Div Yield (%) 1.1 1.2 1.6 1.9 P/Book Value (X) 3.7 2.1 1.9 1.7 Net Debt/Equity (X) 0.0 CASH 0.3 0.5 ROAE (%) 22.0 14.4 13.0 14.2 Earnings Rev (%): 0 1 0 Consensus EPS (Rp): N/A 220 280 Other Broker Recs: B: 29 S: 0 H: 0
Source of all data on this page: Company, AllianceDBS, DBSVI, Bloomberg Finance L.P
All eyes on project execution Maintain BUY. Pembangunan Perumahan (PTPP)’s share price has underperformed the JCI by 23% YTD on the back of choppy execution in the past two quarters due to delays in land acquisitions and rollout of contracts. Revenue ex-property grew by only 15% y-o-y in 1Q17 despite value of new contracts growing by 68% y-o-y during the same period as land acquisition issues had hindered construction works. During the recent analyst meeting, management reaffirmed that revenue should catch up in 2Q17 as progress on land acquisitions has picked up pace.
Orderbook provides revenue visibility for 2.7 years. We estimate that PTPP’s order backlog stood at Rp58tr as at the end of May 2017. In May 2017, the company won new contracts worth Rp12.6tr, representing 33%/31% of our/management’s new contract forecast. The management has guided for 25% growth in new contracts in FY17 (vs. our forecast of 19%), the highest growth among our coverage. We are confident that PTPP will be able to record an increase in new contracts awarded over the next two years supported by its enlarged equity base post IPO.
Where we differ. Our Buy call is in line with consensus.
Potential catalysts. A better progress of toll road land acquisitions should help to boost earnings and restore investor confidence after two quarters of posting weaker-than-expected earnings. In addition, having a long standing experience in port construction, we think PTPP stands a chance to win the mega project at Patimban Port. The tender of the project is underway. Positive newsflow on the financing and execution of the project should lead to a re-rating of its share price. Potential M&A as a precursor to the listing of PTPP’s subsidiaries represent another catalyst.
Valuation: We cut our TP to Rp4,100 (from Rp4,950) as we lower our target PE multiple to 19x PE (20% premium to the sector’s historical mean PE). PTPP is trading at 15.4x/12.6x 17F/18F PE, on par with peers despite its stronger balance sheet to fuel new contract growth in the coming years.
Key Risks to Our View: Prolonged slowdown in property sector. PTPP has both direct and indirect exposure to the property sector. A prolonged slowdown in the economy and demand for property can negatively impact earnings and cash flows. At A Glance Issued Capital (m shrs) 6,200 Mkt. Cap (Rpbn/US$m) 20,646 / 1,545 Major Shareholders (%) Republic of Indonesia (%) 51.0
Free Float (%) 49.0 3m Avg. Daily Val (US$m) 6.3 ICB Industry : Industrials / Construction & Materials
CRITICAL DATA POINTS TO WATCH
DBS Group Research . Equity 5 Jul 2017
Indonesia Company Guide
Pembangunan Perumahan Version 6 | Bloomberg: PTPP IJ | Reuters: PTPP.JK Refer to important disclosures at the end of this report

ASIAN INSIGHTS VICKERS SECURITIES Page 27
Company Guide
Pembangunan Perumahan
Critical Factors
Maintaining positive new contract growth momentum post rights issue. PTPP successfully raised Rp4.4tr cash through a rights issue in December 2016. It intends to use 76% of the proceeds to fund equity investments in infrastructure projects, among which are Kuala Tanjung Multi-Purpose Terminal and Industrial Estate, five toll roads (such as Balikpapan-Samarinda toll road, Manado-Bitung toll road, Pandaan-Malang toll road), a 2x200MW power plant in Sumatra, and low-cost apartments, while the remaining 24% will be used for working capital. With ample cash post rights issue, the company should be able to take on more projects in FY17. This year, the company is eyeing new contracts worth Rp40.6tr, representing 25% increase y-o-y. Beneficiary of Indonesia’s port build-out. PTPP has over the years developed a niche in port construction in Indonesia. According to Bapennas, Indonesia would need as much as Rp59tr to develop and expand 24 ports from 2015-2019. Among the larger projects is the multi-year expansion projects at Kuala Tanjung port (Rp18.4tr). The port was initially built by PTPP, hence this would raise the company's competitive edge to secure work contracts once the projects are out for tender. This year, Pelindo I-IV, state-run port operators that will carry out a significant part of the government’s port development plan, have allocated capex of more than Rp13tr for port expansion. Progress on the mega project at Patimban Port is also important to watch as the company eyes the construction contract. More clarity on the funding of the project is expected to come this year, while construction is scheduled to start in 2018. Redirecting focus to government-related infrastructure projects. We estimate that 15%-20% of PTPP’s backlog is from private property developers. The pace of project execution may be slower amid the still subdued property market, and may potentially negatively affect the company’s contract burn rate and earnings. Since 2016, management has redirected its focus to government-related infrastructure projects, including the higher margin EPC projects. Currently, PTPP has three power plant projects in its order book with total capacity of 420 MW. The company plans to bid for more small-scale power plant projects in the future. With this strategy, the company expects to clinch 30% higher new EPC contracts in FY17 from FY16’s Rp6tr. Subsidiaries’ IPOs. Management is still pursuing inorganic growth ahead of the planned IPO of its subsidiaries. Recently, it acquired three companies through its precast and power business. The IPOs will likely be in 2H17 at the soonest, awaiting green light from the parliament and government.
New Contract Win (Rp bn)
Carry Over Contract (Rp bn)
New Contract
Contractors’ revenue visibility
Source: Company, AllianceDBS, DBSVI
4,300 4,300
7,000
9,000
12,600
11%
11%
17%
22%
31%
-
5%
10%
15%
20%
25%
30%
35%
-
2,000
4,000
6,000
8,000
10,000
12,000
14,000
1M17 2M17 3M17 4M17 5M17
PTPP's new contracts (Rp bn) as % of FY17 target
76.2 58.1
92.9
22.8 21.9
37.7
3.3
2.7
2.5
-
0.5
1.0
1.5
2.0
2.5
3.0
3.5
4.0
-10.0 20.0 30.0 40.0 50.0 60.0 70.0 80.0 90.0
100.0
WIKA PTPP WSKT
(x)Rp tr
Outstanding order book* (LHS)Revenue FY17F (LHS)Outst. order book/revenue FY17F (RHS)

ASIAN INSIGHTS VICKERS SECURITIES Page 28
Company Guide
Pembangunan Perumahan
Appendix 1: A look at the company's listed history – what drives its share price?
PTPP’s share price vs. peers*
*Based on the average return of the listed state-owned contractors Source: Company, AllianceDBS, DBS Vickers A: Rupiah depreciation PTPP’s share price along with the other state-owned contractors were under pressure due to concerns over cost overruns, particularly related to government’s infrastructure projects. A portion of raw materials are imported, hence Rupiah depreciation may impact margins and earnings negatively. However, PTPP has been least affected compared to other state-owned contractors due to its lower exposure to government infrastructure projects in the past. PTPP’s share price vs. USDIDR
Source: Bloomberg Finance L.P. B: Fiscal revenue collection and state budget The government’s plan to cut spending in 2016 following weak revenue collection caused state-owned contractors’ share prices, including PTPP, to de-rate.
C: Higher exposure to power plant projects and awards of big ticket infrastructure projects Earnings recovery in 2Q16 was strong with core profit surging by 260% y-o-y, mainly driven by EPC business (power plant construction). Furthermore, the management shared its plan to expand its higher margin EPC business. PTPP’s share price re-rated upwards following the award of two mega toll road projects in June 2016. PTPP’s share price vs. new contract
Source: Company, AllianceDBS, DBS Vickers D: Slow project execution and concern over investment in property sector PTPP’s order book replenishment has picked up pace since mid-2016 after winning a number of infrastructure projects. However, construction progress had been slow due to land acquisition issues, causing earnings to fell short of market expectations. In addition, PTPP’s equity injection into its property arm PP Properti (PPRO) through a rights issue created some concerns among investors, given the still weak property market.
-
0.2
0.4
0.6
0.8
1.0
1.2
1.4
1.6
0
500
1,000
1,500
2,000
2,500
3,000
3,500
4,000
4,500
5,000
Dec-12 Jun-13 Dec-13 Jun-14 Dec-14 Jun-15 Dec-15 Jun-16 Dec-16
PTPP share price (LHS) PTPP share price vs. peers (RHS)
A
Dec 18, 2012 = 1.0
B
C
D
8,000
9,000
10,000
11,000
12,000
13,000
14,000
15,000
16,000
-
1,000
2,000
3,000
4,000
5,000
Dec
-12
Mar
-13
Jun-
13
Sep-
13
Dec
-13
Mar
-14
Jun-
14
Sep-
14
Dec
-14
Mar
-15
Jun-
15
Sep-
15
Dec
-15
Mar
-16
Jun-
16
PTPP share price (LHS) USDIDR (RHS)
05,00010,00015,00020,00025,00030,00035,00040,000
-
1,000
2,000
3,000
4,000
5,000
Dec
-12
Mar
-13
Jun-
13Se
p-13
Dec
-13
Mar
-14
Jun-
14Se
p-14
Dec
-14
Mar
-15
Jun-
15Se
p-15
Dec
-15
Mar
-16
Jun-
16Se
p-16
Dec
-16
Mar
-17
PTPP share price (LHS) T12M new contract, Rp bn (RHS)

ASIAN INSIGHTS VICKERS SECURITIES Page 29
Company Guide
Pembangunan Perumahan
Balance Sheet:
Strong balance sheet enables PTPP to take on more projects. PTPP is in a net cash position after receiving rights issue proceeds of Rp4.4tr in December 2016. We forecast PTPP’s debt to rise with gross gearing of 0.12x in FY17 as the company starts to fund its equity investments in a number of infrastructure projects. Subsidiaries’ IPOs. Management is still pursuing inorganic growth ahead of the planned IPO of its subsidiaries - PP Perlatan (construction equipment rental), PP Urban (low cost housing and precast concrete) and PP Energi (power plant). Recently, it acquired three companies through its precast and power business. The IPOs will likely be in 2H17 at the soonest, awaiting green light from the parliament and government. Management seeks to raise Rp7tr from these IPOs. Share Price Drivers:
Award of a large-sized, multi-year infrastructure contracts. The award of large-sized, multi-year contracts will further improve PTPP’s revenue and earnings visibility, and ultimately lead to re-rating of its share price. Key Risks:
Slowdown in property sector. PTPP’s exposure to the property sector has increased notably with net profit contribution from the property arm at 23% in FY16. We estimate that 15%-20% of PTPP’s outstanding order book are contracts from private developers. A prolonged slowdown in the property market may pose risks to PTPP’s earnings and cash flows. Slow execution of infrastructure project. Delay in project execution due to land acquisition and technical issues or funding constraints such as government’s budget cut may cause revenue and earnings to fall short of our projections. Company Background
PTPP is Indonesia's leading construction company with a portfolio ranging from building engineering to infrastructure construction projects. It has established a solid reputation in the construction of high-rise buildings and ports.
Leverage & Asset Turnover (x)
Capital Expenditure
ROE (%)
Forward PE Band (x)
PB Band (x)
Source: Company, AllianceDBS, DBSVI

ASIAN INSIGHTS VICKERS SECURITIES Page 30
Company Guide
Pembangunan Perumahan
Key Assumptions
FY Dec 2014A 2015A 2016A 2017F 2018F New Contract Win (Rp bn) 20,240 27,074 32,600 38,760 44,244 Carry Over Contract (Rp 22,278 29,867 39,600 48,400 48,861
Segmental Breakdown
FY Dec 2014A 2015A 2016A 2017F 2018F Revenues (Rpbn) Construction 10,662 11,611 11,815 11,174 11,275 Real Estate and Property 645 1,573 2,180 2,258 2,845 EPC 1,091 928 2,366 5,264 8,644 Others 29.3 106 97.9 3,215 4,114 Total 12,427 14,217 16,459 21,911 26,878 Gross Profit (Rpbn)
Construction 1,414 1,244 1,422 1,229 1,240 Real Estate and Property 267 680 1,175 1,135 1,431 EPC 143 206 377 684 1,124 Others (91.8) (124) (518) 355 480 Total 1,732 2,007 2,456 3,404 4,275 Gross Profit Margins (%)
Construction 13.3 10.7 12.0 11.0 11.0 Real Estate and Property 41.3 43.3 53.9 50.3 50.3 EPC 13.1 22.2 15.9 13.0 13.0 Others (313.1) (117.1) (529.0) 11.0 11.7 Total 13.9 14.1 14.9 15.5 15.9
Income Statement (Rpbn)
FY Dec 2014A 2015A 2016A 2017F 2018F Revenue 12,427 14,217 16,459 21,911 26,878 Cost of Goods Sold (10,878) (12,210) (14,003) (18,507) (22,604) Gross Profit 1,550 2,007 2,456 3,404 4,275 Other Opng (Exp)/Inc (281) (410) (487) (714) (799) Operating Profit 1,268 1,597 1,968 2,690 3,476 Other Non Opg (Exp)/Inc (94.2) (50.5) (69.4) 0.0 0.0 Associates & JV Inc 72.4 67.0 155 0.0 0.0 Net Interest (Exp)/Inc (326) (326) (350) (483) (729) Exceptional Gain/(Loss) 0.0 0.0 0.0 0.0 0.0 Pre-tax Profit 921 1,288 1,704 2,207 2,747 Tax (387) (442) (552) (760) (970) Minority Interest (0.1) (105) (128) (106) (133) Preference Dividend 0.0 0.0 0.0 0.0 0.0 Net Profit 533 740 1,023 1,341 1,644 Net Profit before Except. 533 740 1,023 1,341 1,644 EBITDA 1,326 1,678 2,071 3,019 3,879 Growth Revenue Gth (%) 6.6 14.4 15.8 33.1 22.7 EBITDA Gth (%) 22.1 26.6 23.4 45.8 28.5 Opg Profit Gth (%) 18.2 25.9 23.2 36.7 29.2 Net Profit Gth (Pre-ex) (%) 26.8 38.8 38.2 31.1 22.5 Margins & Ratio Gross Margins (%) 12.5 14.1 14.9 15.5 15.9 Opg Profit Margin (%) 10.2 11.2 12.0 12.3 12.9 Net Profit Margin (%) 4.3 5.2 6.2 6.1 6.1 ROAE (%) 25.0 22.0 14.4 13.0 14.2 ROA (%) 4.0 4.4 4.1 4.0 4.2 ROCE (%) 13.0 12.8 9.1 9.0 10.3 Div Payout Ratio (%) 25.3 33.2 33.0 31.3 29.3 Net Interest Cover (x) 3.9 4.9 5.6 5.6 4.8
Source: Company, AllianceDBS, DBSVI

ASIAN INSIGHTS VICKERS SECURITIES Page 31
Company Guide
Pembangunan Perumahan
Quarterly / Interim Income Statement (Rpbn)
FY Dec 1Q2016 2Q2016 3Q2016 4Q2016 1Q2017 Revenue 2,588 3,885 4,374 5,613 2,917 Cost of Goods Sold (2,228) (3,338) (3,765) (4,672) (2,526) Gross Profit 360 547 608 941 391 Other Oper. (Exp)/Inc (105) (119) (124) (139) (155) Operating Profit 255 428 484 802 236 Other Non Opg (Exp)/Inc (19.4) 30.6 (42.8) (37.8) (14.4) Associates & JV Inc 5.80 26.9 21.3 101 15.3 Net Interest (Exp)/Inc (21.4) (66.5) (69.4) (193) 26.5 Exceptional Gain/(Loss) 0.0 0.0 0.0 0.0 0.0 Pre-tax Profit 220 419 393 672 263 Tax (90.4) (138) (145) (179) (102) Minority Interest (31.7) (23.3) (36.2) (36.8) (31.4) Net Profit 98.2 257 212 457 130 Net profit bef Except. 98.2 257 212 457 130 EBITDA 261 507 486 903 313 Growth Revenue Gth (%) (52.5) 50.1 12.6 28.3 (48.0) EBITDA Gth (%) (67.9) 93.8 (4.0) 85.7 (65.3) Opg Profit Gth (%) (63.8) 67.5 13.1 65.7 (70.6) Net Profit Gth (Pre-ex) (%) (72.9) 162.0 (17.8) 115.9 (71.5) Margins Gross Margins (%) 13.9 14.1 13.9 16.8 13.4 Opg Profit Margins (%) 9.9 11.0 11.1 14.3 8.1 Net Profit Margins (%) 3.8 6.6 4.8 8.1 4.5
Balance Sheet (Rpbn)
FY Dec 2014A 2015A 2016A 2017F 2018F Net Fixed Assets 710 2,989 4,178 10,849 13,946 Invts in Associates & JVs 147 272 486 486 486 Other LT Assets 245 467 2,225 2,225 2,225 Cash & ST Invts 2,611 3,302 9,424 2,671 1,272 Inventory 2,675 2,499 2,656 3,473 4,241 Debtors 7,244 8,829 10,920 14,537 18,737 Other Current Assets 947 800 1,345 1,345 1,345 Total Assets 14,579 19,159 31,233 35,585 42,252 ST Debt 1,577 1,722 3,698 3,698 3,698 Creditor 7,022 7,372 10,237 13,387 17,097 Other Current Liab 1,263 1,677 1,943 1,943 1,943 LT Debt 1,455 1,827 3,048 3,048 4,548 Other LT Liabilities 928 1,414 1,510 1,510 1,510 Shareholder’s Equity 2,334 4,410 9,796 10,893 12,216 Minority Interests 1.00 737 1,000 1,106 1,240 Total Cap. & Liab. 14,579 19,159 31,233 35,585 42,252 Non-Cash Wkg. Capital 2,583 3,080 2,739 4,023 5,283 Net Cash/(Debt) (421) (247) 2,678 (4,074) (6,974) Debtors Turn (avg days) 200.2 206.3 219.0 212.0 225.9 Creditors Turn (avg days) 224.7 216.6 231.2 237.2 250.6 Inventory Turn (avg days) 75.1 77.8 67.7 61.5 63.4 Asset Turnover (x) 0.9 0.8 0.7 0.7 0.7 Current Ratio (x) 1.4 1.4 1.5 1.2 1.1 Quick Ratio (x) 1.0 1.1 1.3 0.9 0.9 Net Debt/Equity (X) 0.2 0.0 CASH 0.3 0.5 Net Debt/Equity ex MI (X) 0.2 0.1 CASH 0.4 0.6 Capex to Debt (%) 5.3 11.8 19.3 103.8 42.4 Z-Score (X) 2.3 2.1 1.7 1.6 1.5
Source: Company, AllianceDBS, DBSVI

ASIAN INSIGHTS VICKERS SECURITIES Page 32
Company Guide
Pembangunan Perumahan
Cash Flow Statement (Rpbn)
FY Dec 2014A 2015A 2016A 2017F 2018F Pre-Tax Profit 921 1,288 1,704 2,207 2,747 Dep. & Amort. 57.1 80.6 103 329 403 Tax Paid (387) (442) (552) (760) (970) Assoc. & JV Inc/(loss) 0.0 0.0 0.0 0.0 0.0 Chg in Wkg.Cap. (719) (497) 341 (1,284) (1,259) Other Operating CF 410 (403) (608) 0.0 0.0 Net Operating CF 282 25.8 987 492 921 Capital Exp.(net) (160) (420) (1,305) (7,000) (3,500) Other Invts.(net) (192) (83.3) (124) 0.0 0.0 Invts in Assoc. & JV (78.2) (125) (440) 0.0 0.0 Div from Assoc & JV 0.0 0.0 0.0 0.0 0.0 Other Investing CF (95.1) (33.7) 42.8 0.0 0.0 Net Investing CF (525) (662) (1,826) (7,000) (3,500) Div Paid (126) (106) (177) (245) (321) Chg in Gross Debt 369 405 2,663 0.0 1,500 Capital Issues 0.0 0.0 4,412 0.0 0.0 Other Financing CF 0.0 884 1.50 0.0 0.0 Net Financing CF 243 1,182 6,899 (245) 1,179 Currency Adjustments 11.3 71.1 39.9 0.0 0.0 Chg in Cash 11.3 617 6,100 (6,753) (1,400) Opg CFPS (Rp) 207 108 133 286 352 Free CFPS (Rp) 25.3 (81.5) (65.8) (1,050) (416)
Source: Company, AllianceDBS, DBSVI
Target Price & Ratings History
Source: AllianceDBS, DBSVI
Analyst: Chong Tjen-San
Tiesha PUTRI
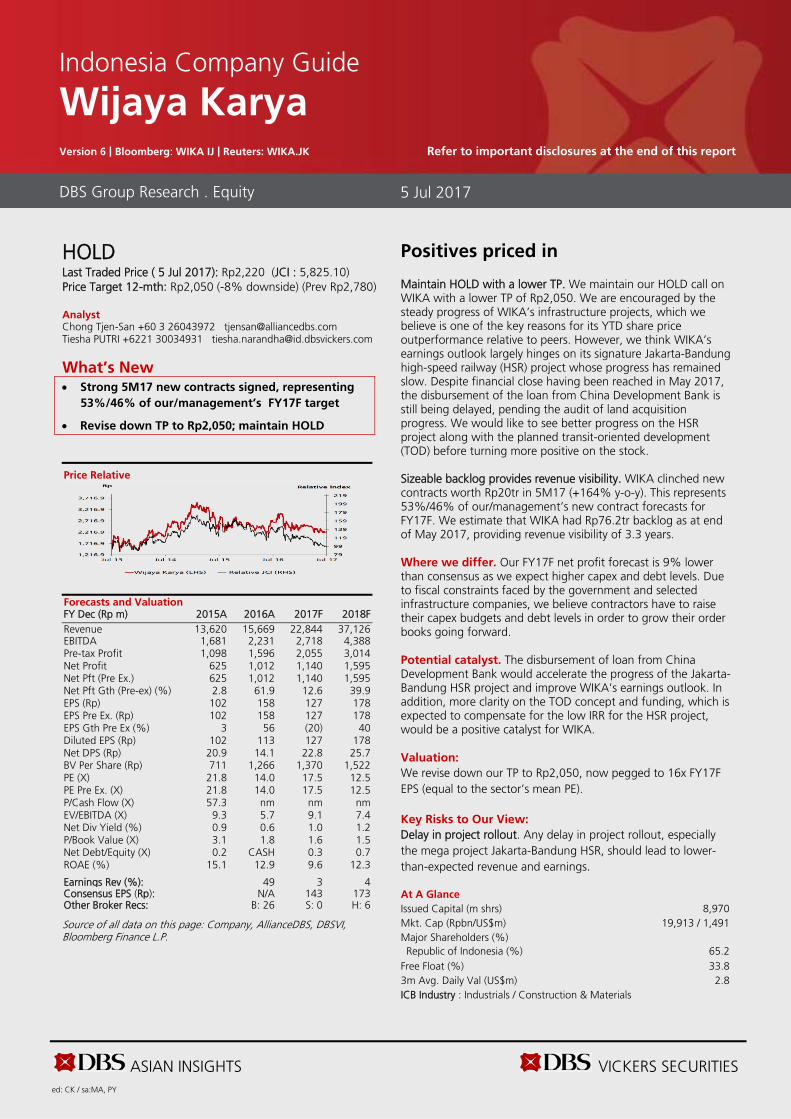
ASIAN INSIGHTS VICKERS SECURITIES ed: CK / sa:MA, PY
HOLD
Last Traded Price ( 5 Jul 2017): Rp2,220 (JCI : 5,825.10) Price Target 12-mth: Rp2,050 (-8% downside) (Prev Rp2,780) Analyst Chong Tjen-San +60 3 26043972 [email protected] Tiesha PUTRI +6221 30034931 [email protected]
What’s New Strong 5M17 new contracts signed, representing
53%/46% of our/management’s FY17F target
Revise down TP to Rp2,050; maintain HOLD
Price Relative
Forecasts and Valuation FY Dec (Rp m) 2015A 2016A 2017F 2018F Revenue 13,620 15,669 22,844 37,126 EBITDA 1,681 2,231 2,718 4,388 Pre-tax Profit 1,098 1,596 2,055 3,014 Net Profit 625 1,012 1,140 1,595 Net Pft (Pre Ex.) 625 1,012 1,140 1,595 Net Pft Gth (Pre-ex) (%) 2.8 61.9 12.6 39.9 EPS (Rp) 102 158 127 178 EPS Pre Ex. (Rp) 102 158 127 178 EPS Gth Pre Ex (%) 3 56 (20) 40 Diluted EPS (Rp) 102 113 127 178 Net DPS (Rp) 20.9 14.1 22.8 25.7 BV Per Share (Rp) 711 1,266 1,370 1,522 PE (X) 21.8 14.0 17.5 12.5 PE Pre Ex. (X) 21.8 14.0 17.5 12.5 P/Cash Flow (X) 57.3 nm nm nm EV/EBITDA (X) 9.3 5.7 9.1 7.4 Net Div Yield (%) 0.9 0.6 1.0 1.2 P/Book Value (X) 3.1 1.8 1.6 1.5 Net Debt/Equity (X) 0.2 CASH 0.3 0.7 ROAE (%) 15.1 12.9 9.6 12.3 Earnings Rev (%): 49 3 4 Consensus EPS (Rp): N/A 143 173 Other Broker Recs: B: 26 S: 0 H: 6
Source of all data on this page: Company, AllianceDBS, DBSVI, Bloomberg Finance L.P.
Positives priced in Maintain HOLD with a lower TP. We maintain our HOLD call on WIKA with a lower TP of Rp2,050. We are encouraged by the steady progress of WIKA’s infrastructure projects, which we believe is one of the key reasons for its YTD share price outperformance relative to peers. However, we think WIKA’s earnings outlook largely hinges on its signature Jakarta-Bandung high-speed railway (HSR) project whose progress has remained slow. Despite financial close having been reached in May 2017, the disbursement of the loan from China Development Bank is still being delayed, pending the audit of land acquisition progress. We would like to see better progress on the HSR project along with the planned transit-oriented development (TOD) before turning more positive on the stock. Sizeable backlog provides revenue visibility. WIKA clinched new contracts worth Rp20tr in 5M17 (+164% y-o-y). This represents 53%/46% of our/management’s new contract forecasts for FY17F. We estimate that WIKA had Rp76.2tr backlog as at end of May 2017, providing revenue visibility of 3.3 years. Where we differ. Our FY17F net profit forecast is 9% lower than consensus as we expect higher capex and debt levels. Due to fiscal constraints faced by the government and selected infrastructure companies, we believe contractors have to raise their capex budgets and debt levels in order to grow their order books going forward. Potential catalyst. The disbursement of loan from China Development Bank would accelerate the progress of the Jakarta-Bandung HSR project and improve WIKA’s earnings outlook. In addition, more clarity on the TOD concept and funding, which is expected to compensate for the low IRR for the HSR project, would be a positive catalyst for WIKA. Valuation:
We revise down our TP to Rp2,050, now pegged to 16x FY17F EPS (equal to the sector’s mean PE). Key Risks to Our View:
Delay in project rollout. Any delay in project rollout, especially the mega project Jakarta-Bandung HSR, should lead to lower-than-expected revenue and earnings. At A Glance Issued Capital (m shrs) 8,970 Mkt. Cap (Rpbn/US$m) 19,913 / 1,491 Major Shareholders (%) Republic of Indonesia (%) 65.2
Free Float (%) 33.8 3m Avg. Daily Val (US$m) 2.8 ICB Industry : Industrials / Construction & Materials
DBS Group Research . Equity 5 Jul 2017
Indonesia Company Guide
Wijaya Karya Version 6 | Bloomberg: WIKA IJ | Reuters: WIKA.JK Refer to important disclosures at the end of this report

ASIAN INSIGHTS VICKERS SECURITIES Page 33
Company Guide
Wijaya Karya
WHAT’S NEW
Revise up FY17F new contract and earnings
Earnings revision. WIKA won new contract worth Rp20tr in 5M17 vs. our initial FY17 new contract forecasts of Rp37.6tr. Among the largest wins were Serang-Panimbang toll road (Rp3.5tr) and Cengkareng-Batu Ceper-Kunciran toll road (Rp2.2tr). Taking into account stronger than expected new contract achievement in 5M17, we revise up our FY17F new contract forecasts by 15% to Rp43tr. Our new contract forecast for FY17 implies a 21% y-o-y decline, in line with management’s expectation. We raise our FY17F/FY18F net profit forecast by 3%/4%. Our revised new profit forecast implies 13%/40% net profit growth in FY17F/FY18F.
Summary of earnings revision
Source: AllianceDBS, DBSVI
Old New Change Old New ChangeRevenue 22,703 22,844 1% 33,019 37,125 12%Gross profit 2,746 2,860 4% 3,951 4,461 13%EBIT 2,041 2,154 6% 3,043 3,538 16%Net Profit 1,111 1,140 3% 1,530 1,595 4%
GP margin (%) 12.1 12.5 12.0 12.0 EBIT margin (%) 9.0 9.4 9.2 9.5 Net margin (%) 4.9 5.0 4.6 4.3
New Contract Win 37,564 43,027 15% 37,652 37,771 0%Carry Over Contract 56,970 59,996 5% 62,372 74,484 19%Total Orderbook (cumulative) 92,512 102,356 11% 98,002 111,588 14%
Capex 2,000 3,850 93% 3,000 3,850 28%Net interest income (exp.) (299) (390) 30% (607) (819) 35%
2017F 2018F( in Rp bn)

ASIAN INSIGHTS VICKERS SECURITIES Page 34
Company Guide
Wijaya Karya
CRITICAL DATA POINTS TO WATCH
Critical Factors
New contracts had peaked; eyes on project execution. After the award of the Jakarta-Bandung high-speed railway contract in 2016, we expect WIKA’s new contracts to decline by 21% y-o-y in FY17F. Nonetheless, we acknowledge that the company’s revenue visibility has improved strongly with a contract backlog of Rp84.8tr, providing revenue visibility of 3.3 years. As new contract growth has peaked, we believe project execution and earnings delivery would be the key focus going forward. This hinges a great deal on the HSR contract which forms 21% of its total orderbook and has only achieved less than 5% progress thus far. Progress of Jakarta-Bandung high-speed project. In 2016, WIKA was awarded the civil work contract of the Jakarta-Bandung high-speed railway (HSR) worth Rp15.8tr. We estimate that this project contributed c.21% of WIKA’s total backlog (as at end of May 2017). The mega project is now running behind schedule after breaking ground in Jan 2016 due to land acquisition issues. The project is scheduled to be delivered in mid-2019. The resumption of Jakarta-Bandung HSR construction, expected in July 2017, is important for WIKA in boosting its earnings growth. Transit oriented development to compensate for HSR’s low IRR. The HSR consortium plans to develop a transit-oriented development (TOD) in the vicinity of HSR’s four stations i.e. Halim Perdanakusuma (East Jakarta), Karawang (West Java), Walini (West Java) and Tegalluar (Bandung, West Java). Walini would become the largest township project with a total area of 2,900ha, followed by Tegalluar (450ha). The consortium has appointed three world-class property and urban development consultants (Aedas, Atkins and Surbana Jurong) back in Jan 2016, and more details on the TOD plan will be revealed this year. This should shed more light on how the consortium plans to compensate for HSR’s low IRR (estimated FIRR is in the range of 6.5%-10.8%). The HSR consortium plans to team up with private developers given the high capital requirement to develop new townships. Nonetheless, we believe WIKA Realty, WIKA’s property arm, would play an important role in the development. Government’s tax collection. 20%-40% of WIKA’s annual new contracts for the period 2012-2016 were infrastructure projects funded by the government. Slow tax collection may lead to fiscal budget shortfalls and some delay in government’s projects. This may results in lower-than-expected contract wins and earnings for WIKA.
New Contract Win (Rp bn)
Contract Backlog (Rp bn)
Blended Gross Margin (%)
New Contract
New Contract Based on Project Owner
Source: Company, AllianceDBS, DBSVI
5.6 11.8 16.6 18.2 20.0
13%
27%
38% 42%
46%
-
5%
10%
15%
20%
25%
30%
35%
40%
45%
50%
-
5.0
10.0
15.0
20.0
25.0
1M17 2M17 3M17 4M17 5M17
New contract, Rp tr (LHS) as % of FY17F (RHS)
3.3 2.7 10.8 11.4
14.5 14.9
14.5
43.4
-
10.0
20.0
30.0
40.0
50.0
60.0
2013 2014 2015 2016
Rp tr
Ex-Gov't
Gov't
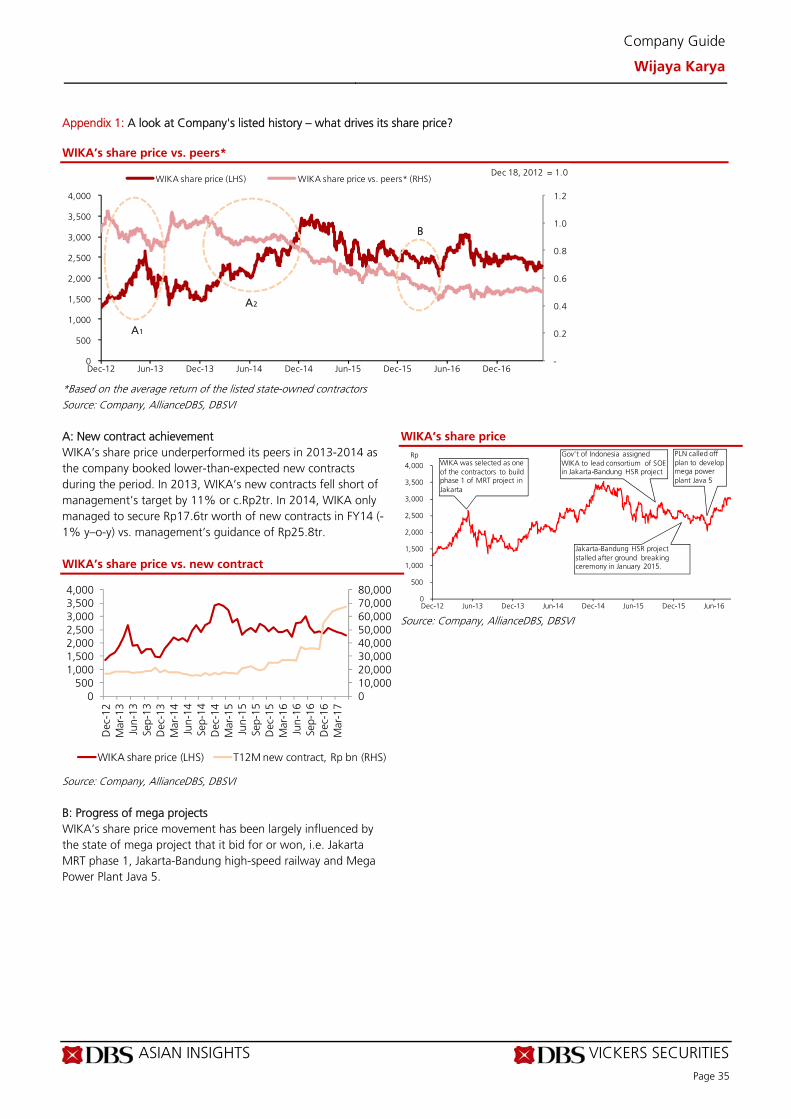
ASIAN INSIGHTS VICKERS SECURITIES Page 35
Company Guide
Wijaya Karya
Appendix 1: A look at Company's listed history – what drives its share price? WIKA’s share price vs. peers*
*Based on the average return of the listed state-owned contractors Source: Company, AllianceDBS, DBSVI A: New contract achievement WIKA’s share price underperformed its peers in 2013-2014 as the company booked lower-than-expected new contracts during the period. In 2013, WIKA’s new contracts fell short of management’s target by 11% or c.Rp2tr. In 2014, WIKA only managed to secure Rp17.6tr worth of new contracts in FY14 (-1% y–o-y) vs. management’s guidance of Rp25.8tr. WIKA’s share price vs. new contract
Source: Company, AllianceDBS, DBSVI B: Progress of mega projects WIKA’s share price movement has been largely influenced by the state of mega project that it bid for or won, i.e. Jakarta MRT phase 1, Jakarta-Bandung high-speed railway and Mega Power Plant Java 5.
WIKA’s share price
Source: Company, AllianceDBS, DBSVI
-
0.2
0.4
0.6
0.8
1.0
1.2
0
500
1,000
1,500
2,000
2,500
3,000
3,500
4,000
Dec-12 Jun-13 Dec-13 Jun-14 Dec-14 Jun-15 Dec-15 Jun-16 Dec-16
WIKA share price (LHS) WIKA share price vs. peers* (RHS)
B
A2
A1
Dec 18, 2012 = 1.0
010,00020,00030,00040,00050,00060,00070,00080,000
0500
1,0001,5002,0002,5003,0003,5004,000
Dec
-12
Mar
-13
Jun-
13Se
p-13
Dec
-13
Mar
-14
Jun-
14Se
p-14
Dec
-14
Mar
-15
Jun-
15Se
p-15
Dec
-15
Mar
-16
Jun-
16Se
p-16
Dec
-16
Mar
-17
WIKA share price (LHS) T12M new contract, Rp bn (RHS)
0
500
1,000
1,500
2,000
2,500
3,000
3,500
4,000
Dec-12 Jun-13 Dec-13 Jun-14 Dec-14 Jun-15 Dec-15 Jun-16
RpWIKA was selected as one of the contractors to build phase 1 of MRT project in Jakarta
Gov't of Indonesia assigned WIKA to lead consortium of SOE in Jakarta-Bandung HSR project
Jakarta-Bandung HSR project stalled after ground breaking ceremony in January 2015.
PLN called off plan to develop mega power plant Java 5

ASIAN INSIGHTS VICKERS SECURITIES Page 36
Company Guide
Wijaya Karya
Balance Sheet:
Stronger capital post rights issue. WIKA had Rp6.9tr debt at the end of Mar 2017. However, the company is in a net cash position of Rp1.1tr. We expect WIKA’s net gearing to rise to 0.3x by the end of 2017 from -0.1x as at the end of March 2017. Listing of WIKA Gedung and WIKA Realty. The company is currently in the process of spinning off its building construction business and merging it into WIKA Gedung, one of WIKA’s subsidiaries. Following the spinoff, WIKA plans to divest a 30% stake in WIKA Gedung through an IPO, which is expected to raise Rp1tr. WIKA also plans to list its property business, WIKA Realty, in 2017. Share Price Drivers:
Progress on HSR project. Improved clarity on the HSR project could act as a positive catalyst for WIKA. Among the key events to watch for are: i) land acquisition progress, and ii) disbursement of loan from China Development Bank. Faster land acquisition progress. Further reform on land acquisition which can accelerate the construction progress of infrastructure projects would be positive for WIKA’s earnings and share price. Key Risks:
Delay in infrastructure project execution. Any delay in project execution could lead to lower order book and earnings. Such newsflow could also create negative sentiment towards Indonesia's construction sector and lead to valuation de-rating. Lower free cashflow generation in the medium term. Aside from being the contractor, WIKA typically owns some stakes in the assets being built. This exposes WIKA to the risk of deteriorating cashflow generation, as such a business model requires high capital investments and normally generates negative cashflows in the early years of operations. Company Background
Wijaya Karya is a construction company with interests in EPC, civil, building works, precast and realty.
Leverage & Asset Turnover (x)
Capital Expenditure
ROE (%)
Forward PE Band (x)
PB Band (x)
Source: Company, AllianceDBS, DBSVI
Rpbn

ASIAN INSIGHTS VICKERS SECURITIES Page 37
Company Guide
Wijaya Karya
Key Assumptions
FY Dec 2014A 2015A 2016A 2017F 2018F New Contract Win (Rp bn) 17,632 25,222 54,764 43,027 37,771 Contract Backlog (Rp bn) 23,784 23,302 28,526 59,329 73,817
Segmental Breakdown
FY Dec 2014A 2015A 2016A 2017F 2018F Revenues (Rpbn) Construction 4,731 5,984 7,476 15,014 26,492 EPC 3,179 3,370 2,875 2,058 3,440 Industrial (Precast) 3,271 2,830 3,292 4,743 5,551 Property 1,283 1,436 2,026 1,029 1,643 Total 12,463 13,620 15,669 22,844 37,126 Gross Profit (Rpbn)
Construction 371 593 878 1,763 2,995 EPC 273 424 341 247 413 Industrial (Precast) 544 400 532 686 790 Property 237 238 476 165 263 Total 1,425 1,655 2,227 2,860 4,461 Gross Profit Margins (%)
Construction 7.8 9.9 11.7 11.7 11.3 EPC 8.6 12.6 11.9 12.0 12.0 Industrial (Precast) 16.6 14.1 16.2 14.5 14.2 Property 18.4 16.6 23.5 16.0 16.0 Total 11.4 12.1 14.2 12.5 12.0
Income Statement (Rpbn)
FY Dec 2014A 2015A 2016A 2017F 2018F Revenue 12,463 13,620 15,669 22,844 37,126 Cost of Goods Sold (11,039) (11,965) (13,442) (19,984) (32,665) Gross Profit 1,425 1,655 2,227 2,860 4,461 Other Opng (Exp)/Inc (393) (429) (527) (707) (923) Operating Profit 1,032 1,226 1,700 2,154 3,538 Other Non Opg (Exp)/Inc (131) (38.6) (61.0) (61.0) (61.0) Associates & JV Inc 363 283 341 352 356 Net Interest (Exp)/Inc (124) (372) (384) (390) (819) Exceptional Gain/(Loss) 0.0 0.0 0.0 0.0 0.0 Pre-tax Profit 1,139 1,098 1,596 2,055 3,014 Tax (395) (395) (448) (718) (1,199) Minority Interest (136) (78.0) (135) (198) (220) Preference Dividend 0.0 0.0 0.0 0.0 0.0 Net Profit 608 625 1,012 1,140 1,595 Net Profit before Except. 608 625 1,012 1,140 1,595 EBITDA 1,393 1,681 2,231 2,718 4,388 Growth Revenue Gth (%) 4.9 9.3 15.0 45.8 62.5 EBITDA Gth (%) 21.1 20.7 32.7 21.8 61.5 Opg Profit Gth (%) 8.0 18.8 38.7 26.7 64.3 Net Profit Gth (Pre-ex) (%) 6.7 2.8 61.9 12.6 39.9 Margins & Ratio Gross Margins (%) 11.4 12.1 14.2 12.5 12.0 Opg Profit Margin (%) 8.3 9.0 10.9 9.4 9.5 Net Profit Margin (%) 4.9 4.6 6.5 5.0 4.3 ROAE (%) 18.0 15.1 12.9 9.6 12.3 ROA (%) 4.3 3.5 4.0 3.3 3.5 ROCE (%) 9.1 7.9 7.5 6.2 8.0 Div Payout Ratio (%) 28.1 20.6 12.5 18.0 14.5 Net Interest Cover (x) 8.3 3.3 4.4 5.5 4.3
Source: Company, AllianceDBS, DBSVI
We assume HSR construction would contribute 32% and 33% to WIKA’s FY17F and FY18F revenue respectively.
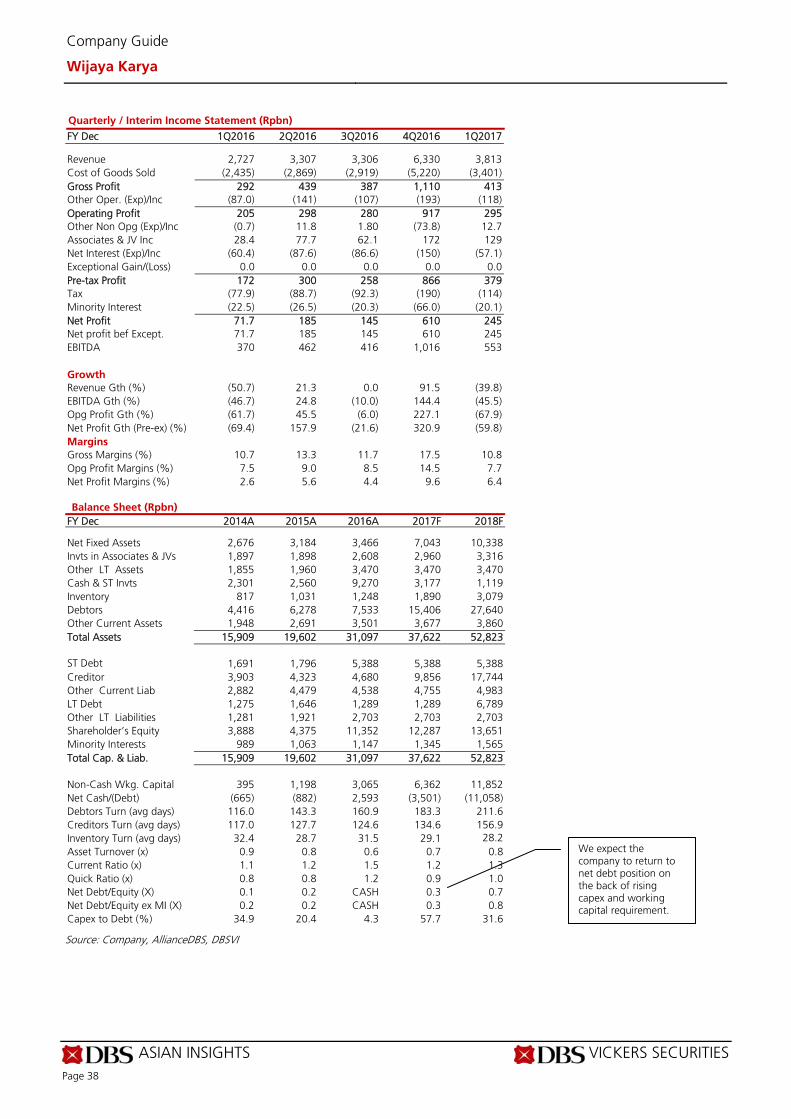
ASIAN INSIGHTS VICKERS SECURITIES Page 38
Company Guide
Wijaya Karya
Quarterly / Interim Income Statement (Rpbn)
FY Dec 1Q2016 2Q2016 3Q2016 4Q2016 1Q2017 Revenue 2,727 3,307 3,306 6,330 3,813 Cost of Goods Sold (2,435) (2,869) (2,919) (5,220) (3,401) Gross Profit 292 439 387 1,110 413 Other Oper. (Exp)/Inc (87.0) (141) (107) (193) (118) Operating Profit 205 298 280 917 295 Other Non Opg (Exp)/Inc (0.7) 11.8 1.80 (73.8) 12.7 Associates & JV Inc 28.4 77.7 62.1 172 129 Net Interest (Exp)/Inc (60.4) (87.6) (86.6) (150) (57.1) Exceptional Gain/(Loss) 0.0 0.0 0.0 0.0 0.0 Pre-tax Profit 172 300 258 866 379 Tax (77.9) (88.7) (92.3) (190) (114) Minority Interest (22.5) (26.5) (20.3) (66.0) (20.1) Net Profit 71.7 185 145 610 245 Net profit bef Except. 71.7 185 145 610 245 EBITDA 370 462 416 1,016 553 Growth Revenue Gth (%) (50.7) 21.3 0.0 91.5 (39.8) EBITDA Gth (%) (46.7) 24.8 (10.0) 144.4 (45.5) Opg Profit Gth (%) (61.7) 45.5 (6.0) 227.1 (67.9) Net Profit Gth (Pre-ex) (%) (69.4) 157.9 (21.6) 320.9 (59.8) Margins Gross Margins (%) 10.7 13.3 11.7 17.5 10.8 Opg Profit Margins (%) 7.5 9.0 8.5 14.5 7.7 Net Profit Margins (%) 2.6 5.6 4.4 9.6 6.4
Balance Sheet (Rpbn)
FY Dec 2014A 2015A 2016A 2017F 2018F Net Fixed Assets 2,676 3,184 3,466 7,043 10,338 Invts in Associates & JVs 1,897 1,898 2,608 2,960 3,316 Other LT Assets 1,855 1,960 3,470 3,470 3,470 Cash & ST Invts 2,301 2,560 9,270 3,177 1,119 Inventory 817 1,031 1,248 1,890 3,079 Debtors 4,416 6,278 7,533 15,406 27,640 Other Current Assets 1,948 2,691 3,501 3,677 3,860 Total Assets 15,909 19,602 31,097 37,622 52,823 ST Debt 1,691 1,796 5,388 5,388 5,388 Creditor 3,903 4,323 4,680 9,856 17,744 Other Current Liab 2,882 4,479 4,538 4,755 4,983 LT Debt 1,275 1,646 1,289 1,289 6,789 Other LT Liabilities 1,281 1,921 2,703 2,703 2,703 Shareholder’s Equity 3,888 4,375 11,352 12,287 13,651 Minority Interests 989 1,063 1,147 1,345 1,565 Total Cap. & Liab. 15,909 19,602 31,097 37,622 52,823 Non-Cash Wkg. Capital 395 1,198 3,065 6,362 11,852 Net Cash/(Debt) (665) (882) 2,593 (3,501) (11,058) Debtors Turn (avg days) 116.0 143.3 160.9 183.3 211.6 Creditors Turn (avg days) 117.0 127.7 124.6 134.6 156.9 Inventory Turn (avg days) 32.4 28.7 31.5 29.1 28.2 Asset Turnover (x) 0.9 0.8 0.6 0.7 0.8 Current Ratio (x) 1.1 1.2 1.5 1.2 1.3 Quick Ratio (x) 0.8 0.8 1.2 0.9 1.0 Net Debt/Equity (X) 0.1 0.2 CASH 0.3 0.7 Net Debt/Equity ex MI (X) 0.2 0.2 CASH 0.3 0.8 Capex to Debt (%) 34.9 20.4 4.3 57.7 31.6
Source: Company, AllianceDBS, DBSVI
We expect the company to return to net debt position on the back of rising capex and working capital requirement.

ASIAN INSIGHTS VICKERS SECURITIES Page 39
Company Guide
Wijaya Karya
Cash Flow Statement (Rpbn)
FY Dec 2014A 2015A 2016A 2017F 2018F Pre-Tax Profit 1,139 1,098 1,596 2,055 3,014 Dep. & Amort. 129 211 251 273 555 Tax Paid (370) (479) (448) (718) (1,199) Assoc. & JV Inc/(loss) (363) (283) (341) (352) (356) Chg in Wkg.Cap. (665) (811) (1,878) (3,297) (5,490) Other Operating CF (49.2) 503 (299) 0.0 0.0 Net Operating CF (178) 238 (1,120) (2,039) (3,477) Capital Exp.(net) (1,036) (701) (285) (3,850) (3,850) Other Invts.(net) (316) (12.0) (67.9) 0.0 0.0 Invts in Assoc. & JV (48.6) 282 (366) 0.0 0.0 Div from Assoc & JV 0.0 0.0 0.0 0.0 0.0 Other Investing CF 132 106 (92.6) 0.0 0.0 Net Investing CF (1,268) (325) (811) (3,850) (3,850) Div Paid (171) (129) (125) (205) (231) Chg in Gross Debt 638 479 2,654 0.0 5,500 Capital Issues 448 0.0 6,108 0.0 0.0 Other Financing CF 1,446 (4.0) 0.0 0.0 0.0 Net Financing CF 2,360 346 8,638 (205) 5,269 Currency Adjustments 0.0 0.0 3.00 0.0 0.0 Chg in Cash 914 259 6,710 (6,094) (2,058) Opg CFPS (Rp) 79.2 171 119 140 224 Free CFPS (Rp) (197) (75.2) (220) (657) (817)
Source: Company, AllianceDBS, DBSVI
Target Price & Ratings History
Source: AllianceDBS, DBSVI
Analyst: Chong Tjen-San
Tiesha PUTRI
Our capex assumption is 50% lower than management’s guidance but 56% higher than consensus forecasts.

ASIAN INSIGHTS VICKERS SECURITIES ed: JS/ sa:MA, PY
BUY Last Traded Price ( 5 Jul 2017): Rp605 (JCI : 5,825.10) Price Target 12-mth: Rp760 (26% upside) (Prev Rp1,050) Analyst Chong Tjen-San +60 3 26043972 [email protected] Tiesha PUTRI +6221 30034931 [email protected]
What’s New Maintain BUY with a new TP of Rp760
Improving revenue visibility with contract backlog
already reaching 1.1x of our FY17 revenue forecast
Building competitive edge by offering one-stop
service
Price Relative
Forecasts and Valuation FY Dec (Rp m) 2015A 2016A 2017F 2018F Revenue 2,653 3,482 4,743 5,551 EBITDA 322 529 729 835 Pre-tax Profit 206 353 490 559 Net Profit 174 272 367 418 Net Pft (Pre Ex.) 174 272 367 418 Net Pft Gth (Pre-ex) (%) (47.1) 56.7 34.5 14.1 EPS (Rp) 20.0 31.3 42.0 48.0 EPS Pre Ex. (Rp) 20.0 31.3 42.0 48.0 EPS Gth Pre Ex (%) (47) 57 35 14 Diluted EPS (Rp) 20.0 31.3 42.0 48.0 Net DPS (Rp) 5.99 9.38 12.6 14.4 BV Per Share (Rp) 253 278 311 346 PE (X) 30.3 19.4 14.4 12.6 PE Pre Ex. (X) 30.3 19.4 14.4 12.6 P/Cash Flow (X) 11.5 nm 15.5 10.2 EV/EBITDA (X) 15.7 10.7 8.4 7.4 Net Div Yield (%) 1.0 1.5 2.1 2.4 P/Book Value (X) 2.4 2.2 1.9 1.7 Net Debt/Equity (X) CASH 0.1 0.3 0.3 ROAE (%) 8.0 11.8 14.3 14.6 Earnings Rev (%): 0 0 0 Consensus EPS (Rp): N/A 42.9 51.6 Other Broker Recs: B: 14 S: 1 H: 1
Source of all data on this page: Company, AllianceDBS, DBSVI, Bloomberg Finance L.P
Excellent proxy for construction growth Maintain BUY. As infrastructure projects move to execution phase, we believe Wijaya Karya Beton (WTON) is in a sweet spot as it starts to receive precast orders from contractors or project owners. Faster execution of infrastructure projects, and improving revenue visibility with contract backlog already reaching 1.1x of our FY17 revenue forecast should support an upward re-rating of WTON’s share price. The company currently trades at attractive PE valuations of 14x/13x on FY17F/18F earnings, at the lower end of its trading range. We maintain our BUY call with a lower TP of Rp760, providing 26% potential upside.
Banking on WIKA’s large order book. In 5M17, WTON clinched Rp2.3tr worth of new contracts (+48% y-o-y), representing 33% of management’s target. We are confident that WTON will be able to achieve its target of Rp7tr in FY17 supported by contracts from its parent company Wijaya Karya (WIKA). With stronger balance sheet post rights issue in 4Q16, WIKA has more capacity to take on larger-scale projects, which should further boost WTON’s earnings outlook.
Where we differ. Our Buy call and earnings is in line with consensus.
Potential catalyst. The disbursement of loans from China Development Bank would accelerate the construction progress of Jakarta-Bandung HSR project and boost WTON’s earnings and order flows. On a macro level, a steady rollout of infrastructure projects will eventually filter down to precast players like WTON. We also expect 2Q17 revenue to be stronger as projects that were delayed in 1Q17 have picked up pace. Valuation:
We revise down our TP to Rp760. We pegged our TP to 18x FY17F, a 10% premium to our revised target multiple for WIKA (on par with its historical mean). Key Risks to Our View:
Delays in project rollout, particularly for the Jakarta-Bandung HSR, would result in lower-than-expected earnings for WTON. At A Glance Issued Capital (m shrs) 8,715 Mkt. Cap (Rpbn/US$m) 5,273 / 395 Major Shareholders (%) PT Wijaya Karya (Persero) Tbk 60.0 KKMS 8.8 Treasury Stock 4.3
Free Float (%) 26.9 3m Avg. Daily Val (US$m) 0.46 ICB Industry : Industrials / Construction & Materials
DBS Group Research . Equity 5 Jul 2017
Indonesia Company Guide
Wijaya Karya Beton Version 6 | Bloomberg: WTON IJ | Reuters: WTON.JK Refer to important disclosures at the end of this report

ASIAN INSIGHTS VICKERS SECURITIES Page 41
Company Guide
Wijaya Karya Beton
WHAT’S NEW
Building competitive edge
Building competitive edge by offering one-stop service. WTON targets to increase revenue contribution from precast concrete installation service from 4% in FY16 to 25% over the next five years. The company plans to offer a one stop service to customers, from precast production to installation, to strengthen its competitive position in the market. Our checks with management suggests that this one-stop package typically commands higher margins compared to regular sales. However, this may delay the revenue recognition and hence stretch WTON’s inventory days. We note that for regular sales, revenue is typically recorded once the precast concrete is shipped, whereas for one-stop package, revenue is recorded only when the precast concrete is installed at the project owner’s site. A case in point was the Medan-Kuala Namu railway project. The project faced some technical issues in
1Q17, leading to a delay in precast concrete installment and revenue recognition for WTON in the same period. South Lampung factory. WTON recently commissioned its new factory in South Lampung. The factory location enables the company to transport precast concrete via sea freight, which is generally cheaper compared to land transport. Based on our discussions with management, ASPs for precast sourced from the South Lampung factory to Balikpapan (East Kalimantan) is 3-6% lower compared to those sourced from the West Java factory. With this strategically located factory, we believe WTON will be able to benefit from the government’s push to decentralise infrastructure development to areas outside Java.

ASIAN INSIGHTS VICKERS SECURITIES Page 42
Company Guide
Wijaya Karya Beton
CRITICAL DATA POINTS TO WATCH
Critical Factors
Clear beneficiary of Jakarta-Bandung HSR. The Jakarta-Bandung high-speed railway (HSR) project is estimated to require 3-3.5m tons of precast concrete in 2017-2019 with a contract value of Rp6tr – Rp9tr. WTON expects to win at least Rp2tr – Rp3tr of the total contract size. The company plans to set up several temporary production facilities near HSR’s construction site to cater to this large order. In addition, the HSR consortium also plans to build a Transit Oriented Development (TOD) in the vicinity of HSR’s four stations. We expect the HSR project to contribute 13%/22% to our FY17/FY18 revenue and EBIT forecasts. First-mover advantage in ex Java market. WTON has continued to expand its coverage to markets outside Java where there are fewer competitors. In these areas, the company often serves as the only large-scale precast producer, allowing it to maintain higher pricing and margins compared to those in Java. Based on our channel checks, WTON’s state-run competitors will still be focusing on expanding in the Java market in the near future. Therefore, we are confident that WTON’s position outside Java markets will remain firm. The rollout of toll roads and port projects outside Java should benefit WTON as it will be able to meet the precast requirements. In FY16, net margin of ex Java market was 500bps higher than Java’s. Best proxy to domestic construction boom. We believe WTON is in a sweet spot to benefit from the government’s ambitious infrastructure buildout plan given that it has the most extensive product offerings and geographical reach. It is worth noting that 24% of WTON’s total installed capacity (610,000 ton p.a.) is located outside Java, the largest among peers. As the government plans to place more focus on infrastructure development outside Java, we believe WTON would be the biggest beneficiary of this shift. Based on our analysis, supply and demand dynamics for the domestic precast market would still be favourable in the next three years if the government manages to execute priority infra projects in a timely manner. We forecast a total precast supply of 4.75m tons p.a. from the four largest precast-arms of listed state-owned contractors by the end of 2017. To estimate the demand, we selected power plants and transportation-based projects listed in the government’s priority project list and Jakarta-Bandung HSR. Based on our estimates, these infra projects would require 15.3m tons of precast within three years or 5.1m tons p.a. Hence, we believe that the demand and supply dynamics of the industry is still in favour of players like WTON.
Gross margin (%)
Production capacity ('000 tons)
Sales volume ('000 tons)
Utilisation rate (%)
Source: Company, AllianceDBS, DBSVI

ASIAN INSIGHTS VICKERS SECURITIES Page 43
Company Guide
Wijaya Karya Beton
Appendix 1: A look at the company's listed history – what drives its share price? WTON’s share price vs. peers*
*Based on the average return of the listed state-owned contractors Source: Company, AllianceDBS, DBSVI A: Strong pricing power WTON’s share price rally post IPO in April 2014 was driven by its strong earnings growth. WTON had a strong competitive position with market share of 38.6% in 2013, while the second largest player only commanded 15.9% market share. This allows the company to enjoy strong pricing power and margin expansion. B: Intensifying competition Slower than expected rollout of government’s infrastructure projects along with intensifying competition, especially among state-owned precast producers, caused WTON’s share price to de-rate in 2015. In FY15, WTON saw its revenue declining by 19% on the combination of declining ASP and revenue contribution from state-owned contractors. State-owned contractors such as Waskita Karya, Hutama Karya and PTPP started to expand precast production capacity and opted to source their precast requirements internally. This caused revenue contribution from state-owned contractors to decline by 43% y-o-y in FY15 with contribution to WTON’s consolidated sales shrinking from 13% to 9%. Meanwhile, we reckon intense competition resulted in WTON lowering its selling price to maintain market share. The following chart shows the correlation between WTON’s share price and revenue contribution from state-owned contractors.
WTON share price vs. revenue from state-owned
contractors
Source: Company, AllianceDBS, DBSVI C: Jakarta-Bandung high-speed railway (HSR) Despite the declining order book from state-owned contractors, the appointment of its parent company, WIKA, as one of the main contractors for the mega project Jakarta-Bandung HSR is positive for WTON. Initially, the management indicated a potential contract worth Rp6tr – Rp9tr from the mega project. This positive news caused WTON’s share price to rally following the ground breaking of the project in early 2016 (C1). However, after a prolonged series of negotiations with China, the management guided that it would likely get a significantly lower contract target of Rp2tr – Rp3tr as it was unable to meet some of the product specifications. This along with the delay in HSR construction caused the share price to de-rate (C2). D: Delay in project execution Delay in execution of infrastructure project caused WTON’s revenue to fall short of market expectations. In 1Q17, WTON’s revenue was flat y-o-y while net profit grew a marginal 2% despite its large contract backlog.
0.60
0.80
1.00
1.20
1.40
1.60
1.80
2.00
-200 400 600 800
1,000 1,200 1,400 1,600
WTON share price (LHS) WTON vs. construction (RHS)
AB
C1
D
C2
100150200250300350400450500
-200 400 600 800
1,000 1,200 1,400 1,600
Apr-14 Oct-14 Apr-15 Oct-15 Apr-16 Oct-16
WTON share price (LHS) Revenue from SOE contractors, Rp bn (RHS)

ASIAN INSIGHTS VICKERS SECURITIES Page 44
Company Guide
Wijaya Karya Beton
Balance Sheet:
Robust balance sheet to fund expansion plan. As at end of Mar 2017, WTON had Rp782bn of interest-bearing debt, bringing its gross and net gearing to 0.3x. The company has allocated a capex budget of Rp680bn for FY17 which will be funded by the combination of internal cash and debt. The company also plans to sell treasury stocks to the public starting this year. Assuming the treasury stocks are sold at Rp665 /share, proceeds raised would be Rp236bn. Share Price Drivers:
Award of large-sized, multi-year contracts. Among the potential contracts are the Jakarta-Bandung HSR and Giant Sea Wall. There is also a clear pipeline of multi-year contracts from its parent WIKA which could amount to Rp1.5tr. Better progress of Jakarta-Bandung HSR construction. The construction progress of the Jakarta-Bandung HSR project is running behind schedule after breaking ground in January 2016. Construction work has finally resumed after months of delay but the consortium has to wait for loan disbursement from China Development Bank before it is able to accelerate the construction progress. Better progress for the project would be a re-rating catalyst for WTON’s earnings and share price. Key Risks:
Delay in government’s infrastructure project rollout, particularly for the Jakarta-Bandung HSR, would result in lower-than-expected order book and profit for WTON. Delays in infrastructure project execution will cause WTON’s revenue to fall short of expectations, and also lower WTON’s profitability given its high operating leverage. Increasing competition in the Java market. Major SOE contractors are looking to increase their precast production capacities, particularly in the Java market. Intensifying competition may weaken WTON’s pricing power in Java and erode its margins. In FY16, Java contributed 56% and 38% of WTON’s consolidated revenue and earnings respectively. The bulk of WTON’s cost of goods sold (COGS) is in USD. Steel and cement make up 30% and 20% of WTON’s COGS respectively. Additionally, some overhead costs for its production facilities are also in USD, which exposes WTON’s profitability to currency fluctuations. Nevertheless, the company has mitigated this risk by signing umbrella contracts for its key raw materials, enabling it to lock in prices for three months. Company Background
WTON is the dominant market leader in precast concrete with over 30% market share.
Leverage & Asset Turnover (x)
Capital Expenditure
ROE (%)
Forward PE Band (x)
PB Band (x)
Source: Company, AllianceDBS, DBSVI
Rpbn

ASIAN INSIGHTS VICKERS SECURITIES Page 45
Company Guide
Wijaya Karya Beton
Key Assumptions
FY Dec 2014A 2015A 2016A 2017F 2018F Gross margin (%) 14.9 12.4 14.5 14.5 14.2 Production capacity ('000 2,200 2,300 2,500 3,000 3,300 Sales volume ('000 tons) 1,464 1,413 1,520 2,074 2,427 Utilisation rate (%) 66.5 61.4 60.8 69.1 73.6
Segmental Breakdown
FY Dec 2014A 2015A 2016A 2017F 2018F Revenues (Rpbn) Concrete 3,228 2,591 3,349 4,569 5,348 Service 49.7 61.7 133 174 203 Total 3,277 2,653 3,482 4,743 5,551 Operating Profit (Rpbn)
Concrete 396 231 392 534 613 Service 12.7 7.40 15.9 20.8 24.4 Total 409 238 408 555 637 Operating Profit Margins
Concrete 12.3 8.9 11.7 11.7 11.5 Service 25.5 12.0 12.0 12.0 12.0 Total 12.5 9.0 11.7 11.7 11.5
Income Statement (Rpbn)
FY Dec 2014A 2015A 2016A 2017F 2018F Revenue 3,277 2,653 3,482 4,743 5,551 Cost of Goods Sold (2,790) (2,324) (2,977) (4,057) (4,761) Gross Profit 487 329 504 686 790 Other Opng (Exp)/Inc (76.9) (90.2) (96.2) (131) (153) Operating Profit 410 238 408 555 637 Other Non Opg (Exp)/Inc (3.4) (6.4) (16.0) 0.0 0.0 Associates & JV Inc 0.0 0.0 0.0 0.0 0.0 Net Interest (Exp)/Inc 6.00 (25.9) (40.2) (66.0) (79.3) Exceptional Gain/(Loss) 0.0 0.0 0.0 0.0 0.0 Pre-tax Profit 413 206 353 490 559 Tax (89.1) (34.3) (70.5) (122) (139) Minority Interest 6.10 2.10 (9.1) 0.0 0.0 Preference Dividend 0.0 0.0 0.0 0.0 0.0 Net Profit 329 174 272 367 418 Net Profit before Except. 329 174 272 367 418 EBITDA 492 322 529 729 835 Growth Revenue Gth (%) 24.0 (19.1) 31.3 36.2 17.0 EBITDA Gth (%) 25.1 (34.5) 64.2 37.9 14.4 Opg Profit Gth (%) 22.0 (41.9) 71.2 35.8 14.8 Net Profit Gth (Pre-ex) (%) 35.3 (47.1) 56.7 34.5 14.1 Margins & Ratio Gross Margins (%) 14.9 12.4 14.5 14.5 14.2 Opg Profit Margin (%) 12.5 9.0 11.7 11.7 11.5 Net Profit Margin (%) 10.0 6.6 7.8 7.7 7.5 ROAE (%) 23.4 8.0 11.8 14.3 14.6 ROA (%) 9.8 4.2 6.0 7.2 7.2 ROCE (%) 15.5 6.9 10.6 11.9 12.2 Div Payout Ratio (%) 30.0 30.0 30.0 30.0 30.0 Net Interest Cover (x) NM 9.2 10.2 8.4 8.0
Source: Company, AllianceDBS, DBSVI

ASIAN INSIGHTS VICKERS SECURITIES Page 46
Company Guide
Wijaya Karya Beton
Quarterly / Interim Income Statement (Rpbn)
FY Dec 4Q2015 1Q2016 2Q2016 3Q2016 4Q2016 Revenue 1,104 733 786 723 1,240 Cost of Goods Sold (964) (642) (676) (618) (1,041) Gross Profit 140 91.0 110 105 199 Other Oper. (Exp)/Inc (29.7) (17.8) (23.4) (22.5) (32.5) Operating Profit 110 73.2 86.2 82.7 166 Other Non Opg (Exp)/Inc (1.4) 0.60 0.20 1.40 (18.3) Associates & JV Inc 0.0 0.0 0.0 0.0 0.0 Net Interest (Exp)/Inc (9.4) (4.2) (9.1) (11.4) (15.5) Exceptional Gain/(Loss) 0.0 0.0 0.0 0.0 0.0 Pre-tax Profit 99.2 69.7 77.3 72.7 132 Tax (12.6) (16.3) (15.3) (16.1) (22.9) Minority Interest (0.5) (3.1) (2.9) (1.6) (1.5) Net Profit 86.1 50.2 59.1 55.1 108 Net profit bef Except. 86.1 50.2 59.1 55.1 108 EBITDA 109 73.8 86.4 84.1 148 Growth Revenue Gth (%) 67.9 (33.6) 7.3 (8.0) 71.5 EBITDA Gth (%) 101.9 (32.0) 17.0 (2.6) 75.9 Opg Profit Gth (%) 105.2 (33.5) 17.8 (4.1) 101.0 Net Profit Gth (Pre-ex) (%) 151.7 (41.7) 17.7 (6.9) 96.2 Margins Gross Margins (%) 12.7 12.4 13.9 14.5 16.0 Opg Profit Margins (%) 10.0 10.0 11.0 11.4 13.4 Net Profit Margins (%) 7.8 6.9 7.5 7.6 8.7
Balance Sheet (Rpbn)
FY Dec 2014A 2015A 2016A 2017F 2018F Net Fixed Assets 1,671 1,998 2,219 2,726 2,989 Invts in Associates & JVs 0.0 0.0 0.0 0.0 0.0 Other LT Assets 4.10 3.70 3.20 3.20 3.20 Cash & ST Invts 1,039 824 343 121 69.4 Inventory 458 623 695 900 1,058 Debtors 476 570 654 935 1,094 Other Current Assets 155 439 750 846 908 Total Assets 3,802 4,456 4,662 5,529 6,121 ST Debt 565 212 470 670 670 Creditor 420 558 664 835 981 Other Current Liab 525 1,025 730 941 1,078 LT Debt 1.20 320 200 200 200 Other LT Liabilities 88.5 79.2 108 108 108 Shareholder’s Equity 2,143 2,205 2,422 2,707 3,015 Minority Interests 59.5 58.2 68.5 68.5 68.5 Total Cap. & Liab. 3,802 4,456 4,662 5,529 6,121 Non-Cash Wkg. Capital 144 49.3 704 905 1,001 Net Cash/(Debt) 472 292 (327) (749) (800) Debtors Turn (avg days) 50.0 72.0 64.1 61.1 66.7 Creditors Turn (avg days) 50.3 79.9 78.5 70.4 72.6 Inventory Turn (avg days) 87.9 88.2 84.6 74.9 78.3 Asset Turnover (x) 1.0 0.6 0.8 0.9 1.0 Current Ratio (x) 1.4 1.4 1.3 1.1 1.1 Quick Ratio (x) 1.0 0.8 0.5 0.4 0.4 Net Debt/Equity (X) CASH CASH 0.1 0.3 0.3 Net Debt/Equity ex MI (X) CASH CASH 0.1 0.3 0.3 Capex to Debt (%) 139.6 88.8 72.0 78.2 52.9 Z-Score (X) 3.8 2.8 3.1 2.9 2.8
Source: Company, AllianceDBS, DBSVI

ASIAN INSIGHTS VICKERS SECURITIES Page 47
Company Guide
Wijaya Karya Beton
Cash Flow Statement (Rpbn)
FY Dec 2014A 2015A 2016A 2017F 2018F Pre-Tax Profit 412 206 352 489 558 Dep. & Amort. 84.8 89.9 135 174 197 Tax Paid (125) (34.3) (70.5) (122) (139) Assoc. & JV Inc/(loss) 0.0 0.0 0.0 0.0 0.0 Chg in Wkg.Cap. (283) 94.4 (654) (201) (96.1) Other Operating CF 103 102 158 0.0 0.0 Net Operating CF 192 458 (79.2) 339 519 Capital Exp.(net) (790) (472) (482) (680) (460) Other Invts.(net) 0.0 0.0 0.0 0.0 0.0 Invts in Assoc. & JV 0.0 0.0 0.0 0.0 0.0 Div from Assoc & JV 0.0 0.0 0.0 0.0 0.0 Other Investing CF 0.0 0.0 0.0 0.0 0.0 Net Investing CF (790) (472) (482) (680) (460) Div Paid (20.0) (98.6) (52.2) (81.7) (110) Chg in Gross Debt 13.0 (103) 138 200 0.0 Capital Issues 1,193 0.0 0.0 0.0 0.0 Other Financing CF 37.4 0.80 (5.8) 0.0 0.0 Net Financing CF 1,224 (201) 80.2 118 (110) Currency Adjustments 0.0 0.0 0.0 0.0 0.0 Chg in Cash 625 (215) (481) (223) (51.2) Opg CFPS (Rp) 54.4 41.8 66.0 62.0 70.5 Free CFPS (Rp) (68.6) (1.6) (64.4) (39.1) 6.74
Source: Company, AllianceDBS, DBSVI
Target Price & Ratings History
Source: AllianceDBS, DBSVI
Analyst: Chong Tjen-San
Tiesha PUTRI

Industry Focus
Page 48
AllianceDBS, DBSVI recommendations are based an Absolute Total Return* Rating system, defined as follows:
STRONG BUY (>20% total return over the next 3 months, with identifiable share price catalysts within this time frame)
BUY (>15% total return over the next 12 months for small caps, >10% for large caps)
HOLD (-10% to +15% total return over the next 12 months for small caps, -10% to +10% for large caps)
FULLY VALUED (negative total return i.e. > -10% over the next 12 months)
SELL (negative total return of > -20% over the next 3 months, with identifiable catalysts within this time frame)
Share price appreciation + dividends
Completed Date: 5 Jul 2017 18:52:21 (SGT) Dissemination Date: 6 Jul 2017 09:01:12 (SGT)
Sources for all charts and tables are AllianceDBS, DBSVI unless otherwise specified.
GENERAL DISCLOSURE/DISCLAIMER
This report is prepared by AllianceDBS Research Sdn Bhd (''AllianceDBS''), PT DBS Vickers Sekuritas Indonesia (''DBSVI''). This report is solely
intended for the clients of DBS Bank Ltd, DBS Vickers Securities (Singapore) Pte Ltd, its respective connected and associated corporations and
affiliates only and no part of this document may be (i) copied, photocopied or duplicated in any form or by any means or (ii) redistributed without
the prior written consent of AllianceDBS Research Sdn Bhd (''AllianceDBS''), PT DBS Vickers Sekuritas Indonesia (''DBSVI'').
The research set out in this report is based on information obtained from sources believed to be reliable, but we (which collectively refers to DBS
Bank Ltd, its respective connected and associated corporations, affiliates and their respective directors, officers, employees and agents (collectively,
the “DBS Group”) do not make any representation or warranty as to its accuracy, completeness or correctness. Opinions expressed are subject to
change without notice. This document is prepared for general circulation. Any recommendation contained in this document does not have regard
to the specific investment objectives, financial situation and the particular needs of any specific addressee. This document is for the information of
addressees only and is not to be taken in substitution for the exercise of judgement by addressees, who should obtain separate independent legal
or financial advice. The DBS Group accepts no liability whatsoever for any direct, indirect and/or consequential loss (including any claims for loss of
profit) arising from any use of and/or reliance upon this document and/or further communication given in relation to this document. This
document is not to be construed as an offer or a solicitation of an offer to buy or sell any securities. The DBS Group, along with its affiliates and/or
persons associated with any of them may from time to time have interests in the securities mentioned in this document. The DBS Group may have
positions in, and may effect transactions in securities mentioned herein and may also perform or seek to perform broking, investment banking and
other banking services for these companies.
Any valuations, opinions, estimates, forecasts, ratings or risk assessments herein constitutes a judgment as of the date of this report, and there can be no assurance that future results or events will be consistent with any such valuations, opinions, estimates, forecasts, ratings or risk assessments. The information in this document is subject to change without notice, its accuracy is not guaranteed, it may be incomplete or condensed and it may not contain all material information concerning the company (or companies) referred to in this report and the DBS Group is under no obligation to update the information in this report.
This publication has not been reviewed or authorized by any regulatory authority in Singapore, Hong Kong or elsewhere. There is no planned schedule or frequency for updating research publication relating to any issuer.
The valuations, opinions, estimates, forecasts, ratings or risk assessments described in this report were based upon a number of estimates and
assumptions and are inherently subject to significant uncertainties and contingencies. It can be expected that one or more of the estimates on
which the valuations, opinions, estimates, forecasts, ratings or risk assessments were based will not materialize or will vary significantly from actual
results. Therefore, the inclusion of the valuations, opinions, estimates, forecasts, ratings or risk assessments described herein IS NOT TO BE RELIED
UPON as a representation and/or warranty by the DBS Group (and/or any persons associated with the aforesaid entities), that:
(a) such valuations, opinions, estimates, forecasts, ratings or risk assessments or their underlying assumptions will be achieved, and
(b) there is any assurance that future results or events will be consistent with any such valuations, opinions, estimates, forecasts, ratings or risk
assessments stated therein.
Please contact the primary analyst for valuation methodologies and assumptions associated with the covered companies or price targets.
Any assumptions made in this report that refers to commodities, are for the purposes of making forecasts for the company (or companies)
mentioned herein. They are not to be construed as recommendations to trade in the physical commodity or in the futures contract relating to the
commodity referred to in this report.

Industry Focus
Page 49
DBS Vickers Securities (USA) Inc ("DBSVUSA")"), a U.S.-registered broker-dealer, does not have its own investment banking or research
department, has not participated in any public offering of securities as a manager or co-manager or in any other investment banking transaction
in the past twelve months and does not engage in market-making.
ANALYST CERTIFICATION
The research analyst(s) primarily responsible for the content of this research report, in part or in whole, certifies that the views about the
companies and their securities expressed in this report accurately reflect his/her personal views. The analyst(s) also certifies that no part of his/her
compensation was, is, or will be, directly or indirectly, related to specific recommendations or views expressed in the report. The research analyst (s)
primarily responsible for the content of this research report, in part or in whole, certifies that he or his associate1 does not serve as an officer of
the issuer or the new listing applicant (which includes in the case of a real estate investment trust, an officer of the management company of the
real estate investment trust; and in the case of any other entity, an officer or its equivalent counterparty of the entity who is responsible for the
management of the issuer or the new listing applicant) and the research analyst(s) primarily responsible for the content of this research report or
his associate does not have financial interests2 in relation to an issuer or a new listing applicant that the analyst reviews. DBS Group has
procedures in place to eliminate, avoid and manage any potential conflicts of interests that may arise in connection with the production of
research reports. The research analyst(s) responsible for this report operates as part of a separate and independent team to the investment banking
function of the DBS Group and procedures are in place to ensure that confidential information held by either the research or investment banking
function is handled appropriately. There is no direct link of DBS Group's compensation to any specific investment banking function of the DBS
Group.
COMPANY-SPECIFIC / REGULATORY DISCLOSURES
1. DBS Bank Ltd, DBS HK, DBS Vickers Securities (Singapore) Pte Ltd (''DBSVS''), DBSV HK or their subsidiaries and/or other affiliates do not
have a proprietary position in the securities recommended in this report as of 31 May 2017.
2. Neither DBS Bank Ltd, DBS HK nor DBSV HK market makes in equity securities of the issuer(s) or company(ies) mentioned in this Research
Report.
Compensation for investment banking services:
3. DBSVUSA does not have its own investment banking or research department, nor has it participated in any public offering of securities as a
manager or co-manager or in any other investment banking transaction in the past twelve months. Any US persons wishing to obtain further
information, including any clarification on disclosures in this disclaimer, or to effect a transaction in any security discussed in this document
should contact DBSVUSA exclusively.
Disclosure of previous investment recommendation produced:
4. DBS Bank Ltd, DBS Vickers Securities (Singapore) Pte Ltd (''DBSVS''), their subsidiaries and/or other affiliates may have published other
investment recommendations in respect of the same securities / instruments recommended in this research report during the preceding 12
months. Please contact the primary analyst listed in the first page of this report to view previous investment recommendations published by
DBS Bank Ltd, DBS Vickers Securities (Singapore) Pte Ltd (''DBSVS''), their subsidiaries and/or other affiliates in the preceding 12 months.
1 An associate is defined as (i) the spouse, or any minor child (natural or adopted) or minor step-child, of the analyst; (ii) the trustee of a trust of which the analyst, his spouse, minor child (natural or adopted) or minor step-child, is a beneficiary or discretionary object; or (iii) another person accustomed or obliged to act in accordance with the directions or instructions of the analyst.
2 Financial interest is defined as interests that are commonly known financial interest, such as investment in the securities in respect of an issuer or a new listing applicant, or financial accommodation arrangement between the issuer or the new listing applicant and the firm or analysis. This term does not include commercial lending conducted at arm's length, or investments in any collective investment scheme other than an issuer or new listing applicant notwithstanding the fact that the scheme has investments in securities in respect of an issuer or a new listing applicant.

Industry Focus
Page 50
RESTRICTIONS ON DISTRIBUTION
General This report is not directed to, or intended for distribution to or use by, any person or entity who is a citizen or resident of or located in any locality, state, country or other jurisdiction where such distribution, publication, availability or use would be contrary to law or regulation.
Australia This report is being distributed in Australia by DBS Bank Ltd. (“DBS”) or DBS Vickers Securities (Singapore) Pte Ltd (“DBSVS”), both of which are exempted from the requirement to hold an Australian Financial Services Licence under the Corporation Act 2001 (“CA”) in respect of financial services provided to the recipients. Both DBS and DBSVS are regulated by the Monetary Authority of Singapore under the laws of Singapore, which differ from Australian laws. Distribution of this report is intended only for “wholesale investors” within the meaning of the CA.
Hong Kong This report is being distributed in Hong Kong by or on behalf of, and is attributable to DBS Vickers (Hong Kong) Limited which is licensed and regulated by the Hong Kong Securities and Futures Commission and/or by DBS Bank (Hong Kong) Limited which is regulated by the Hong Kong Monetary Authority and the Securities and Futures Commission. Where this publication relates to a research report, unless otherwise stated in the research report(s), DBS Bank (Hong Kong) Limited is not the issuer of the research report(s). This publication including any research report(s) is/are distributed on the express understanding that, whilst the information contained within is believed to be reliable, the information has not been independently verified by DBS Bank (Hong Kong) Limited. This report is intended for distribution in Hong Kong only to professional investors (as defined in the Securities and Futures Ordinance (Chapter 571 of the Laws of Hong Kong) and any rules promulgated thereunder.) For any query regarding the materials herein, please contact Paul Yong (CE. No. ASE988) at [email protected].
Indonesia This report is being distributed in Indonesia by PT DBS Vickers Sekuritas Indonesia.
Malaysia This report is distributed in Malaysia by AllianceDBS Research Sdn Bhd ("ADBSR"). Recipients of this report, received from ADBSR are to contact the undersigned at 603-2604 3333 in respect of any matters arising from or in connection with this report. In addition to the General Disclosure/Disclaimer found at the preceding page, recipients of this report are advised that ADBSR (the preparer of this report), its holding company Alliance Investment Bank Berhad, their respective connected and associated corporations, affiliates, their directors, officers, employees, agents and parties related or associated with any of them may have positions in, and may effect transactions in the securities mentioned herein and may also perform or seek to perform broking, investment banking/corporate advisory and other services for the subject companies. They may also have received compensation and/or seek to obtain compensation for broking, investment banking/corporate advisory and other services from the subject companies.
Wong Ming Tek, Executive Director, ADBSR
Singapore This report is distributed in Singapore by DBS Bank Ltd (Company Regn. No. 196800306E) or DBSVS (Company Regn No. 198600294G), both of which are Exempt Financial Advisers as defined in the Financial Advisers Act and regulated by the Monetary Authority of Singapore. DBS Bank Ltd and/or DBSVS, may distribute reports produced by its respective foreign entities, affiliates or other foreign research houses pursuant to an arrangement under Regulation 32C of the Financial Advisers Regulations. Where the report is distributed in Singapore to a person who is not an Accredited Investor, Expert Investor or an Institutional Investor, DBS Bank Ltd accepts legal responsibility for the contents of the report to such persons only to the extent required by law. Singapore recipients should contact DBS Bank Ltd at 6327 2288 for matters arising from, or in connection with the report.
Thailand This report is being distributed in Thailand by DBS Vickers Securities (Thailand) Co Ltd. Research reports distributed are only intended for institutional clients only and no other person may act upon it.
United Kingdom This report is produced by AllianceDBS Research Sdn Bhd (''AllianceDBS''), PT DBS Vickers Sekuritas Indonesia (''DBSVI'') which is regulated by the Securities Commission Malaysia. This report is disseminated in the United Kingdom by DBS Vickers Securities (UK) Ltd, ("DBSVUK"). DBSVUK is authorised and regulated by the Financial Conduct Authority in the United Kingdom. In respect of the United Kingdom, this report is solely intended for the clients of DBSVUK, its respective connected and associated corporations and affiliates only and no part of this document may be (i) copied, photocopied or duplicated in any form or by any means or (ii) redistributed without the prior written consent of DBSVUK. This communication is directed at persons having professional experience in matters relating to investments. Any investment activity following from this communication will only be engaged in with such persons. Persons who do not have professional experience in matters relating to investments should not rely on this communication.

Industry Focus
Page 51
Dubai
This research report is being distributed in The Dubai International Financial Centre (“DIFC”) by DBS Bank Ltd., (DIFC Branch) having its office at PO Box 506538, 3rd Floor, Building 3, East Wing, Gate Precinct, Dubai International Financial Centre (DIFC), Dubai, United Arab Emirates. DBS Bank Ltd., (DIFC Branch) is regulated by The Dubai Financial Services Authority. This research report is intended only for professional clients (as defined in the DFSA rulebook) and no other person may act upon it.
United States This report was prepared by AllianceDBS Research Sdn Bhd (''AllianceDBS''), PT DBS Vickers Sekuritas Indonesia (''DBSVI''). DBSVUSA did not participate in its preparation. The research analyst(s) named on this report are not registered as research analysts with FINRA and are not associated persons of DBSVUSA. The research analyst(s) are not subject to FINRA Rule 2241 restrictions on analyst compensation, communications with a subject company, public appearances and trading securities held by a research analyst. This report is being distributed in the United States by DBSVUSA, which accepts responsibility for its contents. This report may only be distributed to Major U.S. Institutional Investors (as defined in SEC Rule 15a-6) and to such other institutional investors and qualified persons as DBSVUSA may authorize. Any U.S. person receiving this report who wishes to effect transactions in any securities referred to herein should contact DBSVUSA directly and not its affiliate.
Other jurisdictions In any other jurisdictions, except if otherwise restricted by laws or regulations, this report is intended only for qualified, professional, institutional or sophisticated investors as defined in the laws and regulations of such jurisdictions.
AllianceDBS Research Sdn Bhd
(128540 U) 19th Floor, Menara Multi-Purpose, Capital Square,
8 Jalan Munshi Abdullah 50100 Kuala Lumpur, Malaysia.
Tel.: +603 2604 3333 Fax: +603 2604 3921 email : [email protected]