Indonesia Industry Focus Indonesia Construction Sector · Wijaya Karya Beton : Wika beton (a...
21
www.dbsvickers.com ed-TH / sa- MA Capitalising on low oil prices Faster-than-expected fuel subsidy removal due to low oil price Government spending on infrastructure could increase by 50% this year Expect this to translate into record new wins over next few years Premium valuations to persist; buy PTPP, WTON, WIKA Fuel subsidies almost completely removed. The government has taken the opportunity amidst a low oil price environment to almost completely remove its fuel subsidies. Based on the proposed budget revision (RAPBN-P), there would be c.Rp200tr reductions in fuel subsidies, from Rp276tr in the original budget to Rp81.8tr (including Rp25tr carryover). Tentatively, half or c.Rp100tr has been earmarked for additional spending on infrastructure. Infra spending could increase by 50%. Based on RAPBN-P 2015, infrastructure is the biggest beneficiary of the reductions in fuel subsidies. Government spending on infrastructure for FY15 could increase by 50% to Rp282tr compared to the original budget of Rp190tr, subject to the Parliament’s approval. This positive trend is echoed by the contractors which are on average expecting a 40% increase in new wins to Rp96.4tr for 2015.The longer-term commitment from the government remains firm where Jokowi’s 5-year infrastructure plan (2015- 2019) of US$450bn focuses on roadworks, energy and maritime works forming 60% of the total budget. This should benefit all listed SOE construction names, given their diversified expertise and orderbooks. While this will provide sentiment uplift, there will be a lag effect before it actually flows down to the contractors' bottomlines as the tender process and execution of projects will take some time. The March deadline for government project tenders may provide some urgency for rollout. Expect premium valuations to persist. Our construction universe currently trades on average at 28x/23x FY15-16F EPS respectively which is at >+2SD above mean. Given the changing landscape in Indonesia and commitment to infrastructure spending together with new reforms, we expect the sector's seemingly high valuations to persist. This is also backed by the sector’s average EPS CAGR of 24% over FY14-FY16F. As such, we have rolled forward our valuation base to FY16 to better reflect the earnings potential of the construction companies. Based on our new valuations, our top picks remain PTPP, WTON, WIKA (in this order) with new TPs of Rp4,650, Rp1,600 and Rp4,050 respectively based on 25-27.5x FY16 EPS. JCI :5,253.18 Analyst CHONG Tjen San +603 26043972 [email protected] Deidy WIJAYA +6221 3003 4931 [email protected] Wijaya Karya : Wijaya Karya is a construction company with interests in EPC, civil, building works, precast and realty. PT PP (Persero) : PT PP (Persero) is Indonesia's leading construction company with business portfolio ranging from building constructions and civil infrastructure constructions. Waskita Karya : PT Waskita Karya Tbk, is a stated-owned construction company engaged in a wide variety of construction activities including highways, bridges, ports, airports, buildings, sewerage plants, cement plants, factories and other industrial facilities. Wijaya Karya Beton : Wika beton (a subsidiary of Wijaya Karya) is a leader in precast in Indonesia with c.40% market share. Adhi Karya : Adhi Karya is a construction company with interests in civil, building works, realty and monorail. STOCKS Price Mkt Cap Target Perform. (%) Rp US$m Price Rp 3 mth 12 mth Rating Wijaya Karya 3,600 1,760 4,050 23.9 84.1 Buy PT PP (Persero) 3,645 1,403 4,650 47.9 172 Buy Waskita Karya 1,505 1,164 1,100 59.3 171.2 FV Wijaya Karya Beton 1,320 915 1,600 11.9 N.A Buy Adhi Karya 3,570 511 N/A 25.7 54.5 N/R Source: AllianceDBS, DBS Vickers DBS Group Research . Equity 26 Jan 2015 Indonesia Industry Focus Indonesia Construction Sector Refer to important disclosures at the end of this report
Transcript of Indonesia Industry Focus Indonesia Construction Sector · Wijaya Karya Beton : Wika beton (a...
www.dbsvickers.com
ed-TH / sa- MA
Capitalising on low oil prices Faster-than-expected fuel subsidy removal due to low
oil price Government spending on infrastructure could
increase by 50% this year Expect this to translate into record new wins over next
few years Premium valuations to persist; buy PTPP, WTON, WIKA Fuel subsidies almost completely removed. The government has taken the opportunity amidst a low oil price environment to almost completely remove its fuel subsidies. Based on the proposed budget revision (RAPBN-P), there would be c.Rp200tr reductions in fuel subsidies, from Rp276tr in the original budget to Rp81.8tr (including Rp25tr carryover). Tentatively, half or c.Rp100tr has been earmarked for additional spending on infrastructure.
Infra spending could increase by 50%. Based on RAPBN-P 2015, infrastructure is the biggest beneficiary of the reductions in fuel subsidies. Government spending on infrastructure for FY15 could increase by 50% to Rp282tr compared to the original budget of Rp190tr, subject to the Parliament’s approval. This positive trend is echoed by the contractors which are on average expecting a 40% increase in new wins to Rp96.4tr for 2015.The longer-term commitment from the government remains firm where Jokowi’s 5-year infrastructure plan (2015-2019) of US$450bn focuses on roadworks, energy and maritime works forming 60% of the total budget. This should benefit all listed SOE construction names, given their diversified expertise and orderbooks. While this will provide sentiment uplift, there will be a lag effect before it actually flows down to the contractors' bottomlines as the tender process and execution of projects will take some time. The March deadline for government project tenders may provide some urgency for rollout. Expect premium valuations to persist. Our construction universe currently trades on average at 28x/23x FY15-16F EPS respectively which is at >+2SD above mean. Given the changing landscape in Indonesia and commitment to infrastructure spending together with new reforms, we expect the sector's seemingly high valuations to persist. This is also backed by the sector’s average EPS CAGR of 24% over FY14-FY16F. As such, we have rolled forward our valuation base to FY16 to better reflect the earnings potential of the construction companies. Based on our new valuations, our top picks remain PTPP, WTON, WIKA (in this order) with new TPs of Rp4,650, Rp1,600 and Rp4,050 respectively based on 25-27.5x FY16 EPS.
JCI :5,253.18
Analyst CHONG Tjen San +603 26043972 [email protected]
Deidy WIJAYA +6221 3003 4931 [email protected] Wijaya Karya : Wijaya Karya is a construction company with interests in EPC, civil, building works, precast and realty.
PT PP (Persero) : PT PP (Persero) is Indonesia's leading construction company with business portfolio ranging from building constructions and civil infrastructure constructions.
Waskita Karya : PT Waskita Karya Tbk, is a stated-owned construction company engaged in a wide variety of construction activities including highways, bridges, ports, airports, buildings, sewerage plants, cement plants, factories and other industrial facilities.
Wijaya Karya Beton : Wika beton (a subsidiary of Wijaya Karya) is a leader in precast in Indonesia with c.40% market share.
Adhi Karya : Adhi Karya is a construction company with interests in civil, building works, realty and monorail.
STOCKS
Price Mkt Cap Target Perform. (%)
Rp US$m Price Rp
3 mth 12 mth
Rating
Wijaya Karya 3,600 1,760 4,050 23.9 84.1 Buy
PT PP (Persero) 3,645 1,403 4,650 47.9 172 Buy
Waskita Karya 1,505 1,164 1,100 59.3 171.2 FV
Wijaya Karya Beton 1,320 915 1,600 11.9 N.A Buy
Adhi Karya 3,570 511 N/A 25.7 54.5 N/R
Source: AllianceDBS, DBS Vickers
DBS Group Research . Equity 26 Jan 2015
Indonesia Industry Focus
Indonesia Construction Sector
Refer to important disclosures at the end of this report

Industry Focus
Indonesia Construction Sector
Page 2
Budget revisions would benefit infra the most, if approved by the Parliament. The Parliament is currently reviewing the proposed budget revision proposed by Jokowi’s team. The highlights of the revisions include the huge cut in fuel subsidies from Rp276tr to Rp81tr (which includes Rp25tr of carryover from last year). The government was able to severely cut the subsidies for fuel without causing much inflationary pressure due to the sharp fall in oil price. For gasoline outside Java and Bali, the government will only subsidise the distribution costs, while there are currently zero subsidies for gasoline in Java and
Bali. Even after removing the subsidies, gasoline price is now only Rp6,600-6,700/per litre vs. Rp6,500/liter (before the hike in Nov 2014). As such, there should not be major objections to the revised fuel subsidy budget. Out of the Rp195tr savings, Rp92tr is proposed to be channeled into infrastructure developments. If approved, infrastructure spending from APBN could increase by c.40% y-o-y to Rp282tr.
Historical price of subsidised gasoline and diesel
Source: Pertamina, AllianceDBS, DBS Vickers
APBN 2015 vs. RAPBN-P 2015
(Figures in Rp tr) APBN 2015 RAPBN-P 2015 Proposed change
Income 1,793.6 1,769.6 (24.0) Tax Revenue 1,380.0 1,490.0 110.0 Tax from oil and gas 224.3 130.0 (94.3) State expenditure 2,039.5 1,994.0 (45.5)
Infrastructure 190.0 282.0 92.0 Fuel subsidies 276.0 81.0 (195.0) LPG subsidies 43.6 26.0 (17.6) Capital injections to SOEs 7.3 48.0 40.7
Source: Kontan Newspaper, AllianceDBS, DBS Vickers SOE contractors targeting strong contract win. WIKA, PTPP, WSKT and ADHI are all confident of recording record new contract wins for this year. Based on the companies’ guidance, the total new contracts targeted for this year amount to
Rp96.4tr, implying c.50% increase vs. the original budget. WIKA and ADHI are the most aggressive, with 73% and 65% y-o-y target increases respectively.
-
1,000
2,000
3,000
4,000
5,000
6,000
7,000
8,000
9,000
Jan-
05M
ay-0
5Se
p-05
Jan-
06M
ay-0
6Se
p-06
Jan-
07M
ay-0
7Se
p-07
Jan-
08M
ay-0
8Se
p-08
Jan-
09M
ay-0
9Se
p-09
Jan-
10M
ay-1
0Se
p-10
Jan-
11M
ay-1
1Se
p-11
Jan-
12M
ay-1
2Se
p-12
Jan-
13M
ay-1
3Se
p-13
Jan-
14M
ay-1
4Se
p-14
Jan-
15
Gasoline Diesel
Gasoline price was hiked by 89% in 18 mths
Subsidized fuel price have been lowered twice in January due to low oil price

Industry Focus
Indonesia Construction Sector
Page 3
SOE contractor new contract achievements and target
Source: Companies, Various sources Note*: For WSKT’s target, we have not included potential increase in new projects from rights issue
Infrastructure Investment Requirements (RPJMN) 2015-2019 (In Rp tn)
Sector APBN APBD SOE Private Total
Roads 340.0 200.0 65.0 200.0 805.0 Railways 150.0 - 11.0 122.0 283.0 Sea Transportation 498.0 - 238.2 163.8 900.0 Air Transportation 85.0 5.0 50.0 25.0 165.0 Land Transportation 50.0 - 10.0 - 60.0 Urban Transportation 90.0 15.0 5.0 5.0 115.0 Electricity 100.0 - 445.0 435.0 980.0 Oil and gas 3.6 - 151.5 351.5 506.6 Information and Communication Technology 12.5 15.3 27.0 223.0 277.8 Water Resources 275.5 68.0 7.0 50.0 400.5 Clean Water and Sewage 227.0 198.0 44.0 30.0 499.0 Public Housing 384.0 44.0 12.5 87.0 527.5 Total Infrastructure 2,215.6 545.3 1,066.2 1,692.3 5,519.4
Source: Bappenas, AllianceDBS, DBS Vickers Location of 15 New Airports and 24 New Ports
Source: Bappenas
73.3%
33.7%
8.0%
65.2%
0%
10%
20%
30%
40%
50%
60%
70%
80%
0
5,000
10,000
15,000
20,000
25,000
30,000
35,000
WIKA PTPP WSKT* ADHI
FY13 FY14 FY15 Target FY15 growth

Industry Focus
Indonesia Construction Sector
Page 4
Premium valuations to persist; buy PTPP, WTON, WIKA. Our construction universe currently trades on average at 26x/21x FY15-16F EPS respectively which is at >+2SD above mean. Given the changing landscape in Indonesia and commitment to infrastructure spending together with new reforms, we expect the sector's seemingly high valuations to persist. This is also backed by the sector’s average EPS CAGR of 24% over FY14-
FY16F. As such, we have rolled forward our valuation base to FY16 to better reflect the earnings potential of the construction companies. Based on our new valuations, our top picks remain PTPP, WTON, WIKA (in this order) with new TPs of Rp4,650, Rp1,600 and Rp4,050 respectively, based on 25-27.5x FY16 EPS.
Peer comparisons of construction names under our coverage
P/E EPS CAGR
Share Price (Rp) FY15 FY16 (FY14-16)
WIKA 3,635 28.2 22.3 24.4%
PTPP 3,770 25.2 20.2 28.6%
WSKT 1,540 30.0 28.1 12.1%
WTON 1,330 23.2 22.9 27.5%
Source: AllianceDBS, DBS Vickers
Industry Focus
Indonesia Construction Sector
Page 5
Stock Profiles

Page 6
www.dbsvickers.com ed: SGC / sa: MA
BUY Rp3,595 JCI : 5,215.27 Upgrade to BUY (previously HOLD) Price Target : 12-Month Rp 4,050 (Prev Rp 3,200) Potential Catalyst: Stronger than expected contract win DBSV vs Consensus: Inline Analyst CHONG Tjen San +603 2604 3972 [email protected] Deidy WIJAYA +6221 3003 4931 [email protected]
Price Relative
63
113
163
213
263
313
363
413
414.0
914.0
1,414.0
1,914.0
2,414.0
2,914.0
3,414.0
3,914.0
Jan-11 Jan-12 Jan-13 Jan-14 Jan-15
Relative IndexRp
Wijaya Karya (LHS) Relative JCI INDEX (RHS) Forecasts and Valuation FY Dec (Rp bn) 2013A 2014F 2015F 2016F
Turnover 11,885 13,310 16,499 20,520 EBITDA 1,150 1,314 1,671 2,086 Pre-tax Profit 1,017 1,122 1,380 1,709 Net Profit 570 624 764 965 Net Pft (Pre Ex.) 570 624 764 965 EPS (Rp) 96 105 129 163 EPS Pre Ex. (Rp) 96 105 129 163 EPS Gth (%) 20 9 22 26 EPS Gth Pre Ex (%) 20 9 22 26 Diluted EPS (Rp) 96 105 129 163 Net DPS (Rp) 22 35 43 55 BV Per Share (Rp) 497 567 653 760 PE (X) 37.4 34.2 27.9 22.1 PE Pre Ex. (X) 37.4 34.2 27.9 22.1 P/Cash Flow (X) 73.5 53.5 32.6 25.8 EV/EBITDA (X) 19.0 17.2 13.7 11.1 Net Div Yield (%) 0.6 1.0 1.2 1.5 P/Book Value (X) 7.2 6.3 5.5 4.7 Net Debt/Equity (X) 0.1 0.3 0.3 0.3 ROAE (%) 20.6 19.8 21.1 23.0 Earnings Rev (%): 0 0 0 Consensus EPS (Rp): 108 134 169 Other Broker Recs: B: 17 S: 3 H: 2 ICB Industry : Industrials ICB Sector: Construction & Materials Principal Business: Wijaya Karya is a construction company with interests in EPC, civil, building works, precast and realty.
Source of all data: Company, Alliance DBS, DBS Vickers, Bloomberg Finance L.P.
At A Glance Issued Capital (m shrs) 6,149 Mkt. Cap (Rpbn/US$m) 22,106 / 1,772 Major Shareholders Republic of Indonesia (%) 65.2 Free Float (%) 33.8 Avg. Daily Vol.(‘000) 16,647
Indonesia Company Focus
Wijaya Karya Bloomberg: WIKA IJ | Reuters: WIKA.JK Refer to important disclosures at the end of this report
DBS Group Research . Equity 22 Jan 2015
Making amends in 2015
Ended 2014 with flat contract wins y-o-y
Contract awards pushed to 2015 - expect record wins with 73% y-o-y growth
Strong execution and diversified business to capitalise on surge in government spending
Upgrade to BUY with new TP of Rp4,050
Expecting a record year. WIKA only achieved 68% (Rp17.6tr) of its original target for new contract wins for FY14, implying flat growth. This was mainly due to the extended and lengthy election process, which delayed the award of new projects. However, this means the awards would be pushed to 2015. WIKA is confident of securing a record high Rp30.5tr worth of contracts in 2015, implying 73% y-o-y jump, as the government will increase infrastructure spending by 40%. WIKA will be a key beneficiary because of its solid track record and execution, diversified business, and the strength of its precast arm. Rolled forward valuation base to better reflect earnings potential. We rolled forward the valuation base to FY16 and derived a new TP of Rp4,050, based on 25x FY16 EPS. This is still below its peak valuation of 27x 12M forward P/E. The premium valuations for Indonesia construction companies will persist given the changing landscape in Indonesia and the current government’s commitment to infrastructure spending and reforms. Attractive 13% upside to revised TP, upgrade to BUY. Note that we modelled in lower contract wins of Rp25tr vs. management’s forecast of Rp30.5tr for this year, leaving room for us to upgrade our target valuation when the company delivers more solid contract wins.

Company Focus
Wijaya Karya
Page 7
INVESTMENT THESIS
Profile Rationale
Wijaya Karya is a construction company with interests in EPC, civil, building works, precast and realty.
Most diversified contractor, which we believe helps to secure new contracts Wika is the largest cap and most diversified proxy to the
Indonesian construction sector, enabling it to capitalise on a myriad of public and private sector jobs. Its precast arm, Wika Beton, enables it to sustain strong gross margins and is synergistic with its construction business. The acquisition of 100% of Sarana Karya, a state-controlled asphalt producer, puts it in good stead to clinch more road infrastructure works. First-mover advantage in power plants, a key focus of the MP3EI
Potential surge in infrastructure spending this year Savings from fuel subsidy is c.Rp200tr. We expect most of
this (c.Rp90tr) to be channelled into infrastructure. Based on the proposed budget revision, infrastructure spending by the central government could increase by 40% this year.
Valuation Risks
We peg our TP of Rp4,050 to 25x FY16 EPS. Upgrade to BUY given the potential upside of more than 10%.
Slow contract wins If contract wins are slow again this year, WIKA would
face risks of being derated as sentiment towards the Indonesia construction sector could turn negative.
Source: Alliance DBS, DBS Vickers

Company Focus
Wijaya Karya
Page 8
Income Statement (Rp bn) Balance Sheet (Rp bn) FY Dec 2013A 2014F 2015F 2016F FY Dec 2013A 2014F 2015F 2016F
Turnover 11,885 13,310 16,499 20,520 Net Fixed Assets 1,640 2,411 2,821 3,199 Cost of Goods Sold (10,562) (11,850) (14,705) (18,276) Invts in Associates & JVs 1,548 1,797 2,130 2,547 Gross Profit 1,322 1,461 1,794 2,245 Other LT Assets 1,412 1,412 1,412 1,412 Other Opng (Exp)/Inc (367) (424) (526) (654) Cash & ST Invts 1,421 1,908 2,203 2,603 Operating Profit 955 1,036 1,268 1,590 Inventory 1,118 1,284 1,591 1,978 Other Non Opg (Exp)/Inc (159) (100) (120) (144) Debtors 1,479 1,657 2,054 2,554 Associates & JV Inc 261 249 333 417 Other Current Assets 3,975 4,571 5,029 5,531 Net Interest (Exp)/Inc (40) (63) (101) (155) Total Assets 12,595 15,041 17,240 19,824 Exceptional Gain/(Loss) 0 0 0 0 Pre-tax Profit 1,017 1,122 1,380 1,709 ST Debt 402 402 402 402 Tax (392) (439) (543) (651) Creditor 3,089 3,468 4,295 5,342 Minority Interest (54) (60) (73) (92) Other Current Liab 3,808 4,201 4,494 4,799 Preference Dividend 0 0 0 0 LT Debt 1,271 2,471 2,971 3,471 Net Profit 570 624 764 965 Other LT Liabilities 799 799 799 799 Net Profit before Except. 570 624 764 966 Shareholder’s Equity 2,949 3,363 3,869 4,509 EBITDA 1,150 1,314 1,671 2,086 Minority Interests 278 338 411 503 Total Cap. & Liab. 12,595 15,041 17,240 19,824 Sales Gth (%) 20.0 12.0 24.0 24.4 EBITDA Gth (%) 24.3 14.3 27.2 24.8 Non-Cash Wkg. Capital (324) (157) (116) (77) Opg Profit Gth (%) 42.0 8.5 22.4 25.4 Net Cash/(Debt) (251) (965) (1,169) (1,269) Net Profit Gth (%) 19.7 9.5 22.4 26.3 Effective Tax Rate (%) 38.6 39.1 39.4 38.1 Cash Flow Statement (Rp bn) Rates & Ratio FY Dec 2013F 2014F 2015F 2016F FY Dec 2013F 2014F 2015F 2016F
Pre-Tax Profit 1,017 1,122 1,380 1,708 Gross Margins (%) 11.1 11.0 10.9 10.9 Dep. & Amort. 94 131 192 225 Opg Profit Margin (%) 8.0 7.8 7.7 7.8 Tax Paid (184) (225) (439) (543) Net Profit Margin (%) 4.8 4.7 4.6 4.7 Assoc. & JV Inc/(loss) (261) (249) (333) (417) ROAE (%) 20.6 19.8 21.1 23.0 Chg in Wkg.Cap. (180) (381) (145) (147) ROA (%) 4.8 4.5 4.7 5.2 Other Operating CF (195) 0 0 0 ROCE (%) 11.2 9.7 9.7 10.9 Net Operating CF 290 399 655 827 Div Payout Ratio (%) 22.6 33.7 33.7 33.7 Capital Exp.(net) (605) (900) (600) (600) Net Interest Cover (x) 23.9 16.5 12.6 10.3 Other Invts.(net) (17) 0 0 0 Asset Turnover (x) 1.0 1.0 1.0 1.1 Invts in Assoc. & JV (93) 0 0 0 Debtors Turn (avg days) 43.4 43.0 41.0 41.0 Div from Assoc & JV 0 0 0 0 Creditors Turn (avg days) 98.4 102.1 97.6 97.4 Other Investing CF 95 0 0 0 Inventory Turn (avg days) 39.4 37.4 36.1 36.1 Net Investing CF (620) (900) (600) (600) Current Ratio (x) 1.1 1.2 1.2 1.2 Div Paid (129) (210) (257) (325) Quick Ratio (x) 0.4 0.4 0.5 0.5 Chg in Gross Debt 417 1,200 500 500 Net Debt/Equity (X) 0.1 0.3 0.3 0.3 Capital Issues (23) 0 0 0 Net Debt/Equity ex MI (X) 0.1 0.3 0.3 0.3 Other Financing CF (80) 0 0 0 Capex to Debt (%) 36.1 31.3 17.8 15.5 Net Financing CF 185 990 243 175 Z-Score (X) NA NA NA NA Currency Adjustments 0 0 0 0 N. Cash/(Debt)PS (Rp) (42) (163) (197) (214) Chg in Cash (144) 489 297 402 Opg CFPS (Rp) 79 132 135 164 Free CFPS (Rp) (53) (85) 9 38 Quarterly / Interim Income Statement (Rp bn) Segmental Breakdown / Assumptions FY Dec 4Q2013 1Q2014 2Q2014 3Q2014 FY Dec 2013A 2014F 2015F 2016F
Turnover 3,972 2,792 3,061 2,752 Revenues (Rp bn) Cost of Goods Sold (3,494) (2,476) (2,708) (2,482) Construction 5,094 5,700 6,696 7,716 Gross Profit 478 316 353 271 Mechanical 2,931 2,739 3,692 5,091 Other Oper. (Exp)/Inc (165) (85) (93) (104) Industrial 2,990 3,655 4,751 6,177 Operating Profit 314 231 260 167 Real Estate 1,132 1,217 1,360 1,537 Other Non Opg (Exp)/Inc 24 (3) (28) (3) Others (262) N/A N/A N/A Associates & JV Inc 82 47 42 72 Total 11,885 13,310 16,499 20,520 Net Interest (Exp)/Inc (40) (2) (17) (22) PBT (Rp bn) Exceptional Gain/(Loss) (65) 0 0 0 Construction 349 378 445 504 Pre-tax Profit 314 273 258 214 Mechanical 179 295 433 562 Tax (129) (90) (93) (78) Industrial 325 347 404 444 Minority Interest (6) (16) (50) (18) Real Estate 349 167 195 215 Net Profit 180 168 115 118 Others (185) 0 0 0 Net profit bef Except. 245 168 115 118 Total 1,017 1,187 1,476 1,726 EBITDA 420 275 275 236 PBT Margins (%) Construction 6.9 6.6 6.6 6.5 Sales Gth (%) 51.0 (29.7) 9.7 (10.1) Mechanical 6.1 10.8 11.7 11.0 EBITDA Gth (%) 67.8 (34.5) 0.1 (14.2) Industrial 10.9 9.5 8.5 7.2 Opg Profit Gth (%) 79.3 (26.3) 12.7 (36.0) Real Estate 30.8 13.7 14.3 14.0 Net Profit Gth (%) 64.0 (6.9) (31.3) 2.5 Others 70.8 N/A N/A N/A Gross Margins (%) 12.0 11.3 11.5 9.8 Total 8.6 8.9 8.9 8.4 Opg Profit Margins (%) 7.9 8.3 8.5 6.1 Key Assumptions Net Profit Margins (%) 4.5 6.0 3.8 4.3 New contract wins N/A 24,792 27,271 29,726 Blended GP margins 11.1 11.0 10.9 10.9 Source: Company, Alliance DBS, DBS Vickers

Page 9
www.dbsvickers.com ed: SGC / sa: MA
BUY Rp3,630 JCI : 5,215.27 Price Target : 12-month Rp 4,650 (Prev Rp 3,300) Potential Catalyst: Strong than expected contract win DBSV vs Consensus: Higher Analyst CHONG Tjen San +603 2604 3972 [email protected] Deidy WIJAYA +6221 3003 4931 [email protected]
Price Relative
Forecasts and Valuation FY Dec (Rp bn) 2013A 2014F 2015F 2016F
Turnover 11,656 14,081 17,942 21,967 EBITDA 1,087 1,271 1,649 2,032 Pre-tax Profit 767 965 1,257 1,552 Net Profit 421 546 725 904 Net Pft (Pre Ex.) 421 546 725 904 EPS (Rp) 87 113 150 187 EPS Pre Ex. (Rp) 87 113 150 187 EPS Gth (%) 36 30 33 25 EPS Gth Pre Ex (%) 36 30 33 25 Diluted EPS (Rp) 87 113 150 187 Net DPS (Rp) 26 34 45 56 BV Per Share (Rp) 410 496 612 754 PE (X) 41.8 32.2 24.2 19.5 PE Pre Ex. (X) 41.8 32.2 24.2 19.5 P/Cash Flow (X) 27.0 nm nm 162.2 EV/EBITDA (X) 15.9 13.8 10.8 8.9 Net Div Yield (%) 0.7 0.9 1.2 1.5 P/Book Value (X) 8.9 7.3 5.9 4.8 Net Debt/Equity (X) CASH CASH 0.1 0.2 ROAE (%) 23.1 24.9 27.0 27.3 Earnings Rev (%): 7 12 9 Consensus EPS (Rp): 107 142 183 Other Broker Recs: B: 16 S: 0 H: 2 ICB Industry : Industrials ICB Sector: Construction & Materials Principal Business: PT PP (Persero) is Indonesia's leading construction company with business portfolio ranging from building constructions and civil infrastructure constructions. Source of all data: Company, AllianceDBS, DBS Vickers, Bloomberg Finance L.P.
At A Glance Issued Capital (m shrs) 4,842 Mkt. Cap (Rpbn/US$m) 17,578 / 1,409 Major Shareholders Republic of Indonesia (%) 51.0 Koperasi Karyawan Pemegang
6.2
Free Float (%) 42.8 Avg. Daily Vol.(‘000) 13,291
Indonesia Company Focus
PT PP (Persero) Bloomberg: PTPP IJ EQUITY | Reuters: PTPP.JK Refer to important disclosures at the end of this repor
DBS Group Research . Equity 22 Jan 2015
Top pick in the sector
Strongest earnings growth and revenue visibility
Jokowi’s emphasis on seaports is positive for PTPP
Expect narrower valuation gap to WIKA
Maintain BUY, TP raised to Rp4,650
Strongest growth in sector. We forecast PTPP’s earnings will grow at 29% CAGR over FY14-FY16 (from Rp546bn to Rp904bn), backed by a strong c.Rp29tr orderbook (2.1x FY14 revenue; highest in the sector). The key project remains the Kalibaru seaport project (Rp8.2tr), of which c.40% has been recognised. Given strong execution and delivery thus far, this will pave the way for Kalibaru Phase 2 (c.Rp7tr), where tenders could open by 2016. The company is targeting Rp27tr contract wins (+34% y-o-y) this year, in line with our assumption. Additionally, Jokowi’s strong emphasis on sea ports development could benefit PTPP, given its strong track record in building ports. Rolled forward valuation base to better reflect earnings potential. We rolled forward our valuation base to FY16 and derived a new TP of Rp4,650, based on 25x FY16 EPS. We also removed the discount to WIKA’s valuation as PTPP now deserves to trade on par with WIKA, given stronger earnings growth (29% vs. 24%) and highest earnings visibility. Maintain BUY, TP raised to Rp4,650. Our new TP implies more than 20% upside from PTPP’s current price, the largest upside among peers. PTPP remains our top pick in the sector.
38
88
138
188
238
288
338
388
247.5
747.5
1,247.5
1,747.5
2,247.5
2,747.5
3,247.5
3,747.5
Jan-11 Jan-12 Jan-13 Jan-14 Jan-15
Relative IndexRp
PT PP (Persero) (LHS) Relative JCI INDEX (RHS)

Company Focus
PT PP (Persero)
Page 10
INVESTMENT THESIS
Profile Rationale
PT PP is Indonesia's leading construction company which portfolio ranges from building and civil engineering to infrastructure construction. It has established a solid reputation in the construction of high rise buildings, which accounts for c.55% of its regular construction portfolio. Additionally, PTPP enjoys c.40% market share in the seaport sector (company estimate).
Potential surge in infrastructure spending this year Savings from fuel subsidy is c.Rp200tr. We expect most of
this (c.Rp90tr) to be channelled into infrastructure. Based on the proposed budget revision, infrastructure spending by the central government could increase by 40% this year.
Highest earnings growth and revenue visibility PTPP has the highest earnings growth (29% CAGR FY14-
16) and highest revenue visibility with orderbook at 2.1x FY14 revenue.
Valuation Risks
We rolled forward our valuation base to FY16 and derived a new TP of Rp4,650, based on 25x FY16 EPS. We also removed the discount to WIKA’s valuation as PTPP now deserves to trade on par with WIKA, given stronger earnings growth (29% vs. 24%) and highest earnings visibility (orderbook is 2.1x FY14 revenue).
Policy risk New government is not able to speed up infrastructure
development in Indonesia
Pressure on margin Tight competition puts pressure on margin, translating
into lower profit than expected.
Funds outflow Derating on Indonesia stocks as foreign investors allocate
funds elsewhere.
Source: AllianceDBS, DBS Vickers

Company Focus
PT PP (Persero)
Page 11
Income Statement (Rp bn) Balance Sheet (Rp bn) FY Dec 2013A 2014F 2015F 2016F FY Dec 2013A 2014F 2015F 2016F
Turnover 11,656 14,081 17,942 21,967 Net Fixed Assets 142 233 335 451 Cost of Goods Sold (10,383) (12,524) (15,928) (19,488) Invts in Associates & JVs 70 70 70 70 Gross Profit 1,273 1,557 2,013 2,479 Other LT Assets 302 302 302 302 Other Opng (Exp)/Inc (200) (303) (386) (472) Cash & ST Invts 2,573 2,897 3,172 3,621 Operating Profit 1,073 1,254 1,628 2,006 Inventory 1,777 2,227 2,833 3,466 Other Non Opg (Exp)/Inc (148) (169) (215) (264) Debtors 6,418 6,481 8,258 10,111 Associates & JV Inc 96 115 138 165 Other Current Assets 1,134 1,247 1,372 1,509 Net Interest (Exp)/Inc (255) (235) (293) (356) Total Assets 12,416 13,457 16,342 19,530 Exceptional Gain/(Loss) 0 0 0 0 Pre-tax Profit 767 965 1,257 1,552 ST Debt 1,475 1,475 1,475 1,475 Tax (346) (419) (532) (649) Creditor 6,300 6,340 8,063 9,865 Minority Interest 0 0 0 0 Other Current Liab 1,001 1,001 1,001 1,001 Preference Dividend 0 0 0 0 LT Debt 813 1,395 1,995 2,695 Net Profit 421 546 725 904 Other LT Liabilities 842 842 842 842 Net Profit before Except. 421 546 725 904 Shareholder’s Equity 1,984 2,404 2,965 3,651 EBITDA 1,087 1,271 1,649 2,032 Minority Interests 1 1 1 1 Total Cap. & Liab. 12,416 13,457 16,342 19,530 Sales Gth (%) 45.6 20.8 27.4 22.4 EBITDA Gth (%) 52.2 16.9 29.7 23.3 Non-Cash Wkg. Capital 2,027 2,615 3,399 4,220 Opg Profit Gth (%) 51.0 16.8 29.8 23.3 Net Cash/(Debt) 286 28 (297) (548) Net Profit Gth (%) 35.9 29.9 32.7 24.6 Effective Tax Rate (%) 45.1 43.4 42.3 41.8 Cash Flow Statement (Rp bn) Rates & Ratio FY Dec 2013A 2014F 2015F 2016F FY Dec 2013A 2014F 2015F 2016F
Pre-Tax Profit 767 965 1,257 1,552 Gross Margins (%) 10.9 11.1 11.2 11.3 Dep. & Amort. 14 17 21 26 Opg Profit Margin (%) 9.2 8.9 9.1 9.1 Tax Paid (346) (419) (532) (649) Net Profit Margin (%) 3.6 3.9 4.0 4.1 Assoc. & JV Inc/(loss) 0 0 0 0 ROAE (%) 23.1 24.9 27.0 27.3 Chg in Wkg.Cap. (49) (588) (784) (821) ROA (%) 4.0 4.2 4.9 5.0 Other Operating CF 266 0 0 0 ROCE (%) 13.2 12.6 14.0 14.7 Net Operating CF 651 (25) (38) 108 Div Payout Ratio (%) 40.8 39.0 39.8 37.4 Capital Exp.(net) (93) (107) (123) (142) Net Interest Cover (x) 4.2 5.3 5.6 5.6 Other Invts.(net) (35) 0 0 0 Asset Turnover (x) 1.1 1.1 1.2 1.2 Invts in Assoc. & JV (106) 0 0 0 Debtors Turn (avg days) 168.2 167.2 149.9 152.6 Div from Assoc & JV 0 0 0 0 Creditors Turn (avg days) 185.6 184.4 165.2 168.1 Other Investing CF (129) 0 0 0 Inventory Turn (avg days) 58.8 58.4 58.1 59.1 Net Investing CF (363) (107) (123) (142) Current Ratio (x) 1.4 1.5 1.5 1.5 Div Paid (93) (126) (164) (218) Quick Ratio (x) 1.0 1.1 1.1 1.1 Chg in Gross Debt 529 582 600 700 Net Debt/Equity (X) CASH CASH 0.1 0.2 Capital Issues 0 0 0 0 Net Debt/Equity ex MI (X) Cash Cash 0.1 0.2 Other Financing CF 223 0 0 0 Capex to Debt (%) 4.1 3.7 3.6 3.4 Net Financing CF 659 456 436 482 Z-Score (X) NA NA NA NA Currency Adjustments (6) 0 0 0 N. Cash/(Debt)PS (Rp) 59 6 (61) (113) Chg in Cash 940 324 275 449 Opg CFPS (Rp) 145 116 154 192 Free CFPS (Rp) 115 (27) (33) (7) Quarterly / Interim Income Statement (Rp bn) Segmental Breakdown / Assumptions FY Dec 4Q2013 1Q2014 2Q2014 3Q2014 FY Dec 2013A 2014F 2015F 2016F
Turnover 4,400 1,999 2,603 3,205 Revenues (Rp bn) Cost of Goods Sold (3,854) (1,802) (2,264) (2,829) Construction 9,952 11,736 14,742 17,557 Gross Profit 546 198 339 375 Real Estate 97 175 262 393 Other Oper. (Exp)/Inc (49) (59) (105) (46) Property 162 291 495 842 Operating Profit 498 139 234 330 EPC 1,445 1,879 2,442 3,175 Other Non Opg (Exp)/Inc (57) (17) (35) (22) Others 0 0 0 0 Associates & JV Inc 37 9 7 27 Total 11,656 14,081 17,942 21,967 Net Interest (Exp)/Inc (142) (9) (35) (97) Gross Profit (Rp bn) Exceptional Gain/(Loss) 0 0 0 0 Construction 1,077 1,256 1,577 1,879 Pre-tax Profit 336 122 169 238 Real Estate 33 59 88 132 Tax (133) (61) (84) (94) Property 24 45 79 135 Minority Interest 0 0 0 0 EPC 139 197 269 333 Net Profit 202 61 85 143 Others 0 0 0 0 Net profit bef Except. 202 61 85 143 Total 1,273 1,557 2,013 2,479 EBITDA 478 131 205 335 Gross Profit Margins (%) Construction 10.8 10.7 10.7 10.7 Sales Gth (%) 42.9 (54.6) 30.2 23.1 Real Estate 33.6 33.6 33.6 33.6 EBITDA Gth (%) 100.9 (72.6) 56.5 63.3 Property 15.0 15.5 16.0 16.0 Opg Profit Gth (%) 86.7 (72.1) 68.4 41.1 EPC 9.6 10.5 11.0 10.5 Net Profit Gth (%) 170.3 (69.6) 38.8 68.2 Others N/A N/A N/A N/A Gross Margins (%) 12.4 9.9 13.0 11.7 Total 10.9 11.1 11.2 11.3 Opg Profit Margins (%) 11.3 6.9 9.0 10.3 Key Assumptions Net Profit Margins (%) 4.6 3.1 3.3 4.5 New Contract Won (Rp bn) 13,034 14,448 17,113 20,571 Contract Carryover (Rp bn) 15,870 19,570 23,837 28,199 Gross Profit Margin (%) 10.9 11.1 11.2 11.3 Source: Company, AllianceDBS, DBS Vickers

Page 12
www.dbsvickers.com ed: SGC / sa: MA
FULLY VALUED Rp1,515 JCI : 5,215.27 Downgrade to FULLY VALUED (previously HOLD) Price Target : 12-Month Rp 1,100 (Prev Rp 965) Potential Catalyst: Stronger operating cash flow DBSV vs Consensus: Lower Analyst CHONG Tjen San +603 2604 3972; [email protected] Deidy WIJAYA +6221 3003 4931;[email protected]
Price Relative
Forecasts and Valuation FY Dec (Rp bn) 2013A 2014F 2015F 2016F
Turnover 9,687 10,913 13,417 16,014 EBITDA 734 873 1,059 1,239 Pre-tax Profit 611 692 825 920 Net Profit 368 420 494 528 Net Pft (Pre Ex.) 368 420 494 528 EPS (Rp) 38 44 51 55 EPS Pre Ex. (Rp) 38 44 51 55 EPS Gth (%) 0 14 18 7 EPS Gth Pre Ex (%) 0 14 18 7 Diluted EPS (Rp) 38 44 51 55 Net DPS (Rp) 11 13 15 16 BV Per Share (Rp) 247 280 318 357 PE (X) 39.6 34.7 29.5 27.6 PE Pre Ex. (X) 39.6 34.7 29.5 27.6 P/Cash Flow (X) nm nm nm nm EV/EBITDA (X) 20.5 18.3 16.0 14.6 Net Div Yield (%) 0.8 0.9 1.0 1.1 P/Book Value (X) 6.1 5.4 4.8 4.2 Net Debt/Equity (X) 0.2 0.5 0.8 1.0 ROAE (%) 16.8 16.6 17.2 16.2 Earnings Rev (%): 0 1 (10) Consensus EPS (Rp): 42 54 67 Other Broker Recs: B: 10 S: 2 H: 3 ICB Industry : Industrials ICB Sector: Construction & Materials Principal Business: PT Waskita Karya Tbk, is a stated owned construction company engaging in a wide variety of construction activities including highways, bridges, ports, airports, buildings, sewerage plants, cement plants, factoreis and other industrial facilities. Source of all data: Company, AllianceDBS, DBS Vickers, Bloomberg Finance L.P.
At A Glance Issued Capital (m shrs) 9,728 Mkt. Cap (Rpbn/US$m) 14,737 / 1,182 Major Shareholders Republic of Indonesia (%) 68.0 Free Float (%) 32.0 Avg. Daily Vol.(‘000) 54,332
Indonesia Company Focus
Waskita Karya Bloomberg: WSKT IJ | Reuters: WSKT.JK Refer to important disclosures at the end of this report
DBS Group Research . Equity 22 Jan 2015
Cautious on rights issue Planned rights issue will expand share base by
39%
Profitability of new projects are questionable
Solid contract wins have not translated into positive operating cash flow
Downgrade to FULLY VALUED, TP of Rp1,100
Aggressive rights issue. WSKT planning a rights issue to raise Rp10tr in two phases, which reflects its weak balance sheet relative to peers. The first phase - in June 2015 – will raise Rp5.3tr. The balance will be raised in 2016. For the first phase, the Government of Indonesia (GoI) will inject Rp3.5tr, while the balance (Rp1.8tr) would come from the public. The new shares issued under Phase I will represent c.39% of the existing share base. The GoI will be required to maintain at least 66% stake (currently 67.33%) in WSKT. The rights issue price will be the average price in the last 25 days before the rights issue date. Cautious on rights. WSKT’s share price has rallied following news of the rights issue as the Company expects to double its new contract target from Rp20tr to c.Rp40tr in FY15. We are cautious on the rights issue on two fronts: i) profitability of projects, and ii) earnings dilution. Given the aggressive target, we are concerned some of the new projects might not be profitable. Additionally despite the strong contract wins last year, we have yet to see positive operating cash flow. The rights issue may provide a temporary relief for its balance sheet, but its weak operating cash flow remains a concern. Assuming incremental contract wins of Rp5tr, Rp10tr, Rp15tr, respectively, beyond our base case of Rp22tr, and a larger share base, we estimate the impact on FY15F EPS would be -16%, -4% and +8%, respectively. This assumes constant margins and earnings recognition, which is unlikely to be the case. Downgrade to FULLY VALUED, TP of Rp1,100. WSKT is trading at c.30x/23x FY15/FY16 EPS, before adjusting for dilution impact. Our TP of Rp1,100 (20x FY16 EPS, 20% discount to WIKA) implies over 20% downside to the share price.
89
139
189
239
289
339
342.0
542.0
742.0
942.0
1,142.0
1,342.0
1,542.0
Dec-12 Jun-13 Dec-13 Jun-14 Dec-14
Relative IndexRp
Waskita Karya (LHS) Relative JCI INDEX (RHS)

Company Focus
Waskita Karya
Page 13
WSKT: Sensitivity analysis - EPS (assuming 39% increase in share base after rights issue)
Source: AllianceDBS, DBS Vickers
Additiona l new contract ( In Rp bn) 5,000 10,000 15,000 NPAT 576 658 739 EPS 43.0 49.1 55.2 EPS change -16% -4% 8%

Company Focus
Waskita Karya
Page 14
INVESTMENT THESIS
Profile Rationale
PT Waskita Karya Tbk (WSKT) is a state-owned construction company engaged in a wide variety of construction activities including toll road, bridges, ports and buildings. It is the most leveraged proxy to the Indonesian construction sector, deriving 99% of its revenues from construction and >50% of its projects from the Government of Indonesia.
Needs very strong 4Q results to meet FY forecasts In the last two years, 4Q NPAT accounted for 60% and
68% to its full year numbers. Hence, WSKT would need very strong 4Q results to meet our/consensus FY14 forecasts.
Earnings dilution from planned rights issue WSKT is planning a rights issue to raise Rp10tr in two
phases. The first, by June 2015, is expected to raise Rp5.3tr. The remaining Rp4.7tr will be done next year. For the first phase, the Government of Indonesia (GoI) will inject Rp3.5tr while the balance (Rp1.8tr) would come from the public. The new shares issued under Phase I will represent about 39% of the current share base.
Concern over rising interest expense as WSKT invests in more toll roads. We are more worried aboutWSKT plans to issue bonds to
finance its toll road projects. 3Q14 interest expense was c.50% of WSKT's EBIT, and hence, NPAT is highly sensitive to its gearing ratio.
Downgrade to Fully Valued, TP of Rp1,100 WSKT is currently trading at 28x/23x FY15/FY16 EPS,
before adjusting for earnings dilution. Based on our TP of Rp1,100 (based on 20x FY16 EPS), there is more than 20% downside to WSKT’s share price
Valuation Risks
Our target price of Rp1,100 is pegged to 20x FY15 EPS (20% discount to WIKA). Downgrade to FULLY VALUED as there is more than 20% downside to our TP.
Policy risk New government is unable to speed up infrastructure
development in Indonesia.
Pressure on margin Tight competition will pressure margins, translating into
lower-than-expected profit.
Funds outflow Derating of Indonesia's stocks as foreign investors shift
funds elsewhere.
Persistently weak operating cash flow We have yet to see positive operating cash flow at WSKT,
despite its strong contract wins last year. As such, its balance sheet could remain stretched, forcing it to make another rights or bond issue.
Source: AllianceDBS, DBS Vickers

Company Focus
Waskita Karya
Page 15
Income Statement (Rp bn) Balance Sheet (Rp bn) FY Dec 2013A 2014F 2015F 2016F FY Dec 2013A 2014F 2015F 2016F
Turnover 9,687 10,913 13,417 16,014 Net Fixed Assets 415 856 1,383 1,995 Cost of Goods Sold (8,776) (9,877) (12,143) (14,508) Invts in Associates & JVs 343 343 343 343 Gross Profit 911 1,036 1,274 1,506 Other LT Assets 249 249 249 249 Other Opng (Exp)/Inc (340) (380) (467) (557) Cash & ST Invts 1,144 1,224 1,253 1,133 Operating Profit 571 656 807 949 Inventory 281 538 661 790 Other Non Opg (Exp)/Inc 8 0 0 0 Debtors 5,654 5,980 7,352 8,775 Associates & JV Inc 103 157 179 202 Other Current Assets 702 858 1,100 1,403 Net Interest (Exp)/Inc (70) (122) (161) (231) Total Assets 8,788 10,047 12,340 14,686 Exceptional Gain/(Loss) 0 0 0 0 Pre-tax Profit 611 692 825 920 ST Debt 875 875 875 875 Tax (243) (272) (331) (392) Creditor 4,086 4,035 4,960 5,926 Minority Interest 0 0 0 0 Other Current Liab 466 466 466 466 Preference Dividend 0 0 0 0 LT Debt 748 1,748 2,748 3,748 Net Profit 368 420 494 528 Other LT Liabilities 230 230 230 230 Net Profit before Except. 368 420 494 529 Shareholder’s Equity 2,382 2,692 3,060 3,440 EBITDA 734 873 1,059 1,239 Minority Interests 1 1 1 1 Total Cap. & Liab. 8,788 10,047 12,340 14,686 Sales Gth (%) 10.0 12.7 22.9 19.4 EBITDA Gth (%) 16.2 19.0 21.3 17.0 Non-Cash Wkg. Capital 2,085 2,875 3,687 4,575 Opg Profit Gth (%) 27.5 15.1 23.0 17.6 Net Cash/(Debt) (479) (1,399) (2,370) (3,490) Net Profit Gth (%) 44.9 14.2 17.6 6.8 Effective Tax Rate (%) 39.8 39.3 40.1 42.5 Cash Flow Statement (Rp bn) Rates & Ratio FY Dec 2013A 2014F 2015F 2016F FY Dec 2013A 2014F 2015F 2016F
Pre-Tax Profit 611 692 825 919 Gross Margins (%) 9.4 9.5 9.5 9.4 Dep. & Amort. 54 62 75 90 Opg Profit Margin (%) 5.9 6.0 6.0 5.9 Tax Paid (243) (272) (331) (392) Net Profit Margin (%) 3.8 3.9 3.7 3.3 Assoc. & JV Inc/(loss) 0 0 0 0 ROAE (%) 16.8 16.6 17.2 16.2 Chg in Wkg.Cap. (623) (790) (812) (889) ROA (%) 4.3 4.5 4.4 3.9 Other Operating CF (183) 0 0 0 ROCE (%) 8.1 8.2 7.8 7.2 Net Operating CF (384) (308) (242) (270) Div Payout Ratio (%) 30.0 30.0 30.0 30.0 Capital Exp.(net) (229) (500) (600) (700) Net Interest Cover (x) 8.2 5.4 5.0 4.1 Other Invts.(net) (17) 0 0 0 Asset Turnover (x) 1.1 1.2 1.2 1.2 Invts in Assoc. & JV (93) 0 0 0 Debtors Turn (avg days) 195.7 194.6 181.3 183.8 Div from Assoc & JV 0 0 0 0 Creditors Turn (avg days) 160.1 151.0 136.0 137.8 Other Investing CF (40) 0 0 0 Inventory Turn (avg days) 14.1 15.2 18.1 18.4 Net Investing CF (379) (500) (600) (700) Current Ratio (x) 1.4 1.6 1.6 1.7 Div Paid (20) (110) (126) (148) Quick Ratio (x) 1.3 1.3 1.4 1.4 Chg in Gross Debt 417 1,000 1,000 1,000 Net Debt/Equity (X) 0.2 0.5 0.8 1.0 Capital Issues (23) 0 0 0 Net Debt/Equity ex MI (X) 0.2 0.5 0.8 1.0 Other Financing CF (691) 0 0 0 Capex to Debt (%) 14.1 19.1 16.6 15.1 Net Financing CF (317) 890 874 852 Z-Score (X) NA NA NA NA Currency Adjustments 0 0 0 0 N. Cash/(Debt)PS (Rp) (50) (145) (246) (362) Chg in Cash (1,080) 82 32 (119) Opg CFPS (Rp) 25 50 59 64 Free CFPS (Rp) (64) (84) (87) (101) Quarterly / Interim Income Statement (Rp bn) Segmental Breakdown / Assumptions FY Dec 4Q2013 1Q2014 2Q2014 3Q2014 FY Dec 2013A 2014F 2015F 2016F
Turnover 4,538 1,035 2,147 2,099 Revenues (Rp bn) Cost of Goods Sold (4,054) (924) (1,945) (1,911) Construction 9,559 10,672 13,006 15,397 Gross Profit 484 111 202 188 Building rentals/Property 0 0 0 0 Other Oper. (Exp)/Inc (155) (47) (120) (97) Precast 127 242 411 616 Operating Profit 329 63 81 91 Energy 0 0 0 0 Other Non Opg (Exp)/Inc 3 (15) 30 2 Others N/A N/A N/A N/A Associates & JV Inc 45 14 31 63 Total 9,687 10,913 13,417 16,014 Net Interest (Exp)/Inc (17) (18) (36) (31) Gross Profit (Rp bn) Exceptional Gain/(Loss) 0 0 0 0 Construction 899 1,014 1,236 1,447 Pre-tax Profit 360 44 107 125 Building rentals/Property 0 0 0 0 Tax (110) (37) (53) (57) Precast 12 22 38 59 Minority Interest 0 0 0 0 Energy 0 0 0 0 Net Profit 249 7 54 68 Others N/A N/A N/A N/A Net profit bef Except. 249 7 54 68 Total 911 1,036 1,274 1,506 EBITDA 377 62 142 156 Gross Profit Margins (%) Construction 9.4 9.5 9.5 9.4 Sales Gth (%) 112.1 (77.2) 107.5 (2.2) Building rentals/Property 100.0 100.0 100.0 100.0 EBITDA Gth (%) 180.7 (83.6) 130.9 9.9 Precast 9.3 9.1 9.3 9.5 Opg Profit Gth (%) 300.1 (80.8) 28.6 12.1 Energy N/A N/A N/A N/A Net Profit Gth (%) 304.7 (97.3) 701.2 26.1 Others N/A N/A N/A N/A Gross Margins (%) 10.7 10.7 9.4 9.0 Total 9.4 9.5 9.5 9.4 Opg Profit Margins (%) 7.3 6.1 3.8 4.3 Key Assumptions Net Profit Margins (%) 5.5 0.7 2.5 3.3 New contract wins (Rp bn) 13,318 18,769 22,000 25,300 Contract Carryover (Rp bn) 8,815 10,422 14,608 18,996 Construction GPM (%) 9.4 9.5 9.5 9.4 Source: Company, AllianceDBS, DBS Vickers
Page 16
www.dbsvickers.com ed: SGC / sa: MA
BUY Rp1,320 JCI : 5,215.27 Price Target : 12-Month Rp 1,600 (Prev Rp 1,200) Potential Catalyst: Better than expected gross margin DBSV vs Consensus: Inline Analyst Deidy WIJAYA +6221 3003 4931 [email protected] CHONG Tjen San +603 2604 3972 [email protected]
Price Relative
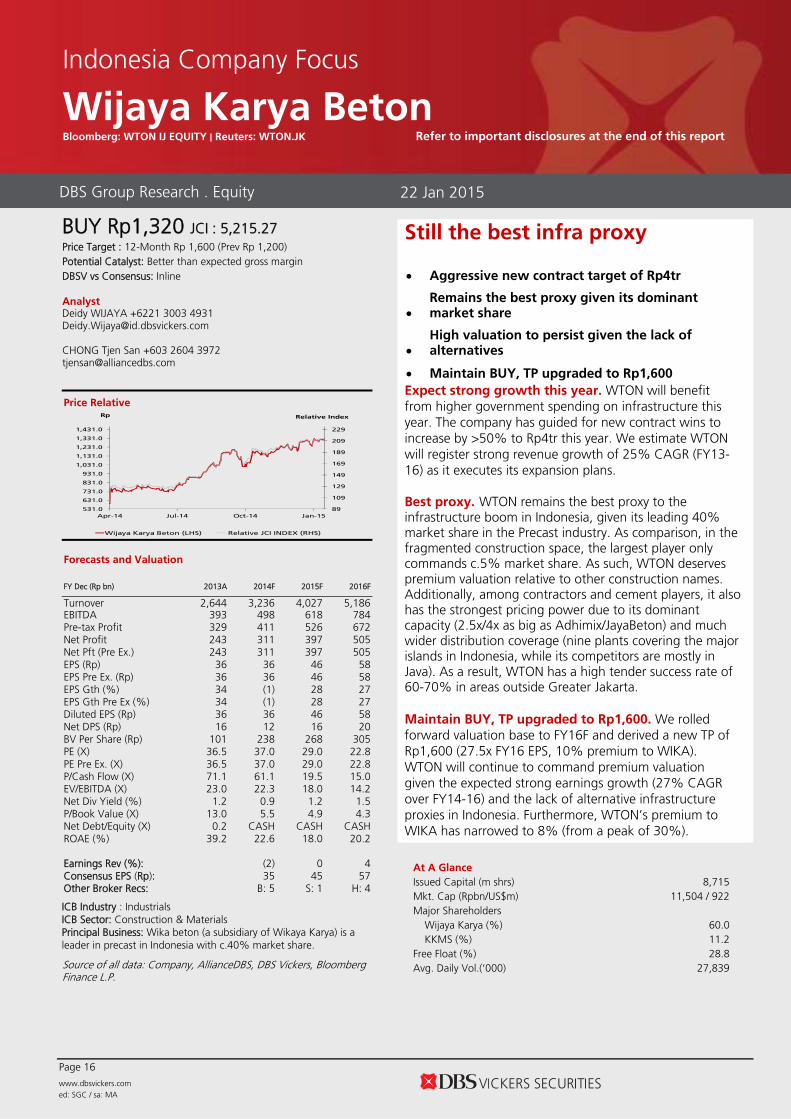
Forecasts and Valuation FY Dec (Rp bn) 2013A 2014F 2015F 2016F
Turnover 2,644 3,236 4,027 5,186 EBITDA 393 498 618 784 Pre-tax Profit 329 411 526 672 Net Profit 243 311 397 505 Net Pft (Pre Ex.) 243 311 397 505 EPS (Rp) 36 36 46 58 EPS Pre Ex. (Rp) 36 36 46 58 EPS Gth (%) 34 (1) 28 27 EPS Gth Pre Ex (%) 34 (1) 28 27 Diluted EPS (Rp) 36 36 46 58 Net DPS (Rp) 16 12 16 20 BV Per Share (Rp) 101 238 268 305 PE (X) 36.5 37.0 29.0 22.8 PE Pre Ex. (X) 36.5 37.0 29.0 22.8 P/Cash Flow (X) 71.1 61.1 19.5 15.0 EV/EBITDA (X) 23.0 22.3 18.0 14.2 Net Div Yield (%) 1.2 0.9 1.2 1.5 P/Book Value (X) 13.0 5.5 4.9 4.3 Net Debt/Equity (X) 0.2 CASH CASH CASH ROAE (%) 39.2 22.6 18.0 20.2 Earnings Rev (%): (2) 0 4 Consensus EPS (Rp): 35 45 57 Other Broker Recs: B: 5 S: 1 H: 4 ICB Industry : Industrials ICB Sector: Construction & Materials Principal Business: Wika beton (a subsidiary of Wikaya Karya) is a leader in precast in Indonesia with c.40% market share.
Source of all data: Company, AllianceDBS, DBS Vickers, Bloomberg Finance L.P.
At A Glance Issued Capital (m shrs) 8,715 Mkt. Cap (Rpbn/US$m) 11,504 / 922 Major Shareholders Wijaya Karya (%) 60.0 KKMS (%) 11.2 Free Float (%) 28.8 Avg. Daily Vol.(‘000) 27,839
Indonesia Company Focus
Wijaya Karya Beton Bloomberg: WTON IJ EQUITY | Reuters: WTON.JK Refer to important disclosures at the end of this report
DBS Group Research . Equity 22 Jan 2015
Still the best infra proxy
Aggressive new contract target of Rp4tr
Remains the best proxy given its dominant market share
High valuation to persist given the lack of alternatives
Maintain BUY, TP upgraded to Rp1,600
Expect strong growth this year. WTON will benefit from higher government spending on infrastructure this year. The company has guided for new contract wins to increase by >50% to Rp4tr this year. We estimate WTON will register strong revenue growth of 25% CAGR (FY13-16) as it executes its expansion plans. Best proxy. WTON remains the best proxy to the infrastructure boom in Indonesia, given its leading 40% market share in the Precast industry. As comparison, in the fragmented construction space, the largest player only commands c.5% market share. As such, WTON deserves premium valuation relative to other construction names. Additionally, among contractors and cement players, it also has the strongest pricing power due to its dominant capacity (2.5x/4x as big as Adhimix/JayaBeton) and much wider distribution coverage (nine plants covering the major islands in Indonesia, while its competitors are mostly in Java). As a result, WTON has a high tender success rate of 60-70% in areas outside Greater Jakarta. Maintain BUY, TP upgraded to Rp1,600. We rolled forward valuation base to FY16F and derived a new TP of Rp1,600 (27.5x FY16 EPS, 10% premium to WIKA). WTON will continue to command premium valuation given the expected strong earnings growth (27% CAGR over FY14-16) and the lack of alternative infrastructure proxies in Indonesia. Furthermore, WTON’s premium to WIKA has narrowed to 8% (from a peak of 30%).
89
109
129
149
169
189
209
229
531.0
631.0
731.0
831.0
931.0
1,031.0
1,131.0
1,231.0
1,331.0
1,431.0
Apr-14 Jul-14 Oct-14 Jan-15
Relative IndexRp
Wijaya Karya Beton (LHS) Relative JCI INDEX (RHS)

Company Focus
Wijaya Karya Beton
Page 17
WTON’s 12M forward P/E band and historical premium to WIKA
Source: Bloomberg Finance L.P., AllianceDBS, DBS Vickers
-30.0%
-20.0%
-10.0%
0.0%
10.0%
20.0%
30.0%
40.0%
15
17
19
21
23
25
27
29
31
Apr-14 May-14 Jun-14 Jul-14 Aug-14 Sep-14 Oct-14 Nov-14 Dec-14 Jan-15
BEst P/E (Blended 12 Months) Premium to WIKA (RHS)
+1 sd
+2 sd
mean
‐1 sd
‐2 sd
WTON's premium to WIKA has narrowed to 8%

Company Focus
Wijaya Karya Beton
Page 18
INVESTMENT THESIS
Profile Rationale
PT Wijaya Karya Beton Tbk (WTON) is the dominant market leader in precast concrete with c.40% market share. It is a subsidiaryof PT Wijaya Karya Tbk (WIKA), an SOE construction company. WTON was listed in April 2014, with WIKA's ownership falling to 60% (from 78.4% pre-IPO).
Potential big increase in infra spending this year The savings from fuel subsidy is c.Rp200tr. We expect
most of this (c.Rp90tr) will be channelled into infrastructure. Based on proposed budget revision, infra spending by the central government could increase by 40% this year.
Best infra proxy WTON remains the best proxy to the infrastructure boom
in Indonesia, given its leading 40% market share in the Precast industry. As comparison, in the fragmented construction space, the largest player only commands c.5% market share. As such, WTON deserves premium valuation relative to other construction names. Additionally, among contractors and cement players, it also has the strongest pricing power due to its dominant capacity (2.5x/4x as big as Adhimix/JayaBeton) and much wider distribution coverage (nine plants covering the major islands in Indonesia, while its competitors are mostly in Java). As a result, WTON has a high tender success rate of 60-70% in areas outside Greater Jakarta.
Valuation Risks
We value WTON at a 10% premium to WIKA (which we value at 25x FY15 EPS). Based on 27.5x FY16 EPS, we derived a TP of Rp1,600 for WTON.
Increasing competition from SOE contractors Major SOE contractors are investing in their precast
division. If they manage to significantly increase their capacities and compete with WTON in terms of quality of products, WTON might lose some pricing power and suffer from margin erosion.
Slower-than-expected infrastructure growth WTON is investing heavily to expand its production
capacities, in anticipation of fast-growing demand for precast concrete. If infrastructure development is slower than expected, demand for precast concrete will be lower than expected and WTON's factories will suffer from lower utilisation rates.
Bulk of COGS is linked to USD Steel and cement make up 30% and 20% of its COGS.
Additionally, some overhead costs for its production facilities are also in USD. If the USD/IDR exchange rate swings significantly, its COGS could be affected. However, the company has mitigated the risk by signing umbrella contracts (3-month) for its major raw materials. For multi-year Government projects, there is a cost escalation clause.
Source: AllianceDBS, DBS Vickers
Company Focus
Wijaya Karya Beton
Page 19
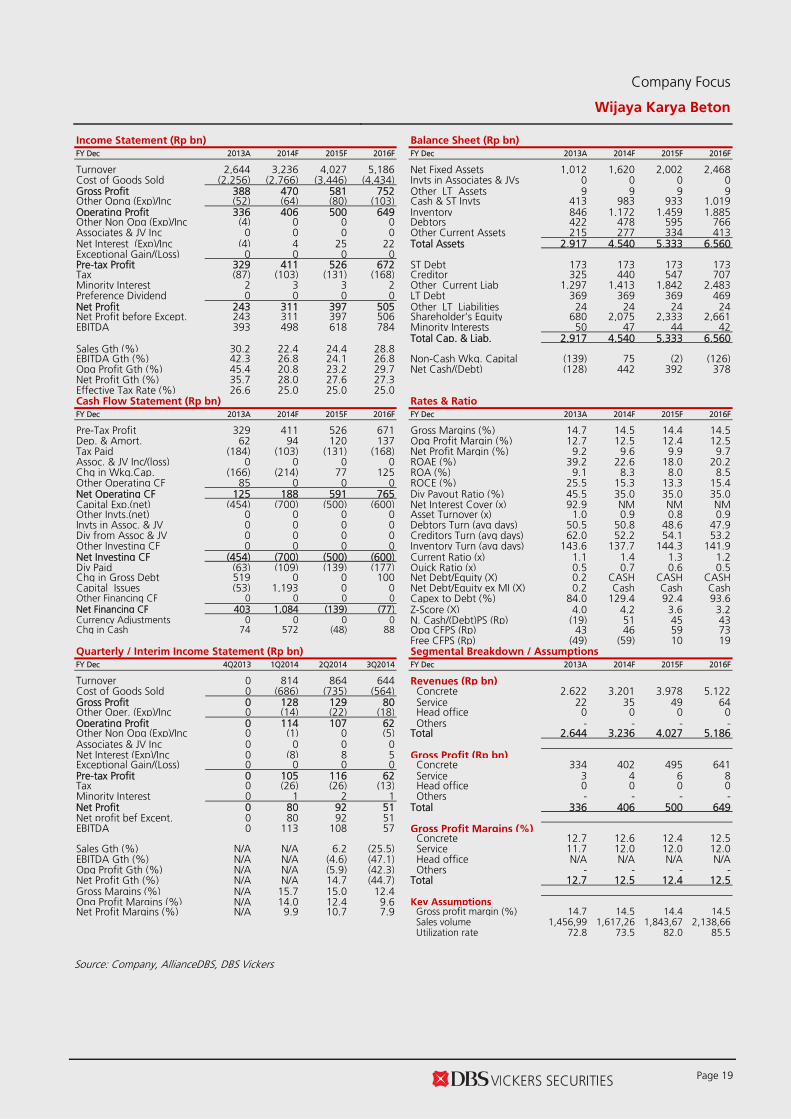
Income Statement (Rp bn) Balance Sheet (Rp bn) FY Dec 2013A 2014F 2015F 2016F FY Dec 2013A 2014F 2015F 2016F
Turnover 2,644 3,236 4,027 5,186 Net Fixed Assets 1,012 1,620 2,002 2,468 Cost of Goods Sold (2,256) (2,766) (3,446) (4,434) Invts in Associates & JVs 0 0 0 0 Gross Profit 388 470 581 752 Other LT Assets 9 9 9 9 Other Opng (Exp)/Inc (52) (64) (80) (103) Cash & ST Invts 413 983 933 1,019 Operating Profit 336 406 500 649 Inventory 846 1,172 1,459 1,885 Other Non Opg (Exp)/Inc (4) 0 0 0 Debtors 422 478 595 766 Associates & JV Inc 0 0 0 0 Other Current Assets 215 277 334 413 Net Interest (Exp)/Inc (4) 4 25 22 Total Assets 2,917 4,540 5,333 6,560 Exceptional Gain/(Loss) 0 0 0 0 Pre-tax Profit 329 411 526 672 ST Debt 173 173 173 173 Tax (87) (103) (131) (168) Creditor 325 440 547 707 Minority Interest 2 3 3 2 Other Current Liab 1,297 1,413 1,842 2,483 Preference Dividend 0 0 0 0 LT Debt 369 369 369 469 Net Profit 243 311 397 505 Other LT Liabilities 24 24 24 24 Net Profit before Except. 243 311 397 506 Shareholder’s Equity 680 2,075 2,333 2,661 EBITDA 393 498 618 784 Minority Interests 50 47 44 42 Total Cap. & Liab. 2,917 4,540 5,333 6,560 Sales Gth (%) 30.2 22.4 24.4 28.8 EBITDA Gth (%) 42.3 26.8 24.1 26.8 Non-Cash Wkg. Capital (139) 75 (2) (126) Opg Profit Gth (%) 45.4 20.8 23.2 29.7 Net Cash/(Debt) (128) 442 392 378 Net Profit Gth (%) 35.7 28.0 27.6 27.3 Effective Tax Rate (%) 26.6 25.0 25.0 25.0 Cash Flow Statement (Rp bn) Rates & Ratio FY Dec 2013A 2014F 2015F 2016F FY Dec 2013A 2014F 2015F 2016F
Pre-Tax Profit 329 411 526 671 Gross Margins (%) 14.7 14.5 14.4 14.5 Dep. & Amort. 62 94 120 137 Opg Profit Margin (%) 12.7 12.5 12.4 12.5 Tax Paid (184) (103) (131) (168) Net Profit Margin (%) 9.2 9.6 9.9 9.7 Assoc. & JV Inc/(loss) 0 0 0 0 ROAE (%) 39.2 22.6 18.0 20.2 Chg in Wkg.Cap. (166) (214) 77 125 ROA (%) 9.1 8.3 8.0 8.5 Other Operating CF 85 0 0 0 ROCE (%) 25.5 15.3 13.3 15.4 Net Operating CF 125 188 591 765 Div Payout Ratio (%) 45.5 35.0 35.0 35.0 Capital Exp.(net) (454) (700) (500) (600) Net Interest Cover (x) 92.9 NM NM NM Other Invts.(net) 0 0 0 0 Asset Turnover (x) 1.0 0.9 0.8 0.9 Invts in Assoc. & JV 0 0 0 0 Debtors Turn (avg days) 50.5 50.8 48.6 47.9 Div from Assoc & JV 0 0 0 0 Creditors Turn (avg days) 62.0 52.2 54.1 53.2 Other Investing CF 0 0 0 0 Inventory Turn (avg days) 143.6 137.7 144.3 141.9 Net Investing CF (454) (700) (500) (600) Current Ratio (x) 1.1 1.4 1.3 1.2 Div Paid (63) (109) (139) (177) Quick Ratio (x) 0.5 0.7 0.6 0.5 Chg in Gross Debt 519 0 0 100 Net Debt/Equity (X) 0.2 CASH CASH CASH Capital Issues (53) 1,193 0 0 Net Debt/Equity ex MI (X) 0.2 Cash Cash Cash Other Financing CF 0 0 0 0 Capex to Debt (%) 84.0 129.4 92.4 93.6 Net Financing CF 403 1,084 (139) (77) Z-Score (X) 4.0 4.2 3.6 3.2 Currency Adjustments 0 0 0 0 N. Cash/(Debt)PS (Rp) (19) 51 45 43 Chg in Cash 74 572 (48) 88 Opg CFPS (Rp) 43 46 59 73 Free CFPS (Rp) (49) (59) 10 19 Quarterly / Interim Income Statement (Rp bn) Segmental Breakdown / Assumptions FY Dec 4Q2013 1Q2014 2Q2014 3Q2014 FY Dec 2013A 2014F 2015F 2016F
Turnover 0 814 864 644 Revenues (Rp bn) Cost of Goods Sold 0 (686) (735) (564) Concrete 2,622 3,201 3,978 5,122 Gross Profit 0 128 129 80 Service 22 35 49 64 Other Oper. (Exp)/Inc 0 (14) (22) (18) Head office 0 0 0 0 Operating Profit 0 114 107 62 Others - - - - Other Non Opg (Exp)/Inc 0 (1) 0 (5) Total 2,644 3,236 4,027 5,186 Associates & JV Inc 0 0 0 0 Net Interest (Exp)/Inc 0 (8) 8 5 Gross Profit (Rp bn) Exceptional Gain/(Loss) 0 0 0 0 Concrete 334 402 495 641 Pre-tax Profit 0 105 116 62 Service 3 4 6 8 Tax 0 (26) (26) (13) Head office 0 0 0 0 Minority Interest 0 1 2 1 Others - - - - Net Profit 0 80 92 51 Total 336 406 500 649 Net profit bef Except. 0 80 92 51 EBITDA 0 113 108 57 Gross Profit Margins (%) Concrete 12.7 12.6 12.4 12.5 Sales Gth (%) N/A N/A 6.2 (25.5) Service 11.7 12.0 12.0 12.0 EBITDA Gth (%) N/A N/A (4.6) (47.1) Head office N/A N/A N/A N/A Opg Profit Gth (%) N/A N/A (5.9) (42.3) Others - - - - Net Profit Gth (%) N/A N/A 14.7 (44.7) Total 12.7 12.5 12.4 12.5 Gross Margins (%) N/A 15.7 15.0 12.4 Opg Profit Margins (%) N/A 14.0 12.4 9.6 Key Assumptions Net Profit Margins (%) N/A 9.9 10.7 7.9 Gross profit margin (%) 14.7 14.5 14.4 14.5 Sales volume 1,456,99 1,617,26 1,843,67 2,138,66 Utilization rate 72.8 73.5 82.0 85.5 Source: Company, AllianceDBS, DBS Vickers

Industry Focus
Indonesia Construction Sector
Page 20
AllianceDBS Research recommendations are based an Absolute Total Return* Rating system, defined as follows:
STRONG BUY (>20% total return over the next 3 months, with identifiable share price catalysts within this time frame)
BUY (>15% total return over the next 12 months for small caps, >10% for large caps)
HOLD (-10% to +15% total return over the next 12 months for small caps, -10% to +10% for large caps)
FULLY VALUED (negative total return i.e.> -10% over the next 12 months)
SELL (negative total return of > -20% over the next 3 months, with identifiable catalysts within this time frame)
Share price appreciation + dividends GENERAL DISCLOSURE/DISCLAIMER This report is prepared by AllianceDBS Research Sdn Bhd (“ADBSR”) (formerly known as HwangDBS Vickers Research Sdn Bhd), a subsidiary of Alliance Investment Bank Berhad (“AIBB”) and an associate of DBS Vickers Securities Holdings Pte Ltd (“DBSVH”). This report is solely intended for the clients of DBS Bank Ltd and DBS Vickers Securities (Singapore) Pte Ltd, its respective connected and associated corporations and affiliates (collectively, the “DBS Vickers Group”) only and no part of this document may be (i) copied, photocopied or duplicated in any form or by any means or (ii) redistributed without the prior written consent of ADBSR. The research set out in this report is based on information obtained from sources believed to be reliable and ADBSR, its holding company AIBB, their respective connected and associated corporations, affiliates and their respective directors, officers, employees and agents (collectively, the “Alliance Bank Group”) do not make any representation or warranty as to its accuracy, completeness or correctness. Opinions expressed are subject to change without notice. This document is prepared for general circulation. Any recommendation contained in this document does not have regard to the specific investment objectives, financial situation and the particular needs of any specific addressee. This document is for the information of addressees only and is not to be taken in substitution for the exercise of judgement by addressees, who should obtain separate independent legal or financial advice. The Alliance Bank Group accepts no liability whatsoever for any direct, indirect and/or consequential loss (including any claims for loss of profit) arising from any use of and/or reliance upon this document and/or further communication given in relation to this document. This document is not to be construed as an offer or a solicitation of an offer to buy or sell any securities. The Alliance Bank Group, along with its affiliates and/or persons associated with any of them may from time to time have interests in the securities mentioned in this document. The Alliance Bank Group may have positions in, and may effect transactions in securities mentioned herein and may also perform or seek to perform broking, investment banking/corporate advisory and other banking services for these companies. They may also have received compensation and/or seek to obtain compensation for broking, investment banking/corporate advisory and other services from the subject companies. Any valuations, opinions, estimates, forecasts, ratings or risk assessments herein constitutes a judgment as of the date of this report, and there can be no assurance that future results or events will be consistent with any such valuations, opinions, estimates, forecasts, ratings or risk assessments. The information in this document is subject to change without notice, its accuracy is not guaranteed, it may be incomplete or condensed and it may not contain all material information concerning the company (or companies) referred to in this report. The valuations, opinions, estimates, forecasts, ratings or risk assessments described in this report were based upon a number of estimates and assumptions and are inherently subject to significant uncertainties and contingencies. It can be expected that one or more of the estimates on which the valuations, opinions, estimates, forecasts, ratings or risk assessments were based will not materialize or will vary significantly from actual results. Therefore, the inclusion of the valuations, opinions, estimates, forecasts, ratings or risk assessments described herein IS NOT TO BE RELIED UPON as a representation and/or warranty by the Alliance Bank Group (and/or any persons associated with the aforesaid entities), that: (a) such valuations, opinions, estimates, forecasts, ratings or risk assessments or their underlying assumptions will be achieved, and (b) there is any assurance that future results or events will be consistent with any such valuations, opinions, estimates, forecasts, ratings or risk
assessments stated therein. Any assumptions made in this report that refers to commodities, are for the purposes of making forecasts for the company (or companies) mentioned herein. They are not to be construed as recommendations to trade in the physical commodity or in the futures contract relating to the commodity referred to in this report. DBS Vickers Securities (USA) Inc ("DBSVUSA")"), a U.S.-registered broker-dealer, does not have its own investment banking or research department, nor has it participated in any investment banking transaction as a manager or co-manager in the past twelve months. ANALYST CERTIFICATION The research analyst primarily responsible for the content of this research report, in part or in whole, certifies that the views about the companies and their securities expressed in this report accurately reflect his/her personal views. The analyst also certifies that no part of his/her compensation was, is, or will be, directly, or indirectly, related to specific recommendations or views expressed in this report. . As of the date the report is published, the analyst and his/her spouse and/or relatives who are financially dependent on the analyst, do not hold interests in the securities recommended in this report (“interest” includes direct or indirect ownership of securities). COMPANY-SPECIFIC / REGULATORY DISCLOSURES
1. DBS Vickers Securities (Singapore) Pte Ltd (“DBSVS”), their subsidiaries and/or other affiliates do not have a proprietary position in the securities recommended in this report as of 21 Jan 2015.
2. DBS Bank Ltd., DBSVS, DBSVUSA, their subsidiaries and/or other affiliates may beneficially own a total of 1% of any class of common equity securities of the company mentioned as of 23 Jan2015.
3.
Compensation for investment banking services: DBS Bank Ltd., DBSVS, DBSVUSA, their subsidiaries and/or other affiliates may have received compensation, within the past 12 months, and within the next 3 months may receive or intends to seek compensation for investment banking services fromthe company mentioned.
Industry Focus
Indonesia Construction Sector
Page 21
DBSVUSA does not have its own investment banking or research department, nor has it participated in any investment banking transaction as a manager or co-manager in the past twelve months. Any US persons wishing to obtain further information, including any clarification on disclosures in this disclaimer, or to effect a transaction in any security discussed in this document should contact DBSVUSA exclusively.
RESTRICTIONS ON DISTRIBUTION General This report is not directed to, or intended for distribution to or use by, any person or entity who is a citizen or resident of or
located in any locality, state, country or other jurisdiction where such distribution, publication, availability or use would be contrary to law or regulation.
Australia This report is being distributed in Australia by DBS Bank Ltd. (“DBS”) or DBS Vickers Securities (Singapore) Pte Ltd (“DBSVS”), both of which are exempted from the requirement to hold an Australian Financial Services Licence under the Corporation Act 2001 (“CA”) in respect of financial services provided to the recipients. Both DBS and DBSVS are regulated by the Monetary Authority of Singapore under the laws of Singapore, which differ from Australian laws. Distribution of this report is intended only for “wholesale investors” within the meaning of the CA.
Hong Kong This report is being distributed in Hong Kong by DBS Vickers (Hong Kong) Limited which is licensed and regulated by the Hong Kong Securities and Futures Commission.
Indonesia This report is being distributed in Indonesia by PT DBS Vickers Securities Indonesia.
Malaysia This report is distributed in Malaysia by AllianceDBS Research Sdn Bhd ("ADBSR") (formerly known as HwangDBS Vickers Research Sdn Bhd). Recipients of this report, received from ADBSR are to contact the undersigned at 603-2604 3333 in respect of any matters arising from or in connection with this report. In addition to the General Disclosure/Disclaimer found at the preceding page, recipients of this report are advised that ADBSR (the preparer of this report), its holding company Alliance Investment Bank Berhad, their respective connected and associated corporations, affiliates, their directors, officers, employees, agents and parties related or associated with any of them may have positions in, and may effect transactions in the securities mentioned herein and may also perform or seek to perform broking, investment banking/corporate advisory and other services for the subject companies. They may also have received compensation and/or seek to obtain compensation for broking, investment banking/corporate advisory and other services from the subject companies.
Wong Ming Tek, Executive Director, ADBSR
Singapore This report is distributed in Singapore by DBS Bank Ltd (Company Regn. No. 196800306E) or DBSVS (Company Regn No. 198600294G), both of which are Exempt Financial Advisers as defined in the Financial Advisers Act and regulated by the Monetary Authority of Singapore. DBS Bank Ltd and/or DBSVS, may distribute reports produced by its respective foreign entities, affiliates or other foreign research houses pursuant to an arrangement under Regulation 32C of the Financial Advisers Regulations. Where the report is distributed in Singapore to a person who is not an Accredited Investor, Expert Investor or an Institutional Investor, DBS Bank Ltd accepts legal responsibility for the contents of the report to such persons only to the extent required by law. Singapore recipients should contact DBS Bank Ltd at 6327 2288 for matters arising from, or in connection with the report.
Thailand This report is being distributed in Thailand by DBS Vickers Securities (Thailand) Co Ltd. Research reports distributed are only intended for institutional clients only and no other person may act upon it.
United Kingdom
This report is being distributed in the UK by DBS Vickers Securities (UK) Ltd, who is an authorised person in the meaning of the Financial Services and Markets Act and is regulated by The Financial Conduct Authority. Research distributed in the UK is intended only for institutional clients.
Dubai
This research report is being distributed in The Dubai International Financial Centre (“DIFC”) by DBS Bank Ltd., (DIFC Branch) having its office at PO Box 506538, 3rd Floor, Building 3, East Wing, Gate Precinct, Dubai International Financial Centre (DIFC), Dubai, United Arab Emirates. DBS Bank Ltd., (DIFC Branch) is regulated by The Dubai Financial Services Authority. This research report is intended only for professional clients (as defined in the DFSA rulebook) and no other person may act upon it.
United States Neither this report nor any copy hereof may be taken or distributed into the United States or to any U.S. person except in compliance with any applicable U.S. laws and regulations. It is being distributed in the United States by DBSVUSA, which accepts responsibility for its contents. Any U.S. person receiving this report who wishes to effect transactions in any securities referred to herein should contact DBSVUSA directly and not its affiliate.
Other jurisdictions
In any other jurisdictions, except if otherwise restricted by laws or regulations, this report is intended only for qualified, professional, institutional or sophisticated investors as defined in the laws and regulations of such jurisdictions.
AllianceDBS Research Sdn Bhd (128540 U) (formerly known as HwangDBS Vickers Research Sdn Bhd)
19th Floor, Menara Multi-Purpose, Capital Square, 8 Jalan Munshi Abdullah 50100
Kuala Lumpur, Malaysia. Tel.: +603 2604 3333 Fax: +603 2604 3921 email : [email protected]