Indonesia: Implementing National Policies in a Decentralized ...
28
INDONESIA: Implementing National Policies in a Decentralized Context: Special Purpose Programs to Protect the Poor 1 Ehtisham Ahmad and Luc Leruth, Fiscal Affairs Department International Monetary Fund March 2000 1 This paper is based on a note prepared by Messrs. Ahmad, Leruth, Jim Stevenson and Piyush Desai, “On compensation measures to protect the vulnerable from energy price increases,” mimeo, FAD January 2000.
Transcript of Indonesia: Implementing National Policies in a Decentralized ...
INDONESIA: Implementing National Policies in a DecentralizedContext: Special Purpose Programs to Protect the Poor1
Ehtisham Ahmad and Luc Leruth,
Fiscal Affairs DepartmentInternational Monetary Fund
March 2000
1 This paper is based on a note prepared by Messrs. Ahmad, Leruth, Jim Stevenson andPiyush Desai, “On compensation measures to protect the vulnerable from energy priceincreases,” mimeo, FAD January 2000.

- -2
I. INTRODUCTION
Indonesia is in transition from being one of the most highly centralized countries to one ofthe most decentralized. A critical difficulty is that local governments (particularly at thedistrict or lower level) currently lack credible social protection instruments. On the otherhand, at the central level, there is limited capability to implement or monitor localexpenditures. This situation generates conflicts of interest between the various levels ofgovernment which have a direct bearing on the design and efficiency of Social Safety Net(SSN) measures aimed at protecting the poor from shocks to the economy.
In the context of continuing adjustments in the economy, the Government of Indonesiaproposes to bring energy prices closer to long run marginal cost at world prices reflecting thecurrent stabilized exchange rate. A key sectoral objective is to reduce relative pricedistortions between various energy products. Although the decisions on prices are taken at anational level, measures to protect the poorest groups from such price changes often involvelower levels of administration—to identify the poor “losers” and to implement“compensatory” mechanisms. The dearth of compensatory instruments under the control ofthe center, and potential lack of compatibility between central and sub-national objectives,underscores the need for great care in designing policy options. The class of instrumentstraditionally used for such purposes, including special purpose programs or transfers, are alsoconstrained by the current absence of an effective monitoring capability at the central level.
In this paper, we examine two policy proposals—to increase the price of kerosene anddiesel—and examine the feasibility of temporary central “compensatory measures” whichmight be introduced quickly. Note that the paper does not address “permanent social safetynets” (see World Bank ,1990 and also Gupta, 2000).that might be established by localgovernments in view of their own requirements for poverty reduction.
II. DESIGN ISSUES
Under the model of governance, the center could decide on a policy measure, and use its ownstaff (or staff acting as agents for the center, known as deconcentrated staff) to implement themeasure. However, governance is becoming increasingly decentralized. Under thedecentralized model, central government measures often require local implementation. Thus,the center should use incentives in order to ensure that local governments do not succumb tothe temptation to “misdirect” the resources received from higher levels (see Ter-Minassian,ed., 1997).
In a decentralized framework, higher levels typically use special purpose grants, often withmatching requirements to ensure that the administering level has an incentive to carry out thespecified function. This has the disadvantage that the monitoring requirements are quitestringent, in spite of the matching requirements, since the center’s objective may not matchthat of the implementing administration. In addition, some of the poorer regions requiring the
- -3
expenditures may not have the requisite matching funds to utilize the grant fully. Under thesecircumstances, the central government’s objectives (e.g., for a national safety net) may bevitiated through limited implementation in the poorest areas—with better off areas receivingthe grants—or by a diversion of funds to purposes other than those intended by the center.
In the case of a central government policy action that imposes burdens on poor individuals inseveral or all local jurisdictions, there is little justification for a matching requirement toaccompany a special purpose grant. This implies that the center either has to rely on astringent monitoring arrangement, or that the scheme must possess enough “self-targeting”characteristics to achieve program objectives. Combinations of “incentives” and“monitoring” may be needed in practice.
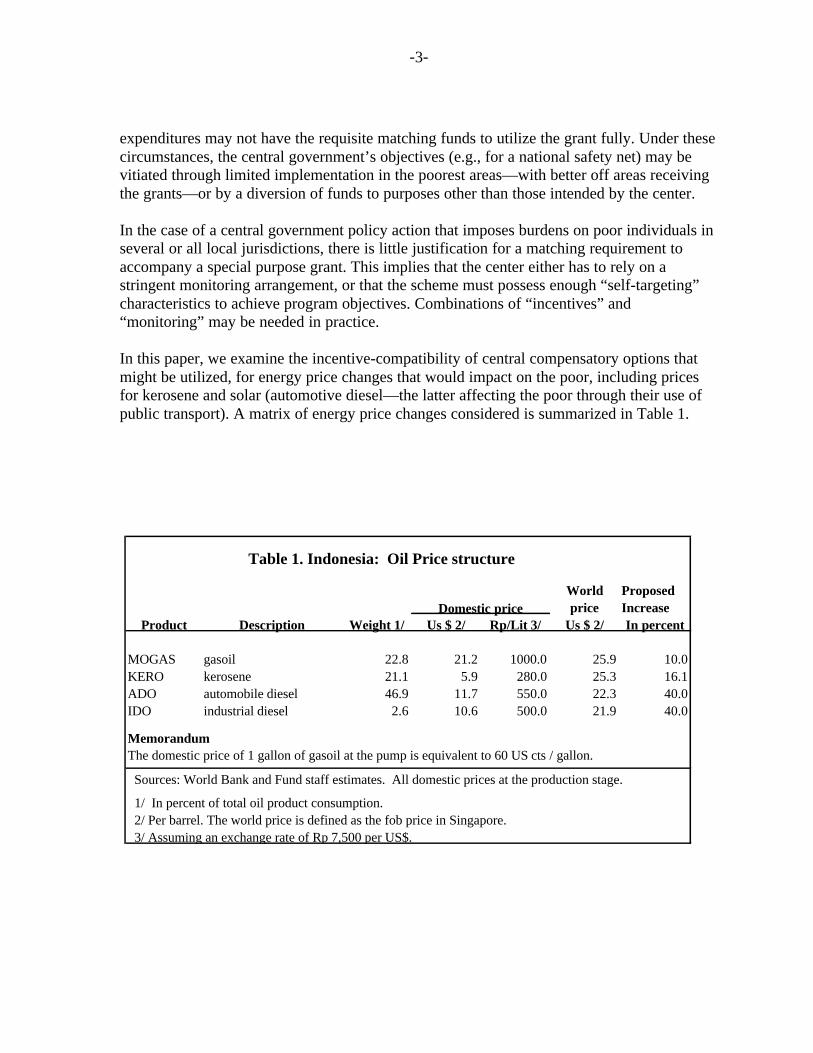
In this paper, we examine the incentive-compatibility of central compensatory options thatmight be utilized, for energy price changes that would impact on the poor, including pricesfor kerosene and solar (automotive diesel—the latter affecting the poor through their use ofpublic transport). A matrix of energy price changes considered is summarized in Table 1.
Table 1. Indonesia: Oil Price structure
World Proposedprice Increase
Product Description Weight 1/ Us $ 2/ Rp/Lit 3/ Us $ 2/ In percent
MOGAS gasoil 22.8 21.2 1000.0 25.9 10.0KERO kerosene 21.1 5.9 280.0 25.3 16.1ADO automobile diesel 46.9 11.7 550.0 22.3 40.0IDO industrial diesel 2.6 10.6 500.0 21.9 40.0
MemorandumThe domestic price of 1 gallon of gasoil at the pump is equivalent to 60 US cts / gallon.
Sources: World Bank and Fund staff estimates. All domestic prices at the production stage.
1/ In percent of total oil product consumption. 2/ Per barrel. The world price is defined as the fob price in Singapore. 3/ Assuming an exchange rate of Rp 7,500 per US$.
Domestic price

- -4
III. KEROSENE PRICING REFORMS
A. Introduction
In Indonesia, domestic kerosene is of a very high quality in terms of octane ratings, and issold at roughly 25 percent of the Singapore f.o.b. price. This encourages diversion to otheruse, including for industry, and for mixing with diesel (ADO or solar).
In 1999, the price of kerosene charged by Pertamina was Rp 280 per liter (3.7 U.S. cents),including 10 percent VAT. The price at the wholesale level is fixed by local authoritiesaccording to guidelines issued by the central government and varies (depending on transportand other costs) between Rp 350 and Rp 500—the provincial variations in price are shown inTable 2. The difference between the wholesale and the production price (set by Pertamina) is
Source: World Bank for the expenditure distributions and Ministry of Transport for regional priceinformation.
Table 2 Indonesia: Average per Capita Kerosene Expenditure
AveragePrice/liter 1 2 3 4 5
Aceh 960 400 1.03 3.52 1.32 3.13 2.95North Sumatra 1534 425 2.38 3.34 3.41 3.74 5.14West Sumatra 980 400 2.01 1.86 1.84 3.06 3.46Riau 1665 375 2.95 3.86 4.84 5.06 5.44Jambi 1033 375 2.54 2.50 2.83 3.01 2.90South Sumatra 1129 400 1.91 2.27 2.46 3.32 4.16Bengkulu 793 400 0.52 1.21 2.58 2.73 2.63Lampung 1428 375 1.86 3.08 3.87 5.15 5.02Jakarta 1838 400 5.18 5.40 5.65 3.64 3.12West Java 1964 400 3.24 4.10 5.64 5.52 6.04Central Java 1306 350 2.22 2.68 3.85 4.44 5.45Yogyakarta 1105 400 1.61 1.95 2.62 3.93 3.59East Java 1607 400 2.25 3.43 3.98 4.42 6.00Bali 1409 375 2.20 3.97 3.02 3.60 5.83West Nusa Tenggara 786 375 1.58 1.37 2.06 1.98 3.49East Nusa Tenggara 605 375 0.70 0.59 2.23 1.26 3.14East Timor 483 400 0.78 1.45 0.92 0.83 1.88West Kalimantan 1018 400 0.99 1.24 1.83 3.31 5.31Central Kalimantan 1547 350 2.85 3.41 4.84 4.62 6.21South Kalimantan 1223 375 1.50 1.35 3.16 4.67 5.56East Kalimantan 1473 500 1.45 3.00 3.31 3.19 3.71North Sulawesi 1095 350 1.60 1.01 1.85 4.19 6.98Central Sulawesi 860 300 0.95 1.37 3.69 3.34 4.90South Sulawesi 953 300 1.84 2.97 3.03 3.51 4.50South East Sulawesi 1073 350 1.02 3.51 2.77 3.63 4.34Maluku 1361 350 1.09 1.80 2.79 3.23 9.65Irian Jaya 1403 350 2.51 2.61 2.87 4.38 7.53
ProvincePer capita consumption by quintile liters/capitaAverage PC HH
KeroseneExpenditure

- -5
essentially lump-sum, with a small component proportional to the production price. End-retailers (Pangkalan) add a small margin and this constitutes the final price paid byconsumers.
Without precise data, it is difficult to assess the importance of the phenomenon of intra-sectoral distortions. A simple-minded comparison of the consumption survey with productionstatistics suggests that kerosene accounts only for 70 percent of total production, whichleaves 30 percent of the production unaccounted for. A small portion of the 30 percent isbelieved to be smuggled to neighboring countries and the bulk mixed with diesel oil by largeoperators. While, there is no reason to doubt the anecdotal evidence on mixing andsmuggling, these magnitudes implied in the figures should be treated with caution, sincecomparisons based on household surveys may be subject to considerable sampling and non-sampling errors.
BOX 1. Environmental considerations
Increasing the price of kerosene may encourage forest encroachment by the pooreager to substitute firewood to kerosene for cooking purposes.1/ The extent towhich substitutability induces a high environmental cost and should be sociallydiscouraged (say by keeping the price of kerosene low) depends on thecharacteristics of the region considered. Java, Bali and the Sunda Islands have apopulation to biomass ratio which is much higher than in the rest of Indonesia.This makes the environment more fragile and therefore more vulnerable toencroachment. In general, the argument applies to densely populated areas—although the urban poor have less of an opportunity to directly deflect risingkerosene prices onto the environment, the rural poor near large cities ofteninitiate firewood trading with the suburban areas, adding to the excessivepressure on the environment if the biomass is already depleted.1
In less densely populated parts of Indonesia, there is less of a case to keep a highsubsidy on kerosene for two reasons. First, kerosene and firewood are notperfect substitutes in the kitchen (a matter of taste and utensils required). Thus,the rural poor located near a forest will not in any case use much kerosene forcooking, even when the price differential is large. A large subsidy on kerosenewould therefore be wasted. Secondly, the very presence of a largebiomass makes forest encroachment considerably less damaging than in morefragile environments. Therefore, the environmental benefits may notcompensate for the fiscal cost of a large subsidy on kerosene.
1/ For a study of environmental conditions in Indonesia and the case for an oilsubsidy, see H. Dick (1980), "The Oil Price Subsidy, Deforestation and Equity",Bulletin of Indonesian Economic Studies, Vol XVI, No.3.

- -6
In addition to distributional considerations, the kerosene price increase must be carefullyassessed against the risk of environmental degradation induced by fuel substitution (woodinstead of kerosene). The result could lead to serious environmental damage, particularly inJava’s fragile environment. The household survey data suggests that firewood usage may bewidespread—indeed, as shown in Table 3, kerosene consumption is higher in urban areas(possibly because wood is used as cooking fuel in rural areas) then in urban areas (wherethere is no wood)—see Box 1.
Needed compensation
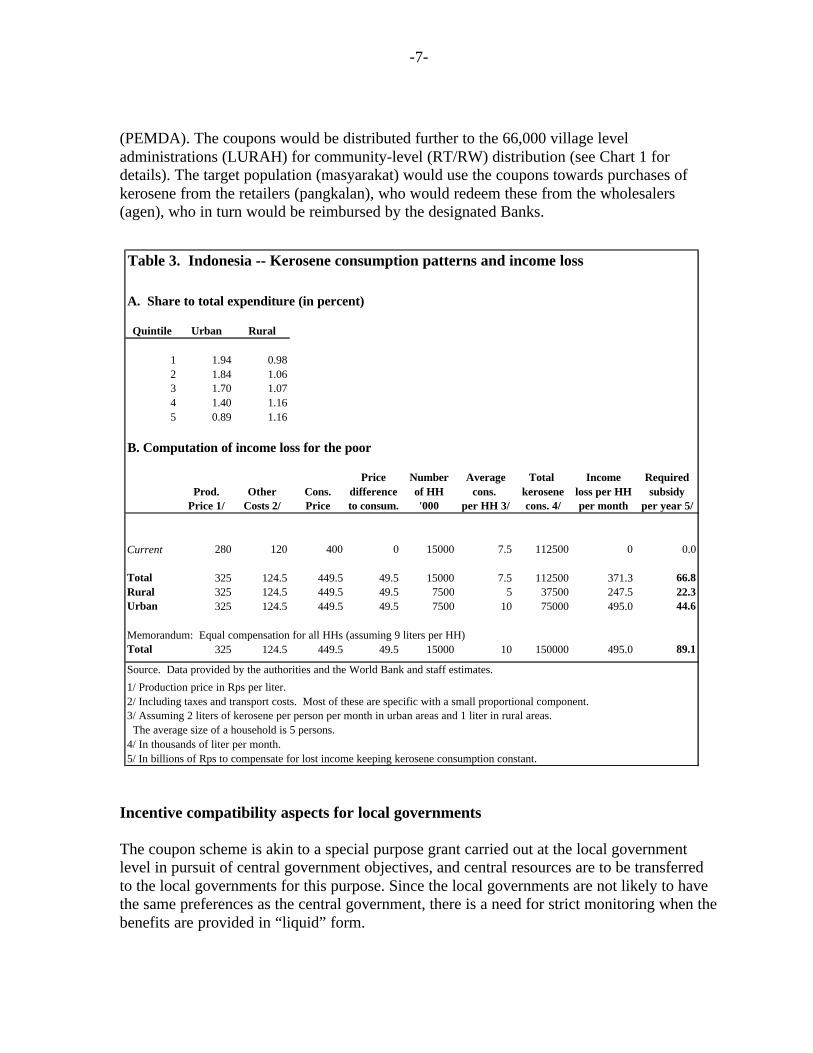
We assume that the target group for the kerosene price adjustment is the same as for thecurrent rice subsidy (OPK) administered by BULOG (13.5 million very poor households, and1.5 million “food needy” households).
The cost of the needed compensation (based on the target group of the poorest 15 millionhouseholds eligible for the rice subsidy) may be computed by using estimates of keroseneconsumption by the poorest quintile of the rural and urban population taken together (roughly2 liters per person per month). An increase in the kerosene price by Rp 45, assuming othercosts are constant, would imply a needed compensation of just over Rp 90 per person permonth.2 With an average of five persons per poor household, the annual householdcompensation needed is roughly Rp 6,000. Thus, on an annualized basis, if the targetpopulation is the same as that of the rice distribution scheme, the total annual compensationneeded amounts to Rp 90 billion. In fact, the rural consumption of kerosene in the lowerdeciles is much less than in urban areas, and thus the needed compensation will becorrespondingly lower.
Alternative measures for compensation for kerosene price increases include a coupon system,and an in-kind benefit based on the existing rice-distribution network (OPK). The formerwould have to be established from scratch, and the latter would build on an existing facility.
B. Compensation through a coupon system
A coupon system could be established for compensating poor households for the keroseneprice increases. The scheme would be administered by local governments on behalf of thecenter, and also be based on the list of households used for the distribution of the existingrice system (see below). Note that this coupon system is to compensate for a centralgovernment policy change, and should be seen as distinct from a local safety-net system(such as food stamps) that might be designed by the local administrations to reduce poverty.
At the central level, the proposed coupon scheme would be managed by BAPPENAS incoordination with the Ministry of Finance. The coupons, printed by the security press, andthe associated subsidy would be transferred to the 315 district level administrations 2 There may be a slightly greater than absolute increase in the price faced by the consumer.
- -7
(PEMDA). The coupons would be distributed further to the 66,000 village leveladministrations (LURAH) for community-level (RT/RW) distribution (see Chart 1 fordetails). The target population (masyarakat) would use the coupons towards purchases ofkerosene from the retailers (pangkalan), who would redeem these from the wholesalers(agen), who in turn would be reimbursed by the designated Banks.
Incentive compatibility aspects for local governments
The coupon scheme is akin to a special purpose grant carried out at the local governmentlevel in pursuit of central government objectives, and central resources are to be transferredto the local governments for this purpose. Since the local governments are not likely to havethe same preferences as the central government, there is a need for strict monitoring when thebenefits are provided in “liquid” form.
Table 3. Indonesia -- Kerosene consumption patterns and income loss
A. Share to total expenditure (in percent)
Quintile Urban Rural
1 1.94 0.982 1.84 1.063 1.70 1.074 1.40 1.165 0.89 1.16
B. Computation of income loss for the poor
Price Number Average Total Income RequiredProd. Other Cons. difference of HH cons. kerosene loss per HH subsidy
Price 1/ Costs 2/ Price to consum. '000 per HH 3/ cons. 4/ per month per year 5/
Current 280 120 400 0 15000 7.5 112500 0 0.0
Total 325 124.5 449.5 49.5 15000 7.5 112500 371.3 66.8Rural 325 124.5 449.5 49.5 7500 5 37500 247.5 22.3Urban 325 124.5 449.5 49.5 7500 10 75000 495.0 44.6
Memorandum: Equal compensation for all HHs (assuming 9 liters per HH)Total 325 124.5 449.5 49.5 15000 10 150000 495.0 89.1
Source. Data provided by the authorities and the World Bank and staff estimates.
1/ Production price in Rps per liter.2/ Including taxes and transport costs. Most of these are specific with a small proportional component.3/ Assuming 2 liters of kerosene per person per month in urban areas and 1 liter in rural areas. The average size of a household is 5 persons.4/ In thousands of liter per month.5/ In billions of Rps to compensate for lost income keeping kerosene consumption constant.

- -8
Unlike standard special purpose grants with matching requirements, there is little justificationfor a local financial contribution in the case of the energy price changes, given that the policychanges are entirely dictated by the center. Also, the center in this case determines the targetgroup. Since the policies are set and the financing provided centrally, but the administrationis local, incentives for the local government should be compatible with the objectives of thecenter—alternatively monitoring and enforcement would be needed in order to ensure thatthe central objectives are met effectively, and with minimal leakage.
The compensation could also be provided in cash, the center would have to depend on localgovernments for determining eligibility and targeting. Such a system could be made tofunction with audit controls to prevent fraud and leakage. Unfortunately, such audit controlsare relatively weak at present. But when the center determines the target groups, it may bepreferable to rely on a coupon system. The disadvantage, as pointed out below, is that theburden on monitoring, redemption and reconciliation of coupons increases substantially.
Administrative considerations of a coupon/voucher system
The introduction of any new system, irrespective of the extent to which it uses existingsystems, will incur additional fixed and variable costs. The proposal to introduce a couponsystem for kerosene is no exception. The following discussion outlines the types of systemsdesign, implementation and ongoing administrative activities that need to be costed in orderto accurately estimate the total cost to the state budget (and therefore the taxpayer) of theproposed kerosene compensation scheme. The exact details of the delivery mechanism haveyet to be finalized but based on discussions with officials the following costs can beanticipated.
• Systems design, procedure definition, pilot testing and finalization of the deliverymechanism documentation. These costs may be small relative to the mechanism’s totaladministrative overheads. However, detailed plans for this phase, including realistictimeframes, are essential for the system to be introduced professionally and smoothly.Faulty preparation planning together with insufficient resources and too little time can beexpected to result in adverse public acceptance of and confidence in the scheme as itsintroduction will not go smoothly. In this particular case, not being the first such schemeimplemented in Indonesia,3 close attention needs to be paid to:
a) control of and accounting for the coupons, bearing in mind that the coupon is highlyliquid;
b) minimizing the risk of coupon counterfeiting;c) encashing rules and procedures for the coupons;d) minimizing rent seeking at each stage of the coupon distribution process; ande) capacities of the local governments to administer the program.
3 A previous experiment with coupons in the 1960s was subject to considerable abuse andleakage.

- -9
• Marketing and public awareness. It will be important for the government to inform thepublic at large and certain elements of society in particular (such as NGOs in the socialsafety net arena and potential beneficiaries) about the new program. Television,newspaper and radio advertising expenses should be identified prior to the program’sintroduction.
• Recruitment and/or selection of staff for the delivery mechanism and their subsequenttraining. Recruitment costs can be expected for local administrations, particularly as thecentral government moves forward with the decentralization program. Local governmentswill consider the kerosene compensation scheme as a new program for which they willneed to recruit more staff to administer. Training costs are necessary to familiarize allofficers, be they new or existing civil servants, with the rules and procedures for the newprogram. Inadequate training will simply result in a poor implementation of the programwhich in turn will reduce the public’s confidence in the program and undermine thegovernment’s credibility in the design and implementation of social safety net programs.
• Purchase of additional office space, office requisites, computer hardware, software,telecommunications services and security services. In the case of the kerosenecompensation scheme, these costs to the government could be small. However, softwaremodifications to the banks’ systems may be necessary and these costs should be reflectedin their fees for services (see below).
• Printing and distribution of the coupons. This cost could be quite high if counterfeitingis to be avoided/minimized. Security of the coupons in transit and at the points ofdistribution will need to be considered. Again, these costs may be small relative to thetotal costs of the program.
• Staffing considerations. Within the central and local government systems, additionalstaff may be required, or existing staff resources will need to be diverted to the newprogram. Using the flowchart (see Chart 2) prepared by officials the following staffingrequirements can be expected for the administration of the program:
a) BAPPENAS (national planning agency). Staff will need to be designated to manage,monitor and report on the national program.
b) PEMDA (districts). Staff will need to record and distribute coupons to the LURAH(or directly to the RT/RW). Also at the PEMDA, staff will need to reconcile tenderedcoupons with issued coupons and acquit claims from the banks. The PEMDA unit isarguably the most important unit in the delivery and management of the scheme,particularly from the financial control aspects of the program.
c) LURAH (villages) and/or RT/RW. Staff at this level will need to
i) review and update their households eligibility list every three months;
- -10
ii) ensure any coupons that have already been issued to now non-eligible householdsare cancelled;
iii) store, issue and account for coupons;
iv) review complaints from clients and if unable to resolve them to document thecomplaint and forward it to the local complaints tribunal;
v) reissue coupons to households that have lost, burnt or otherwise no longer have intheir possession their coupons; and
vi) withdraw or cancel coupons for households that no longer live in their area ofresponsibility.
It is difficult to estimate (in this note) how many of these staff will need to be recruited fromoutside the civil service or how many could be moved from their present work commitmentswithin the civil service. The unavoidable fact is that staff are needed deliver thecompensation program and their salaries and additional expenses should be included in thetotal cost of the kerosene compensation program.
• Bank fees. The proposed mechanism allows several actors (agents, retailers and thepublic) to encash their coupons at specified banks and for the banks to seek recompensefrom the local governments (PEMDA) for the coupons. Irrespective of how these costsare met the handling of the coupons by the banks will incur costs. Such costs should becounted against the administrative costs of the compensation program.
• Auditing. The program should be audited by BPK, BPKP and various internal auditunits/Inspector Generals. The costs of conducting external and internal audits of the newcompensation scheme need to be identified and included in the total cost of the scheme.
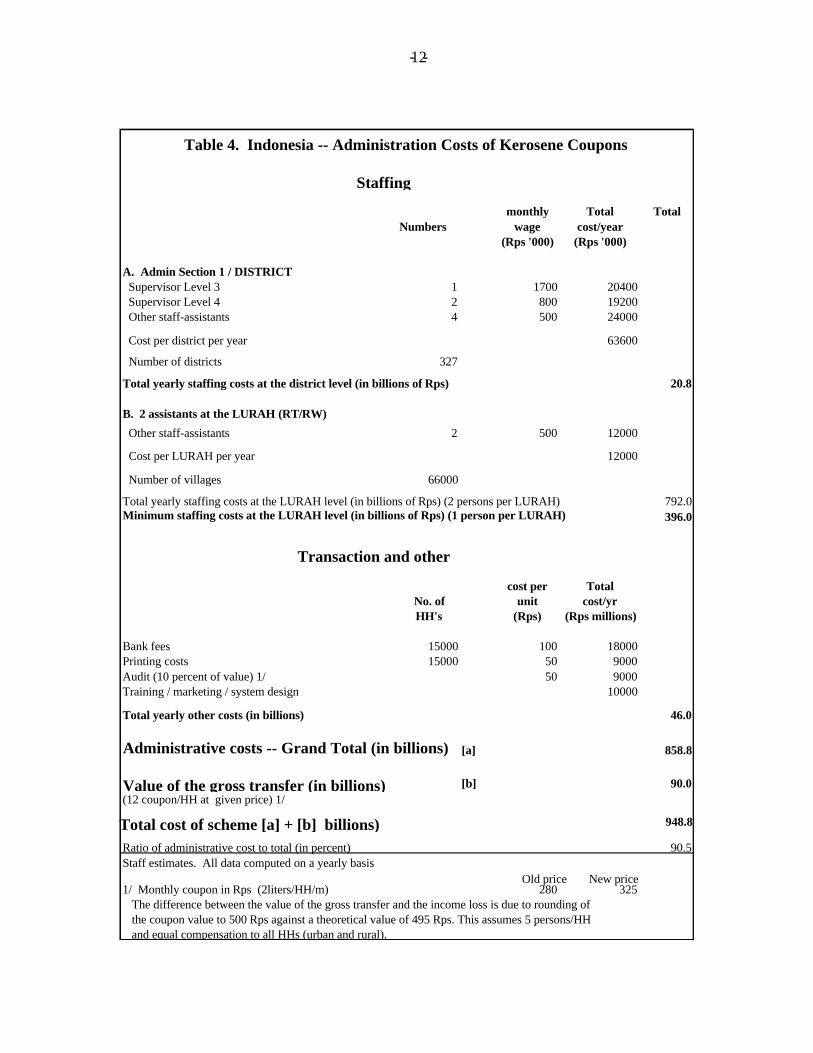
Table 4 lists certain costs identified above to provide an indicative costing for theadministrative overheads incurred to deliver the proposed kerosene compensation couponprogram. Certain assumptions were made in its compilation which, when the details of thesystem have been finalized, may need to be revisited. The most important assumption is thatthe coupon scheme is new and its administration cannot easily be “piggy-backed” on existingsocial safety delivery mechanisms, particularly the rice-for-the-poor program. Roughly66,000 local staff will be needed to administer the system—at an annual cost of aroundRp 400 billion. This rough calculation is based on the assumption of at least oneadministrator per lural, and would double with two staff which might be needed (one asbackup and for cross-checking purposes).
The calculations demonstrate that the proposed coupon scheme (and indeed any schemebased on vouchers) is labor intensive and costly. To meet basic financial accountabilitystandards, the administrative system has to be simple, precise and subject to several controls,verifications and audits. Such costs are fixed and not related directly to the value of the totalcompensation being delivered. As seen in Table 4, the fixed non-staff administrative costsare likely to be of the order of Rp 85-90 billion. This may not be cost-effective in order to
- -11
deliver a subsidy compensation of Rp 81 billion. And if the kerosene compensation programis likely to be phased out in a few years then the establishment expenses are difficult tojustify.
C. Compensation through BULOG
The main instrument presently used by the authorities to provide food security to the poor isthe “Special Operation for Rice” (OPK), introduced in 1998 as an emergency measure toprotect the poor from the recent economic crisis, and administered by Bulog (Badan UrusanLogistik), a parastatal agency.
The program has been designed to meet twin objectives:
• to distribute 20 kgs of low quality rice at below market prices (Rp 1000 per kg) toabout 15 million poor households; and
• to provide a stable source of income to poor farmers from whom most of the rice isprocured.
Targeting
One distinctive feature of the OPK scheme is that the low quality of the rice induces selftargeting. Nevertheless, a list of 15 million households who are the intended beneficiaries ofthe scheme has been established by the authorities and is updated on a regular basis. In fact,the list is used for a number of purposes (such as family planning and nutritional programs)beside rice distribution. The list includes about 7 million households in urban areas, another 7million households in rural areas, and another 1 to 1.5 million households perceived as“needy” on a variety of criteria.
Administrative arrangements
Bulog is responsible for the procurement or import, warehousing, and distribution of the ricedown to the district level. The actual distribution process to the intended beneficiaries isassumed by the local authorities, often in association with NGOs. This constitutes however,only one part of Bulog's activities, which also include other services to government such asgeneral procurement of food items, trading and logistics.
Bulog’s operations have been criticized for lack of transparency, inefficiency and leakageson a number of occasions, not least in a recent audit report produced by Arthur Andersen (seeMinistry of Finance of the Government of Indonesia, 1999). Although the Government hasreacted strongly to these criticisms, there is some real concern that Bulog’s operations requirestreamlining. As far as the rice scheme is concerned, a figure of 15 percent leakage has beenquoted and appears to be realistic (see Tabor and Sawit, 1999).
- -12
monthly Total TotalNumbers wage cost/year
(Rps '000) (Rps '000)
A. Admin Section 1 / DISTRICT Supervisor Level 3 1 1700 20400 Supervisor Level 4 2 800 19200 Other staff-assistants 4 500 24000
Cost per district per year 63600
Number of districts 327
Total yearly staffing costs at the district level (in billions of Rps) 20.8
B. 2 assistants at the LURAH (RT/RW)
Other staff-assistants 2 500 12000
Cost per LURAH per year 12000
Number of villages 66000
Total yearly staffing costs at the LURAH level (in billions of Rps) (2 persons per LURAH) 792.0Minimum staffing costs at the LURAH level (in billions of Rps) (1 person per LURAH) 396.0
cost per TotalNo. of unit cost/yrHH's (Rps) (Rps millions)
Bank fees 15000 100 18000Printing costs 15000 50 9000Audit (10 percent of value) 1/ 50 9000Training / marketing / system design 10000
Total yearly other costs (in billions) 46.0
Administrative costs -- Grand Total (in billions) [a] 858.8
Value of the gross transfer (in billions) [b] 90.0(12 coupon/HH at given price) 1/
Total cost of scheme [a] + [b] billions) 948.8
Ratio of administrative cost to total (in percent) 90.5Staff estimates. All data computed on a yearly basis
Old price New price1/ Monthly coupon in Rps (2liters/HH/m) 280 325 The difference between the value of the gross transfer and the income loss is due to rounding of the coupon value to 500 Rps against a theoretical value of 495 Rps. This assumes 5 persons/HH and equal compensation to all HHs (urban and rural).
Staffing
Transaction and other
Table 4. Indonesia -- Administration Costs of Kerosene Coupons

- -13
Some economic considerations
Unlike other Government departments, Bulog undertakes commercial trading operations ona vast scale—procurement, transport, storage, and supply of a number of essential massconsumption items. It also handles import of commodities in bulk, maintains numerous bankaccounts in commercial banks, and claims multiple subsidies from the Government –exchange rate and interest subsidies as well as towards subsidized sale of some commoditiesto the consumers.
The rice distribution network of BULOG only provides distribution up to the district level—with further allocations managed by local authorities or NGOs. While there is some evidenceof leakage, the scheme nevertheless appears to work reasonably effectively.
In addition, the magnitude of BULOG’s activities is large enough that they could generatesubstantial distortions in the market. On the procurement side, in particular, the high importduties constitute a substantial subsidy to farmers and keep domestic prices of food aboveworld prices so that another subsidy is required to compensate the poor. Thus a double-subsidy is needed in order to provide support to the farmers. As in a number of North Africancountries in the 1990s, Morocco and Algeria amongst others, clearly, in the medium term, aless costly policy would be to replace the tariffs by a direct subsidy to farmer whileconcomitantly phasing out the rice distribution program. In the short term, all efforts must bemade by the government to improve efficiency, limit leakage and impose strict financial aswell as operational audits.
Bulog’s operations are not transparent, and it is expected that the organization will be phasedout in the medium-term. Still, a case could be made to further utilize the OPK program as ashort-run safety-net for the energy price changes.
The case for compensation through additional rice
The OPK supply of rice remains small compared to actual household consumption of rice bythe poor. Indeed, the supply of 20 kgs per month per household corresponds to about 4 to 5kgs per month per person, while the household consumption survey indicates that averagerice consumption of rice by the poor is close to 17 to 18 kgs per month per person. Hence, asmall addition in the quantities provided is unlikely to induce major distortion inconsumption patters. Finally, the low quality of the rice considerably enhances the targetingaspects of the program.
Table 5 presents the implications of the additional 1 kg compensation delivered through theBULOG arrangement for the OPK rice distribution. Given the magnitude of price changesenvisaged, there would be an excess compensation provided by the additional rice to bothrural and urban households—this additional support be seen as also covering additionaltransport costs associated with the use of private transport (small buses) that are not subjectto price controls and are extensively used outside Jakarta (see section IV).

- -14
Finally, the excess compensation could be seen as an effort to compensate for both the directand indirect effects on the poor of the price changes (which may be more significant in thecase of diesel than kerosene).
A comparison of incentives
Given the greater possibility of leakage with the coupons than the rice-distributionmechanism, there are significant differences in the administration of both schemes, asconsiderably greater controls are needed for coupons. Targeting the OPK lists with “cash” or“coupons” may prove difficult, given that local authorities may have other priorities. A newcoupon-based system would need to be designed in order to ensure final delivery to theintended beneficiaries, with considerably more resources required to provide adequatemonitoring. Finally, once the infrastructure is in place, it will be exceedingly difficult todismantle the system.
On the other hand, additional OPK rice is self-targeting, and would not require additionalinfrastructure. It could be introduced quickly. Also, as import duties are reduced, the ricedistribution compensatory mechanism should be phased out.

- -15
Urban Rural TotalNumber of beneficiary HHs (in '000) 1/ 7500 7500 15000
Additional Market Cost to Differencequantity value 3/ beneficiary (per year) Urban Rural Total
1 kg 2500 1000 18000 135 135 270
Impact on rural poorConsumption per HH (in liters / month) 5.0Impact per year on rural HH 4/ 22.3Compensation provided by Bulog (1 kg) 4/ 135.0Excess compensation 4/ 112.7
Impact on urban poorConsumption per HH (in liters / month) 10.0Impact per year on urban HH 4/ 44.6Compensation provided by Bulog (1 kg) 4/ 135.0Excess compensation 4/ 90.5
Total impactTotal compensation provided by Bulog 4/ 270.0Total excess compensation 4/ 203.2
Sources: Data provided by the authorities; and Fund staff estimates.
1/ The size of the average household is assumed to be five persons.2/ In billions of Rps per year.3/ The additional transport costs for rice from the market and subsidized rice are assumed equal.4/ In billions of Rps per year.
Marginal value of transfer 2/
Table 5. Indonesia: Rice Compensation Through BULOG Analysis of transfer induced by an additional kg of rice

- -16
IV. IMPACT OF OIL PRICE INCREASES ON URBAN TRANSPORT AND FERRIES
The case of compensating for price increases for urban transport users (because of theincrease in diesel oil (solar) prices) illustrates the difficulties that the center faces in imposinga uniform set of policies in a large and diverse country with very different local conditionsand varying incentives faced by the local authorities. The main problem is that although thelocal authorities are directly involved in the price setting for transport, they have noparticular incentives in setting prices which would reflect the wishes of the centralgovernment. In addition, beneficiaries of subsidized buses are mainly concentrated in Jakarta,with commuters in other parts of the country largely using market-based transport. Thisillustrates a constraint relating to decentralization, the divergence that can exist betweenlocal government objectives.
In this section, we focus on buses. Subsidized fuel is also used in inter-island ferries, and isbriefly discussed at the end of the section.
A. Background
The composition of the bus system in Indonesia is described in Table 6.
Buses can be divided into two broad categories: large buses able to carry from 25 to 50passengers; and the so-called small “Angkots” carrying about 10 to 13 passengers. The
Table 6. Indonesia: General Information on the Urban Bus Fleet
TotalLocation Large Medium Small bus MPU Size
Jakarta 2489 3651 4935 5015 16090Java 1089 27 30807 55708 87631Sumatra 73 1400 1835 11300 14608Other 89 133 4931 28470 33623
Total 3740 5211 42508 100493 151952
Memorandum itemsAverage ticket price 2000-300 800 700-500 700-500Capacity (passengers per bus) 50 24 13 10Subsidy on import tariff 1/ XX XX -- --
Subsidy on gasoline 2/ XX XX X XAdministered ticket price 3/ X XX
----
Fuel use ('000 liters/year/vehicle) 24.5 13.6 4.8 4.8
Sources: Data provided by the Inodnesian authorities; and the World Bank and Fund staff estimates.
1/ XX indicates subsidy on imports of parts and material. "--" indicates locally produced material.2/ Buses operate with subsidized gasoil. Some angkots operate with less subsidized motoroil (X).3/ There are some price restrictions for deluxe buses. Angkots mostly operate without restrictions.
Bus Angkot

- -17
Angkots represent over 90 percent of the total fleet at the national level, and essentiallyoperate under market conditions. Large buses, although representing a small part of the fleetin the country, account for more than 50 percent of the seats in Jakarta. The proportion ofsubsidized buses in Jakarta (and some other large cities) is markedly higher than elsewhere,mostly because the operation of “Angkots” has been limited to reduce traffic congestion andalso for pollution concerns. It is estimated that over half of the population of Jakarta travelsat the heavily subsidized rates against about 5 percent in the rest of the country (see Table7).
Most large buses operate under an administered price well below operating costs. They alsobenefit from tax breaks for the import of spare parts, an interest subsidy for loans, and thesubsidy on fuel. Despite these concessions, buses largely continue to operate at a loss. Thesituation is better for a portion of these buses (so-called AC/deluxe) which are profitable asthey operate under a higher administered price that is only loosely enforced.
All “angkots” are privately owned and operated, as are about 90 percent of the larger buses.The remaining 10 percent of large buses are publicly owned.
A critical feature is that the constraints on buses are not imposed by the same level ofgovernment: administered prices are fixed by the local governments (albeit after consultationwith the center), as are quotas on the number and types of vehicles that can operate in a givenarea. On the other hand, the center grants tax breaks and subsidies. Thus, one difficulty facedby the center is that the variable through which the poor are affected (bus fares) is largelyoutside its control. This will affect the nature and efficiency of the possible compensatorymeasures.
An assessment of the fuel-consumption patterns reveals that large buses are likely to beinefficient: they consume much more per passenger-mile than the “Angkots”, and this maybe one of the main reasons that they have found it difficult to operate at the current level of
Location / passengers Large Medium Small bus MPU TotalNon-JakartaNumber of passengers 62550 37440 488449 954780 1543219In percent of total 4.1 2.4 31.7 61.9 100.0Percentage at subsidized rate 1/ 2.7 2.4 0.0 0.0 5.1
JakartaNumber of passengers 124450 87624 64155 50150 326379In percent of total 38.1 26.8 19.7 15.4 100.0Percentage at subsidized rate 1/ 25.2 26.8 0.0 0.0 52.0
Sources: Data compiled from World Bank Report (1999) and Fund staff estimates.
1/ Assuming that 1/3 of large buses are A/C deluxe buses operating under market conditions.
Table 7. Indonesia: Estimate of Subsidized Bus Travel
Bus Angkot

- -18
administered prices. Their quality has deteriorated to the point where “Angkots” providebetter service. Hence, large buses can only survive if they improve service, such as bybecoming “A/C deluxe”, which then allows them to charge a higher price and cover theircosts, or by trying to obtain more subsidies from the government. In order to survive, buscompanies appear to use two main mechanisms (beyond not maintaining the assets): theyreduce further the cost of fuel by mixing diesel with highly subsidized kerosene, 4 which hasa damaging impact on the environment; and they occasionally charge higher ticket pricesthan the official limit (this is officially sanctioned at various time, such as the Eid-celebrations).
Clearly, bus companies operate under a large number of constraints. While it would appearpolitically impossible to lift all constraints simultaneously, the authorities should carefullyweigh the advantages of protecting the bus sector indefinitely. This would generate intra-sectoral distortions, especially for the market-based “Angkots,” which would be penalized.
A subsidy to bus companies
One possible option to mitigate the impact of the oil price increase is through a targetedsubsidy to bus companies which would allow them to maintain prices at their current level.This option is complicated by the pressing need for a ticket price rise originating from thecurrent difficult financial situation of bus companies and the need to rebuild deterioratingassets. It is likely that bus companies would take the opportunity of the oil price increase todemand an increase of ticket prices by more than the amount necessary to cover thedifference in oil prices. In fact, the ticket price is controlled by local governments, whoseinterests may coincide more closely with those of large bus company owners than the dictatesof the central government.
B. Incentive compatibility issues
As already mentioned, the problem of subsidized large buses mainly occurs in Jakarta and afew other large cities. In the rest of the country, privately run “Angkot” operate in marketconditions and carry most of the passengers. The chances are that if large buses resort to aprice increase needed to recapitalize their assets, the demand for their services will drop if theAngkot alternative is available. This reflects the cost-disadvantage of the large busescompared to the “Angkots”. Hence, the larger buses operating at the fixed prices wouldgradually disappear from the market, as already observed in areas outside Jakarta.
This is a typical example of diverging interests between the center and local governments.The natural reaction in local areas, where subsidized buses operate, would be to take theopportunity to adjust bus fares to a level compatible with higher solar prices, and toaccommodate needed capital stock rehabilitation (while blaming the center for the full fareincrease). As the decision on fares is in the hands of the local authorities, it is not clear how 4 This may be carried out by bus-drivers, who often pay a predetermined rent to bus-owners,and have little concern for the long-term viability of the buses.

- -19
the center in a decentralized world (as opposed to the past, when it could order compliance)can design a subsidy program that would induce local authorities to limit the increase in faresto levels deemed appropriate by the center.
This discussion also illustrates the divergence in interests across local authorities, making iteven more difficult for the center to devise general incentives for a nation-wide policy. Therehave been a number of instances in the past, where subsidized buses from large cities havetried to service areas where market-based transport accounts for most of the bus traffic.These incursions have met with very stiff resistance from local “Angkot” owners, supportedby the local government, and intruding buses have on occasion been set alight.
Yet, the case of Jakarta is very important and deserves attention. Although some “Angkots”are permitted, buses still carry the bulk of the “vocal lower-middle” class and the poor. Thiscertainly explains the continued existence of low tariff.
Thus, a first possibility would be to allow more “Angkots” to operate. The environmentalconsideration is not really valid as buses pollute a lot through the use of kerosene. However,there may be increased congestion, and the option is not considered viable by sectoralexperts.
C. Compensation Proposals
The lack of suitable alternative instruments that could be used by the center to compensatethe poor implies that an important component of the scheme that will be adopted must be themagnitude of the administrative and monitoring costs. We first describe the characteristics ofa possible compensatory mechanism, in this case based on a coupon system, and then assessits costs.
The compensatory mechanism could have the following characteristics:
• Large bus companies would be subsidized for the oil price increases, and fares frozen foran initial period of six months or so;
• Additional price adjustments to cover the restructuring of the bus companies would onlytake place after this period so as to distinguish between centrally determined policychanges and the restructuring of the sector; and
• There would be no compensation to owners of Angkots for price increases, and market-based transport would fully reflect the energy price changes.5
The central government could issue strict instructions to local governments not to allow for aticket price increase beyond the oil price increase. While we have already mentioned that this
5 Note that most Angkots use petroleum rather than diesel, and the petroleum prices are notsubsidized as much as diesel.

- -20
may be extremely hard to achieve. If local authorities use the opportunity to increase pricesbeyond that level, the central policy related safety net could be completely offset.
Coupons for bus owners
The Government of Indonesia would make coupons available to the local governments, andsimultaneously transfer the monetary equivalent to the local finance bureaus. The road trafficauthority at the local level will provide bus companies with the requisite number of coupons.The criteria used for redeeming coupons would depend on the number and type of busesoperated by the company as well as the routes covered.
These coupons would be used at the gas station (SPBU) in part or full-exchange for diesel oil(solar). The transaction may or may not require an additional cash payment by the buscompany or its agent (the bus driver). The gas station manager will redeem the couponsthrough banks, and received the face value of the coupon. In order to avoid difficulties withthe banking system, the government would need to ensure that the money is indeed depositedin the banks at the same time as the coupons are made available (see Chart 1).
Beyond the danger that prices are raised irrespective of the subsidy, the main difficultiesassociated with this type of coupon system will be to ensure that there is no pirating ofcoupons, and that the fee demanded by local banks to handle the scheme is not excessive.The first concern is standard in this kind of scheme and requires security paper for coupons.The second difficulty could be overcome by ensuring that money is indeed deposited inbanks by the authorities in time.
Cost and administration of the coupons
We now turn to the amount required to compensate the urban poor for the impact of theproposed increase in diesel oil prices on bus fares. We consider that it is neither feasible nordesirable to compensate transport operators working under “market” conditions (the“Angkots” and the large A/C buses). As an illustration (refer to Table 7), we assume that theaim is to compensate the three poorest deciles of the total urban population of 70 millionpeople (of which 15 million live in Jakarta and 55 million in other cities).
Consider first the 15.5 million urban poor outside Jakarta. Table 7 shows that only 5 percentof the traffic by bus in urban areas outside Jakarta is subsidized. However, as these decilesare more likely to rely on subsidized transportation than others, we shall consider thattwo million users are affected. This is a very conservative assumption, however, since fivepercent of the whole urban population outside Jakarta amounts to 2.75 million people.
In Jakarta, the limits imposed on the use of “Angkots” explain the relative success of buses.The three poorest deciles of the population account for 4.5 million people and we assume thathalf of them (as per Table 7) benefit from subsidized fares, i.e., roughly three million systemusers. This is on the high side as citizens of Jakarta are richer than in rural and other urban
- -21
areas. In fact, many of the three lowest deciles in Jakarta should be able to afford the moreefficient “angkots” at market prices.
We have assumed that the average urban household undertakes 150 trips per month (50 tripsfor one worker and 100 trips for other household members). If the full impact of the priceincrease of diesel is reflected in the bus fare (this is estimated at Rp 40 per ticket and we haverounded it up to Rp 50, since there is no Rp 40 coin), monthly expenditure on bus tickets willincrease by Rp 7500 per household. Assuming that there are five persons per household,about 1 million households would need to be compensated for a total of Rp 7.5 billion permonth, or Rp 90 billion on an annual basis.
These numbers are reflected in Table 8 and suggest that an amount of no more than Rp 100billion to compensate bus operators through a coupon system would be appropriate. Webelieve that a coupon scheme directly provided to bus operators as described in Chart 1 ismuch simpler to administer than a coupon scheme to compensate the poor for a keroseneprice increase (Chart 2 and Table 4). Nevertheless, as discussed below, the coupon systemwill need to be properly designed and monitored. The associated cost implications arediscussed below.
Some of the key issues include the following:
• Distribution points for vouchers. Buses are mainly confined to urban areas and inter-urban routes. Therefore, the number of distribution points for the vouchers could be quitesmall. Indeed, the distribution of the vouchers could be handled by the Ministry ofTransportation from Jakarta through their regional offices. This would be relativelystraightforward if the number of bus companies is small and headquartered in Jakarta orother large cities.
• Management: The management is likely to be simple, and monitoring costs are limited toa few companies and their agents.
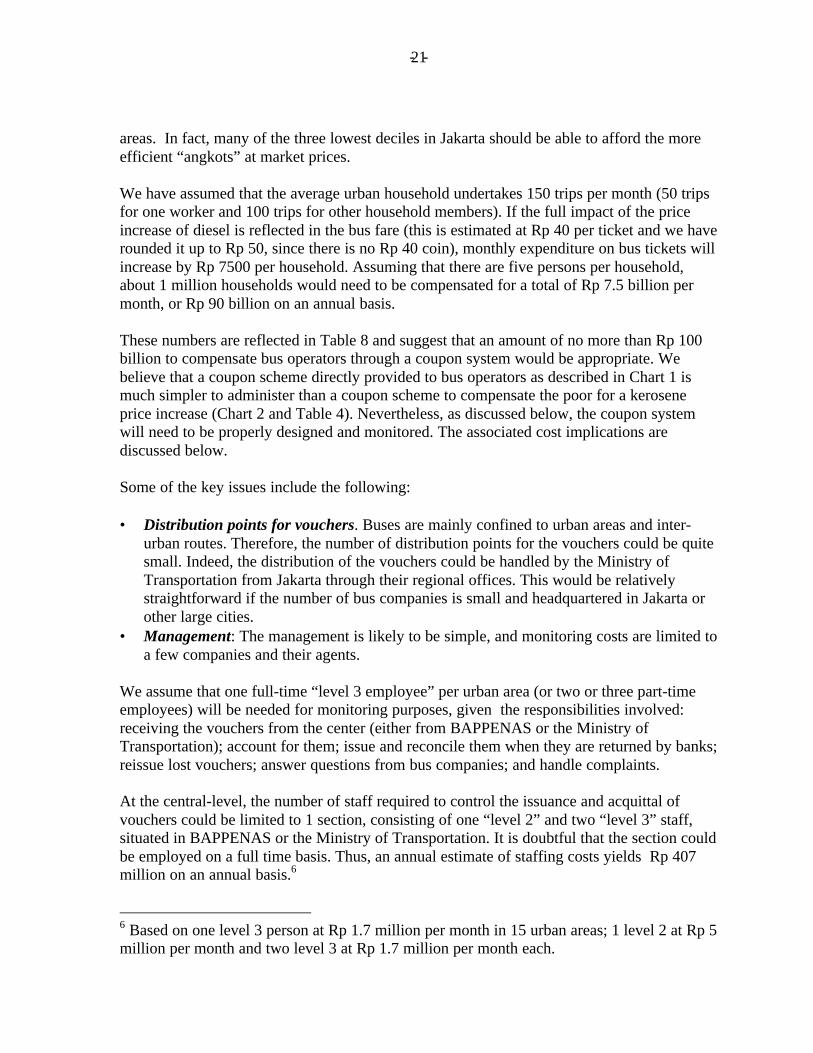
We assume that one full-time “level 3 employee” per urban area (or two or three part-timeemployees) will be needed for monitoring purposes, given the responsibilities involved:receiving the vouchers from the center (either from BAPPENAS or the Ministry ofTransportation); account for them; issue and reconcile them when they are returned by banks;reissue lost vouchers; answer questions from bus companies; and handle complaints.
At the central-level, the number of staff required to control the issuance and acquittal ofvouchers could be limited to 1 section, consisting of one “level 2” and two “level 3” staff,situated in BAPPENAS or the Ministry of Transportation. It is doubtful that the section couldbe employed on a full time basis. Thus, an annual estimate of staffing costs yields Rp 407million on an annual basis.6
6 Based on one level 3 person at Rp 1.7 million per month in 15 urban areas; 1 level 2 at Rp 5million per month and two level 3 at Rp 1.7 million per month each.
- -22
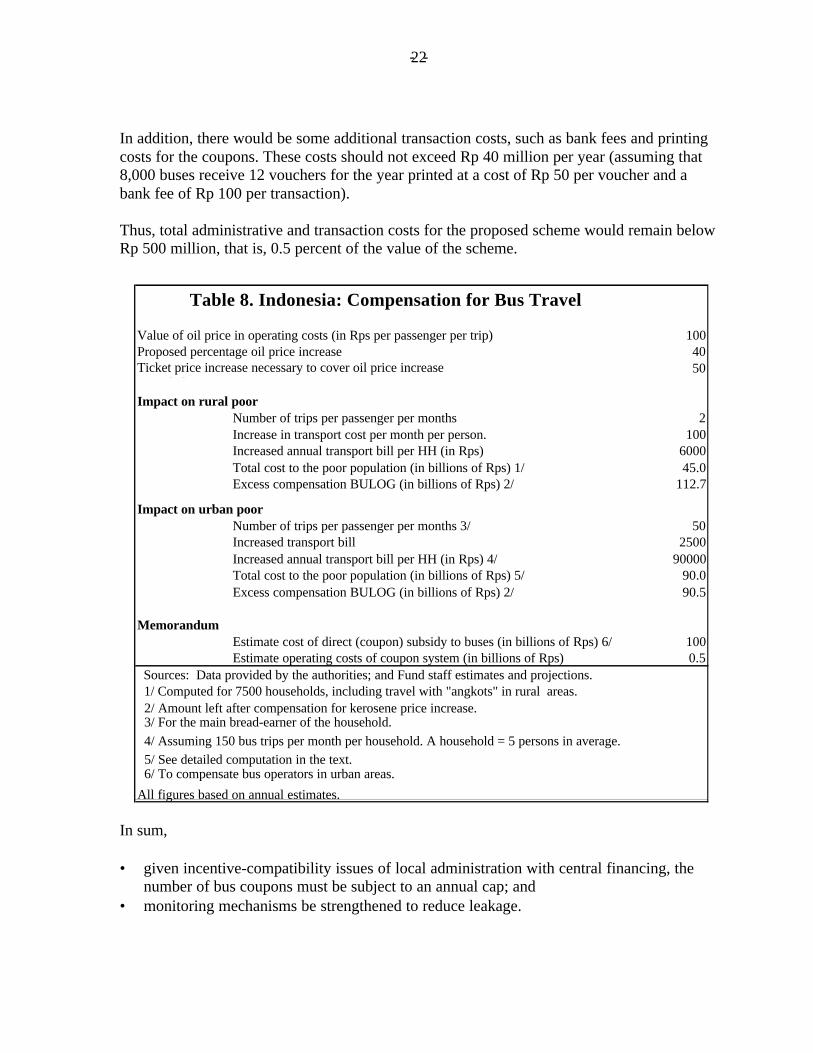
In addition, there would be some additional transaction costs, such as bank fees and printingcosts for the coupons. These costs should not exceed Rp 40 million per year (assuming that8,000 buses receive 12 vouchers for the year printed at a cost of Rp 50 per voucher and abank fee of Rp 100 per transaction).
Thus, total administrative and transaction costs for the proposed scheme would remain belowRp 500 million, that is, 0.5 percent of the value of the scheme.
In sum,
• given incentive-compatibility issues of local administration with central financing, thenumber of bus coupons must be subject to an annual cap; and
• monitoring mechanisms be strengthened to reduce leakage.
Value of oil price in operating costs (in Rps per passenger per trip) 100Proposed percentage oil price increase 40Ticket price increase necessary to cover oil price increase(rounded)
50
Impact on rural poorNumber of trips per passenger per months 2Increase in transport cost per month per person. 100Increased annual transport bill per HH (in Rps) 6000Total cost to the poor population (in billions of Rps) 1/ 45.0Excess compensation BULOG (in billions of Rps) 2/ 112.7
Impact on urban poorNumber of trips per passenger per months 3/ 50Increased transport bill 2500Increased annual transport bill per HH (in Rps) 4/ 90000Total cost to the poor population (in billions of Rps) 5/ 90.0Excess compensation BULOG (in billions of Rps) 2/ 90.5
MemorandumEstimate cost of direct (coupon) subsidy to buses (in billions of Rps) 6/ 100Estimate operating costs of coupon system (in billions of Rps) 0.5
Sources: Data provided by the authorities; and Fund staff estimates and projections. 1/ Computed for 7500 households, including travel with "angkots" in rural areas. 2/ Amount left after compensation for kerosene price increase. 3/ For the main bread-earner of the household.
4/ Assuming 150 bus trips per month per household. A household = 5 persons in average. 5/ See detailed computation in the text. 6/ To compensate bus operators in urban areas.
All figures based on annual estimates.
Table 8. Indonesia: Compensation for Bus Travel

- -23
However, precautions must be taken as reliance on the bus coupons is a risky strategy for thefollowing reasons:
• The price increase may nevertheless take place as discussed above;• It will not be easy to ensure that the coupon scheme associated with the subsidy will be
efficient, and may not prevent the deterioration in the quality of large bus-serviceswithout an additional subsidy;
• The subsidies for the large-buses would penalize the more efficient uncontrolled sector—the Angkots.
An additional measure: direct support
An additional measure, that might be considered in addition to the bus-coupon proposed bythe authorities, is to provide direct support to vulnerable users of urban transport services—principally students and teachers.
Under this proposal, the students and teachers would be able to purchase subsidized farecards on the production of their identity cards. The fare cards would be used, along with theidentity cards for travel on the buses. The transport owners would redeem these fare cards atthe local government sanctioned fare levels, similar to those paid by the general public.
When a similar scheme was tried in the past, the bus companies were forced to redeem thestudent fare-cards at the lower price, thereby carrying the cost of subsidizing the students.Thus, students were turned away from buses, leading to considerable unrest. This difficultycould be avoided if the student fare cards are redeemed at the standard price for tickets.
The ferries
While inter-island traffic is an important aspect of the transport sector in Indonesia, dieselonly accounts for a small part of the total operating cost, and ferry companies are wellidentified. Thus, a direct subsidy appears to present few possible drawbacks and could beimplemented at low cost. A system of coupons could be extended at relatively low cost to theferry companies, to absorb any increase in the costs of inter-island ferry travel at this time.
V. CONCLUDING REMARKS AND POLICY ISSUES
In this note, we have tried to focus on the constraints on central government policy objectivesas the decentralization process begins to take effect. The debate in Indonesia aboutcompensating for energy price changes provides an interesting illustration of the issuesinvolved.
Given that the energy prices are centrally determined, and it is the center that also determinesthe target groups for compensation, there would appear to be little justification for requiringlocal co-financing (either in terms of defraying administrative costs, or the benefits

- -24
provided). To ensure effective governance, it is thus critical that the design of thecompensation mechanism takes account of diverging interests and includes adequateincentives for local governments. There is a risk that in compensating for kerosene priceincreases, “liquid” compensation in terms of cash or coupons could be subject to “localcapture” or at best mistargeting. The effectiveness of targeting is enhanced by coupons, butthe additional administrative requirements could be daunting in a large and diverse countrysuch as Indonesia—with relatively weak audit and monitoring infrastructure. Thus, measuresthat build on existing infrastructure, and which have “self-targeting” characteristics, such aslow quality rice, may be preferable to setting up an elaborate administration for a short-termshock.
The bus fares case illustrates that the interests of different local governments may vary quitemarkedly, and the application of a uniform policy throughout the country may beinappropriate or difficult to implement. A coupon system for buses would work since ahandful of beneficiaries would be involved. Moreover, the benefits would be concentratedlargely in Jakarta. Note, however, that once a mechanism, such as the coupon system, is putin place, it will become entrenched and difficult to remove.
A key lesson is that when possible new institutions should not be created to compensate fortransient shocks. The use of the rice mechanism using the Bulog distribution is attractive inthis context, since it is the intention of the authorities to reform the Bulog procurement anddistribution system in the short to medium term. Indeed, as rice prices are reduced (with thereduction of rice tariffs), there will be no need for a continuation of support through the ricemechanism administered by Bulog.
A second lesson is that it is not necessary to link a particular compensation measure (such asthe subsidized rice) to a specific shock. To do otherwise would lead to a proliferation ofmeasures with an opaque overall impact and would also complicate the task of ensuring goodgovernance. In general, the magnitude of the impact of a shock on the poor needs to beassessed, and then the compensation determined in relation to available instruments.

- -25
VI. BIBLIOGRAPHY
Dick, H., (1980), “The Oil Price Subsidy, Deforestation and Equity”, Bulletin of IndonesianEconomic Studies, Vol XVI, No.3.
Gupta, S., (2000), “Social Issues in IMF-supported Programs”, IMF Occasional Paper 191,Washington DC.
Ministry of Finance of the Government of Indonesia, (1999), “Efficiency Audit of Bullog(Badan Urusan Logistik)”, Jakarta, Indonesia.
Tabor, S., and H. Sawit, “The OPK Program: Economy-wide Impacts,” EconomicManagement Services International, September 1999, for the Ministry of Food andHorticulture, Jakarta.
Ter-Minassian, T., eds, (1997), Fiscal Federalism in Theory and Practice, InternationalMonetary Fund, Washington DC.
World Bank (1990), World Development Report, Poverty, Washington DC.
- -26
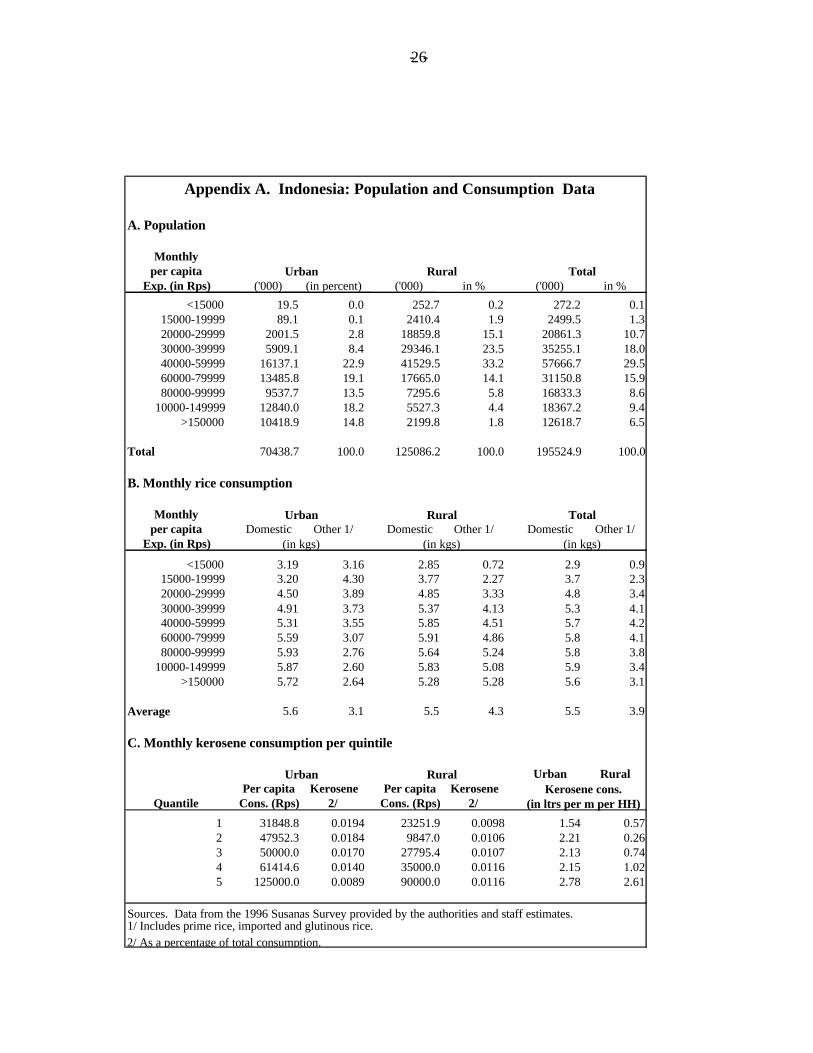
A. Population
Monthlyper capita
Exp. (in Rps) ('000) (in percent) ('000) in % ('000) in %
<15000 19.5 0.0 252.7 0.2 272.2 0.115000-19999 89.1 0.1 2410.4 1.9 2499.5 1.320000-29999 2001.5 2.8 18859.8 15.1 20861.3 10.730000-39999 5909.1 8.4 29346.1 23.5 35255.1 18.040000-59999 16137.1 22.9 41529.5 33.2 57666.7 29.560000-79999 13485.8 19.1 17665.0 14.1 31150.8 15.980000-99999 9537.7 13.5 7295.6 5.8 16833.3 8.6
10000-149999 12840.0 18.2 5527.3 4.4 18367.2 9.4>150000 10418.9 14.8 2199.8 1.8 12618.7 6.5
Total 70438.7 100.0 125086.2 100.0 195524.9 100.0
B. Monthly rice consumption
Monthlyper capita Domestic Other 1/ Domestic Other 1/ Domestic Other 1/
Exp. (in Rps)
<15000 3.19 3.16 2.85 0.72 2.9 0.915000-19999 3.20 4.30 3.77 2.27 3.7 2.320000-29999 4.50 3.89 4.85 3.33 4.8 3.430000-39999 4.91 3.73 5.37 4.13 5.3 4.140000-59999 5.31 3.55 5.85 4.51 5.7 4.260000-79999 5.59 3.07 5.91 4.86 5.8 4.180000-99999 5.93 2.76 5.64 5.24 5.8 3.8
10000-149999 5.87 2.60 5.83 5.08 5.9 3.4>150000 5.72 2.64 5.28 5.28 5.6 3.1
Average 5.6 3.1 5.5 4.3 5.5 3.9
C. Monthly kerosene consumption per quintile
Urban RuralPer capita Kerosene Per capita Kerosene
Quantile Cons. (Rps) 2/ Cons. (Rps) 2/
1 31848.8 0.0194 23251.9 0.0098 1.54 0.572 47952.3 0.0184 9847.0 0.0106 2.21 0.263 50000.0 0.0170 27795.4 0.0107 2.13 0.744 61414.6 0.0140 35000.0 0.0116 2.15 1.025 125000.0 0.0089 90000.0 0.0116 2.78 2.61
Sources. Data from the 1996 Susanas Survey provided by the authorities and staff estimates.1/ Includes prime rice, imported and glutinous rice.2/ As a percentage of total consumption.
Appendix A. Indonesia: Population and Consumption Data
Kerosene cons.(in ltrs per m per HH)
Urban Rural
Urban Rural Total
(in kgs) (in kgs) (in kgs)
Urban Rural Total

- -27
Chart 1. Indonesia: Bus Coupon System
CouponsMoneySolar oil (diesel)
Central Government(BAPPENAS / MOF)
District level govts.(PEMDA)
District office(Biro Keuangan )
Road traffic auth.(DLLAJR)
Oil supply(PERTAMINA)
BANK
Gas station(SPBU)
Bus company(Perusahaan Angkutan )
Sources: Indonesian authorities interdepartmental task force.

- -28
Chart 2. Indonesia: Kerosene Coupon System
CouponsMoneyKerosene
Central Government(BAPPENAS / MOF)
District level govts .(PEMDA)
District office(Biro Keuangan )
Village head(LURAH)
Oil supply(PERTAMINA)
BANK
Retailer(Pangkalan )
People(Masyarakat )
Neighborhoods(RT/RW)
Wholesaler(Agen)
Control
Sources: Indonesian authorities interdepartmental task force.