
Individualized Coaching to Improve Teacher Practice … (Garet et al., 2008; Garet et al., 2011, Van...
48
This work was supported by funding from New Schools for New Orleans. We thank Michael Goldstein and the members of the MATCH Teacher Coaching staff, Erica Winston, Katherine Myers, Max Tuefferd, and Orin Gutlerner, for their support. We also acknowledge the valuable guidance Martin West and Richard Murnane provided throughout this study. Individualized Coaching to Improve Teacher Practice Across Grades and Subjects: New Experimental Evidence Matthew A. Kraft Brown University David Blazar Harvard Graduate School of Education Abstract This paper analyzes a coaching model focused on classroom management skills and instructional practices across grade levels and subject areas. We describe the design and implementation of MATCH Teacher Coaching among an initial cohort of fifty-nine teachers working in New Orleans charter schools. We evaluate the effect of the program on teachers’ instructional practices using a block randomized trial and find that coached teachers scored 0.59 standard deviations higher on an index of effective teaching practices comprised of observation scores, principal evaluations, and student surveys. We discuss implementation challenges and make recommendations for researcher-practitioner partnerships to address key remaining questions. Suggested Citation: Kraft, M.A. & Blazar, D. (2017). Individualized coaching to improve teacher practice across grades and subjects: New experimental evidence. Educational Policy, 31(7), 1033-1068. Link to Publisher’s Version: http://journals.sagepub.com/doi/abs/10.1177/0895904816631099?journalCode=epxa
Transcript of Individualized Coaching to Improve Teacher Practice … (Garet et al., 2008; Garet et al., 2011, Van...
This work was supported by funding from New Schools for New Orleans. We thank Michael Goldstein and the members of the MATCH Teacher Coaching staff, Erica Winston, Katherine Myers, Max Tuefferd, and Orin Gutlerner, for their support. We also acknowledge the valuable guidance Martin West and Richard Murnane provided throughout this study.
Individualized Coaching to Improve Teacher Practice Across Grades and Subjects: New Experimental Evidence
Matthew A. Kraft Brown University
David Blazar
Harvard Graduate School of Education Abstract
This paper analyzes a coaching model focused on classroom management skills and instructional practices across grade levels and subject areas. We describe the design and implementation of MATCH Teacher Coaching among an initial cohort of fifty-nine teachers working in New Orleans charter schools. We evaluate the effect of the program on teachers’ instructional practices using a block randomized trial and find that coached teachers scored 0.59 standard deviations higher on an index of effective teaching practices comprised of observation scores, principal evaluations, and student surveys. We discuss implementation challenges and make recommendations for researcher-practitioner partnerships to address key remaining questions.
Suggested Citation: Kraft, M.A. & Blazar, D. (2017). Individualized coaching to improve teacher practice across grades and subjects: New experimental evidence. Educational Policy, 31(7), 1033-1068. Link to Publisher’s Version: http://journals.sagepub.com/doi/abs/10.1177/0895904816631099?journalCode=epxa

1 INDIVIDUALIZED COACHING TO IMPROVE TEACHER PRACTICE
Individualized Coaching to Improve Teacher Practice Across Grades and Subjects:
New Experimental Evidence
For over a century, school systems in the U.S. have attempted to improve instructional
quality by investing in “on-the-job” teacher training. Today, 99% of public school teachers
report participating in some form of professional development (Goldring, Gray, Bitterman &
Broughman, 2013), with states and districts spending between $2,000 and $8,000 annually per
teacher (Killeen, Monk, & Plecki, 2002; Miles, Odden, Fermanich, Archibald, & Gallagher,
2004; Picus & Odden, 2011). At the same time, research on professional development (PD)
indicates that program quality is highly variable (Yoon, Duncan, Lee, Scarloss, & Shapley,
2007), with teachers themselves reporting mixed experiences (Farkas, Johnson, & Duffet, 2003).
Impact evaluations also show that many PD programs fail to produce systematic improvements
in teacher knowledge, behaviors, or effectiveness when implemented at-scale (Jacob & Lefgren,
2004; Glazerman et al., 2008; Yoon, et al., 2007). These findings are particularly troubling given
the need to provide effective PD for teachers as districts adopt new teacher evaluation systems
and the Common Core State Standards.
A growing number of districts and scholars have identified teacher coaching (Fletcher &
Mullen, 2012) as an alternative to the short-term and generalized workshops that have
characterized most PD programs (Darling-Hammond et al., 2009; Hill, 2007). Coaching
programs commonly share several “critical features” including job-embedded practice, intense
and sustained durations, and active-learning (Desimone, 2009). Experimental and quasi-
experimental analyses of several coaching programs for kindergarten and early-elementary
literacy and reading teachers have found that coached teachers became more effective instructors
and that their students’ academic achievement increased on standardized tests (Biancarosa, Bryk,

2 INDIVIDUALIZED COACHING TO IMPROVE TEACHER PRACTICE
& Dexter, 2010; Marsh et al., 2008; Matsumura, Garnier, & Resnick, 2010; Neuman &
Cunningham, 2009; Sailors & Price, 2010). At the same time, other training programs that
incorporate coaching have not resulted in major changes in teacher practice or student
achievement (Garet et al., 2008; Garet et al., 2011, Van Keer & Verhaeghe, 2005)
To date, few coaching programs have been developed to support the majority of teachers
who teach subjects and grades other than early elementary literacy. One exception is the My
Teaching Partner web-based coaching program, which focuses on improving the social,
emotional, and instructional climates within an array of classrooms. In their experimental
evaluation, Allen, Pianta, Gregory, Mikami and Lun (2011) found that bi-monthly coaching
conversations over the course of an academic year increased achievement among secondary
students by one fifth of a standard deviation in the year following the coaching intervention.
We contribute to the literature on teacher coaching by describing the design and
implementation of MATCH Teacher Coaching (MTC), a coaching model focused on improving
behavior management and instructional techniques across grades and subjects. We also present
evidence of the causal effect of MTC on teachers’ practices from the first cohort of teachers who
participated a multi-cohort experimental study. In May of 2011, MTC recruited 59 early- to mid-
career teachers in the Recovery School District in New Orleans to participate in a randomized
trial of the year-long program. We then randomized teachers within schools to receive MTC
coaching, in addition to any professional development opportunities their school provided, or to
a status-quo control condition. MTC coaches worked with teachers to help them manage
classroom behavior more effectively, use instructional time more productively, and align
instruction to overarching curricular goals. After helping teachers identify areas for growth

3 INDIVIDUALIZED COACHING TO IMPROVE TEACHER PRACTICE
during a week-long summer workshop, coaches provided ongoing, individualized feedback
during four week-long coaching sessions throughout the year.
We utilize a rich set of qualitative and quantitative data to examine the implementation
and effectiveness of the MTC program. Coaching logs and weekly summary emails written by
teachers to coaches and school leaders allow us to describe the coaching model in detail and how
it varied across individual teachers and over the course of the academic year. We triangulate the
effect of coaching on teacher practices at the end of the coaching year and in the follow-up year
as captured by three primary measures: classroom observations, principal evaluations, and
student surveys. We also extend these analyses to explore whether coaching was equally
effective for teachers across grade levels and subjects.
Background
Empirical Evidence on Professional Development
Despite a broad theoretical literature highlighting a clear causal chain connecting PD,
teacher effectiveness, and student achievement (e.g., Desimone, 2009; Kennedy, 1998; Scher &
O’Reilly, 2009; Yoon et al., 2007), a review of the empirical evidence on PD programs reveals
mixed results. While some experimental and quasi-experimental studies find positive effects of
PD on teaching practices and student outcomes (Connor et al., 2011; Landry, Anthony, Swank,
& Monseque-Bailey, 2009; Penuel, Gallagher, & Moorthy, 2011; Powell & Diamond, 2011),
others find null or mixed results (Cabalo, Ma, & Jaciw, 2007; Garet et al., 2008; Garet et al.,
2011; Glazerman et al., 2008; Harris & Sass, 2011; Jacob & Lefgren, 2004; Santagata, Kersting,
Givven & Stigler, 2011). Experts also note a lack of rigorous evidence on implementation
fidelity and effects on proximal outcomes and intermediate mechanisms, such as individual
teacher behaviors (Desimone, 2009; Wayne, Yoon, Zhu, Cronen & Garet, 2008). Most

4 INDIVIDUALIZED COACHING TO IMPROVE TEACHER PRACTICE
importantly, there exists little evidence of PD programs impacting teacher practices and student
achievement when taken to scale and applied across diverse contexts.
In light of these findings, scholars have sought to identify specific conditions under
which PD programs might produce measurable improvements in teacher practice and student
achievement. These discussions have led to a growing consensus that compartmentalized training
sessions and school-wide workshops that characterize much of the PD provided to teachers are
less effective than PD that is intensive, focused on discrete skill sets, and applied in context
(Darling-Hammond et al., 2009; Garet et al., 2001; Hill, 2007; Wayne et al., 2008). Specifically,
quantitative evidence suggests that programs with longer durations are more likely to be
effective than shorter ones (Ramey et al., 2011; Yoon et al., 2007). Scholars also argue that
successful PD cannot be divorced from teachers’ own classroom contexts (Little, 2001). Instead,
PD must approach teacher learning as a dynamic, active process where teachers may engage
directly with student work, obtain direct feedback on their instruction, or review materials from
their own classrooms (Desimone, Porter, Garet, Yoon, Birman, 2002; Garet et al., 2001).
Teacher Coaching as a New Model
Many scholars and practitioners have responded to these findings by re-envisioning PD in
the form of teacher coaching. Coaching programs take a variety of forms, but most are centered
on an individualized feedback process in which instructional experts work with educators one-
on-one or in small groups to implement and improve specific aspects of teacher instruction
(Fletcher & Mullen, 2012). Coaching cycles typically consist of classroom observations followed
by targeted feedback about teachers’ practices and specific recommendations for improvement.
These cycles can occur frequently over the course of a full academic year or longer.

5 INDIVIDUALIZED COACHING TO IMPROVE TEACHER PRACTICE
Coaching has gained its widest appeal among early elementary literacy and reading
teachers through programs such as Reading First, the Literacy Collaborative, and Content-
Focused Coaching. These programs pair the “critical features” of coaching described above with
a deep content focus on literacy. Several experimental and quasi-experimental evaluations of
these coaching models document improvements in teachers’ literacy instruction and student
performance on reading assessments (Biancarosa et al., 2010; Marsh et al., 2008; Matsumura et
al., 2010; Neuman & Cunningham, 2009; Powell et al., 2010; Sailors & Price, 2010). However,
two studies on the effect of professional development for early literacy that included coaching as
one key component failed to find positive impacts that could be specifically attributed to
coaching (Garet et al., 2008; Van Keer & Verhaeghe, 2005).
The limited research on content-specific coaching in other subject areas is mixed. A
recent study found that two years of on-site coaching on mathematical content knowledge,
pedagogy, and curriculum by trained mathematics coaches increased student achievement on
standardized mathematics exams (Campbell & Malkus, 2011). A second study of a PD program
for middle school mathematics teachers that included 18 days of follow-up coaching over the
course of two years found no impacts on teacher knowledge or student achievement (Garet et al.,
2011).
We are aware of only one other coaching model that is designed to develop teachers’
non-content specific instructional practices. My Teaching Partner (MTP) (Allen et al., 2011) uses
coaches trained in the Classroom Assessment Scoring System to assess videotaped lessons of
teachers and facilitate conversations about the social, emotional, and instructional climates
within classrooms. Experimental evidence among secondary school educators indicates that
teachers randomly assigned to attend an initial workshop-based training and receive MTP web-

6 INDIVIDUALIZED COACHING TO IMPROVE TEACHER PRACTICE
based coaching twice a month raised student achievement by 0.22 standard deviations on state
standardized tests in the post-intervention year.
Directions for Current Research
Promising results from Allen et al. (2011) highlight the importance of studying additional
coaching models focused on a broad array of practices that are relevant to teachers across grades
and subjects. In particular, literature on effective teaching practices that draw on observations of
teachers and student surveys highlights the importance of classroom management and general
pedagogical practices (Kane & Staiger, 2012; Kane, Taylor, Tyler, & Wooten, 2010). School-
level implementation of a classroom and instructional management program also has been found
to support student achievement (Freiberg, Huzinec, & Templeton, 2009). While elements of
general pedagogical practices are commonly incorporated into PD programming (e.g., Lemov’s
[2010] Teach like a Champion and Canter’s [2010] Classroom Management for Academic
Success), the research literature has yet to explore the potential of teacher coaching to improve
these skills. Thus, we examine the question: What is the effect of an individualized coaching
model focused on classroom management and general pedagogical skills on teachers’
instructional practices?
The MATCH Teacher Coaching Model
We build on prior research by describing and presenting initial evidence on the effect of a
time-intensive, individualized coaching program focused on improving teachers’ classroom
management and general pedagogical practices. The Match Teacher Coaching model grew out of
the teacher training and professional development programming developed at MATCH Charter
Public Schools in Boston, MA. The model consists of three main components: a set of core
materials and resources, a 4-day summer training institute, and one-on-one coaching during the

7 INDIVIDUALIZED COACHING TO IMPROVE TEACHER PRACTICE
academic year. Below we describe the MTC model as it was first implemented in New Orleans
Charter schools during the 2011-2012 academic year.
MTC is centered around a set of instructional practices developed by a range of expert
practitioners and a mindset that focuses on growth and continual improvement. Core texts
assigned to teachers as part of the coaching program include books on specific pedagogical
practices and class management techniques by Doug Lemov (2010), Fred Jones (2007), and Lee
Canter (2006) as well as a set of original MTC booklets on classroom management, developing
relationships with students and parents, and executing effective lessons. In addition, teachers
read work by Carol Dweck (2006) on the powerful effects of adopting a growth mindset toward
professional development and students’ learning potential.
Participating teachers attend a four-day training workshop during the summer led by
MTC coaches. The training provides a total of 21 hours of content, with 8 hours set aside for
reading and reviewing assigned materials. Teachers are divided up into two different groups for
the entire training based on coaches’ assessments of their instruction from observations
conducted in the spring, principals’ survey responses, and teachers’ own self-assessments. One
group focuses primarily on developing classroom management techniques and building
relationships with students and parents, while the other group focuses on lesson planning and
execution. Each day coaches introduce new material, view and discuss example videos of
techniques with teachers, and give teacher opportunities to practice new skills. The goals of the
training are to develop an individualized coaching plan and to help teachers acquire a common
language around instruction and prepare to start the year with a clear set of classroom norms and
routines. Coaches and teachers work together to develop a coaching plan which identifies 3-5
instructional goals for the year and a set of specific action-steps to achieve these goals. Common

8 INDIVIDUALIZED COACHING TO IMPROVE TEACHER PRACTICE
goals for the academic year include improving behavior management, classroom climate, lesson
planning and execution, productive use of class time, and student engagement.
Coaches then work with individual teachers one-on-one throughout the course of
academic year to support teachers in achieving their goals. Coaches and teachers work together
during four week-long coaching sessions, which allow for repeated rapid cycles of observation,
feedback, implementation, and reassessment. Each day coaches observe teachers for at least half
the day and then meet with them during planning periods or after school to debrief. Teachers are
evaluated through formative assessments on the classroom observation rubric developed by the
coaching program. Coaches also help teachers to identify daily and weekly goals, assess the
extent to which teachers met these goals, and use these assessments to identify future growth
areas.
Debrief sessions are structured into five stages. Coaches begin by reviewing the goal and
main takeaway from the previous debriefing session. Takeaways consist of a specific aim,
prescriptions for techniques a teacher can use to meet this aim, and plans for preparing and
practicing to implement these techniques. Coaches then describe effective practices they
observed the teacher using and areas where the teacher has room for improvement. The coach
and teacher work to develop a new main takeaway and conclude with the questions and other
small suggestions a coach has that are not central to the main goal. At the end of each week-long
coaching session, teachers send an email to their coach and to their school principal outlining the
goals addressed that week, plans for implementing feedback from their coach, and goals for
future sessions. Between week-long coaching sessions, teachers communicate with coaches
about their progress via email or phone every one-to-two weeks.

9 INDIVIDUALIZED COACHING TO IMPROVE TEACHER PRACTICE
The MTC coaching program in New Orleans was delivered by three coaches in 2011-
2012, all former teachers in urban public schools with professional experience in education non-
profits, and charter school management organizations. Two coaches were female and one was
male. Coaches’ ages ranged from the late twenties to early forties. Two of the coaches held
master’s degrees in education. We provide data and further details about how MTC was
implemented in our findings section below.
Research Design
Sample
MTC coaches worked in partnership with New Schools for New Orleans to recruit
teachers employed at charter schools across the Recovery School District. The Recovery School
District is a statewide district in Louisiana formed in 2003 to transform underperforming schools,
the vast majority of which are in New Orleans. Teachers of all grade levels and subject areas
were eligible to participate. Recruitment efforts focused on early- and mid-career teachers, a
population known to require on-site support and assistance (Kaufman, Johnson, Kardos, Liu, &
Peske, 2002). Based on principal nominations and word-of-mouth, 91 teachers expressed some
level of initial interest in the program. Given capacity constraints, MTC staff chose to limit the
pool of teachers who would be eligible to receive coaching to those teachers who expressed high
levels of interest in the program, completed all required paperwork, and received permission
from their principal. This restriction resulted in a final sample of 59 teachers: 33 elementary
school teachers, 16 middle school teachers, and 10 high school teachers. Twenty-five teachers
taught all core subjects in self-contained classrooms, 21 taught in the humanities (English
Language Arts (ELA) or social studies), and 13 taught in STEM fields (science or mathematics).

10 INDIVIDUALIZED COACHING TO IMPROVE TEACHER PRACTICE
In Table 1, we present descriptive statistics for participating teachers and those not
selected for participation. Compared to the general population of public school teachers in the
United States, participating teachers were much more likely to have entered the profession
through alternative licensure programs (76% vs. 24%), such as Teach for America or
TeachNOLA, and to be African American (34% vs. 6%) (Goldring, Gray, Bitterman, &
Broughman, 2013). Over three-fourths of participating teachers attended an undergraduate
institution whose admissions process is rated as “Very Competitive” or higher by Barron’s
rankings. Including the coaching year, 27% of teachers were in their first or second year, 42%
were in their third or fourth year, and 31% were in their fifth year of teaching or higher.
Compared to those teachers not selected into the program, study participants had a higher level
of initial interest, by design, and were more likely to be white. However, participants were
similar to non-selected teachers in their gender, experience, and certification pathway. As we
discuss in our conclusion, the high level of interest among participating teachers may be critical
to the potential success of the coaching program.
Participating teachers taught across 20 different charter schools operated by 16 different
charter management organizations. These schools included seven elementary schools, eight K-8
schools, three middle schools, and three high schools. All schools in which coaches worked
served student populations that were over 90% African-American; in all but one, over 90% of
students were eligible for free- or reduced-price lunch. School rankings on a state “performance
index” ranged from 62 to 113 with an average of 82, slightly higher than the Recovery School
District average of 74, but notably lower than the state average of 99.
Experimental Design

11 INDIVIDUALIZED COACHING TO IMPROVE TEACHER PRACTICE
Among the 59 participating teachers in this first cohort, half were randomly selected to be
offered coaching using a block randomized design. Randomized control trials are the “gold
standard” for estimating causal effects and made sense in our context where the demand for
coaching exceeded MTC’s capacity to supply coaching to all interested teachers. We
randomized teachers within the schools they taught at during the 2010-11 school year. This
decision was necessary in order to recruit schools to participate by guarantying every principal
that half of the teachers they nominated would receive coaching. A simple randomized design
might have resulted in some schools having all their teachers randomized to the control group.
Implementing this study as a blocked randomized trial had both important advantages and
drawbacks. First, this design was a critical condition for recruitment. Second, it ensured that any
treatment effect would not be confounded by the dominant effect of teachers at one or two
schools should a majority of those teachers end up in the treatment or control condition due to
sampling idiosyncrasies. Third, assigning treatment at the teacher level, rather than at the school
level, greatly increases our statistical power. These advantages come at the cost of an inability to
fully leverage peer support networks among all participating teachers within a school, as well as
potential spillover effects between coached and control-group teachers in the same school
(Wayne et al., 2008). While spillover has the potential to downwardly bias estimates, research
suggests that spillover would have to reduce treatment effects by upwards of 60% before a
cluster randomized design produced greater statistical power than a block randomized design
(Rhoads, 2011).
Teachers in the control group did not receive any form of support from the MTC
program. Although staff development practices varied across the charter schools who
participated in this study, no schools provided formal coaching to teachers at the time. Informal

12 INDIVIDUALIZED COACHING TO IMPROVE TEACHER PRACTICE
discussions with participating teachers suggest that professional development activities were
very limited and generally ineffectual. Thus, the treatment-control contrast represents a
substantial departure from the informal and infrequent professional development activities that
were the status quo.
We examine a range of baseline measures to confirm the validity of our randomization
process by comparing the demographic characteristics of teachers assigned to treatment and
control groups. The results reported in Table 1 provide strong evidence that groups were
balanced on observable characteristics after randomization. Differences in mean values of
observable teacher characteristics across the treatment and control groups are small and
insignificant for each measure.
Data and Measures
Two sources of qualitative data allow us to assess fidelity of implementation and examine
the content and methods used during coaching sessions. First, we examined emails that teachers
sent to their coaches and school leaders outlining which classroom practices they worked on in a
given week. This activity was required of teachers as part of the coaching cycle. We also
analyzed coaching logs that coaches completed after each debriefing session. As above, this
process was required of coaches and monitored by the research team. In these logs, coaches
identified which tools from a list set at the beginning of coaching they used when working with
each teacher. This list included providing direct feedback to teachers, lesson planning, tweaking
classroom management plan, collecting data, watching a video of instruction, and reviewing
action steps. Coaches also could write in additional tools that were not included in this initial list.
Given our primary goal of investigating whether a generalized coaching program can be
effective across the full range of grades and subjects, we focus our analyses on measures of

13 INDIVIDUALIZED COACHING TO IMPROVE TEACHER PRACTICE
teachers’ instructional practices common across K-12 classrooms. These primary sources of data
include a classroom observation rubric developed by MATCH, a principal evaluation form based
on previous studies, and the TRIPOD student survey. In order to mitigate the likelihood of Type
I error due to multiple hypothesis testing (Schochet, 2008), we pre-selected a parsimonious set of
five measures from these data as our confirmatory outcomes. Following Anderson (2008) and
Kling, Liebman and Katz (2007), we also construct a summary index of these measures to guard
further against Type I error.
MATCH classroom observation rubric. The MATCH observational rubric version 1.0
was developed by leaders at MATCH Public Charter School to provide both formative and
evaluative feedback around instruction (see Appendix A for full instrument). The rubric is
comprised of two overall codes, Achievement of Lesson Aim and Behavioral Climate, each with a
set of key indicators. For Achievement of Lesson Aim, these include clarity and rigor of the aim,
alignment of learning activities with the lesson aim, and assessment and feedback. For
Behavioral Climate, indicators include time on task, transitions, and student responses to teacher
corrections. While viewing instruction, raters take notes on each of these indicators and the
extent to which they are present in a teacher’s instruction; in particular, raters provide examples
from the lesson. At the end of the lesson, raters score each of the two main codes holistically on
a scale of 1-10 based on these pieces of evidence. Score ranges are aligned to standards set by
MATCH for high-quality instruction: 1-3 = Below Expectations, 4-5 = Approaching
Expectations, 6-7 = Meets Expectations, 8-10 = Exceeds Expectations.
Coaches observed and rated teachers on the rubric in the spring semester prior to
randomization. In the following two spring semesters (i.e., at the end of the coaching year and in
the follow-up year), experienced outside observers who were blind to treatment status observed

14 INDIVIDUALIZED COACHING TO IMPROVE TEACHER PRACTICE
and rated a class taught by each teacher on two separate occasions (one rater at each occasion).1
After receiving training on how to use the instrument, raters achieved between 80% and 100%
one-off agreement rates with the director of MTC for both dimensions in each year. One-off
agreement rates also are used by Bell et al. (2012) in assessing reliability of the Classroom
Assessment Scoring System (CLASS), which has a similar scale to the MATCH rubric.
Another statistic often used for observation instruments is the intraclass correlation,
which describes the amount of variation in teacher-level scores that is attributable to the teacher,
as opposed to the rater(s) who observed the teacher or the specific lesson(s) observed. However,
in this context, we are less concerned with rater, or lesson, variance given that any variance in
scores not attributable to teachers will be balanced across treatment and control groups. This is
ensured by the fact that each rater observed all teachers and that raters typically observed all
teachers in a given school (both treatment and control) in the same week. We create teacher
scores for each code by averaging raw scores across our two raters and then standardizing
average scores to be mean zero and standard deviation one within each time period (i.e.,
baseline, spring, follow-up).
Principal survey. We utilize a principal survey in which we combine and slightly adapt
survey items developed by Jacob and Lefgren (2008) and Harris and Sass (2009). Both studies
provide evidence of the predictive validity of these items by documenting the correlation
between a composite survey measure and teacher value-added scores in math and reading (0.32
and 0.29 respectively for the former survey, and 0.28 and 0.22 for the latter). We asked school
administrators (e.g., principal, direct supervisor) who were most directly responsible for
1In an analysis of a range of other observational instruments, the Measure of Effective Teaching Project found that this scoring design, two observations of approximately 45 minutes with each done by a different observer, produced a reliability of 0.67 with school administrators as raters (Kane & Staiger, 2012).
15 INDIVIDUALIZED COACHING TO IMPROVE TEACHER PRACTICE
teachers’ supervision to complete the survey. These administrators rated teachers on a scale from
one (inadequate) to nine (exceptional) across 10 items: Overall Effectiveness, Dedication and
Work Ethic, Organization, Classroom Management, Time Management in Class, Time on Task
in Class, Relationships with Students, Communication with Parents, Collaboration with
Colleagues, and Relationships with Administrators. We also asked principals to rank teachers in
a given quintile of effectiveness compared to all the teachers at their school. Principals
completed this for each teacher in the spring prior to the coaching year and again the following
two springs after the experiment was concluded. We create a composite score of teachers’
overall effectiveness, Principal Evaluation Composite, by standardizing individual items within
each year, averaging scores across all 11 items above, and then re-standardizing this composite
score to be mean zero and standard deviation one within each time period. We estimate an
internal consistency reliability of 0.91 or greater in all three administrations.
It is important to note that it was not feasible to keep principals blind to teachers’
experimental condition. This could potentially bias principal evaluations scores if, for example,
principals were inclined to rate teachers who participated in coaching more favorably. Although
there appeared to be no incentive for principals to rate coached teachers more favorably given
that their ratings were for research purposes only and were not used in any formal teacher or
school evaluations, we cannot definitely rule out this potential threat.
TRIPOD student survey. The TRIPOD survey is comprised of items designed to
capture students’ opinions about their teacher’s instructional practices. Measures of teacher
effectiveness are categorized into seven domains or “C’s”: Care, Clarify, Control, Challenge,
Captivate, Confer, and Consolidate, each with an internal consistency reliability of 0.80 and
above (Kane & Staiger, 2011). Students in grade three and higher rated each item on a five-point

16 INDIVIDUALIZED COACHING TO IMPROVE TEACHER PRACTICE
Likert scale. A member of the research team administered the survey to early-elementary
students by reading survey items aloud in small groups and asking students to select among three
responses: no, maybe and yes. Students completed the survey once in the spring of the coaching
year, as well as in the follow-up year.
We focus our confirmatory analysis on two specific measures, Control and Challenge,
which ask students about the behavioral climate and the level of academic rigor in their class. In
addition to being best aligned to the coaching program, these two measures were found to have
the most predictive validity for teachers’ value-added scores with correlations of 0.22 and 0.14 in
math and reading, respectively (Kane & Staiger, 2011). Following the practices of the TRIPOD
project, we derive scores for each of the 7C’s by rescaling items so that they are consistent across
all forms, standardizing Likert-scale response options for each item, and calculating the mean
response across items. We then standardize teachers’ average score for each of the 7C’s to be
mean zero and standard deviation one within each time period. For illustrative purposes, we also
examine the proportion of students who agreed with a single item from the Consolidate domain,
“In this class, we learn a lot every day”.
Summary index. We create an index of Effective Teacher Practices by taking a weighted
average of the five measures described above – the two MATCH rubric items, the principal
survey composite, and the two TRIPOD composites – such that all three data sources are given
equal weight (i.e. 1/3 outside observer ratings, 1/3 principal evaluation scores, and 1/3 student
survey ratings). We then standardize the index to be mean zero and standard deviation one.
Data Analyses
Implementation analyses. In order to assess fidelity of implementation, we first coded
emails that teachers sent to their coaches and principals at the end of each week of coaching. To

17 INDIVIDUALIZED COACHING TO IMPROVE TEACHER PRACTICE
do so, we generated a list of all terms that teachers used to describe activities in which they
engaged as well as key focal areas. Then, we sorted these into broader categories that aligned
with the stated goals of the MTC program (e.g., behavior management, instructional delivery).
We found that teachers and coaches generally used a common language and set of terms in these
emails developed during the summer training sessions and reinforced by the training materials.
In order to ensure reliability, the same rater conducted all coding.
Next, we compiled data from coaching logs to describe the tools used during debriefing
sessions. Given that coaches generally chose from a list of tools, this process was relatively
straightforward. When coaches wrote in additional tools, we created a separate category for
these. Coaching logs also captured detailed records of the specific coach that each teacher
worked with during a given coaching session and the total number of weeks of coaching each
teacher received throughout the academic year.
Treatment effect analysis. We estimate the effect of MTC on our outcomes of interest
using Ordinary Least Squares (OLS) and multilevel regression. We analyze our teacher-level
measures including observation scores, principal ratings, and teacher self-evaluations by fitting
the following OLS model where Y represents a given outcome of interest measured at the end of
the coaching year for teacher j in school s at time t:
𝑌𝑌𝑗𝑗𝑗𝑗𝑗𝑗 = 𝑌𝑌𝑗𝑗,𝑗𝑗−1 + 𝛽𝛽𝑀𝑀𝑀𝑀𝑀𝑀𝑗𝑗 + 𝛼𝛼𝑗𝑗,𝑗𝑗−1 + 𝜀𝜀𝑗𝑗𝑗𝑗𝑗𝑗 (1)
For each of these teacher-level outcomes, we are able to include a baseline measure,
𝑌𝑌𝑗𝑗,𝑗𝑗−1, to increase the precision of our estimates. We include fixed effects for the schools where
teachers taught at the time of randomization, 𝛼𝛼𝑗𝑗,𝑗𝑗−1, to account for our block randomized design.
We omit random effects for the schools where teachers worked during the coaching and follow-
up years in all models because they are highly collinear with our blocking indicators since only

18 INDIVIDUALIZED COACHING TO IMPROVE TEACHER PRACTICE
three teachers switched schools between the time of randomization and the beginning of
coaching; nine teachers who participated in the follow-up analysis switched schools.2 However,
we cluster our standard errors at the school-level in the current year. For analyses that examine
outcomes measured in the follow-up year, we retain the same control for baseline measures and
blocking indicators captured prior to randomization. The subscripts on these covariates are thus
t–2. We extend these analyses by examining heterogeneity in program effects on instructional
practices across grade-levels, subject areas, and schools to shed light on whether the program
was equally effective across settings.
We analyze our student-level survey responses by fitting an analogous multilevel model
where students, i, are nested within classrooms, c, and teachers, j:
𝐴𝐴𝑖𝑖𝑗𝑗𝑖𝑖𝑗𝑗 = 𝛽𝛽𝑀𝑀𝑀𝑀𝑀𝑀𝑗𝑗 + 𝛼𝛼𝑗𝑗,𝑗𝑗−1 + (𝜈𝜈𝑗𝑗 + 𝜑𝜑𝑖𝑖 + 𝜖𝜖𝑖𝑖𝑗𝑗𝑖𝑖𝑗𝑗) (2)
We include blocking indicators, as above, and random effects for classrooms, 𝜑𝜑𝑖𝑖, and teachers,
𝜈𝜈𝑗𝑗, and cluster our standard errors at the school level in the current year.
In both models, the coefficient 𝛽𝛽 on the indictor for whether a teacher was randomly
offered the opportunity to participate in MTC is our parameter of interest. We interpret these
estimates as Average Treatment Effects given that every teacher offered coaching, except two
who withdrew prior to the 2011/12 school year, fully participated in the program. These two
teachers who were offered coaching do not have the necessary data to be included in our analysis
given that one left teaching and another switched schools and withdrew from the study.
Findings
Coaching Implementation, Content, and Techniques
2 Likelihood ratio tests comparing models with and without school random effects fail to reject the null hypothesis that these models are statistically significantly different (p=0.99).

19 INDIVIDUALIZED COACHING TO IMPROVE TEACHER PRACTICE
Overall, the MTC program was implemented with close fidelity to the original coaching
plan. Every teacher who participated in the coaching program received four or five total weeks of
coaching, with 24 teachers receiving the planned four weeks and four teachers receiving an extra
fifth week of coaching. Coaches reported that variation in the number of weeks of coaching that
teachers’ received was primarily due to coaches decisions about which teachers needed
additional support. Twenty-one teachers worked with the same coach throughout the academic
year, while seven worked with two coaches at least once due to scheduling difficulties when
making-up cancelled coaching sessions. Coaches estimated that the average contact with an
individual teacher was roughly 50 hours over the course of the school year, meeting program
goals.
We analyzed teachers’ emails and coaches’ logs to assess the content and techniques used
during coaching sessions. Five broad focus areas emerged from these data (see Appendix Table
A1 for examples of activities from each). For example, some teachers who focused on behavior
management worked on implementing a consequence/reward system or monitoring students by
moving throughout the classroom; some teachers who focused on instructional practices worked
on aligning activities to the overall lesson aim and on writing exit tickets to assess student
understanding of the lesson aim. In Figure 1 Panel A, we show the proportion of total week-long
coaching sessions in which each focus area was addressed, as well as the proportion of teachers
who ever worked on a particular focus area. Because teachers worked on multiple areas in a
given week, proportions do not sum to one. Over the course of the academic year, teachers
focused predominantly on behavior management and instruction, with 62% of all sessions
covering the former and 59% the latter. Ninety-three percent of teachers received coaching on
behavior management and instruction during at least one week-long coaching session.

20 INDIVIDUALIZED COACHING TO IMPROVE TEACHER PRACTICE
The degree to which teachers were coached in these two areas varied widely across
teachers, depending on their specific needs. As illustrated in Figure 1 Panel B, some teachers
never worked on behavior management or concentrated on it for only one week, while others
spent most, or even all, of their coaching sessions on management issues. Over the course of the
year, many teachers who began with classroom management issues shifted focus toward
instruction. In week one, 37% of sessions focused on management and 23% on instruction. By
week four, these percentages had largely reversed to 20% and 32%, respectively.
We also found that coaches used a variety of coaching techniques but relied heavily on a
few central practices. The most common practice was providing teachers with direct feedback
about what they could do better or differently in future lessons, something that occurred in 78%
of all coaching sessions. The second and third most common techniques were lesson planning
with teachers and reviewing digitally recorded lessons, used in 52% and 38% of all sessions.
Daily coaching cycles often incorporated these practices in combination where coaches would
review a recorded lesson with a teacher, give them direct feedback about the lesson, and then
work with them to plan ways to incorporate this feedback into their upcoming lessons.
The Effect of Coaching on Teachers’ Practices
Coaching year. Simple descriptive statistics of changes in teachers’ effectiveness over
time as judged by outside observers, principals, and the teachers themselves all illustrate greater
gains for teachers who received coaching compared to those randomly assigned to the control
group. On average, treatment-group teachers improved 1.26 and 1.47 scale points (on a 10-point
scale) more on the MATCH rubric domains, Achievement of the Lesson Aim and Behavioral
Climate, than control-group teachers at the end of the coaching year. Principals rated teachers
who received coaching as improving 0.31 scale points (on a nine-point scale) more than their

21 INDIVIDUALIZED COACHING TO IMPROVE TEACHER PRACTICE
control-group counterparts on the Principal Evaluation Composite. MTC teachers’ assessments
of their own effectiveness show average gains of 0.71 scale points (on a nine-point scale) on a
composite measure made up of the same items from the principal survey composite, while
control-group teachers rated themselves no differently from fall to spring.
Using our full regression framework which only compares treatment teachers to control-
group teachers in the same randomization block, we found that the MTC program improved
teachers’ effectiveness across a range of practices. As shown in Table 2, MTC teachers scored
0.59 sd higher than control group teachers (p=.024) on our Effective Teacher Practices index
consisting of observation scores, principal evaluations, and student surveys. As a relative
benchmark, this improvement is almost 50% larger than the average difference on the same
index between teachers in their first or second year and the more experienced teachers in our
sample (0.44 sd, p=.156), controlling for treatment status. Across individual instruments, our
estimates of the effect of MTC on teachers’ practices are consistently positive but imprecisely
estimated, with several estimates achieving only marginal significance at the 10% level. Trained
classroom observers rated coached teachers 0.58 sd (p=.079) and 0.66 sd (p=.049) higher on
Achievement of Lesson Aim and Behavioral Climate, respectively. Principals rated teachers who
received coaching 0.29 sd (p=.099) higher on the Principal Evaluation Composite. We interpret
this marginally significant result with additional caution given the potential bias in principals’
ratings.
These changes in coached teachers’ practices had mixed effects on the classroom
experiences of their students. Similar to outside observers and principals, students rated teachers
who received coaching as more effective at challenging them with rigorous work. Specifically,
coached teachers scored 0.31 sd (p=.007) higher on the Challenge domain of the TRIPOD survey

22 INDIVIDUALIZED COACHING TO IMPROVE TEACHER PRACTICE
than control group teachers. However, we found no statistically significant effects on the Control
domain, a measure of students’ perceptions of the teachers’ classroom management skills. We
illustrate the magnitude of these effects by estimating the impact of MTC as measured by a
single item. Students of the teachers who received coaching were eight percentage points
(p=.018) more likely to agree that “In this class, we learn a lot almost every day.”
Follow-up year. We also examined the effect of MTC on teachers’ effectiveness in the
year following the end of coaching to assess whether teachers continued to benefit from coaching
even though coaches no longer supported their instruction. It could be that coaching effects fade
out with time or that they increase as teachers are able to leverage their new skill sets starting on
the first day of class. In the follow-up year, we were able to re-recruit 33 of the 42 teachers in our
sample who returned as classroom teachers. The high rate of teacher turnover in our sample,
28.8%, is reflective of the 27% annual turnover rate among teachers across the Recovery School
District in the 2011/12 school year (Cowen Institute, 2012). All fourteen original randomization
blocks were represented in this follow-up sample, indicating that no single school or subset of
schools drove participation rates. Seven of these included at least one teacher from both the
treatment and control groups.
We found that despite this high attrition rate, there were no statistically significant
differences in observable characteristics between our full sample and those teachers who
remained in the study for a second year (See Appendix Table A2). We also show that
characteristics of the treatment group teachers who participated in the follow-up year were
similar to those of the 12 teachers in control group, on average. We do observe a marginally
significant difference among teachers’ initial interest. Given the high rates of attrition, we
interpret our post-coaching year estimates as suggestive rather than strong causal estimates.

23 INDIVIDUALIZED COACHING TO IMPROVE TEACHER PRACTICE
In Table 2 column 4, we present estimates of the effect of coaching on teachers’
classroom practices in the post-coaching year. Our estimate of the effect of coaching in the
follow-up year on our Effective Teacher Practices index (0.476 sd p=.364) is quite similar in
magnitude to the effect at the end of the coaching year, but is indistinguishable from zero in our
smaller sample. This finding is far from conclusive, but at least suggests that coached teachers
were able to sustain many of the improvements they had made even when they no longer
received the support of MTC coaches.
Heterogeneity in Treatment Effects on Teachers’ Practices
In addition to the average treatment effects presented above, we explored whether
coaching was equally effective across grade-level and subject taught. These analyses help to shed
light on the degree to which our estimates are generalizable across the grades and subjects
represented on our sample. We focused these analyses on outcomes measured in the coaching
year given our larger sample and the similarity in estimates between the coaching and follow-up
years. In Table 3, we report results from models where we have replaced our single treatment
indicator with sets of treatment indicators across subgroups of teachers. Our estimates of the
effects of MTC on the index of Effective Teacher Practices are uniformly positive and of
relatively similar magnitude across subgroups of teachers. We did find some suggestive evidence
that coaching may have been more effective for teachers in STEM fields; however, we lack the
statistical power to detect whether or not coefficients across subgroups are statistically
significantly different from each other. Overall, it does not appear that there were substantial
differences in the effect of MTC on teachers who teach different grade levels and subjects.
Our randomized block design also allowed us to explore variation in treatment effects
across schools, which has important implications for the generalizability of program effects

24 INDIVIDUALIZED COACHING TO IMPROVE TEACHER PRACTICE
across settings. We estimated school-level variance parameters by modifying models (1) and (2),
exchanging fixed effects for prior-year school blocks for random effects, and including an
interaction term between our treatment indicator and these prior-year school random effects
(Raudenbush & Liu, 2000). In Table 3, we report the standard deviation of the variance in
treatment effects as well as the p-value associated with a Likelihood Ratio test of the significance
of our prior-year school-by-treatment random effects.
Two interesting patterns emerge from this analysis. First, coaching effects on measures of
teacher practice that are more broad (i.e, our Effective Teacher Practices index and the Principal
Evaluation Composite) are relatively consistent across schools. Conversely, we observe
substantial variation in treatment effects for measures of teachers’ practices that are more
specific in nature (i.e., Achievement of the Lesson Aim, Behavioral Climate, Control,
Challenge).3 These findings make sense given the individualized nature of the coaching
program, where teachers received coaching in different areas depending on their specific needs.4
Threats to Validity
Attrition and Missing Data
We examined the robustness of our confirmatory analyses to sample attrition and
missing data in several ways and found that the character of our results was unchanged. During
the coaching year, seven teachers in our study did not have the necessary data to be included in
our analysis. Two of these were treatment teachers; one dropped from the study because she left
3 We conduct parallel analyses using a fixed effect framework and find that our results are consistent with these findings. In this approach, we maintain our prior-year school blocks as fixed effects and replace our generalized treatment indicator with school-specific treatment indicators. 4 We interpret our estimates of the variation in treatment effects for Achievement of the Lesson Aim and Behavioral Climate as indicative of true heterogeneity given that our failure to reject the null hypothesis is likely due to our limited statistical power for this test. Unlike statistical power for average treatment effects in block randomized trials, power for detecting variation in treatment effects are driven largely by the number of observations per school rather than the number of schools (Raudenbush & Liu, 2000; Konstantopoulos, 2008).

25 INDIVIDUALIZED COACHING TO IMPROVE TEACHER PRACTICE
the district and the teaching profession prior to the beginning of the school year, and the other
dropped because he switched schools and chose to withdraw from the study. Of the five control
teachers who were missing data, four left teaching and one decided not to participate in the study
or data collection. Between the coaching and follow-up year, an additional 19 teachers attritted
due to turnover out of New Orleans or out of teaching, or because they chose not to participate.
We first explored patterns of attrition by examining whether the relationship between the
probability of attritting and observed demographic characteristics differ across teachers in the
treatment and control groups. If less effective treatment-group teachers or more effective control-
group teachers were censored from the study, our results would be biased upwards. To explore
this potential source of bias, we regressed each demographic characteristic on an indicator for
attritting, an indicator for coached teachers, and their interaction. In Table 4, we report the
parameter estimates associated with these interaction terms, which test for differential attrition,
for both the coaching and the follow-up years. For the coaching year, we found no evidence of
differential attrition across any of the observed teacher characteristics, suggesting that those
teachers who were censored were not systematically different across the treatment and control
groups. For the follow-up year, we noted substantively different rates of attrition between the
treatment and control groups. We also found some evidence that control-group teachers who
attritted had lower levels of initial interest than coached teachers who did so. However, we found
no difference in any other observable characteristic between coached and control-group teachers
who were censored from the study in the follow-up year.
We used two primary approaches to test the robustness of our findings to attrition and
missing data. First, we followed Kling, Liebman and Katz (2007) by imputing baseline and
outcome means within each experimental group and re-estimating our results in the full sample.

26 INDIVIDUALIZED COACHING TO IMPROVE TEACHER PRACTICE
By imputing group means, we have assumed that missing data is missing completely at random.
We relaxed this strong assumption in our second approach by using multiple imputation, which
assumes that data are missing at random, conditional on the observed characteristics and ratings
of teachers that we do have in our data (Rubin, 1987). We implemented this approach by
imputing missing data for baseline and outcome measures of effectiveness using teacher
characteristics presented in Table 1 and an indicator for treatment status. Because both
techniques assume some level of randomness in missing data, we do not present results from
these strategies for the follow-up year. In this second year, sample attrition may not be
independent from treatment status despite the lack of notable differences in observable
characteristics across groups.
In Table 2, we report results from each of the methods described above alongside our
original estimates. We found that estimates of MTC effects are largely consistent with our
primary analyses when we used mean imputation (column 2) with the exception of the Principal
Evaluation Composite, which was attenuated and no longer marginally significant. In column 3,
we present the average point estimates across 10 imputed datasets as well as their associated
standard errors derived from standard formulas. Again, our results were largely unchanged.
Overall, we interpret these findings as strong evidence that our estimated effects in the coaching
year cannot be explained away by differential sample attrition across experimental groups.
Spillover Effects
Given our design in which teachers were randomized to either the treatment or control
group within schools, it is possible that control-group teachers were exposed to elements of
coaching through their colleagues. Analyses of end-of-study teacher surveys indicated that nine
of the 24 control-group teachers who remained in the study did learn about instructional

27 INDIVIDUALIZED COACHING TO IMPROVE TEACHER PRACTICE
techniques taught by coaches from their colleagues who received coaching. Seven of these
teachers reported using these new techniques in their own classrooms. In addition, coaches
indicated that several principals incorporated coaching techniques into their school-wide PD.
These data suggest that our estimated treatment effects likely understated the full effect of the
MTC program. The adoption of instructional techniques taught by MTC provides further
evidence of the efficacy of these practices.
Discussion and Conclusion
The Challenge and the Evidence
A growing consensus is emerging among policymakers and scholars that teachers, and
teaching quality, should be a focal point of any large-scale effort to improve public education.
This is evident in the Race to the Top grant requirements and federal waivers to No Child Left
Behind accountability measures as well as in the research literature. Efforts to improve the
quality of the teacher workforce through selective recruitment and retention are limited by the
sheer scale of the education sector and our relative inability to predict who will be an effective
teacher (Clotfelter, Ladd, & Vigdor, 2007; Rockoff, Jacob, Kane, & Staiger, 2011). The
challenge, then, is how to improve the instruction of the 3.5 million teachers in classrooms across
the United States. This is not a new challenge but rather a persistent one. Schools invest billions
of dollars annually in programming, personnel, and support services intended to promote
professional growth among teachers (Picus & Odden, 2011). The choices policymakers and
administrators make when allocating these funds are critical.
In recent years, calls for reforming PD have resulted in meaningful changes and
important innovations, narrowing the size and scope of these activities to focus, for example, on
the content or challenges of grade- or subject-specific teams. Some districts and schools are
28 INDIVIDUALIZED COACHING TO IMPROVE TEACHER PRACTICE
replacing independent providers of PD content with experienced teachers and instructional
leaders with local expertise. Student work and assessment data are being injected into the
discussion in new and innovative ways. However, the critical features of PD programs in most
public schools remain largely unchanged: they are generalized across teachers or teams, often
abstracted from an individual teacher’s own classroom context, and usually brief.
An emerging body of research suggests that coaching models of PD might provide a
promising alternative organized around active-learning, job-embedded practice, and sustained
focus. Recent evaluations of literacy coaching, math coaching, and web-based coaching focused
on teacher-student relationships find mixed evidence on the efficacy of these programs. This
study begins to build evidence on coaching models designed to improve behavior management
and common instructional practices. Outside observers, principals, and students all rated teachers
who received coaching as more effective than those who participated in standard PD activities
provided by their schools although differences in principal ratings are not statistically significant
at conventional levels. We also find suggestive evidence that these effects persist in the
following academic year after teachers are no longer receiving coaching. Finally, the effect of
MTC on our index of Effective Teacher Practices appears to be largely consistent across
subjects, grade levels, and schools.
These results among the first cohort of participating teachers are most appropriately
generalized to alternatively certified teachers who work with predominantly low-income
minority students in urban charter schools and who are willing participants in a coaching
program. This population of teachers is of substantial interest to policymakers given that one out
of every four new teachers enters the profession through an alternative certification pathway.5
5 Source: U.S. Department of Education, National Center for Education Statistics, Schools and Staffing Survey (SASS), "Public School Teacher Data File," 2011–12.

29 INDIVIDUALIZED COACHING TO IMPROVE TEACHER PRACTICE
The schools in our study are also representative of over two-thirds of the Recovery School
District schools in Louisiana, as well as a growing number of schools in cities such as
Washington, D.C., Philadelphia, and New York City. The relatively small variation in MTC
effect sizes across teachers and schools in the study provides additional support for the external
validity of these findings amongst a similar population of teachers and schools. However, it
remains an open question whether these effects would be realized if the program was taken to
scale and thus included teachers who might be less active participants in the coaching process.
These results may also not be generalizable to coaching models that emphasize teacher reflection
and self-assessment more than direct feedback.
Implications for Practice and Future Research
Districts interested in experimenting with teacher coaching need to find creative ways to
address the challenges posed by the specialized personnel requirements and high costs of teacher
coaching. We still know very little about what makes for an effective coach or what a system for
selecting and training an effective corps of teacher coaches should look like. Differences in
coach effectiveness is one possible explanation for the mixed evidence on teacher coaching.
Coaching programs are also “among the most expensive approach to professional development”
(Wayne et al., 2008, p. 470) because of their individualized and intensive nature. We estimate
that MTC cost $9,000 per teacher, driven largely by personnel costs and a low teacher-to-coach
ratio of 10-to-1. Further costs-benefit analyses will help to inform whether the relative returns to
this costly investment are favorable compared to other less-costly approaches to professional
development.
We propose a few ways in which districts, in partnership with researchers, could address
and study these constraints. Broadly, districts may seek to develop a corps of coaches from

30 INDIVIDUALIZED COACHING TO IMPROVE TEACHER PRACTICE
within their current workforces. Such a strategy could have the added benefit of creating new
career-ladder opportunities for expert teachers to serve as coaches. Given the high costs of
coaching, districts might be best served by experimenting with pilot programs that focus on
novice and struggling teachers most in need of support.
Rapid advancements in 360-degree video capture and communication technology may
also allow districts to harness expert support outside of the district and build more cost-effective
coaching programs. As this technology improves and becomes more affordable, districts could
invest in web-based coaching platforms like My Teaching Partner where teachers submit videos
and receive individualized feedback from instructional experts online. This approach could
increase the teacher-to-coach ratio by eliminating commuting costs and would more efficiently
pair coaches with teachers in their grade-level and content areas of expertise. Far more research
is needed in this area.
Future studies of MTC-style coaching programs should address the limitations of this
research by evaluating larger and more diverse samples. We will extend these analyses by
studying additional cohorts of New Orleans teachers as part of this multi-cohort study in order to
examine the robustness and generalizability of these initial results. In addition, new studies
should extend this work by implementing research designs that are optimized to estimate effects
on student achievement in both the coaching year and follow-up year. The benefits of recruiting
a diverse sample of teacher across K-12 grades and subjects in this study came at the cost of
having a sufficient sample to examine effects on student achievement in tested grades and
subjects. Many open questions remain about the potential value of coaching on general behavior
management and instructional delivery skills. Answering these questions will take time, but the
evidence-to-date suggests doing so will be a valuable investment.

31 INDIVIDUALIZED COACHING TO IMPROVE TEACHER PRACTICE

32 INDIVIDUALIZED COACHING TO IMPROVE TEACHER PRACTICE
References
Allen, J. P., Pianta, R. C., Gregory, A., Mikami, A. Y., & Lun, J. (2011). An interaction-based approach to enhancing secondary school instruction and student achievement. Science, 333, 1034-1037.
Anderson, M. L. (2008). Multiple inference and gender differences in the effects of early
intervention: A reevaluation of the Abecedarian, Perry Preschool, and Early Training Projects. Journal of the American Statistical Association, 103, 1481-1495.
Bell, C. A., Gitomer, D. H., McCaffrey, D. F., Hamre, B. K., Pianta, R. C., & Qi, Y. (2012). An
argument approach to observation protocol validity. Educational Assessment, 17(2-3) , 62-87.
Biancarosa, G., Bryk, A. S., & Dexter, E. R. (2010). Assessing the value-added effects of literacy
collaborative professional development on student learning. The Elementary School Journal, 111(1), 7-34.
Cabalo, J. V., Ma, B., & Jaciw, A. (2007). The comparative effectiveness of professional
development and support tools for world language instruction: a report of a randomized experiment in Delaware. Research Report. Empirical Education Inc.
Campbell, P. F., & Malkus, N. N. (2011). The impact of elementary mathematics coaches on
student achievement. The Elementary School Journal, 111(3), 430-454. Canter, L. (2010). Lee Canter's Classroom Management for Academic Success. Bloomington,
IN: Solution Tree. Choy, S. P., Chen, X., Bugarin, R., & Broughman, S. P. (2006). Teacher professional
development in 1999-2000: What teachers, principals, and district staff report. Statistical analysis report. Washington, D.C.: U.S. Department of Education, National Center for Education Statistics.
Clotfelter, C.T., Ladd, H.F., & Vigdor, J.L. (2007). Teacher credentials and student achievement:
Longitudinal analysis with student fixed effect. Economics of Education Review, 26, 673-682.
Connor, C. M., Morrison, F. J., Schatschneider, C., Toste, J. R., Lundblom, E., Crowe, E.
C., & Fishman, B. (2011). Effective Classroom Instruction: Implications of Child Characteristics by Reading Instruction Interactions on First Graders’ Word Reading Achievement. Journal of research on educational effectiveness, 4(3), 173-207.
Cowen Institute. (2012). The state of public education in New Orleans: 2012 report. New
Orleans, LA: Tulane University. Darling-Hammond, L., Wei, R. C., Andree, A., Richardson, N., & Orphanos, S. (2009).
Professional learning in the learning profession: A status report on teacher development
33 INDIVIDUALIZED COACHING TO IMPROVE TEACHER PRACTICE
in the United States and abroad. Palo Alto, CA: National Staff Development Council and The School Redesign Network, Stanford University.
Denton, C. A., & Hasbrouck, J. A. N. (2009). A description of instructional coaching and its
relationship to consultation. Journal of Educational and Psychological Consultation, 19(2), 150-175.
Desimone, L., Porter, A., Garet, M., Yoon, K. S., & Birman, B. (2002). Effects of professional
development on teachers’ instruction: Results from a three-year longitudinal study. Educational Evaluation and Policy Analysis, 24(81), 81–112.
Desimone, L. M. (2009). Improving impact studies of teachers’ professional development:
Toward better conceptualizations and measures. Educational researcher, 38(3), 181-199. Dweck, C. (2006). Mindset: The new psychology of success. Random House. Farkas, S., Johnson, J., & Duffett, A. (2003). Stand by me: What teachers really think about
unions, merit pay, and other professional matters. New York: Public Agenda. Fletcher, S., & Mullen, C. A. (Eds.). (2012). Sage Handbook of Mentoring and Coaching in
Education. Sage. Freiberg, H. J., Huzinec, C. A., & Templeton, S. M. (2009). Classroom management – a pathway
to student achievement: A study of fourteen inner-city elementary schools. Elementary School Journal, 110(1), 63-80.
Garet, M. S., Cronen, S., Eaton, M., Kurki, A., Ludwig, M., Jones, W., Uekawa, K., Falk, A.,
Bloom, H. S., Doolittle, F., Zhu, P., & Sztejnberg, L. (2008). The impact of two professional development interventions on early reading instruction and achievement. Washington, D. C.: U.S. Department of Education, National Center for Education Statistics.
Garet, M. S., Porter, A. C., Desimone, L., Birman, B. F., & Yoon, K. S. (2001). What makes
professional development effective? Results from a national sample of teachers. American Educational Research Journal, 38(4), 915-945.
Garet, M. S., Wayne, A. J., Stancavage, F., Taylor, J., Eaton, M., Walters, K., Song, M., Brown,
S., Hurlburt, S., Zhu, P., Sepanik, S., & Doolittle, F. (2011). Middle school mathematics professional development impact study: Findings after the second year of implementation. Washington, D. C.: U.S. Department of Education, National Center for Education Statistics.
Glazerman, S., Dolfin, S., Bleeker, M., Johnson, A., Isenberg, E., Lugo-Gil, J., Grider, M., &
Britton, E. (2008). Impacts of comprehensive teacher induction: Results from the first year of a randomized controlled study. Washington, DC: U.S. Department of Education.

34 INDIVIDUALIZED COACHING TO IMPROVE TEACHER PRACTICE
Goldring, R., Gray, L., Bitterman, A., & Broughman, S. (2013). Characteristics of public and private elementary and secondary school teachers in the United States. National Center for Education Statistics.
Harris, D.N., & Sass, T.R. (2009). What makes for a good teacher and who can tell? CALDER
Working Paper No. 30 Harris, D. N., & Sass, T. R. (2011). Teacher training, teacher quality, and student achievement.
Journal of Public Economics, 95, 798-812. Hill, H. C. (2007). Learning in the teacher workforce. Future of Children, 17(1), 111-127. Jacob, B. A., & Lefgren, L. (2004). The Impact of Teacher Training on Student Achievement
Quasi-Experimental Evidence from School Reform Efforts in Chicago. Journal of Human Resources, 39(1), 50-79.
Jacob B. A., & Lefgren L. (2008). Can principals identify effective teachers? Evidence on
subjective performance evaluation in education. Journal of Labor Economics, 20(1), 101-136.
Jones, F. H. (2007). Tools for teaching: Discipline, instruction, motivation. fredjones.com. Kane, T. J., & Staiger, D. O. (2011). Learning about teaching: Initial findings from the measures
of effective teaching project. Policy and practice brief. MET Project. Bill & Melinda Gates Foundation.
Kane, T. J., & Staiger, D. O. (2012). Gathering feedback for teaching: Combining high-quality
observations with student surveys and achievement gains. Policy and practice brief prepared for the Bill and Melinda Gates Foundation.
Kane, T. J., Taylor, E. S., Tyler, J. H., & Wooten, A. L. (2010). Identifying effective classroom
practices using student achievement data. Cambridge, MA: National Bureau of Economic Research.
Kaufman, D., Johnson, S. M., Kardos, S. M., Liu, E., & Peske, H. G. (2002). “Lost at sea”: New
teachers’ experiences with curriculum and assessment. Teachers College Record, 104(2), 273-300.
Kennedy, M. (1998). Form and substance in inservice teacher education. National Institute for
Science Education. Killeen, K. M., Monk, D. H., & Plecki, M. L. (2002). School district spending on
professional development: Insights available from national data (1992-1998). Journal of Education Finance, 25-49.
Kling, J.R., Liebman, J.B., & Katz, L.F. (2007). Experimental analysis of neighborhood effects.

35 INDIVIDUALIZED COACHING TO IMPROVE TEACHER PRACTICE
Econometrica, 75, 83-119. Konstantopoulos, S. (2008). The power of the test for treatment effects in three-level block
randomized designs. Journal of Research on Educational Effectiveness, 1(4), 265-288. Landry, S. H., Anthony, J. L., Swank, P. R., & Moesque-Bailey, P. (2009). Effectiveness of
comprehensive professional development for teachers of at-risk preschoolers. Journal of Educational Psychology, 101(2), 448-465.
Lemov, D., 1967. (2010). Teach like a champion : 49 techniques that put students on the path to
college (1st ed.). San Francisco, CA: Jossey-Bass. Little, J. W. (2001). Professional development in pursuit of school reform. Teachers caught in
the action: Professional development that matters, 3, 23-44. Marsh, J. A., McCombs, J. S., Lockwood, J. R., Martorell, F., Gershwin, D., Naftel, S., Le, V.,
Shea, M., Barney, H., & Crego, A. (2008). Supporting Literacy Across the Sunshine State: A Study of Florida Middle School Reading Coaches. Santa Monica, CA: RAND Corporation.
Matsumura, L. C., Garnier, H. E., & Resnick, L. B. (2010). Implementing literacy coaching: The
role of school social rescources. Educational Evaluation and Policy Analysis, 32(2), 249-272.
Miles, K. H., Odden, A., Fermanich, M., Archibald, S., & Gallagher, A. (2004). Inside the black
box of professional development spending: Lessons from comparing five urban districts. Journal of Education Finance, 30(1), 1-26.
Murnane, R. J., & Willett, J. B. (2010). Methods matter: Improving causal inference in
educational and social science research. Oxford University Press. Neuman, S. B., & Cunningham, L. (2009). The impact of professional development and
coaching on early language and literacy instructional practices. American Educational Research Journal, 46(2), 532-566.
Penuel, W. R., Gallagher, L. O., & Moorthy, S. (2011). Preparing teachers to design sequences
of instruction in earth systems science: A comparison of three professional development programs. American Education Research Journal, 48(4), 996-1025.
Picus, L. O., & Odden, A. R. (2011). Reinventing school finance: Falling forward. Peabody
Journal of Education, 86(3), 291-303. Powell, D. R., & Diamond, K. E. (2011). Improving the outcomes of coaching-based
professional development interventions. Handbook of early literacy research, 3, 295-307. Ramey, S. L., Crowell, N. A., Ramey, C. T., Grace, C., Timraz, N., & Davis, L. E.

36 INDIVIDUALIZED COACHING TO IMPROVE TEACHER PRACTICE
(2011). The dosage of professional development for early childhood professionals: How the amount and density of professional development may influence its effectiveness. Advances in Early Education And Day Care, 15, 11-32.
Raudenbush, S. W., & Liu, X. (2000). Statistical power and optimal design for multisite
randomized trials. Psychological methods, 5(2), 199. Rhoads, C. H. (2011). The implications of “contamination” for experimental design in education.
Journal of Educational and Behavioral Statistics, 36(1), 76-104. Rockoff, J.E., Jacob, B.A., Kane, T.J. & Staiger, D.O. (2011). Can you recognize an effective
teacher when you recruit one? Education Finance & Policy, 6(1), 43-74. Rubin, Donald. (1987). Multiple imputation for nonresponsive in surveys. New York: Wiley &
Sons Inc. Russo, A. (2004). School-based coaching. Harvard Education Letter, 20(4), 1-4. Sailors, M., & Price, L. R. (2010). Professional development that supports the teaching of
cognitive reading strategy instruction. The Elementary School Journal, 110(3), 301-322.
Santagata, R., Kersting, N., Givvin, K. B., & Stigler, J. W. (2011). Problem implementation as a lever for change: An experimental study of the effects of a professional development program on students' mathematics learning. Journal of Research on Educational Effectiveness, 4(1), 1-24.
Scher, L., & O’Reilly, F. (2009). Professional development for K-12 math and science teachers: What do we really know? Journal of Research on Educational Effectiveness, 2(3), 209-249.
Schochet, P. Z. (2008). Technical methods report: Guidelines for multiple testing in impact
evaluations. Washington, DC: U.S. Department of Education, Institute of Education Sciences, National Center for Education Evaluation and Regional Assistance.
Shulman, L. S. (1986). Those who understand: Knowledge growth in teaching. Educational
Researcher, 15(2), 4-14. Van Keer, H., & Verhaeghe, J. P. (2005). Comparing two teacher development programs for
innovating reading comprehension instruction with regard to teachers’ experiences and student outcomes. Teaching and Teacher Education, 21(5), 543-562.
Wayne, A. J., Yoon, K. S., Zhu, P., Cronen, S., & Garet, M. S. (2008). Experimenting with
teacher professional development: Motives and methods. Educational researcher, 37(8), 469-479.

37 INDIVIDUALIZED COACHING TO IMPROVE TEACHER PRACTICE
Yoon, K. S., Duncan, T., Lee, S. W. Y., Scarloss, B., & Shapley, K. (2007). Reviewing the evidence on how teacher professional development affects student achievement. Washington, DC: U.S. Department of Education, Institute of Education Sciences, National Center for Education Evaluation and Regional Assistance, Regional Educational Laboratory Southwest.

38 INDIVIDUALIZED COACHING TO IMPROVE TEACHER PRACTICE
Tables
Table 1. Teacher Characteristics for Study Participants and Non-Participants and Treatment and Control Groups Means
p-value on Difference between
Participants and Non-
Participants
Means p-value on Difference between
Treatment and Control
Teachers Not
Selected to
Participate in the Study
Teachers Selected
to Participate
in the Study
Treatment Teachers
Control Teachers
Female 0.78 0.75 0.71 0.70 0.79 0.27 African-American 0.34 0.17 0.06 0.20 0.14 0.86 White 0.56 0.76 0.05 0.77 0.76 0.56 Age - 26.1 - 26.1 26.1 0.96 Experience 3.28 3.97 0.14 3.93 4.00 0.89 First- or Second-Year Teacher 0.38 0.27 0.31 0.27 0.28 0.87 Third- or Fourth-Year Teacher 0.41 0.42 0.87 0.53 0.31 0.12 Fifth- or Higher-Year Teacher 0.22 0.31 0.38 0.20 0.41 0.11 Alternatively Certified 0.66 0.76 0.28 0.80 0.72 0.62 Master's Degree - 0.22 - 0.20 0.24 0.75 College Institution Ranked Very Competitive or Higher - 0.76 - 0.73 0.79 0.56 Interest in Coaching 8.16 9.11 0.00 9.23 8.98 0.32 F-statistic from Joint Test 2.18 0.58 p-value 0.06 0.81 n (teachers) 32 59 30 29
Note: For non-participants, cells missing where data are not available. Joint tests for differences between participants and non-participants do not include Interest in Coaching, as teachers were selected on this variable. Treatment and control group means are estimated from regression models that control for randomization blocks. Joint tests include teachers' experience coded as a continuous variable and not as the three experience range indicators.
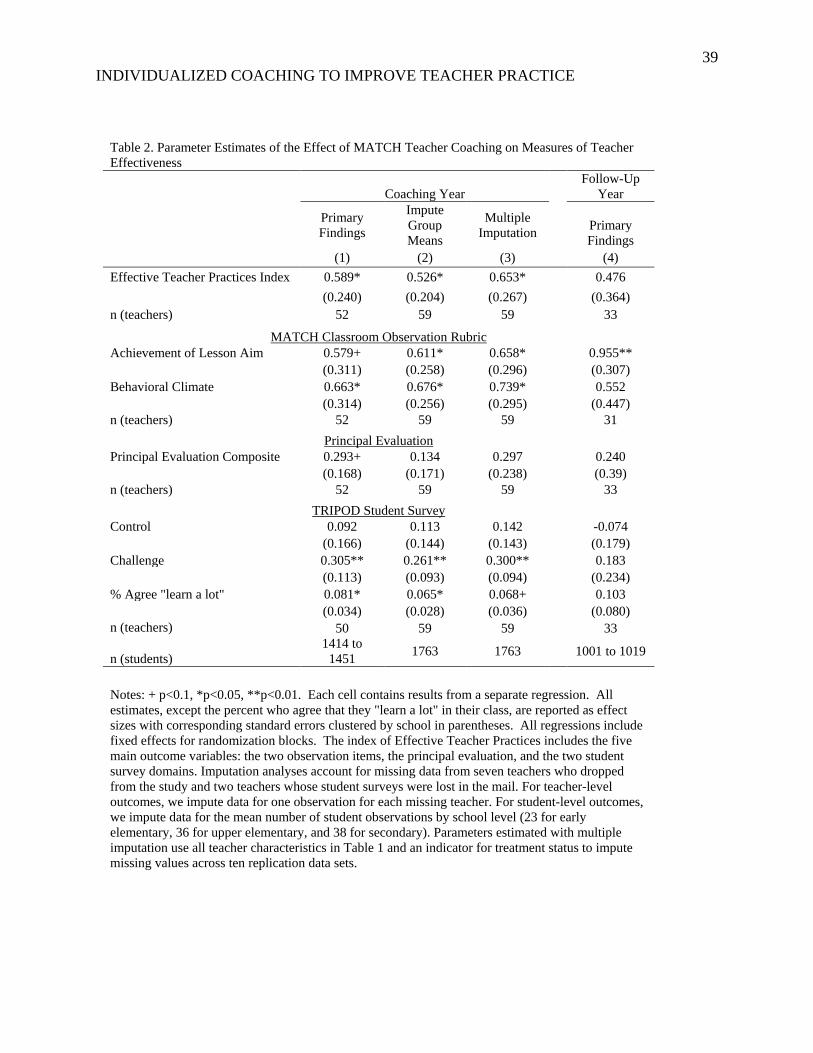
39 INDIVIDUALIZED COACHING TO IMPROVE TEACHER PRACTICE
Table 2. Parameter Estimates of the Effect of MATCH Teacher Coaching on Measures of Teacher Effectiveness
Coaching Year Follow-Up
Year
Primary Findings
Impute Group Means
Multiple Imputation
Primary Findings
(1) (2) (3) (4) Effective Teacher Practices Index 0.589* 0.526* 0.653* 0.476 (0.240) (0.204) (0.267) (0.364) n (teachers) 52 59 59 33
MATCH Classroom Observation Rubric Achievement of Lesson Aim 0.579+ 0.611* 0.658* 0.955** (0.311) (0.258) (0.296) (0.307) Behavioral Climate 0.663* 0.676* 0.739* 0.552 (0.314) (0.256) (0.295) (0.447) n (teachers) 52 59 59 31
Principal Evaluation Principal Evaluation Composite 0.293+ 0.134 0.297 0.240 (0.168) (0.171) (0.238) (0.39) n (teachers) 52 59 59 33
TRIPOD Student Survey Control 0.092 0.113 0.142 -0.074 (0.166) (0.144) (0.143) (0.179) Challenge 0.305** 0.261** 0.300** 0.183 (0.113) (0.093) (0.094) (0.234) % Agree "learn a lot" 0.081* 0.065* 0.068+ 0.103 (0.034) (0.028) (0.036) (0.080) n (teachers) 50 59 59 33
n (students) 1414 to
1451 1763 1763 1001 to 1019
Notes: + p<0.1, *p<0.05, **p<0.01. Each cell contains results from a separate regression. All estimates, except the percent who agree that they "learn a lot" in their class, are reported as effect sizes with corresponding standard errors clustered by school in parentheses. All regressions include fixed effects for randomization blocks. The index of Effective Teacher Practices includes the five main outcome variables: the two observation items, the principal evaluation, and the two student survey domains. Imputation analyses account for missing data from seven teachers who dropped from the study and two teachers whose student surveys were lost in the mail. For teacher-level outcomes, we impute data for one observation for each missing teacher. For student-level outcomes, we impute data for the mean number of student observations by school level (23 for early elementary, 36 for upper elementary, and 38 for secondary). Parameters estimated with multiple imputation use all teacher characteristics in Table 1 and an indicator for treatment status to impute missing values across ten replication data sets.

40 INDIVIDUALIZED COACHING TO IMPROVE TEACHER PRACTICE
Table 3. Estimates of Heterogeneity in Treatment Effects across Teacher Characteristics and Schools in Coaching Year
Grade Level Subject School
Elementary (K-5)
Middle (6-8)
High (9-12) All
Subjects Humanities STEM
Standard Deviation
of Treatment
Effects
p-Value from
Likelihood Ratio Test
Effective Teacher Practices Index 0.61+ 0.587 0.343+ 0.534 0.332 0.972+ 0.039 0.992 (0.328) (0.601) (0.196) (0.395) (0.326) (0.526) n (teachers) 30 13 9 22 19 11 52
MATCH Classroom Observation Rubric Lesson Aim 0.585 0.769 0.148+ 0.563 0.348 0.948+ 0.408 0.439 (0.499) (0.578) (0.076) (0.648) (0.407) (0.524) Behavioral Climate 0.738 0.671 0.345 0.743 0.214 1.041* 0.377 0.470 (0.494) (0.526) (0.409) (0.668) (0.367) (0.476) n (teachers) 30 13 9 22 19 11 52
Principal Evaluation Principal Evaluation Composite 0.282 0.13 0.162 0.238 0.45 0.044 0.000 0.990 (0.268) (0.37) (0.258) (0.219) (0.275) (0.569) n (teachers) 30 13 9 22 19 11 52
TRIPOD Student Survey Control -0.044 0.063 0.276 -0.07 0.052 0.452+ 0.449 0.008 (0.141) (0.238) (0.527) (0.184) (0.313) (0.264) Challenge 0.24* 0.286* 0.326 0.222* 0.178 0.612** 0.421 0.000 (0.101) (0.135) (0.406) (0.096) (0.197) (0.22) % Agree "learn a lot" 0.071 0.029 0.103 0.089 0.073 0.076 0.116 0.105 (0.044) (0.08) (0.071) (0.061) (0.068) (0.104)

41 INDIVIDUALIZED COACHING TO IMPROVE TEACHER PRACTICE
n (teachers) 29 12 7 to 9 22 16 to 18 10 50
n (students) 729 to 743 404 to
417 281 to
291 560 to
571 578 to 600 276 to
280 1414 to 1451
Notes: + p<0.1, *p<0.05, **p<0.01, ***p<0.001. Each cell contains results from a separate regression. For heterogeneity by grade level and subject, we report effect sizes by group with corresponding standard errors clustered by school in parentheses. All regressions include fixed effects for randomization blocks. The index of Effective Teacher Practices includes the five main outcome variables: the two observation items, the principal evaluation, and the two student survey domains. For heterogeneity across schools, we interact randomization blocks with a treatment indicator and report the standard deviation of school by treatment random effects and associated p-values estimated from likelihood ratio tests. Random effect models that allow for school-by-treatment effect heterogeneity with Challenge and % Agree "learn a lot" as outcomes do not converge. Estimates for these models are derived using fixed effects for randomization blocks interacted with treatment status.

42 INDIVIDUALIZED COACHING TO IMPROVE TEACHER PRACTICE
Table 4. Parameter Estimates of the Difference in Demographic Characteristics of Attritors Across Treatment and Control Groups. Coaching Year Follow-Up Year
Coefficient p-Value Coefficient p-
Value Female 0.019 0.961 -0.138 0.573 African-American -0.048 0.888 -0.078 0.713 White -0.336 0.388 0.001 0.996 Age -3.274 0.361 -0.801 0.721 Experience -1.346 0.492 -0.556 0.652 First- or Second-Year Teacher 0.100 0.805 0.352 0.160 Third- or Fourth-Year Teacher 0.098 0.825 -0.389 0.152 Fifth- or Higher-Year Teacher -0.198 0.630 0.037 0.886 Alternatively Certified 0.123 0.751 -0.272 0.254 Master's Degree -0.406 0.282 -0.238 0.304 College Institution Ranked Very Competitive or Higher 0.277 0.474 -0.169 0.485 Interest in Coaching -0.807 0.358 -1.031 0.056 Notes: n= 59. In the coaching year, seven teachers were censored from the study, two from the treatment group and five from the control group. In the follow-up year, 26 teachers were censored from the study, nine from the treatment group and 17 from the control group.
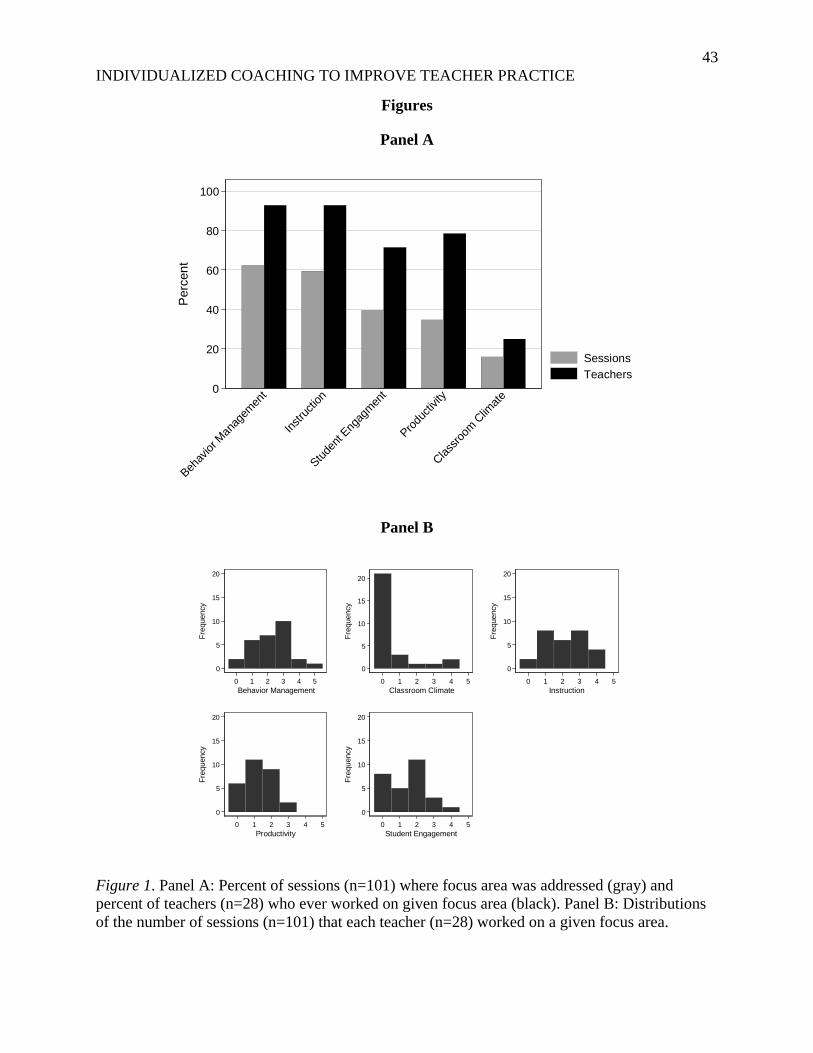
43 INDIVIDUALIZED COACHING TO IMPROVE TEACHER PRACTICE
Figures
Panel A
Panel B
Figure 1. Panel A: Percent of sessions (n=101) where focus area was addressed (gray) and percent of teachers (n=28) who ever worked on given focus area (black). Panel B: Distributions of the number of sessions (n=101) that each teacher (n=28) worked on a given focus area.
0
20
40
60
80
100Pe
rcen
t
Classro
om C
limate
Produc
tivity
Studen
t Eng
agmen
t
Instru
ction
Behav
ior M
anag
emen
t
SessionsTeachers
0
5
10
15
20
Freq
uenc
y
0 1 2 3 4 5Behavior Management
0
5
10
15
20
Freq
uenc
y
0 1 2 3 4 5Classroom Climate
0
5
10
15
20
Freq
uenc
y
0 1 2 3 4 5Instruction
0
5
10
15
20
Freq
uenc
y
0 1 2 3 4 5Productivity
0
5
10
15
20
Freq
uenc
y
0 1 2 3 4 5Student Engagement

44 INDIVIDUALIZED COACHING TO IMPROVE TEACHER PRACTICE
Appendix A
MATCH Teacher Residency Program: External Evaluation Form
Teacher: Observer: Date: Class Period:
OVERALL ACHIEVEMENT OF LESSON AIM (1 TO 10 RATING): _____ (Degree to which the majority of students appeared to master the academic objective of the class.) OVERALL BEHAVIORAL CLIMATE (1 TO 10 RATING): _____ (Degree to which you observed high student effort and low student misbehavior.
Assessing Aim Achievement
More inference work involved in this assessment, as it’s difficult to consistently collect and evaluate student work as a component of these observations.
Informed by data from the Instructional Quality and Student Engagement categories of the rubric.
Clarity and Rigor of the
Aim
Indicators of High ALA Ratings Notes The aim of the lesson is clearly stated and often referred to. It’s ambitious but achievable for the time allotted.
•
Alignment of
Student Practice
The majority of the instruction – questions, tasks, explanations, etc – is aligned with the aim. Students are given sufficient “at-bats” to achieve the aim.
•
Assessment
and Feedback
Student work – answers to questions, completed tasks, etc – is assessed throughout the lesson. Assessments provide students with multiple opportunities to get feedback. The standards for quality work are transparent.
•
Assessing Behavioral Climate
The focus is on both student behavior and effort, which can generally be boiled down to time on task: are students working hard to complete the tasks of a lesson with minimal distractions?
Informed by data from the Classroom Management and Student Engagement categories on the rubric.
Time on Task
Indicators of High BC Ratings Notes Approximately 90% (or higher) of the students are consistently on task throughout the lesson. The students maintain their focus and effort irrespective of the task (e.g. listening to
•

45 INDIVIDUALIZED COACHING TO IMPROVE TEACHER PRACTICE
the teacher vs. taking notes vs. working in small groups, etc)
Transitions
Students frequently comply quickly with directions, resulting in transitions between tasks that occur with minimal loss of instructional time.
•
Response to
Teacher Corrections
Students bounce back quickly after having their behavior corrected by the teacher. There’s very minimal to no “pushback” after a correction, and the rest of the class maintains their effort/focus in these situations.
•
Explanation of Numerical Ratings:
Below Expectations = 1-3
Approaching Expectations = 4-5
Meets Expectations = 6-7
Exceeds Expectations = 8-10
*Priority Areas:
Objectives marked with an “X” are noted as priority areas for the teacher to improve upon his/her overall performance in subsequent evaluation
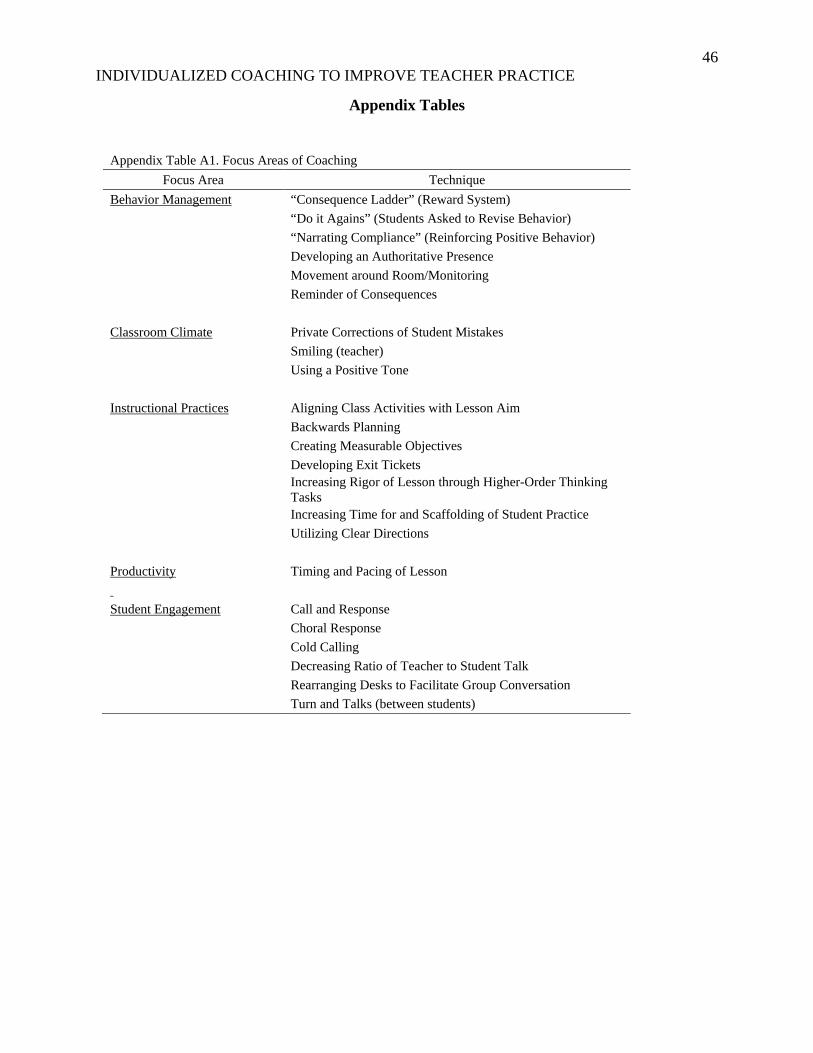
46 INDIVIDUALIZED COACHING TO IMPROVE TEACHER PRACTICE
Appendix Tables
Appendix Table A1. Focus Areas of Coaching Focus Area Technique
Behavior Management “Consequence Ladder” (Reward System) “Do it Agains” (Students Asked to Revise Behavior) “Narrating Compliance” (Reinforcing Positive Behavior) Developing an Authoritative Presence Movement around Room/Monitoring Reminder of Consequences Classroom Climate Private Corrections of Student Mistakes Smiling (teacher) Using a Positive Tone Instructional Practices Aligning Class Activities with Lesson Aim Backwards Planning Creating Measurable Objectives Developing Exit Tickets
Increasing Rigor of Lesson through Higher-Order Thinking Tasks
Increasing Time for and Scaffolding of Student Practice Utilizing Clear Directions Productivity Timing and Pacing of Lesson Student Engagement Call and Response Choral Response Cold Calling Decreasing Ratio of Teacher to Student Talk Rearranging Desks to Facilitate Group Conversation Turn and Talks (between students)

47 INDIVIDUALIZED COACHING TO IMPROVE TEACHER PRACTICE
Appendix Table A2. Teacher Characteristics and Balance Between Participants and Non-Participants and Between Treatment and Control Groups in the Follow-up Year Means p-value on
Difference between
Participants and Non-
Participants in Follow-up Year
Means p-value on Difference between
Treatment and Control
Teachers who
Participated in the
Follow-Up Year
Teachers Who Did
Not Participate
in the Follow-Up Year
Treatment Teachers
in the Follow-up Year
Control Teachers
in the Follow-up Year
Female 0.79 0.69 0.41 0.78 0.81 0.72 African-American 0.21 0.12 0.33 0.24 0.16 0.91 White 0.76 0.77 0.92 0.76 0.76 0.91 Age 26.27 25.89 0.71 26.61 25.69 0.25 Experience 4.12 3.77 0.54 4.40 3.64 0.08 First- or Second-Year Teacher 0.24 0.31 0.58 0.18 0.36 0.72 Third- or Fourth-Year Teacher 0.49 0.35 0.29 0.56 0.35 0.29 Fifth- or Higher-Year Teacher 0.27 0.35 0.55 0.26 0.29 0.08 Alternatively Certified 0.73 0.81 0.48 0.77 0.65 0.37 Master's Degree 0.15 0.31 0.16 0.16 0.14 0.34 College Institution Ranked Very Competitive or Higher 0.76 0.77 0.92 0.80 0.69 0.40 Interest in Coaching 9.12 9.10 0.92 9.20 8.98 0.05 F-statistic from Joint Test 0.78 0.97 p-value 0.64 0.50 n (teachers) 33 26 21 12 Note: Treatment and control group means are estimated from regression models that control for randomization blocks. Joint tests include teachers' experience coded as a continuous variable and not the three experience range indicators.


![This paper should be referred to as ... - Paul Verhaeghe and Destitution.pdfPaul Verhaeghe ‘[T]he subject is nothing but the impossibility of its own signifying representation.'](https://static.fdocuments.us/doc/165x107/60ad6fb3fb2c411a1d58440e/this-paper-should-be-referred-to-as-paul-verhaeghe-and-destitutionpdf-paul.jpg)

![The American Omen by Garet Garrett [1930]](https://static.fdocuments.us/doc/165x107/577cc0ea1a28aba71191954c/the-american-omen-by-garet-garrett-1930.jpg)
