Indicators and Standards for Quality Visitor Experiences ...
50
Indicators and Standards for Quality Visitor Experiences at City of Fort Collins Foothills Natural Areas Jerry J. Vaske Colorado State University Human Dimensions of Natural Resources Fort Collins, Colorado 80523 Support for this report was provided by the City of Fort Collins, Natural Areas Department.
Transcript of Indicators and Standards for Quality Visitor Experiences ...

Indicators and Standards for Quality Visitor Experiences
at City of Fort Collins Foothills Natural Areas
Jerry J. Vaske
Colorado State University
Human Dimensions of Natural Resources
Fort Collins, Colorado 80523
Support for this report was provided by the City of Fort Collins, Natural Areas Department.

i
Executive Summary
The City of Fort Collins conducted visitor surveys (n = 584) at the Foothills Natural Area during 2017
and 2018. Respondents were randomly selected throughout the year on both weekdays and weekends.
Interviews were conducted in four shifts (i.e., 8 am to 9:30 am, 10 am to 11:30 am, and 12 pm to 1:30 pm,
2:00 pm- 3:30 pm). Given the population of Fort Collins, the sample size, and the random selection
procedures, the findings reported here have a 95% confidence interval, + 4%. Table 1 summarizes this
data collection effort. 1
This report compares respondents at four locations: Coyote Ridge (n = 177), Maxwell (n = 145),
Pineridge (n = 123), and Reservoir Ridge (n = 148). Results focus on indicators and standards of quality
for visitor satisfaction, perceived conflict, and perceived crowding.
Demographics (Tables 1 – 4)
• Slightly higher percentages of males were surveyed at Coyote Ridge (56%) and Maxwell (52%),
while more females were surveyed at Pineridge (55%) and Reservoir Ridge (56%). The
differences in these distributions were not statistically significant (Table 2).
• Respondents mean ages ranged from 42.66 (Maxwell) to 47.33 (Pineridge); the four distributions
did not differ statistically.
• Nearly all respondents were not Hispanic or Latino (93% +) and the predominant race was white
(86% +). There were no statistical differences among respondents in terms of race.
• Respondents at all four locations were highly educated. For example, over three-quarters (77%)
of the respondents at Coyote Ridge had completed a bachelor’s degree (47%) or masters / Ph.D.
(30%). Comparable numbers were observed for the other three locations: Maxwell (89%),
Pineridge (85%), and Reservoir Ridge (75%).
• Forty percent plus of respondents at each location reported an income of $100,000 or more.
• Nearly all respondents were residents of Larimer County: Coyote Ridge (98%), Maxwell (99%),
Pineridge (97%), and Reservoir Ridge (96%) (Table 3).
• Coyote Ridge respondents had lived in the county an average of 11.75 years, Maxwell visitors
averaged 13.45 years, Pineridge respondents averaged 16.31 years, and Reservoir Ridge visitors
averaged 15.37 years.
1 A primer on statistics:
In this report, two types of statistics are presented: (a) Chi-square (χ2) and (b) F-values.
The choice of statistic depends on how the dependent variable was coded, for example:
if the dependent variable was dichotomous (e.g., male vs. female) or categorical (level of education), χ2 was used.
if the dependent variable was continuous (e.g., number of people in a group), F was used.
The independent variable was always categorical (e.g., location of the interview).
If the p-value for a given statistic is < .05, the groups being compared differ statistically.
The χ2 and F-values highlight when differences exist, but do not indicate the strength of the relationship.
The latter is convey via two effect size measures: (a) Cramer’s V (or simply V) for χ2 and (b) eta (η) for F-values.
The cutpoints for these two effect sizes are:
for V: .1 = a minimal relationship, .3 = a typical relationship, and .5 = a substantial relationship
for η: .1 = a minimal relationship, .243 = a typical relationship, and .371 = a substantial relationship.

ii
• Over three quarters of the Maxwell (82%), Pineridge (77%), and Reservoir Ridge (80%)
respondents were from Fort Collins. About half (54%) of the Coyote Ridge visitors were from
Fort Collins, with another quarter (26%) residing in Loveland (Table 4).

iii
Visitation (Tables 5 – 14)
• In the past 12 months, respondents visited Coyote Ridge an average of 12.79 times; visitors to the
other areas had visited, on average, more frequently: Maxwell (M = 38.59), Pineridge (M =
41.00) and Reservoir Ridge (M = 25.00) (Table 5).
• The number of visits varied by residents (M = 30.90) and non-residents (M = 1.62) (Table 6).
• Across all four locations, 39% were hikers, 31% were trail runners, 19% were mountain bikers,
and 11% were wildlife viewers (Table 7).
• Mountain bikers (M = 42.96 visits) and trail runners (M = 37.02) visited more frequently than
wildlife viewers (M = 23.05) and hikers (M = 16.13) (Table 8).
• Hiking was popular at Coyote Ridge (64%), Pineridge (72%), and Reservoir Ridge (69%). At
Maxwell, the two most popular activities were trail running (48%) and hiking (44%) (Table 9).
• At Coyote Ridge, Pineridge and Reservoir Ridge, the primary activity was hiking (42%, 44%,
42%, respectively). At Maxwell, respondents listed their primary activities as trail running (39%),
mountain biking (30%), and hiking (28%) (Table 10).
• Respondent’s reported primary activities varied by weekdays (Table 11) and weekends (Table
12). For example, at Coyote Ridge, only 8% listed mountain biking as their primary activity on
weekdays, while 17% reported mountain biking as their primary activity on weekends. At
Maxwell, 41% indicated hiking was their primary activity on weekdays, compared to 25% on
weekends.
• Nearly two-thirds (62%) of the Pineridge respondents and 57% of the Reservoir Ridge visited
alone (Table 13). At the other two locations (Coyote Ridge and Pineridge) visitation was
approximately 50% alone versus 50% in groups.
• At all four locations, over 80% of the respondents visited in groups of one or two. Over 85% did
not visit with children.
• About half (48%) of the hikers were with a group. Over 40% of the trail runners were alone
(Table 14).
Visitation at Other City of Fort Collins Natural Areas (Tables 15 – 18)
• In the past 12 months, Coyote Ridge respondents had also visited Bobcat Ridge (53%), Pineridge
(40%) and Fossil Creek (37%). Maxwell respondents also visited Pineridge (69%), Coyote Ridge
(64%) and Bobcat Ridge (50%). Pineridge visitors were also attracted to Coyote Ridge (57%),
and Maxwell (53%). Over half of the Reservoir Ridge visitors had also visited Coyote Ridge,
Maxwell, and Pineridge (Table 14).
• Reservoir Ridge was the most frequently listed “other” natural area visited (n = 17), followed by
Soapstone Prairie (n = 16), and River Bend Ponds (n = 8) (Table 15).
• Respondents were asked if they visited this natural area because it is less crowded: 59% of the
Reservoir Ridge visitors said yes, compared to 44% of the Pineridge visitors, 40% of Coyote
Ridge visitors, and 30% of the Maxwell visitors (Table 16).
• Over 90% of visitors to all locations do not avoid particular City of Fort Collins natural areas
(Table 17).
• Specific natural areas and reasons for no longer visiting that location are shown in Table 18.
Maxwell was listed seven times. Reasons for not visiting included crowding and lack of parking.

iv
Visitor Satisfaction (Tables 19 – 23)
• Based on the literature, the standard of quality for visitor satisfaction was set at 80% or more of
the visitors should be satisfied with their experiences at City of Fort Collins natural areas.
• Between 73% and 97% of visitors to the four locations rated all specific facilities (e.g., restrooms,
parking lots, trails) as “good” or “very good” (Table 19). The standard of quality was met or
exceeded for facilities with only three exceptions. All three exceptions were at Coyote Ridge:
restrooms (77%), picnic areas (77%), and trash receptacles (73%).
• In an open-ended question asking individuals to explain their perceived quality ratings, 86 said
“the trails are in great shape and well maintained.” Another 44 people commented that the
facilities were well-maintained. Thirty-two respondents thought that the natural areas had great
scenery (Table 16).
• Nearly all respondents rated the perceived quality of their experience as “excellent:” Coyote
Ridge (100%), Maxwell (98%), Pineridge (98%), and Reservoir (99%) (Table 21). The 80%
standard was also achieved for the overall perceived quality of the experience.
• Respondents’ reasons for their overall evaluations included natural beauty (n = 88), well managed
trails (n = 59), accessible (n = 43) and well maintained (n = 37) (Table 22).
Perceived Conflict (Tables 24 – 32)
• Eighty percent or more of all respondents “never” observed hikers, mountain bikers or equestrian
riders behaving unsafely or discourteously (Table 24). For many of the variables in Table 24,
these percentages are over 90%.
• Most respondents at all four locations “never” perceived a problem with hikers, mountain bikers
or equestrian riders behaving unsafely or discourteously (Table 25).
• Few respondents listed any specific problems with safety concerns. For example, four individuals
indicated that dogs off leash was a problem (Table 26). Written complaints about mountain bikers
included riding too fast (n = 22), not giving a warning when passing (n = 13), and not yielding the
right of way (n = 10) (Table 27). Horse waste on the trail was noted by three individuals as a
problem (Table 28).
• Recreation conflict was operationalized by combining the frequency (observed vs. not observed)
of seeing different events with corresponding perceived problem (problem vs. not a problem)
variables (Figure 1). Individuals who have not observed a given event, or who have observed it
yet do not perceive it to be a problem, are considered a no conflict group (either in terms of
interpersonal or social values conflicts). Those who have never seen a particular event, but
believe a problem exists for that event, are expressing a conflict in social values. Conversely,
those who witness a particular situation and believe that the event has caused a problem are
indicating an interpersonal conflict.
Figure 1. Conflict evaluation figure
Perceived Problem
Observed
No Yes
No No Conflict Social Values
Conflict
Yes No Conflict Interpersonal
Conflict

v
• Given the activities and conditions at the four natural areas, the standard of quality for perceived
conflict was set at no more than 25% of the respondents should interpersonal conflict.
• Across all four locations, over two thirds of respondents reported no conflict regarding safety
issues with hikers or equestrian riders (Table 32). Between 17% and 23% expressed social values
conflict and less than 10% noted interpersonal safety conflicts with hikers and horseback riders.
• Interpersonal conflicts with safety were more evident with mountain bikers (Table 32). Between
13% (Pineridge) and 20% (Coyote Ridge) noted this type of conflict. Social values conflict
regarding safety ranged from 23% (Coyote Ridge) to 41% (Maxwell).
• Across all locations, 57% of respondents reported no conflict associated with discourteous
behaviors by hikers or equestrian riders (Table 32). For these two activities interpersonal conflict
ranged from 1% to 8%. Interpersonal conflict stemming from discourteous behavior by mountain
bikers ranged from 12% (Pineridge) to 19% (Coyote Ridge).
• All of the percentages were lower than the standard of no more than 25% perceiving interpersonal
conflict.
Encounters with others and Perceived Crowding (Tables 33 – 35)
• Traditional crowding models assume that as the number of encounters with other visitors
increases, crowding will increase. Crowding is defined as a negative evaluation of density and
involves a value judgment that the density or number of encounters with other visitors is too
many. Heberlein and Vaske (1977) developed a relatively simple measure of perceived crowding
that asks people to indicate how crowded the area was at the time of their visit. Responses are
shown in Figure 2.
How crowded did you feel by the number of visitors? (Circle one number)
1 2 3 4 5 6 7 8 9
Not at all Slightly Moderately Extremely
Crowded Crowded Crowded Crowded
Figure 2. Example of crowding response scale.
• The average number of reported encounters with hikers at the trailhead ranged from 3.05
(Pineridge) to 7.62 (Coyote Ridge) (Table 33). The average number of encounters with mountain
bikers at the trailhead was lower and ranged from 0.48 (Reservoir Ridge) to 3.05 (Coyote Ridge).
Average encounters with equestrian riders at the trailhead was consistently less than one.
• On the trail, encounters with hikers ranged from a mean of 7.80 at Reservoir Ridge to 13.79 at
Coyote Ridge (Table 33). Encounters with mountain bikers on the trail averaged 2.26 at Reservoir
Ridge to slightly over six at Coyote Ridge and Maxwell. Encounters with horseback riders on the
trail again averaged less than one.
• The perceived crowding literature has suggested a standard of < 35% of visitors should feel any
level of crowding (i.e., scale points 3 thru 9 on the crowding scale).
• This report examined this standard for 38 City of Fort Collins evaluation contexts (Table 35). An
example evaluation context might refer to mountain bikers’ evaluations of hikers on the trail at
Coyote Ridge, or hikers’ evaluations of mountain bikers at the trailhead at Pineridge.
• The < 35% standard was met or exceed 34 of the 38 contexts. The four exceptions were:

vi
Evaluation context
Study site Evaluation by: Evaluation for:
Crowding
Scale 3-9
%
Maxwell Mountain bikers Hikers on trail 58
Maxwell Mountain bikers Mountain bikers on trail 49
Reservoir Ridge Mountain bikers Hikers on trail 41
Maxwell Mountain bikers Hikers at trailhead 37
• To put the crowding scores in perspective, Appendix A ranks perceived crowding scores from 82
studies / evaluation contexts in Colorado.

vii
Table of Contents
Page
Executive Summary ................................................................................................................................... i
Table of Contents ..................................................................................................................................... vi
List of Tables and Figures ....................................................................................................................... vii
Introduction ............................................................................................................................................... 1
Study Objectives .......................................................................................................................... 1
Conceptual Distinctions ............................................................................................................... 1
Satisfaction Indicator and Standard ................................................................................ 1
Perceived Conflict Indicator and Standard ..................................................................... 2
Crowding Indicator and Standard ................................................................................... 5
Methods .................................................................................................................................................... 7
Results ....................................................................................................................................................... 8
Conclusions .............................................................................................................................................. 25
City of Fort Collins Natural Areas Indicators and Standards .................................................... 25
Criteria for Choosing Indicators ................................................................................................ 26
Characteristics of Good Standards ............................................................................................. 29
Sources for Selecting Indicators / Developing Standards .......................................................... 30
References ............................................................................................................................................... 31
Appendix A – Ranking of perceived crowding for Colorado resources and evaluation contexts .......... 35
Appendix B – Additional comments ....................................................................................................... 39

viii
List of Tables and Figures
Table Page
1. City of Fort Collins Foothills exit satisfaction survey data collection effort .................................... 7
2. Demographic profile of visitors to City of Fort Collins natural areas ............................................... 8
3. Residence of visitors to City of Fort Collins natural areas ................................................................ 9
4. Top five specific primary residences of visitors to City of Fort Collins natural areas ...................... 9
5. Number of visits to City of Fort Collins natural areas in the past 12 months ................................. 10
6. Number of visits to City of Fort Collins natural areas..................................................................... 10
7. Primary activities at City of Fort Collins natural areas on day of interview ................................... 11
8. Visitation to City of Fort Collins natural areas by primary activity ................................................ 11
9. All activities at City of Fort Collins natural areas on day of interview .......................................... 11
10. Primary activity at City of Fort Collins natural areas on day of interview ...................................... 12
11. Primary activities on weekdays ....................................................................................................... 12
12. Primary activities on weekends ....................................................................................................... 12
13. Group characteristics of visitors to City of Fort Collins natural areas ............................................ 13
14. Primary activity by visited alone or with a group ........................................................................... 14
15. Visited other City of Fort Collins natural areas over the past 12 months ........................................ 14
16. Other natural areas respondents visited ........................................................................................... 15
17. Visit because less crowded .............................................................................................................. 15
18. City of Fort Collins natural areas respondents no longer visit ........................................................ 15
19. Specific natural areas respondents no longer visit ........................................................................... 16
20. Perceived quality of facilities at City of Fort Collins natural areas ................................................ 16
21. Respondents’ reasons for facility ratings......................................................................................... 17
22. Overall perceived quality of City of Fort Collins natural areas ....................................................... 17
23. Respondents’ reasons for overall perceived quality ratings ........................................................... 18
24. Unsafe and discourteous behaviors witnessed at City of Fort Collins natural areas ...................... 19
25. Perceived problems with other visitors at City of Fort Collins natural areas ................................. 19
26. Respondent explanations for unsafe hiking ..................................................................................... 20
27. Respondent explanations for unsafe mountain biking ..................................................................... 20
28. Respondent explanations for unsafe horseback riding .................................................................... 20
29. Respondent explanations for discourteous hiking ........................................................................... 21
30. Respondent explanations for discourteous mountain biking ........................................................... 21
31. Respondent explanations for discourteous horseback riding ........................................................... 21

ix
Table Page
32. Perceived conflict at City of Fort Collins natural areas ................................................................... 22
33. Reported number of other visitors seen at City of Fort Collins natural areas ................................. 23
34. Perceived crowding at City of Fort Collins natural areas ................................................................ 23
35. Ranking of perceived crowding at City of Fort Collins natural areas .................................24
Figure
1 Conflict classification figure ............................................................................................................ 5
2 Example of crowding response scale ................................................................................................ 5

1
Introduction
Natural resource management agencies strive to provide high quality recreation experiences (Decker,
Brown & Siemer, 2001). Not all visitors, however, share the same set of preferences for setting attributes,
facilities, and services offered. Some individuals, for example, may desire nothing more than the
opportunity to enjoy nature, hike, and watch wildlife; activities that require only a natural setting with
minimal agency provided facilities or services. Other visitors are more demanding in the services they
believe should be offered (Donnelly, Vaske, DeRuiter, & King, 1996).
Recognizing this diversity of desires found among recreationists, researchers and managers have
attempted to differentiate users into more homogeneous groups (Bryan, 1977). Segmentation strategies
have been developed that evaluate the benefits sought by individuals in a variety of situations or
occasions. For example, several studies highlight the importance of segmenting visitors based on
geographic location (e.g., Donnelly et al., 1996; Vaske, Beaman, Stanley, & Grenier, 1996). This report
compared visitors to four City of Fort Collins natural areas: Coyote Ridge, Maxwell, Pineridge, and
Reservoir Ridge.
Study Objectives
This project sought to better understand visitors to City of Fort Collins natural areas. More specifically,
the objectives were to describe visitors in terms of their:
1. Demographic characteristics (e.g., sex, age, place of residence)
2. Prior visitation rates and trip characteristics (e.g., trip duration, activity participation)
3. Visitation to other natural areas
4. Visitor satisfaction
5. Perceived conflicts with other visitors
6. Perceived crowding.
The intent is to (a) provide managers with baseline information against which future research results can
be compared and (b) to inform management decisions.
Conceptual Distinctions
Most planning frameworks recommend identifying and establishing quantitative impact indicators and
standards (e.g., Visitor Impact Management, Graefe, Kuss, & Vaske, 1990; Visitor Experience and
Resource Protection, National Park Service, 1997; Limits of Acceptable Change, Stankey, Cole, Lucas,
Petersen, & Frissell, 1985). Indicators are specific, measurable variables that reflect the current situation.
A standard of quality is the minimum acceptable condition for each indicator. Standards identify
conditions that are desirable (e.g., no litter), as well as conditions that managers do not want to exceed
(e.g., encounters with other people). Comparing existing conditions against the standards provides a
quantitative estimate of whether the experiences provided are within the limits specified by the standard
(Vaske, Whittaker, Shelby, & Manfedo, 2002).
This report considers three sets of indicators and standards that have been used extensively in the
literature:
1. Visitor satisfaction
2. Perceived conflict
3. Perceived crowding
Satisfaction Indicator and Standard
Satisfaction has been defined as the congruence between expectations and outcomes (Manning, 2011) and
is one of the most commonly used indicators of visitor experience / perceived quality of service received
(Vaske et al., 2002). Satisfaction from a recreation experience reflects visitor expectations and
management goals. People who experience conditions / services in line with what they expected are likely

2
to be satisfied. From a manager’s perspective, providing satisfactory experiences / services to at least X
percent of the visiting public reflects a standard for this indicator.
At least two methodologies for investigating satisfaction are evident in the literature. One theory has
focused on a multiple satisfactions approach, which assumes that each individual brings his or her own
expectations to an experience and these influence the kinds of satisfaction that he or she receives
(Hendee, 1974). This framework recognizes the diversity of experiences that visitors seek, and a quality
experience for a recreationist involves achieving the particular satisfactions in which he or she is
interested or expects (Manfredo, Fix, Teel, Smeltzer, & Kahn, 2004). The concern is with identifying
variables that affect satisfaction and that are susceptible to management or manipulation. If such variables
can be identified and monitored, the potential for changing circumstances to create better recreation
opportunities is enhanced. To facilitate this applied focus, a report card was developed in the late 1970’s
for tracking visitor satisfaction (LaPage & Bevins, 1981). The instrument included items that could be
influenced by management actions (e.g., restrooms, parking areas, trash receptacles) This applied
approach was adopted for this study.
Second, researchers (e.g., Vaske, Donnelly, Heberlein, & Shelby, 1982; Vaske & Roemer, 2013) have
defined satisfaction as an overall rating of a recreation experience / service as good or bad. Satisfaction is
viewed as a composite of the particular expectations and needs, expressed as a single numerical rating.
Defined this way, satisfaction has been operationalized with a single question, such as “Overall, how
would you rate the quality of the visitor services provided to you and your group?” The percentage of
individuals reporting a given level of satisfaction can be calculated for all participants in an activity and
the activities can be compared directly.
There are advantages and disadvantages to both multiple-item and single-item indicators of a concept.
Multiple-item indicators can contribute to a more sophisticated understanding of concepts and often have
good psychometric properties (e.g., reliability, validity). Measurement reliability means that the multiple
items measure the same construct (i.e., the items intercorrelate with each other). Measurement validity
means that the scale measures what it was intended to measure. Unfortunately, multiple-item indicators
also have disadvantages: (a) they increase respondent burden, (b) they challenge comparisons of findings
among studies because different items are used, and (c) they do not necessarily yield clear management
standards (Vaske, 2008).
Vaske and Roemer (2013) analyzing differences in overall satisfaction by consumptive and
nonconsumptive recreationists over a 30-year period. Based on theory and previous research, two
hypotheses were advanced: (a) consumptive recreationists will report significantly lower satisfaction than
will nonconsumptive recreationists, and (b) this pattern will remain consistent over time. Data were
obtained from published and unpublished studies in 57 consumptive (e.g., hunters) and 45
nonconsumptive (e.g., kayakers) recreation contexts. Each study used the same question measuring
overall satisfaction (i.e., “overall, how would you rate your day / trip / experience”). Following previous
research (Vaske et al., 1982), responses were collapsed into three categories (i.e., “poor / fair,” “good /
very good,” “excellent / perfect”). The independent variables were activity type and year. Consistent with
the hypotheses and the previous article, consumptive recreationists reported lower satisfaction than did
nonconsumptive recreationists, and this pattern of findings generally remained consistent over time.
Satisfaction Standard. Based on the previous meta-analyses (Vaske & Roemer, 2013; Vaske et al.,
1982), the standard for the City of Fort Collins natural areas was set at 80% or more of visitors should be
satisfied with their experience or the services they received. Comparing existing satisfaction ratings
against the 80% standard provides a quantitative estimate of whether any experiential changes are within
the limits specified by the standard (Vaske et al., 2002).
Perceived Conflict Indicator and Standard
Conflict has been a theme in the outdoor recreation literature for decades (e.g., Lucas, 1964). Recreation
conflict generally falls into two main categories (Graefe & Thapa, 2004). First, interpersonal conflict
(a.k.a., goal-interference) occurs when the physical presence or behavior of an individual or group
interferes with the goals of another individual or group (Jacob & Schreyer, 1980). Interpersonal conflict

3
can occur directly via a face-to-face encounter (e.g., between a backcountry skier and a snowmobiler on a
shared route), or indirectly where evidence of one group’s behavior is sufficient to cause conflict (e.g., a
skier smells the exhaust of a snowmobiler). Different groups may share the same goal (e.g., experiencing
untracked snow), but have different means of achieving that goal (e.g., skiing vs. snowmobiling), which
can influence goal-interference conflict (Graefe & Thapa, 2004).
Second, social values conflict occurs between groups who may not share similar norms or values about an
activity (Vaske, Donnelly, Wittmann, & Laidlaw, 1995). Unlike interpersonal conflict, social values
conflict can occur even when there is no direct contact between the groups (Carothers, Vaske, &
Donnelly, 2001; Vaske, Needham, & Cline, 2007). For example, although encounters with llama packing
trips may be rare, individuals may philosophically disagree about the appropriateness of using these
animals in the backcountry (Blahna, Smith, & Anderson, 1995).
Interpersonal Conflict. Research on recreational conflict has traditionally focused on the asymmetrical
relationships that occur when different activity groups interact (Kuss, Graefe, & Vaske, 1990). Studies,
for example, have shown the presence of a one-way conflict between paddling canoeists and motorboaters
(Adelman, Heberlein, & Bonnicksen, 1982). Paddling canoeists disliked motorboaters, but the people
using motor-powered craft were not bothered by, and often enjoyed seeing and interacting with paddlers.
This one-way type of conflict has also been shown between hikers and mountain bikers, oar-powered and
motor-powered whitewater rafters, cross-country skiers and snowmobilers, backpackers and
horsepackers, water skiers and anglers, and hunters and non-hunters. In general, the research has shown
that for those recreationists for whom the interaction has negative consequences (e.g., disrupts the
solitude of the experience, or inhibits one’s ability to catch fish or hunt game), conflict increases.
Hikers and mountain bikers differ in their method of experiencing the environment, but the participants
share similar characteristics. Research has profiled mountain bikers as “30 something” white males, from
a range of income levels, who believe the activity is important to their identity (Chavez, 1999). Similarly,
many hikers are over 30, white males, from a range of income levels and who identify with the sport
(Wellner, 1997). Individuals in both activities tend to participate frequently (Ruibal, 1996) and many
pursue both activities (Chavez, 1999). Such similarities suggest that conflict, to the extent it exists
between hikers and mountain bikers, is likely to reflect interpersonal problems rather than differences in
social values. Interpersonal conflict between hikers and mountain bikers may be related to speed, lack of
courtesy, crowding, or safety concerns (Moore, 1994). Safety issues, for example, have been linked to
trail design (blind corners) and the behaviors of some mountain bikers who ride too fast for existing
conditions (Hoger & Chavez, 1998).
Social Values Conflict. The importance of social acceptability judgments in conflict management is
relatively new to the recreation literature (Blahna et al., 1995). McShea, Wemmer, and Stuwe (1993), for
example, describe the social conflicts that erupted between hunters and anti-hunters when the National
Zoo’s Conservation and Research Center (CRC) attempted to open the area to hunting to reduce the size
of a controversial deer herd. The conflict was primarily based on differences in values held by the CRC
and animal rights groups. The CRC was concerned with protecting exotic hoofed animals from disease
caused by the deer, whereas the animal rights groups advocated a position favoring the rights of
individual deer. These findings reflect broader societal value differences toward consumptive versus non-
consumptive uses of wildlife.
Social value differences between hikers and mountain bikers may reflect anticipated threats. Existing
research (Hoger & Chavez, 1998; Moore, 1994), for example, suggests that some hikers believe mountain
bikers increase safety concerns (i.e., riding irresponsibly), degrade the natural resource (i.e., creating
informal trails), and lower the quality of the experience (i.e., lack of user etiquette). Similar to the
controversy over allowing hunting in certain locations (Vaske et al., 1995), these reactions suggest that,
for at least some individuals, mountain biking is not a socially acceptable activity and should not be
allowed on trails traditionally used by hikers. Such value judgments are reinforced when mountain bikers
are stereotyped as “crazy kids out for an adrenaline rush” (Hoger & Chavez, 1998).
Hiking represents a traditional activity on most trails whereas mountain biking is a relatively new sport.
Past research has repeatedly demonstrated that traditional users frequently question the social

4
acceptability of any non-traditional activity in natural resource settings (Blahna et al., 1995). As the
number of individuals participating in non-traditional activities like mountain biking increases (Ruibal,
1996), hikers’ tolerance levels for bikers may decrease and the potential for social values conflict can
increase.
Interpersonal versus Social Values Conflict. Vaske et al. (1995) examined the magnitude of
interpersonal and social values conflict for two general classes of events. Hunting-associated events
included seeing an animal being shot, seeing people hunting, and hearing guns being fired. Human-
wildlife interaction events were represented by evaluations of people disturbing, harassing, and feeding
wildlife. Comparisons were made between hunters and non-hunters and between frequent and infrequent
visitors to Mt. Evans, a 14,150-foot mountain located about 70 miles west of Denver. Results indicated
that interpersonal conflicts between hunters and non-hunters on Mt. Evans were minimized due to the
mountain’s natural visual barriers and the Colorado Division of Wildlife’s regulations that prohibit
hunting near the road where most non-hunters are found. To the extent that conflict existed for hunting
associated events, much of the problem was associated with differences in social values held by the non-
hunting public. Conflict in social values remained relatively constant across frequency of visitation;
findings that supported the argument that a visitor’s value orientation is independent of the number of
prior visits to an area.
Carothers et al. (2001) examined social values and interpersonal conflict reported by hikers, mountain
bikers, and those who participate in both activities. Across all three groups, less conflict was reported for
hiking than for mountain biking. To the extent that conflict did exist for hiking, mountain bikers and dual-
sport participants were more likely than hikers to report unacceptable behaviors. For evaluations of
mountain biking behavior, hikers were more likely than mountain bikers to experience conflict, whereas
dual-sport participants fell in between these two extremes. All three groups reported more interpersonal
than social values conflict.
Both interpersonal and social values conflict can be influenced by recreationists’ lifestyle tolerance; the
tendency to accept or reject lifestyles different than one's own (Jacob & Schreyer, 1980). As noted by Ivy,
Stewart, and Lue (1992), tolerance is typically associated with beliefs about a particular group, rather than
reactions to specific behaviors. When recreationists encounter others, a cognitive processing of
information occurs. This action often results in the categorization of others according to some group
membership, which helps to simplify and order environmental stimuli. Differences in lifestyles are often
communicated via visual cues such as the equipment used by recreationists engaged in different activities
(e.g., guns for hunting versus binoculars for wildlife viewing, Vaske et al., 1995). Recreation in-groups
and out-groups represent categories an individual establishes on the basis of perceived or imagined
lifestyle similarities and differences (Jacob & Schreyer, 1980). Though useful for maintaining a view of
the world, it can also lead to unjustified generalizations about other groups (Ramthun, 1995). Those who
demonstrate low tolerance for persons with differing lifestyles will be more likely to experience conflict.
Out-group versus in-group lifestyle tolerance differences have been noted for several recreation activities.
Research (Vaske, Carothers, Donnelly, & Baird, 2000; Williams, Dossa, & Fulton, 1994), for example,
has indicated that skiers and snowboarders have differing views of each other. Skiers felt threatened by
the snowboarders’ different approach; evaluated the language, clothes, and on-slope behavior of
snowboarders as intimidating; and had the perception that snowboarders purposely created conflict
situations. Snowboarders, on the other hand, perceived skiers as predictable and showed less concern for
their presence on the slopes. Watson, Williams, and Daigle (1991) found that mountain bikers were more
likely than hikers to perceive the two groups as similar in terms of socio-demographic characteristics, as
well as their relationship to the resource (attitudes about the environment, values of the area). Hikers
perceived more differences between the two groups. Other research has shown that hikers view mountain
biking as intrusive and are concerned with the impact mountain biking has on the environment and safety
issues related to multiple use trails (Hoger & Chavez, 1998).
Simple classifications of individuals into groups (e.g., skier vs. snowboarder, or hiker vs. biker), however,
can introduce problems when attempting to understand conflict (Watson, Zaglauer, & Stewart, 1996).
Many recreationists participate in multiple activities (i.e., both hiking and biking) and consequently, their

5
tolerance for others may be altered. Analyses should distinguish these dual sport participants from
individuals who pursue only one activity.
There are a variety of ways to operationalize interpersonal versus social values conflict. Vaske et al.
(1995) suggests combining the frequency (observed vs. not observed) of seeing different events with
corresponding perceived problem (problem vs. not a problem) variables (Figure 1). Individuals who have
not observed a given event, or who have observed it (e.g., bikers riding fast) yet do not perceive it to be a
problem, are considered a no conflict group (either in terms of interpersonal or social values conflicts).
Those who have never seen a particular event, but believe a problem exists for that event, are expressing a
conflict in social values. Conversely, those who witness a particular situation and believe that the event
has caused a problem are indicating an interpersonal conflict.
Figure 1. Conflict evaluation figure
Perceived Problem
Observed
No Yes
No No Conflict Social Values
Conflict
Yes No Conflict Interpersonal
Conflict
Source: Vaske et al. 1995
Conflict Standard. Unlike the other indicators and standards considered here (i.e., satisfaction, perceived
crowding), standards for acceptable levels conflict are more variable. The existing research suggests that
the magnitude of conflict depends on the characteristics of the:
1) activity (e.g., consumptive vs. non-consumptive, traditional vs. non-traditional),
2) visitors (e.g., tolerances for other user groups, perceived similarities between the groups),
3) environment (e.g., unpaved vs. paved trails that allow for faster speeds),
4) management (e.g., zoning to separate potentially incompatible activities).
As a starting point, the researcher recommends that no more than 25% of the respondents should report
interpersonal conflict.
Crowding Indicator and Standard
Researchers have recognized the difference between density and crowding, but even scientists sometimes
use the word “crowding” inappropriately when referring to high density (Shelby & Heberlein, 1986).
Density is a descriptive term that refers to the number of people per unit area. It is measured by counting
the number of people and measuring the space they occupy, and it can be determined objectively.
Crowding, on the other hand, is a negative evaluation of density; it involves a value judgment that the
specified number is too many. The term perceived crowding is often used to emphasize the subjective or
evaluative nature of the concept.
Heberlein and Vaske (1977) developed a relatively simple measure of perceived crowding that asks
people to indicate how crowded the area was at the time of their visit. Responses are given on the scale
below:
1 2 3 4 5 6 7 8 9
Not at all Slightly Moderately Extremely
Crowded Crowded Crowded Crowded
Figure 2. Example of crowding response scale
In this item, two of the nine scale points label the situation as uncrowded, and the remaining seven points
label it as crowded to some degree. The rationale is that people may be reluctant to say an area was

6
crowded because crowding is an undesirable characteristic in a recreation setting. An item that asked “Did
you feel crowded?” might lead most people to say “No.” The scale is sensitive enough to pick up even
slight degrees of perceived crowding, just as measures of undesirable chemicals (e.g., pollutants or
carcinogens) are sensitive to even low levels of these substances.
Crowding Standard. Shelby, Vaske, and Heberlein (1989) developed crowding standards based on this
indicator. Their comparative analysis of 59 different settings and activities suggested five distinct
categories of standards (suppressed crowding, low normal, high normal, over capacity, and greatly over
capacity). When < 35% of the visitors feel crowded, density levels in the area were not a problem. For
locations where between 50 and 60% of visitors felt crowded, the setting was approaching its carrying
capacity, and visitors started to experience access and displacement problems. Locations and activities
where over 65% of the visitors felt crowded were considered over carrying capacity.
A subsequent meta-analysis (Vaske & Shelby, 2008) examined crowding ratings for 615 different settings
and activities. These studies were conducted across the United States, Canada, New Zealand, Ecuador,
Sweden, and Taiwan. The activities included hunting of many types, fishing of many types, rafting,
kayaking, canoeing, floating, boating, rock climbing, mountain climbing, backpacking, day hiking,
biking, sailing, photography, and driving for pleasure. The areas studied show considerable diversity,
with some showing extremely high density and use impact problems, others showing low densities and no
problems, and still others actively utilizing management strategies to control densities and use impacts. In
total, 85,451 individuals have been asked the crowding question.
Both meta-analyses (Shelby et al., 1989; Vaske & Shelby, 2008) supported the five distinct categories of
standards based on the 9-point perceived crowding scale. The five categories were established based on
the percent of visitors reporting any level of crowding (scale points 3 through 9).
For all 615 evaluation contexts, 40% showed suppressed crowding, 18% low normal crowding, 17% high
normal crowding, 16% over capacity, and 9% greatly over capacity. In the United States, 40% of the 522
evaluation contexts showed suppressed crowding, whereas 16% were over capacity and 9% were greatly
over capacity.
Carrying capacity standards based on levels of perceived crowding 1
Percent
feeling
crowded
Capacity
judgment
Comment
Total
# of contexts
(n = 615)
Percent
of
contexts
0-35% Suppressed
crowding
Crowding is likely limited by management, situational factors,
or natural factors may offer unique low-density experiences.
245 40%
36-50% Low normal Access, displacement, or crowding problems are not likely to
exist at this time. Similar to the above category, may offer
unique low-density experiences.
111 18%
51-65% High normal These locations or activities probably have not exceeded
carrying capacity but may be tending in that direction. Should
be studied if increased use is expected, allowing management to
anticipate problems.
107 17%
66-80% Over
capacity
These locations or activities are generally known to have
overuse problems, and they are likely to be operating at more
than their capacity. Studies and management necessary to
preserve experiences.
99 16%
81-100% Greatly over
capacity
It is generally necessary to manage for high-density recreation.
A crowding problem has typically been identified.
53 9%
1. Source: Vaske and Shelby (2008)
7
Methods
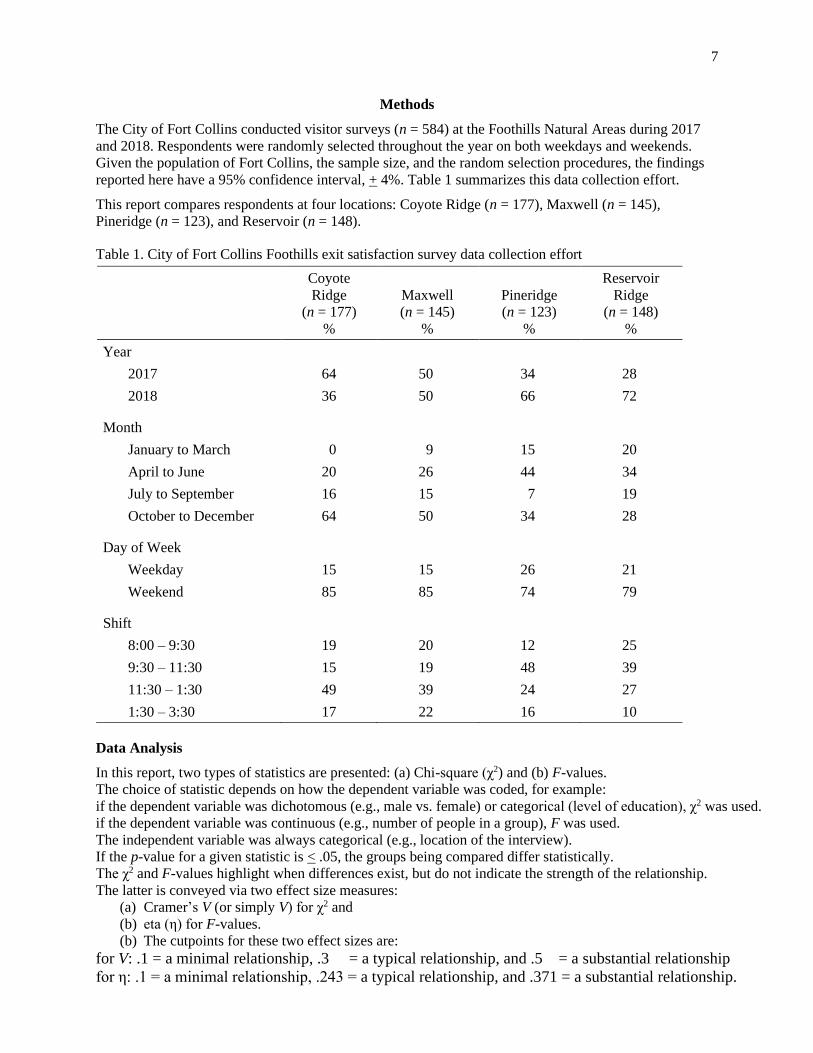
The City of Fort Collins conducted visitor surveys (n = 584) at the Foothills Natural Areas during 2017
and 2018. Respondents were randomly selected throughout the year on both weekdays and weekends.
Given the population of Fort Collins, the sample size, and the random selection procedures, the findings
reported here have a 95% confidence interval, + 4%. Table 1 summarizes this data collection effort.
This report compares respondents at four locations: Coyote Ridge (n = 177), Maxwell (n = 145),
Pineridge (n = 123), and Reservoir (n = 148).
Table 1. City of Fort Collins Foothills exit satisfaction survey data collection effort
Coyote
Ridge
(n = 177)
%
Maxwell
(n = 145)
%
Pineridge
(n = 123)
%
Reservoir
Ridge
(n = 148)
%
Year
2017 64 50 34 28
2018 36 50 66 72
Month
January to March 0 9 15 20
April to June 20 26 44 34
July to September 16 15 7 19
October to December 64 50 34 28
Day of Week
Weekday 15 15 26 21
Weekend 85 85 74 79
Shift
8:00 – 9:30 19 20 12 25
9:30 – 11:30 15 19 48 39
11:30 – 1:30 49 39 24 27
1:30 – 3:30 17 22 16 10
Data Analysis
In this report, two types of statistics are presented: (a) Chi-square (χ2) and (b) F-values.
The choice of statistic depends on how the dependent variable was coded, for example:
if the dependent variable was dichotomous (e.g., male vs. female) or categorical (level of education), χ2 was used.
if the dependent variable was continuous (e.g., number of people in a group), F was used.
The independent variable was always categorical (e.g., location of the interview).
If the p-value for a given statistic is < .05, the groups being compared differ statistically.
The χ2 and F-values highlight when differences exist, but do not indicate the strength of the relationship.
The latter is conveyed via two effect size measures:
(a) Cramer’s V (or simply V) for χ2 and
(b) eta (η) for F-values.
(b) The cutpoints for these two effect sizes are:
for V: .1 = a minimal relationship, .3 = a typical relationship, and .5 = a substantial relationship
for η: .1 = a minimal relationship, .243 = a typical relationship, and .371 = a substantial relationship.

8
Results
Slightly higher percentages of males were surveyed at Coyote Ridge (56%) and Maxwell (52%), while
more females were surveyed at Pineridge (55%) and Reservoir Ridge (56%). The differences in these
distributions was not statistically significant (Table 2). Respondents mean ages ranged from 42.66
(Maxwell) to 47.33 (Pineridge); the four distributions did not differ statistically. Nearly all respondents
were not Hispanic or Latino (93% +) and the predominant race was white (86% +). There were no
statistical differences among respondents in terms of race.
Table 2. Demographic profile of visitors to City of Fort Collins natural areas
City of Fort Collins Natural Area 1
Coyote
Ridge
%
Maxwell
%
Pineridge
%
Reservoir
Ridge
%
Statistic
χ2 or F-
value
p-value
Effect
size
V or η
Gender 5.29 .152 .095
Male 56 52 45 44
Female 44 48 55 56
Age 36.06 .008 .137
< 20 4 2 2 2
21 to 25 4 7 6 6
26 to 35 23 26 15 27
36 to 45 20 23 24 24
46 to 55 25 26 20 15
56 to 65 11 15 21 19
66 + 13 2 13 8
Mean age 44.81 42.66 47.33 43.79 2.36 .070 .111
Ethnicity
Hispanic or Latino 7 2 4 3 5.55 .145 .097
Not Hispanic or Latino 93 98 96 97
Race 2
White 86 92 88 93 5.82 .120 .098
Black 1 0 0 1 3.81 .283 .069
Asian 3 2 2 1 2.44 .487 .059
American Indian 0 1 1 0 4.98 .173 .083
Native Hawaiian 0 0 0 0 0.00 1.00 .000
Other 1 2 2 1 1.24 .744 .045
Highest Level of Education 41.72 < .001 .151
Some high school or less 5 1 0 2
High school 9 4 2 11
Associate’s degree 9 7 14 13
Bachelor’s degree 47 39 42 32
Masters / Ph.D. 30 50 43 43
Household Income 14.61 .842 .097
Less than $24,999 6 6 10 9
$25,000 – $34,999 6 8 8 6
$35,000 – $49,999 7 6 5 9
$50,000 – $74,999 22 20 16 18
$75,000 – $99,999 20 15 15 19
$100,000 – $149,999 27 21 25 22
$150,000 – $199,999 6 11 10 9
$200,000+ 7 13 12 9
1 Cell entries are either percentages or means. 2. Cells entries are the percentage of “yes” responses.

9
Respondents at all four locations were highly educated (Table 2, previous page). For example, over three-
quarters (77%) of the respondents at Coyote Ridge had completed a bachelor’s degree (47%) or masters /
Ph.D. (30%). Comparable numbers were observed for the other three locations: Maxwell (89%),
Pineridge (85%), and Reservoir Ridge (75%). Forty percent plus of respondents at each location reported
an income of $100,000 or more.
Nearly all respondents were residents of Larimer County: Coyote Ridge (98%), Maxwell (99%),
Pineridge (97%), and Reservoir Ridge (96%) (Table 3). Coyote Ridge respondents had lived in the county
an average of 11.75 years, Maxwell visitors averaged 13.45 years, Pineridge respondents averaged 16.31
years, and Reservoir Ridge visitors averaged 15.37 years.
Table 3. Residence of visitors to City of Fort Collins natural areas
City of Fort Collins Natural Area
Coyote
Ridge
%
Maxwell
%
Pineridge
%
Reservoir
Ridge
%
Statistic
χ2 or F
value
p-
value
Effect
size
V or η
Resident of
Larimer County
2.79 .425 .067
Yes 98 99 97 96
No 2 1 3 4
Years lived in
Larimer County
29.92 .049 .134
1 year or less 15 10 11 7
2 – 3 17 10 8 17
4 – 5 12 13 7 9
6 – 10 20 17 15 11
11 – 20 16 25 27 23
21 – 30 12 17 18 18
31+ 10 9 16 15
Range 0 to 55 0 to 45 0 to 55 0 to 55
Mean 11.75 13.45 16.31 15.37 3.58 .014 .142
Over three quarters of the Maxwell (82%), Pineridge (77%), and Reservoir Ridge (80%) respondents
were from Fort Collins. About half (54%) of the Coyote Ridge visitors were from Fort Collins, with
another quarter (26%) residing in Loveland (Table 4).
Table 4. Top five specific primary residences of visitors to City of Fort Collins natural areas
Coyote
Ridge
%
Maxwell
%
Pineridge
%
Reservoir
Ridge
%
Fort Collins 54 82 77 80
Loveland 26 1 4 3
Greeley 3 2 1 1
Denver 0 1 2 1
Wellington 1 1 1 3

10
In the past 12 months, respondents visited Coyote Ridge an average of 12.79 times; visitors to the other
areas had visited, on average, more frequently: Maxwell (M = 38.59), Pineridge (M = 41.00) and
Reservoir Ridge (M = 25.00) (Table 5).
Table 5. Number of visits to City of Fort Collins natural areas in the past 12 months
City of Fort Collins Natural Area
Coyote
Ridge
%
Maxwell
%
Pineridge
%
Reservoir
Ridge
%
Statistic
χ2 or F
value
p-
value
Effect
Size
V or η
Visits 73.33 < .001 .206
0 (first visit) 16 6 13 10
1 – 2 20 7 9 14
3 – 5 13 11 12 10
6 – 10 23 8 9 17
11 – 20 12 19 15 15
21 – 50 10 30 20 25
More than 50 6 18 22 9
Range 0 to 100 0 to 365 0 to 300 0 to 300
Mean 12.79 38.59 41.00 25.00 12.11 < .001 .248
The number of visits varied by residents (M = 30.90) and non-residents (M = 1.62) (Table 6).
Table 6. Number of visits to City of Fort Collins natural areas
Resident of Larimer County
Non-Resident
%
Resident
%
Test statistic
χ2 or t-value
p-value
Effect Size
V or η
Visits 28.38 < .001 .267
0 (first visit) 54 8
1 – 2 23 12
3 – 5 8 12
6 – 10 15 15
11 – 20 0 17
21 – 50 0 22
More than 50 0 14
Range 0 to 6 0 to 365
Mean 1.62 30.90 12.47 < .001 .094

11
Across all four locations, 39% were hikers, 31% were trail runners, 19% were mountain bikers, and 11%
were wildlife viewers (Table 7).
Table 7. Primary activities at City of Fort Collins natural areas on day of interview
Number Percent
Hiking 229 39
Mountain biking 111 19
Trail running 186 31
Wildlife viewing 63 11
Mountain bikers (M = 42.96 visits) and trail runners (M = 37.02) visited more frequently than wildlife
viewers (M = 23.05) and hikers (M = 16.13) (Table 8).
Table 8. Visitation to City of Fort Collins natural areas by primary activity
Hiking
%
Mountain
Biker
%
Trail
Running
%
Wildlife
Viewing
%
0 (first visit) a 20 3 5 10
1 – 2 19 6 5 28
3 – 5 14 8 10 13
6 – 10 17 14 12 16
11 – 20 12 15 21 13
21 – 50 12 34 30 7
More than 50 6 20 17 13
Mean b 16.13 42.96 37.02 23.05
a χ2 = 115.01, p < .001, Cramer’s V = 257.
b F = 10.71, p < .001, η = .235
Hiking was popular at Coyote Ridge (64%), Pineridge (72%), and Reservoir Ridge (69%). At Maxwell,
the two most popular activities were trail running (48%) and hiking (44%) (Table 9).
Table 9. All activities at City of Fort Collins natural areas on day of interview
City of Fort Collins Natural Area
Coyote
Ridge
%
Maxwell
%
Pineridge
%
Reservoir
Ridge
%
Chi-square
p-value
Cramer’s
V
Hiking 64 44 72 69 27.22 < .001 .216
Mountain biking 20 32 22 13 15.90 .001 .164
Trail running 35 48 24 40 16.70 .001 .166
Wildlife viewing 20 10 21 24 12.60 .006 .139
Photography / Art 11 3 10 8 7.22 .065 .103
Family gathering 6 4 7 5 0.78 .852 .036
Picnicking 1 1 3 3 4.52 .201 .085
Horseback riding 0 0 0 1 2.78 .427 .071
1. Cell entries are percentages for “yes.”

12
At Coyote Ridge, Pineridge and Reservoir Ridge, the primary activity was hiking (42%, 44%, 42%,
respectively). At Maxwell, respondents listed their primary activities as trail running (39%), mountain
biking (30%), and hiking (28%) (Table 10).
Table 10. Primary activity at City of Fort Collins natural areas on day of interview
City of Fort Collins Natural Area
Coyote
Ridge
%
Maxwell
%
Pineridge
%
Reservoir
Ridge
%
Hiking 42 28 44 42
Mountain biking 16 30 19 12
Trail running 30 39 22 33
Wildlife viewing 12 3 15 13
χ2 = 38.98, p < .001, Cramer’s V = .144.
Respondent’s reported primary activities varied by weekdays (Table 11) and weekends (Table 12). For
example, at Coyote Ridge, only 8% listed mountain biking as their primary activity on weekdays, while
17% reported mountain biking as their primary activity on weekends. At Maxwell, 41% indicated hiking
was their primary activity on weekdays, compared to 25% on weekends.
Table 11. Primary activities on weekdays
City of Fort Collins Natural Area
Coyote
Ridge
%
Maxwell
%
Pineridge
%
Reservoir
Ridge
%
Hiking 46 41 43 39
Mountain biking 8 23 23 10
Trail running 42 36 20 39
Wildlife viewing 4 0 13 13
χ2 = 12.55, p = .184. Cramer’s V = .179.
Table 12. Primary activities on weekends
City of Fort Collins Natural Area
Coyote
Ridge
%
Maxwell
%
Pineridge
%
Reservoir
Ridge
%
Hiking 41 25 44 43
Mountain biking 17 31 18 12
Trail running 28 40 23 32
Wildlife viewing 13 4 15 13
χ2 = 34.21, p < .001. Cramer’s V = .150.

13
Nearly two-thirds (62%) of the Pineridge respondents and 57% of the Reservoir Ridge visited alone
(Table 13). At the other two locations (Coyote Ridge and Pineridge) visitation was approximately 50%
alone versus 50% in groups. At all four locations, over 80% of the respondents visited in groups of one or
two. Over 85% did not visit with children.
Table 13. Group characteristics of visitors to City of Fort Collins natural areas
City of Fort Collins Natural Area
Coyote
Ridge
%
Maxwell
%
Pineridge
%
Reservoir
Ridge
%
Statistic
χ2 or F
value
p-
value
Effect
size
V or η
I visited the open space 6.95 .073 .108
Alone 49 62 50 57
With a group 51 39 50 43
Number of people in group 31.49 .002 .129
1 49 61 50 57
2 36 27 33 26
3 7 5 7 9
4 – 5 2 3 11 5
6+ 6 3 0 3
Range 1 to 12 1 to 6 1 to 5 1 to 14
Mean 1.99 1.64 1.85 1.87 1.52 .208 .088
Number of adults in group 28.10 .005 .123
1 56 64 53 58
2 39 28 35 29
3 3 3 5 7
4 – 5 1 1 7 5
6+ 1 3 0 2
Range 1 to 12 1 to 6 1 to 5 1 to 14
Mean 1.58 1.54 1.67 1.73 0.79 .499 .063
Number of children in group 19.58 .021 .109
0 86 94 87 93
1 5 3 10 3
2 2 3 2 2
3+ 7 1 2 2
Range 0 to 7 0 to 3 0 to 3 0 to 5
Mean 0.43 0.10 0.18 0.15 4.89 .002 .156

14
About half (48%) of the hikers were with a group. Over 40% of the trail runners were alone (Table 14).
Table 14. Primary activity by visited alone or with a group
Visited:
Alone
%
With Group
%
Hiking 31 48
Mountain biking 22 15
Trail running 41 21
Wildlife viewing 6 16
χ2 = 50.26, p < .001. Cramer’s V = .289.
Visitation at Other City of Fort Collins Natural Areas
In the past 12 months, Coyote Ridge respondents had also visited Bobcat Ridge (53%), Pineridge (40%)
and Fossil Creek (37%). Maxwell respondents also visited Pineridge (69%), Coyote Ridge (64%) and
Bobcat Ridge (50%). Pineridge visitors were also attracted to Coyote Ridge (57%), and Maxwell (53%).
Over half of the Reservoir Ridge visitors had also visited Coyote Ridge, Maxwell, and Pineridge (Table
15).
Table 15. Visited other City of Fort Collins natural areas over the past 12 months
City of Fort Collins Natural Area
Coyote
Ridge
%
Maxwell
%
Pineridge
%
Reservoir
Ridge
%
Chi-square
p-
value
Cramer’s
V
Coyote Ridge 100 64 57 55 64.13 < .001 .309
Fossil Creek 37 35 34 35 0.42 .937 .027
Maxwell 31 100 53 51 73.50 < .001 .344
Pineridge 40 69 100 51 39.94 < .001 .258
Bobcat Ridge 53 50 37 39 11.36 .010 .138
McMurry 8 16 13 20 11.16 .011 .135
Gateway 10 19 18 20 8.90 .031 .118
Salyer 3 12 12 10 14.48 .002 .143
North Shields Ponds 18 21 23 35 13.51 .004 .154
Arapaho Bend 14 19 19 14 2.54 .468 .066
Ross 3 6 8 3 5.13 .162 .095
1 Cell entries are the percentages of visitors to each location that visited other locations.

15
Reservoir Ridge was the most frequently listed “other” natural area visited (n = 17), followed by
Soapstone Prairie (n = 16), and River Bend Ponds (n = 8) (Table 16).
Table 16. Other natural areas respondents visited
Number of
Responses
Reservoir Ridge 17
Soapstone 16
River Bend 8
Cathy Fromme 7
Horsetooth 4
Prospect Ponds 3
Running Deer 2
Twin Silos 1
Spring Creek Trails 1
Red Fox Meadows 1
Lee Martinez 1
Eagles Nest 1
Carter, Lon Hager 1
Blue Sky, Devils Backbone 1
Respondents were asked if they visited this natural area because it is less crowded: 59% of the Reservoir
Ridge visitors said yes, compared to 44% of the Pineridge visitors, 40% of Coyote Ridge visitors, and
30% of the Maxwell visitors (Table 17). Over 90% of visitors to all locations do not avoid particular City
of Fort Collins natural areas (Table 18). Specific natural areas and reasons for no longer visiting that
location are shown in Table 19. Maxwell was listed seven times. Reasons for not visiting included
crowding and lack of parking (Table 20).
Table 17. Visit because less crowded
City of Fort Collins Natural Area
Do you visit this natural area because
it is less crowded?
Coyote
Ridge
%
Maxwell
%
Pineridge
%
Reservoir
Ridge
%
Yes 40 30 44 59
Not sure 20 20 17 18
No 40 50 39 23
χ2 = 30.40, p < .001, Cramer’s V = .159.
Table 18. City of Fort Collins natural areas respondents no longer visit
City of Fort Collins Natural Area
Do you avoid particular City of Fort
Collins natural areas?
Coyote
Ridge
%
Maxwell
%
Pineridge
%
Reservoir
Ridge
%
No 98 96 93 94
Yes 2 4 7 6
χ2 = 5.67, p = .129. Cramer’s V = .094.
16
Table 19. Specific natural areas respondents no longer visit
Natural area Reason for no longer visiting
Cathy Fromme Lots of snakes
Cathy Fromme Because of vandalism signs
Coyote Ridge Crowded
Coyote Ridge Lack of facilities makes it hard
Coyote Ridge Not enough parking
Gateway Went with son when he was a baby - now we hike more
Gustav Swanson Homeless people everywhere and dirty
Horsetooth Crowded
Horsetooth Not enough parking
Horsetooth Too busy
Horsetooth Crowded
Maxwell Too many bikers
Maxwell No alternative routes, trail rage!!Need hiking trail and biking trail
Maxwell Crowded and lots of bikes who dont share the trail well
Maxwell Need a separate hike vs. bike trail. Too much trail rage
Maxwell Weekend, afternoons
Maxwell Crowded, lots of rude people not a lot of space
Maxwell Lack of parking
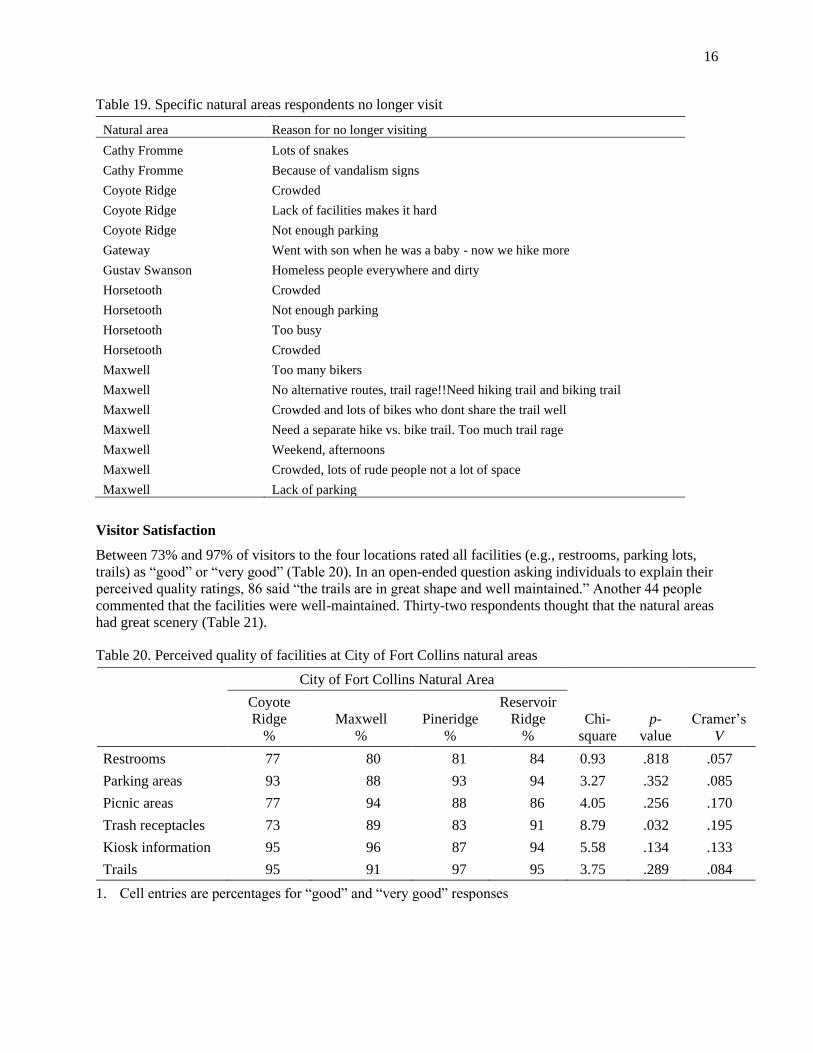
Visitor Satisfaction
Between 73% and 97% of visitors to the four locations rated all facilities (e.g., restrooms, parking lots,
trails) as “good” or “very good” (Table 20). In an open-ended question asking individuals to explain their
perceived quality ratings, 86 said “the trails are in great shape and well maintained.” Another 44 people
commented that the facilities were well-maintained. Thirty-two respondents thought that the natural areas
had great scenery (Table 21).
Table 20. Perceived quality of facilities at City of Fort Collins natural areas
City of Fort Collins Natural Area
Coyote
Ridge
%
Maxwell
%
Pineridge
%
Reservoir
Ridge
%
Chi-
square
p-
value
Cramer’s
V
Restrooms 77 80 81 84 0.93 .818 .057
Parking areas 93 88 93 94 3.27 .352 .085
Picnic areas 77 94 88 86 4.05 .256 .170
Trash receptacles 73 89 83 91 8.79 .032 .195
Kiosk information 95 96 87 94 5.58 .134 .133
Trails 95 91 97 95 3.75 .289 .084
1. Cell entries are percentages for “good” and “very good” responses

17
Table 21. Respondents’ reasons for facility ratings
Category
Response
Number of
Responses
Trails Trails are in great shape and well maintained 86
Facilities Facilities are clean and well maintained 44
Great place This is a beautiful area with great scenery 32
Parking Need more parking 30
Trails Trails show high use/erosion and need maintenance 29
Restrooms Restroom are usually clean 17
Restrooms Restrooms are usually dirty and never have hand sanitizer 16
Trash Need more trash receptacles 16
Nearly all respondents rated the perceived quality of their experience as “excellent:” Coyote Ridge
(100%), Maxwell (98%), Pineridge (98%), and Reservoir (99%) (Table 22). Respondents’ reasons for
their overall evaluations included natural beauty (n = 88), well managed trails (n = 59), accessible (n =
43) and well maintained (n = 37) (Table 23).
Table 22. Overall perceived quality of City of Fort Collins natural areas
City of Fort Collins Natural Area
Coyote
Ridge
%
Maxwell
%
Pineridge
%
Reservoir
Ridge
%
1 Poor 0 0 0 0
2 0 0 0 0
3 Neutral 1 2 3 1
4 31 27 39 32
5 Excellent 69 71 59 67
χ2 = 6.94, p = .327, V = .076.

18
Table 23. Respondents’ reasons for overall perceived quality ratings
Number of
Responses
Overall Natural beauty 88
Trails Well managed trails 59
Access Accessible 43
Overall Well managed and maintained 37
Overall Cleanliness of area 23
Overall This is my favorite place 10
Wildlife Varied habitat 9
Use Great biking trails 7
Trash No trash 4
Signage Good signage 3
Use Sometimes too busy 3
Use Too crowded with rude mountain bikers 3
Use Great for hiking 3
Use Not very crowded 3
Parking Great parking 2
Trails Trails are a little rutted out and muddy 2
Use Need more trails for mountain biking 2
Wildlife Lots of wildlife 2
Dogs Dog waste on trails 1
Dogs Excellent places to walk with my dog 1
Parking Parking can sometimes be difficult 1
Restroom No bathroom 1
Restrooms Bathroom is well kept, and trash is always picked up 1
Signage Mile markings would be great 1
Trails Some graffiti over by reservoir by the cave and along the trail 1
Use Sometimes too packed with users on the narrower trails. 1
Use Some crowding with bikes 1
Use The trails get "wider" every year from use 1
Use Mountain biking trails need a lot of work 1

19
Perceived Conflict
Eighty percent or more of all respondents “never” observed hikers, mountain bikers or equestrian riders
behaving unsafely or discourteously (Table 24). For many of the variables in Table 24, these percentages
are over 90%. Most respondents at all four locations “never” perceived a problem with hikers, mountain
bikers or equestrian riders behaving unsafely or discourteously (Table 25).
Table 24. Unsafe and discourteous behaviors witnessed at City of Fort Collins natural areas 1
City of Fort Collins Natural Area
Percent who “never” observed the behavior
Coyote
Ridge
%
Maxwell
%
Pineridge
%
Reservoir
Ridge
%
Chi-
square
p-
value
Phi
Saw hikers behaving
unsafely 94 91 93 94 1.19 .756 .046
Saw mountain bikers behaving
unsafely 80 83 81 86 3.74 .291 .079
Saw equestrian riders behaving
unsafely 100 99 97 98 7.58 .056 .098
Witnessed hikers being
discourteous 91 92 94 94 1.41 .704 .049
Witnessed mountain bikers being
discourteous 82 84 85 84 0.72 .870 .035
Witnessed equestrian riders being
discourteous 100 97 98 97 7.90 .048 .090
1. Percent of respondents who “never” observed the behavior
Table 25. Perceived problems with other visitors at City of Fort Collins natural areas 1
City of Fort Collins Natural Area Percent who “never” experienced the problem behavior
Coyote
Ridge
%
Maxwell
%
Pineridge
%
Reservoir
Ridge
%
Chi-
square
p-
value
Phi
Hikers hiking
unsafely 76 70 80 77 3.67 .299 .080
Mountain bikers riding
unsafely 60 46 56 60 7.66 .053 .115
Equestrian riders riding
unsafely 85 83 85 82 0.87 .833 .039
Hikers being
discourteous 75 60 77 72 11.64 .009 .144
Mountain bikers being
discourteous 61 52 64 63 5.06 .168 .094
Equestrian riders being
discourteous 83 82 83 79 1.02 .796 .042
1. Percent of respondents who “never” experienced the problem behavior

20
Few respondents listed any specific problems with safety concerns. For example, four individuals
indicated that dogs off leash was a problem (Table 26). Written complaints about mountain bikers
included riding too fast (n = 22), not giving a warning when passing (n = 13), and not yielding the right of
way (n = 10) (Table 27). Horse waste on the trail was noted by three individuals as a problem (Table 28).
Table 26. Respondent explanations for unsafe hiking
Number of
Responses
Dogs off leash 4
Headphones 2
Messing with rattlesnakes 2
Off trail 2
Ear buds are a huge problem 1
Not paying attention to surroundings 1
Dog waste dropped 1
Poor trail etiquette 1
Really fast, no passing warning 1
Spreading out, not yielding to uphill traffic 1
Trail etiquette 1
Table 27. Respondent explanations for unsafe mountain biking
Number of
Responses
Riding too fast 22
No warning 13
Not yielding 10
Riding too fast – Not yielding 5
Trail etiquette 3
No helmets 2
Riding too fast – No passing warning 2
Riding too close to horse 1
Table 28. Respondent explanations for unsafe horseback riding
Number of
Responses
Horse waste on trail 3
Riding out of control 1
Carrying firearms 1

21
Written complaints regarding discourteous behaviors are listed in Tables 29 through 31. Six individuals
thought hikers were rude and five people complained about hikers going off trail. Twenty three people
were bothered by mountain bikers not yielding, 14 thought bikers ride too fast, and 11 indicated that
bikers pass without warning was a problem. Five respondents listed horse waste on the trail was
discourteous.
Table 29. Respondent explanations for discourteous hiking
Number of
Responses
Being rude 6
Hiking off trail 5
Playing loud music 4
Not yielding 3
Dogs off leash 2
Leaving dog waste bags 2
Not picking up dog waste 2
Walking multiple people across 2
Yelling at mountain bikers 2
Littering 1
Spray painting rocks 1
Table 30. Respondent explanations for discourteous mountain biking
Number of
Responses
Not yielding 23
Riding too fast 14
Passing without warning 11
Being rude 2
Table 31. Respondent explanations for discourteous horseback riding
Number of
Responses
Leaving horse waste on trail 5
Riding off trail 1
Not yielding 1
Combining the observed behaviors in Table 24 with the corresponding perceived problem behaviors in
Table 25 resulted in the distributions shown in Table 32. Across all four locations, over two thirds of
respondents reported no conflict regarding safety issues with hikers or equestrian riders. Between 17%
and 23% expressed social values conflict and less than 10% noted interpersonal safety conflicts with
hikers and horseback riders.
Interpersonal conflicts with safety were more evident with mountain bikers (Table 32). Between 13%
(Pineridge) and 20% (Coyote Ridge) noted this type of conflict. Social values conflict regarding safety
ranged from 23% (Coyote Ridge) to 41% (Maxwell).

22
Across all locations, 57% of respondents reported no conflict associated with discourteous behaviors by
hikers or equestrian riders (Table 32). For these two activities interpersonal conflict ranged from 1% to
8%. Interpersonal conflict stemming from discourteous behavior by mountain bikers ranged from 12%
(Pineridge) to 19% (Coyote Ridge).
Table 32. Perceived conflict at City of Fort Collins natural areas
City of Fort Collins Natural Area
Coyote
Ridge
%
Maxwell
%
Pineridge
%
Reservoir
Ridge
%
Chi-
square
p-
value
V
Hikers hiking unsafely 7.35 .289 .094
No conflict 73 68 81 74
Interpersonal conflict 4 9 2 7
Social values conflict 23 23 17 19
Mtn. bikers riding unsafely 11.44 .076 .118
No conflict 57 42 57 54
Interpersonal conflict 20 17 13 14
Social values conflict 23 41 30 32
Equestrian riders riding unsafely 4.04 .671 .064
No conflict 83 80 86 80
Interpersonal conflict 0 1 0 1
Social values conflict 17 19 14 19
Hikers being discourteous 10.39 .109 .112
No conflict 71 58 77 67
Interpersonal conflict 7 8 3 8
Social values conflict 22 34 19 25
Mtn. bikers being discourteous 6.97 .324 .094
No conflict 57 48 63 57
Interpersonal conflict 19 17 12 18
Social values conflict 24 25 25 25
Equestrians being discourteous 8.07 .233 .089
No conflict 80 78 84 75
Interpersonal conflict 0 3 1 3
Social values conflict 20 19 15 22

23
Encounters with others and Perceived Crowding
The average number of reported encounters with hikers at the trailhead ranged from 3.05 (Pineridge) to
7.62 (Coyote Ridge) (Table 33). The average number of encounters with mountain bikers at the trailhead
was lower and ranged from 0.48 (Reservoir Ridge) to 3.05 (Coyote Ridge). Average encounters with
equestrian riders at the trailhead was consistently less than one.
On the trail, encounters with hikers ranged from a mean of 7.80 at Reservoir Ridge to 13.79 at Coyote
Ridge (Table 33). Encounters with mountain bikers on the trail averaged 2.26 at Reservoir Ridge to
slightly over six at Coyote Ridge and Maxwell. Encounters with horseback riders on the trail again
averaged less than one.
Table 33. Reported number of other visitors seen at City of Fort Collins natural areas
City of Fort Collins Natural Area 1
Coyote
Ridge
Maxwell
Pineridge
Reservoir
Ridge
F-
test
p-
value
Eta
Number seen at the trailhead
Hikers 7.62 4.63 3.05 3.29 14.93 < .001 .276
Mountain bikers 3.05 2.47 1.65 .48 10.85 < .001 .243
Horseback riders 0.09 0.05 0.03 0.05 0.74 .526 .065
Number seen on the trail
Hikers 13.79 11.01 11.00 7.80 10.13 < .001 .230
Mountain bikers 6.39 6.07 5.45 2.26 18.45 < .001 .306
Horseback riders 0.15 0.09 0.14 0.15 0.27 .843 .040
1. Cell entries are means
Given the findings in Table 33, it is not surprising perceptions of crowding were relatively low (Table
34). Less than 25% of respondents at Coyote Ridge, Pineridge, or Reservoir Ridge reported any level
crowding (i.e., scale points 3 thru 9 in Figure 2) by hikers at the trailhead or on the trail. Perceptions of
crowding from hikers were slightly higher at Maxwell: 28% at trailhead and 40% on the trail. A similar
pattern of crowding from mountain bikers occurred at the four locations (Table 34). Less than 25% felt
any level of crowding at the trailhead or on the trail at Coyote Ridge, Pineridge or Reservoir Ridge. At
Maxwell, 19% felt crowded by mountain bikers at the trailhead and 41% felt crowded on the trail. Across
all four locations, 5% or less felt crowded by horseback riders at either the trailhead or on the trail.
Table 34. Perceived crowding at City of Fort Collins natural areas
City of Fort Collins Natural Area
Did you feel crowded by:
Coyote
Ridge
%
Maxwell
%
Pineridge
%
Reservoir
Ridge
%
Chi-
square
p-
value
V
Hikers
At the trailhead 14 28 9 12 20.88 < .001 .199
On the trail 23 40 19 22 18.13 < .001 .183
Mountain bikers
At the trailhead 11 19 10 7 9.56 .023 .134
On the trail 24 41 27 18 19.30 < .001 .188
Horseback riders
At the trailhead 2 5 2 1 4.57 .206 .090
On the trail 1 3 2 2 1.28 .735 .048
1. % crowded includes scale points 3 thru 9 in Figure 2
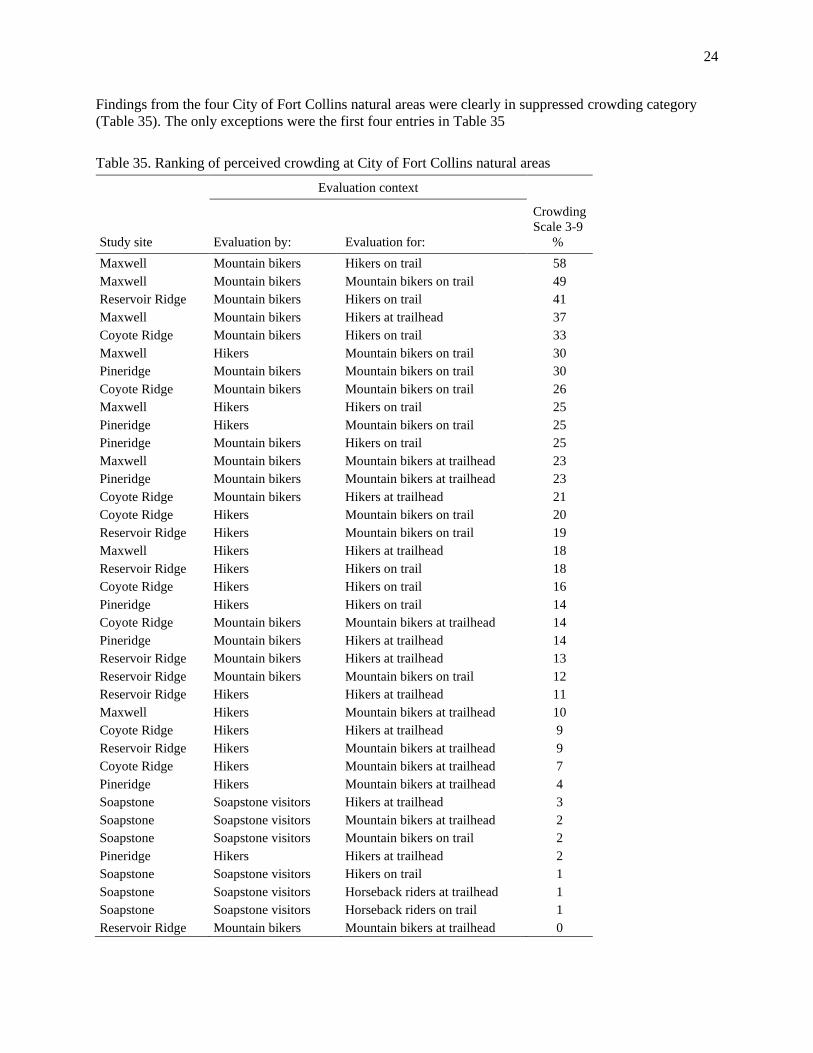
24
Findings from the four City of Fort Collins natural areas were clearly in suppressed crowding category
(Table 35). The only exceptions were the first four entries in Table 35
Table 35. Ranking of perceived crowding at City of Fort Collins natural areas
Evaluation context
Study site Evaluation by: Evaluation for:
Crowding
Scale 3-9
%
Maxwell Mountain bikers Hikers on trail 58
Maxwell Mountain bikers Mountain bikers on trail 49
Reservoir Ridge Mountain bikers Hikers on trail 41
Maxwell Mountain bikers Hikers at trailhead 37
Coyote Ridge Mountain bikers Hikers on trail 33
Maxwell Hikers Mountain bikers on trail 30
Pineridge Mountain bikers Mountain bikers on trail 30
Coyote Ridge Mountain bikers Mountain bikers on trail 26
Maxwell Hikers Hikers on trail 25
Pineridge Hikers Mountain bikers on trail 25
Pineridge Mountain bikers Hikers on trail 25
Maxwell Mountain bikers Mountain bikers at trailhead 23
Pineridge Mountain bikers Mountain bikers at trailhead 23
Coyote Ridge Mountain bikers Hikers at trailhead 21
Coyote Ridge Hikers Mountain bikers on trail 20
Reservoir Ridge Hikers Mountain bikers on trail 19
Maxwell Hikers Hikers at trailhead 18
Reservoir Ridge Hikers Hikers on trail 18
Coyote Ridge Hikers Hikers on trail 16
Pineridge Hikers Hikers on trail 14
Coyote Ridge Mountain bikers Mountain bikers at trailhead 14
Pineridge Mountain bikers Hikers at trailhead 14
Reservoir Ridge Mountain bikers Hikers at trailhead 13
Reservoir Ridge Mountain bikers Mountain bikers on trail 12
Reservoir Ridge Hikers Hikers at trailhead 11
Maxwell Hikers Mountain bikers at trailhead 10
Coyote Ridge Hikers Hikers at trailhead 9
Reservoir Ridge Hikers Mountain bikers at trailhead 9
Coyote Ridge Hikers Mountain bikers at trailhead 7
Pineridge Hikers Mountain bikers at trailhead 4
Soapstone Soapstone visitors Hikers at trailhead 3
Soapstone Soapstone visitors Mountain bikers at trailhead 2
Soapstone Soapstone visitors Mountain bikers on trail 2
Pineridge Hikers Hikers at trailhead 2
Soapstone Soapstone visitors Hikers on trail 1
Soapstone Soapstone visitors Horseback riders at trailhead 1
Soapstone Soapstone visitors Horseback riders on trail 1
Reservoir Ridge Mountain bikers Mountain bikers at trailhead 0

25
Conclusions
This report summarized the findings from a 2017-2018 survey of visitors to four City of Fort Collins
natural areas: Coyote Ridge, Maxwell, Pineridge, and Reservoir Ridge. Visitors were described in terms
of their (1) demographic characteristics (e.g., sex, age, place of residence), (2) prior visitation rates and
trip characteristics (e.g., trip duration, activity participation), (3) visitation to other natural areas, (4)
visitor satisfaction, (5) perceived conflicts with other visitors, and (6) perceived crowding. The intent was
to provide managers with baseline information against which future research results can be compared and
to inform management decisions.
To facilitate understanding the data, the results were couched in terms of indicators and standards for
visitor satisfaction, perceived conflict, and perceived crowding. An indicator is a specific variable that
reflects the current situation. A standard of quality is the minimum acceptable condition for each
indicator. Standards identify desirable conditions (e.g., no litter), and conditions that managers are trying
to achieve. For example, at least X% of visitors should be satisfied with their experience at the natural
area, or no more than Y% of recreationist should feel crowded. Selecting values for X and Y has always
proven challenging for natural resource managers and researchers. This section (1) summarizes how the
indicators and standards for the City of Fort Collins were selected and what the results revealed. (2)
presents more general criteria for choosing indicators and standards, and (3) discusses sources for
selecting indicator and developing standards.
City of Fort Collins Natural Areas Indicators and Standards
This report was based on indicators and standards for visitor satisfaction, perceived conflict and perceived
crowding. The three concepts were selected because they have received the most attention in the natural
resource literature and previous research has suggested standards for their application. Meta-analyses of
the satisfaction research (e.g., Vaske et al., 1982; Vaske & Roemer, 2013), for example, has consistently
found that non-consumptive recreationists (e.g., hiker, mountain bikers) report higher levels of
satisfaction than consumptive recreationists (e.g., hunters, anglers). This study focused on non-
consumptive visitors. Based on the literature, the standard was set at 80% or more of the visitors should
be satisfied with their experiences at City of Fort Collins natural areas. Results for the quality of specific
facilities indicated that this standard was met or exceeded for all four natural areas across all six facilities
with only three exceptions. All three exceptions were at Coyote Ridge: restrooms (77%), picnic areas
(77%), and trash receptacles (73%). The standard was also achieved across all four areas for the overall
perceived quality of the experience. Nearly all respondents rated the perceived quality of their experience
as “excellent:” Coyote Ridge (100%), Maxwell (98%), Pineridge (98%), and Reservoir (99%).
For perceived conflict, the literature suggested that the magnitude of conflict depends on the
characteristics of: (1) the activity (e.g., consumptive vs. non-consumptive, traditional vs. non-traditional),
(2) the visitors (e.g., tolerances for other user groups, perceived similarities between the groups), (3) the
environment (e.g., unpaved vs. paved trails that allow for faster speeds), and (4) management (e.g.,
zoning to separate potentially incompatible activities). Given the activities and conditions at the four
natural areas, the standard was set at no more than 25% of the respondents should experience
interpersonal conflict. This standard was met or exceeded across all areas, activities (hiking, mountain
biking, horseback riding) and behaviors (i.e., acting unsafely or discourteous).
The perceived crowding literature (Shelby et al., 1989; Vaske & Shelby, 2008) has suggested a standard
of < 35% of visitors should feel any level of crowding (i.e., scale points 3 thru 9 on the crowding scale,
Figure 2). This report examined this standard for 38 City of Fort Collins evaluation contexts. An example
evaluation context might refer to mountain bikers’ evaluations of hikers on the trail at Coyote Ridge, or
hikers’ evaluations of mountain bikers at the trailhead at Pineridge. The < 35% perceived crowding
standard was met or exceed 34 of the 38 contexts. The four exceptions were:
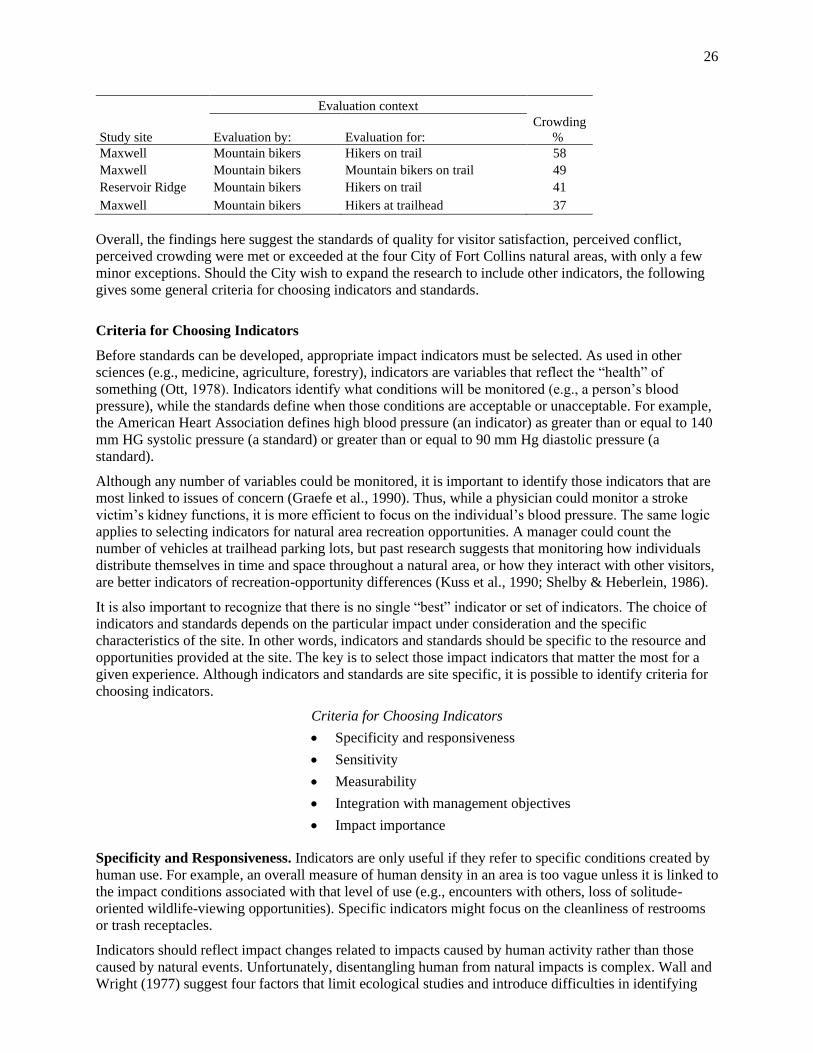
26
Evaluation context
Study site Evaluation by: Evaluation for:
Crowding
%
Maxwell Mountain bikers Hikers on trail 58
Maxwell Mountain bikers Mountain bikers on trail 49
Reservoir Ridge Mountain bikers Hikers on trail 41
Maxwell Mountain bikers Hikers at trailhead 37
Overall, the findings here suggest the standards of quality for visitor satisfaction, perceived conflict,
perceived crowding were met or exceeded at the four City of Fort Collins natural areas, with only a few
minor exceptions. Should the City wish to expand the research to include other indicators, the following
gives some general criteria for choosing indicators and standards.
Criteria for Choosing Indicators
Before standards can be developed, appropriate impact indicators must be selected. As used in other
sciences (e.g., medicine, agriculture, forestry), indicators are variables that reflect the “health” of
something (Ott, 1978). Indicators identify what conditions will be monitored (e.g., a person’s blood
pressure), while the standards define when those conditions are acceptable or unacceptable. For example,
the American Heart Association defines high blood pressure (an indicator) as greater than or equal to 140
mm HG systolic pressure (a standard) or greater than or equal to 90 mm Hg diastolic pressure (a
standard).
Although any number of variables could be monitored, it is important to identify those indicators that are
most linked to issues of concern (Graefe et al., 1990). Thus, while a physician could monitor a stroke
victim’s kidney functions, it is more efficient to focus on the individual’s blood pressure. The same logic
applies to selecting indicators for natural area recreation opportunities. A manager could count the
number of vehicles at trailhead parking lots, but past research suggests that monitoring how individuals
distribute themselves in time and space throughout a natural area, or how they interact with other visitors,
are better indicators of recreation-opportunity differences (Kuss et al., 1990; Shelby & Heberlein, 1986).
It is also important to recognize that there is no single “best” indicator or set of indicators. The choice of
indicators and standards depends on the particular impact under consideration and the specific
characteristics of the site. In other words, indicators and standards should be specific to the resource and
opportunities provided at the site. The key is to select those impact indicators that matter the most for a
given experience. Although indicators and standards are site specific, it is possible to identify criteria for
choosing indicators.
Criteria for Choosing Indicators
• Specificity and responsiveness
• Sensitivity
• Measurability
• Integration with management objectives
• Impact importance
Specificity and Responsiveness. Indicators are only useful if they refer to specific conditions created by
human use. For example, an overall measure of human density in an area is too vague unless it is linked to
the impact conditions associated with that level of use (e.g., encounters with others, loss of solitude-
oriented wildlife-viewing opportunities). Specific indicators might focus on the cleanliness of restrooms
or trash receptacles.
Indicators should reflect impact changes related to impacts caused by human activity rather than those
caused by natural events. Unfortunately, disentangling human from natural impacts is complex. Wall and
Wright (1977) suggest four factors that limit ecological studies and introduce difficulties in identifying

27
human impacts: (1) there are often no baseline data for comparison to natural conditions; (2) it is difficult
to disentangle the roles of humans and nature; (3) there are spatial and temporal discontinuities between
cause and effect; and (4) in light of complex ecosystem interactions, it is difficult to isolate individual
components. Some impacts take the form of naturally occurring processes that have been speeded up by
human interference. Even without human activity, however, severe impacts can occur due to natural
causes that render the impacts associated with recreational use insignificant.
Sensitivity. The indicator needs to be sensitive to changes in conditions during relatively short time
periods; Merigliano (1989) suggests within one year. Such changes may be reflected in biological
conditions (e.g., the amount of erosion on a given trail) or the human experience (e.g., the frequency of
encounters with others). If the indicator only changes after impacts are substantial or never changes, the
variable lacks the early warning signs that allow managers to be proactive.
General measures of overall visitor satisfaction, for example, is often a major management objective and
has been one of the most commonly used indicators of recreation quality. If, as traditionally assumed,
enjoyment from a recreation experience is inversely correlated with the number of people present,
reported overall satisfaction ratings should provide the basis for setting standards. Studies in a variety of
settings, however, have consistently found that recreationists are generally satisfied with their experience
independent of the use intensities they experienced (Kuss et al., 1990).
A variety of explanations have been offered to account for these findings. For example, to cope with the
negative consequences of increasing numbers of visitors (e.g., loss of solitude), some individuals modify
their standards for what is acceptable. The end result is a “product shift” or change in the character of the
experience at a given area. Other people who are more sensitive to user densities may stop visiting an area
all together if adjustments, either attitudinal (product shift) or behavioral (e.g., visiting during off peak
times, visiting less frequently), fail to bring about the desired experience. With all of these explanations,
the current visitors to a heavily used area may be as satisfied as visitors 5 or 10 years ago when use levels
were much lower, but are receiving a different type of experience.
While overall satisfaction measures are not always sensitive to changing use conditions, other measures
of recreation quality do show the requisite variation. Perceived crowding, for example, combines the
descriptive information (the density or encounter level experienced by the individual) with evaluative
information (the individual’s negative evaluation of that density or encounter level). When people
evaluate an area as crowded, they have at least implicitly compared the impact they experienced with
their perception of a standard. Findings from the comparative analysis of 181 crowding studies and 615
different settings and activities indicated that crowding varied across recreational settings and activities,
time or season of use, resource availability, accessibility, or convenience, and management strategies
designed to limit visitor numbers (Vaske & Shelby, 2008). This variability has allowed recreation
researchers and managers to use crowding as a useful indicator.
Measurability. Indicators should be easily and reliably measurable in the field. When choosing impact
indicators, it is important to specify the level of detail at which selected indicators will be measured and
evaluated. The scale of measurement may range from sophisticated indices using quantitative
measurements to subjective visual rating schemes. The choice of an appropriate level of measurement
depends on such factors as the availability of funding and personnel, number of sites that must be
evaluated, and frequency of measurement and site evaluation.
To illustrate, early crowding studies employed multiple-item scales (Shelby et al. 1989). While such
scales consider a concept from different points of view and provide the data necessary for estimating
reliability coefficients, the mathematical calculations involved in combining survey items into a single
scale score sometimes make it difficult to compare results and can render the findings less understandable
to managers (Vaske & Shelby, 2008). To overcome these problems, the single item crowding indicator
discussed here that asks people to indicate how crowded the area was at the time of their visit overcomes
these problems.
The crowding measure alone is not a perfect substitute for information about use levels, impacts, and
evaluative standards that a more complete study can provide. Nevertheless, one can easily collect data

28
with a single crowding item, thereby providing considerable insight about a study site. The single-item
crowding measure is easy to interpret and compare across studies, and has been widely used in outdoor-
recreation research (Shelby et al. 1989; Vaske & Shelby, 2008). The consistency of these findings makes
the crowding measure a good indicator for addressing social impacts.
Integration with Management Objectives. Indicators need to be linked to the management objectives
that specify the type of experience to be provided. For example, if a management objective is to provide a
low-density backcountry experience, the indicators should focus on the number of encounters between
visitors, perceptions of crowding, and encounter norm tolerances. Alternatively, if a management
objective involves frontcountry opportunities, the indicators might be linked to visitor safety and the
cleanliness of facilities.
Useful impact indicators are those that can be treated by management prescriptions. A seemingly eloquent
solution to a human-caused impact that cannot be addressed by management actions does not resolve the
problem condition. The most useful indicators reflect multiple impact conditions. Because managers
typically have small monitoring budgets, indicators that can be used to represent several different impacts
allow managers to focus their attention and efforts while being reasonably assured that the overall quality
of a given experience is maintained. Crowding or norm tolerances are examples that often reflect several
other interaction-type indicators such as encounters with others.
The concept of norms provides a theoretical framework for collecting and organizing information about
users’ evaluations of conditions and has proven to be sensitive to changing use conditions. As defined by
one research tradition, norms are standards that people use to evaluate behavior or the conditions created
by behavior as acceptable or unacceptable (see Vaske & Whittaker, 2004 for a review). Norms define
what behavior or conditions should be, and can apply to individuals, collective behavior, or management
actions designed to constrain collective behavior. This normative approach allows researchers to define
social norms, describe a range of acceptable behavior or conditions, explore agreement about the norm,
and characterize the type of norm (e.g., no tolerance, single tolerance, or multiple tolerance norms;
Whittaker & Shelby, 1988).
Normative concepts in natural-resource settings were initially applied to encounter impacts in
backcountry settings (encounter norms measure tolerances for the number of contacts with other users).
The focus on encounters in backcountry worked because encounter levels were generally low, survey
respondents could count and remember them, and encounters have important effects on the quality of
experiences when solitude is a feature. Most studies showed that encounter norms across these
backcountry settings were stable and strongly agreed upon, usually averaging about four encounters per
day (Vaske. Shelby, Graefe, & Heberlein, 1986).
More recently, norm concepts and methods have been applied to a greater diversity of impacts and
settings. Research on encounter norms in higher-density frontcountry settings, for example, has
demonstrated more variation in visitors’ tolerances for others as well as lower levels of agreement
(Donnelly et al., 2000). This led some researchers to examine norms for interaction impacts other than
encounters (Vaske & Whittaker, 2004). Norms for recreationist proximity, percentage of time within sight
of others, incidents of discourteous behavior, competition for specific resources, and waiting times at
access areas have all been examined. These alternative interaction impacts are often more salient than
encounters in higher-use settings. Taken together, this work suggests that normative data are sensitive to
changing use conditions, can facilitate understanding visitors’ evaluations of social and environmental
conditions, and have proven helpful to managers.
Normative standards may also provide a gauge for estimating benefits to society. If, for example, a
management objective is to enhance the flow of dollars into a community’s economy by creating more
recreation opportunities, one indicator might be the occupancy rate at local motels. The standard in this
situation might be 50% occupancy.

29
Impact Importance. Finally, and most importantly, indicators should represent important impacts. For
example, if managers, stakeholders and visitors are not concerned about a social impact or researchers are
not able to show how an impact negatively influences environment, developing standards is difficult to
justify. If wildlife viewers are more interested in photographing elk than the number of people standing
next to them, frequency of seeing elk becomes a better indicator of quality experiences than social-
interaction variables. Alternatively, if visitors consider solitude in viewing experiences as more important
than number of animals seen, encounters with other visitors becomes an important quality indicator.
Characteristics of Good Standards
Specific standards are established for each impact indicator and define an acceptable level of impact for
each indicator. Just as impact indicators reflect management goals and objectives, standards are
quantifiable value judgments concerning what the agency is attempting to achieve. Based on previous
work (Graefe et al., 1990), the following discusses several important characteristics of good standards.
• Quantifiable
• Time Bounded
• Attainable
• Output Oriented
Quantifiable. Standards restate management objectives in quantitative terms. A good standard
unequivocally states the level of acceptable impact. Such statements define how much is acceptable in
quantitative terms. For example, a good standard might specify that visitors should be able to watch
wildlife with fewer than 10 other people present. Specifying that there should only be “a few other people
present” is not a good standard because it does not define how many constitutes “a few.”
Time Bounded. “Time-boundedness” complements the quantifiable component of a good standard.
Quantifiable standards only state “how much” is appropriate. Time-bounded standards specify “how
much, how often” or “how much by when.” This is especially important for impacts that have a seasonal
component. Seeing 500 elk in Rocky Mountain National Park (ROMO) is a common occurrence for a fall
evening, but a rare event during the summer when the elk are at higher elevations. Such seasonal
differences in viewable wildlife often correlate with fluctuations in visitor numbers. The number of day
visitors to ROMO who are explicitly interested in viewing and photographing elk, for example, is
substantially greater in the fall than other seasons. Time-bounded standards recognize such variation.
Attainable. Management standards need to be reasonably attainable. When standards are too easy, little is
accomplished. If they are too difficult to achieve, both managers and visitors are likely to become
frustrated. Good objectives and standards should “moderately challenge” the manager and staff.
For each important indicator, standards should be set at levels that reflect management’s intent for
resource or experiential outcomes in the area. While standards that are difficult to attain are generally
undesirable, they may still be necessary. A “no litter” standard, for example, may not be attainable, but is
still correct. The cynical excuse for not setting appropriate standards is that managing for some conditions
is “too hard.” On the other hand, management strategies designed to meet a standard may produce
sufficient positive change to warrant the effort. Without standards, it is too easy to do nothing
(management by default).
Output Oriented. Standards should be “output” rather than “input” oriented. This distinction suggests
that managers should focus on the conditions to be achieved rather than the way the standard is met. For
example, a standard that specifies “150 people per day in a wildlife-viewing area” is not a good standard
because it refers to an action (use limits) rather than an acceptable impact. “Less than 10 encounters per
day” or “no more that 35% of the visitors feeling some level of crowding” are better standards because
they emphasize the acceptability of different impact conditions.

30
Sources for Selecting Indicators/Developing Standards
Identifying characteristics of good standards is a useful exercise, but it does not provide much information
about what standards should be (see inset – Different Experiences—Different Indicators and Standards),
or where they should come from. Many different management and research efforts have developed or
recommended various standards, utilizing a variety of techniques or sources of information. A review of
the most common sources and techniques follows.
• Laws and policy mandates
• Manager’s professional judgment
• Biological research
• Public involvement
• Visitor or population surveys
Laws and Policy Mandates. Laws and policy mandates may provide guidelines for selecting specific
impact indicators and developing appropriate standards for desirable wildlife-viewing experiences. Most
laws, however, are written in broad and often vague language. Directives such as “provide high-quality
viewing experiences” or “minimize conflict” lack the specificity necessary to set quantitative standards.
Manager’s Professional Judgment. Managers often develop standards based on their interpretation of laws
and policy mandates, their knowledge of the area, their understanding of the recreation opportunities, and
their knowledge of conditions that define those opportunities. By imposing their idea of what is appropriate,
or even their own personal values, in the decision-making process, managers have implicitly been setting
standards for years. An argument can be made, however, for setting standards more explicitly. First, although
management standards have traditionally been based solely on professional judgment and biological
expertise, the increasingly political nature of all natural-resource actions implies that decisions made in
isolation are likely to generate considerable public scrutiny. Second, although it has been assumed that
managers understand the acceptability of different resource and experiential conditions, empirical evidence
suggests considerable differences between the views of managers, visitors, and organized interest groups
(Magill, 1988; Gill, 1996). By formalizing the process for developing standards and including different points
of view, managers gain a greater understanding of their objectives, have more justification for their actions,
and are able to be more proactive when potential problem situations arise.
Biological Research. Science-based research has been and always will be an important component in
developing standards. Data help clarify what management goals are biologically possible and describe how
management actions affect wildlife impacts. Biological research by itself, however, cannot predict which
alternatives are more or less desirable. For example, scientists are often assumed to be the most appropriate
individuals to set standards for acceptable air- and water-pollution levels. When viewed from the larger
societal perspective, however, this assumption is invalid. The scientific data describe the consequences of
allowing a certain number of pollutants per volume of air or water (e.g., X number of people will die at
contamination level Y). Whether this risk level is considered acceptable depends on legislation or other
government functions. Even at extremely low levels of water pollution, some people are likely to become ill.
It is impossible to set a standard until the acceptability of various risk levels has been identified.
Public Involvement. Traditional public involvement (e.g., focus groups, public meetings) represent another
important strategy for developing standards, especially for social-impact indicators and standards.
Recreationists are experts in identifying the characteristics of an experience they find most important. When
given the opportunity to communicate their preferences, individuals are typically willing to express their
views. Small focus-group meetings with different interest groups, for example, provide a useful starting point
for identifying which impacts matter more. Standards can be developed from input provided by participants
at larger public meetings, but it is often difficult to focus discussion on specific issues at these meetings.
Moreover, individuals who attend public hearings and voice the loudest concerns may not represent all
constituents.
Although these traditional techniques for soliciting citizen participation provide useful information,
managers are increasingly adopting a stakeholder approach to involving public interests. Approaches such

31
as transactive planning and co-management bring diverse interests and stakeholders in direct
communication with one another and with agency decision makers to fashion collaborative solutions to
management challenges. For example, agencies now routinely form citizen task forces, roundtables,
advisory councils, and stakeholder planning teams to assist agency personnel with planning tasks and
decisions. When multiple stakeholders have a voice in developing standards, polarized views about
acceptable conditions and experiences are likely to emerge. Under these conditions, some negotiation and
compromise must occur to develop standards that will be supported by the different publics and interest
groups.
Visitor or Population Surveys. As this report has tried to demonstrate, perhaps the most useful source for
developing standards involves visitor or population surveys. Even the best public-involvement efforts tend to
neglect the “general public” in favor of special-interest groups who voice strong opinions on a topic. When
surveys adhere to scientific principles (e.g., reliability, validity, representativeness, generalizability), the
approach is especially useful for developing standards for social indicators (Vaske, 2008).
First, the survey should include a range of impact conditions and gauge which of those impacts are more
important. Managers may ultimately establish standards for only a few key impact indicators. However,
because surveys are usually conducted before this decision is made, asking about several different types of
impact (e.g., human-interaction impacts) allows some flexibility in choosing different indicators. If
respondents are asked to consider the relative importance of different impacts, the survey can facilitate the
indicator selection process.
Second, questions about users’ personal standards should be direct, involve quantitative response categories,
and be easy to understand. As noted previously, extensive research has failed to demonstrate a consistent
relationship between impact variables (e.g., encounters with others) and general evaluative measures (e.g.,
satisfaction). Most researchers recommend focusing on the evaluation of impacts themselves (Shelby &
Heberlein, 1986). For example, surveys might ask respondents to report the number of encounters they are
willing to have per day or to rate acceptable encounter levels for different experiences. An effective technique
used in several studies involves parallel questions about the amount of impact individuals experienced and
the amount of impact they are willing to tolerate. Statistical comparisons of such results provide data about
where to set standards and allow definition of an impact problem.
Third, when asking about quantitative estimates of acceptable impact levels, respondents should be allowed
to specify that “this impact does not matter to me” or that “the impact matters but I cannot give a number”
(Hall, Shelby, & Rolloff, 1996; Roggenbuck, Williams, Bange, & Dean, 1991). Some wildlife viewers,
especially those with little experience, may not have opinions about acceptable impact levels or may not even
be aware of the impact situation (Donnelly et al., 2000).
Finally, analysis of survey data should go beyond simple frequencies or measures of central tendency. Such
measures are useful starting points, but closer examination of the response distributions reported by different
groups or the level of group agreement are also important for developing standards.
References
Adelman, B. J., Heberlein, T. A., & Bonnicksen, T. M. (1982). Social psychological explanations for the
persistence of a conflict between paddling canoeists and motor craft users in the Boundary Waters
Canoe Area. Leisure Sciences, 5, 45-62.
Blahna, J. B., Smith, K. S., & Anderson, J. A. (1995). Backcountry llama packing: Visitor perceptions of
acceptability and conflict. Leisure Sciences, 17, 185-204.
Bryan, H. (1977). Conflict in the great outdoors: Toward understanding and managing for diverse user
preferences. (Sociological Studies No. 4). Tuscaloosa, AL: University of Alabama, Bureau of
Public Administration.
Carothers, P., Vaske, J. J., & Donnelly, M. P. (2001). Social values versus interpersonal conflict among
hikers and mountain bikers. Leisure Sciences, 23, 47-61.
32
Chavez, D. J. (1999). Mountain biking - A rapidly growing sport. In K. Cordell, (Ed.), Outdoor
recreation in American life: A national assessment of demand and supply trends. (pp. 245-246.
Champaign, Illinois: Sagamore Publishing, Inc.
Decker, D. J., Brown, T. L., & Siemer, W. F. (2001). Human dimensions of wildlife management in North
America. Bethesda, MD: The Wildlife Society.
Donnelly, M. P., Vaske, J. J., DeRuiter, D. S., & King, T. B. (1996). Person-occasion segmentation of
state park visitors. Journal of Park and Recreation Administration, 14(2), 96-106.
Donnelly, M. P., Vaske, J. J., Whittaker, D., & Shelby, B (2000). Toward an understanding of norm
prevalence: A comparative-analysis. Environmental Management, 25, 403-14.
Gill, R. B. (1996). The wildlife professional subculture: The case of the crazy aunt. Human Dimensions of
Wildlife, 1, 60-69.
Graefe, A. R. & Thapa, B. (2004). Conflict in natural resource-based recreation. (pp. 209-224). In M. J.
Manfredo, J. J. Vaske, B. L. Bruyere, D. R. Field, & P. Brown (Eds.), Society and natural
resources: A summary of knowledge. Jefferson, MO: Modern Litho.
Graefe, A. R., Kuss, F. R., & Vaske, J. J. (1990). Visitor Impact Management: The Planning Framework.
Washington, DC: National Parks and Conservation Association.
Hall, T., Shelby, B, & Rolloff, D. (1996). Effect of varied question format on boaters’ norms. Leisure
Sciences, 18, 193-204
Heberlein, T. A., & Vaske, J. J. (1977). Crowding and Visitor Conflict on the Bois Brule River.
(Technical Report WIS WRC 77-04). Madison, WI: University of Wisconsin, Water Resources
Center.
Hendee, J. C. (1974). A multiple satisfaction approach to game management. Wildlife Society Bulletin,
2(3), 104–113.
Hoger, J. L., & Chavez, D. J. (1998). Conflict and management tactics on the trail. Parks and Recreation,
33, 41-56.
Ivy, M. I., Stewart, W. P., & Lue, C. (1992). Exploring the role of tolerance in recreation conflict. Journal
of Leisure Research, 24, 348-360.
Jacob, G., & Schreyer, R. (1980). Conflict in outdoor recreation: A theoretical perspective. Journal of
Leisure Research, 12, 368-380.
Kuss, F. R., Graefe, A. R., & Vaske, J. J. (1990). Recreation Impacts and Carrying Capacity: A Review
and Synthesis of Ecological and Social Research. Washington, DC: National Parks and
Conservation Association.
LaPage, W. F., & Bevins, M. I. (1981). Satisfaction monitoring for quality control in campground
management. USDA Forest Service Research Paper NE–484, Broomall, PA: Northeastern Forest
Experiment Station.
Lucas, R. C. (1964). Wilderness perception and use: The example of the Boundary Waters Canoe Area.
Natural Resources Journal, 3, 394-411.
Magill, A. (1988). Natural resource professionals: The reluctant public servants. The Environmental
Professional, 10, 295-303.
Manfredo, M. J., Fix, P. J., Teel, T. L., Smeltzer, J., & Kahn, R. (2004). Assessing demand for big-game
hunting opportunities: Applying the multiple satisfaction concept. Wildlife Society Bulletin, 32(4),
1147–1155.
Manning, R. E. (2011). Indicators and standards in parks and outdoor recreation. In M. Budruk & R.
Phillips (Eds.), Quality-of-life community indicators for parks, recreation, and tourism
management (pp. 11–22). The Netherlands: Springer.

33
Merigliano, L. (1989). Indicators to monitor the wilderness recreation experience. In D. Lime (Ed.),
Proceedings: Managing America’s enduring wilderness resources symposium (pp. 205–209).
Minneapolis, MN: U.S. Department of Agriculture, Forest Service.
McShea, W. J., Wemmer, C., & Stuwe, M. (1993). Conflict of interests: A public hunt at National Zoo’s
Conservation and Recreation Center. Wildlife Society Bulletin, 21, 492-497.
Moore, R. L. (1994). Conflicts on multiple-use trails: Synthesis of the literature and state of the practice.
The Federal Highway Administration and the National Recreational Trails Advisory Committee,
Federal Highway Administration, U.S. Department of Transportation.
National Park Service. (1997). VERP: The Visitor Experience and Resource Protection (VERP)
Framework: A handbook for planners and managers. Lakewood, CO: U.S. Department of the
Interior, National Park Service, Denver Service Center.
Ott, W. R. (1978). Environmental Indices: Theory and Practice. Ann Arbor, MI: Ann Arbor Science
Publications, Inc.
Ramthun, R. (1995). Factors in user group conflict between hikers and mountain bikers. Leisure Sciences,
17, 159-169.
Roggenbuck, J. W., Williams, D. R., Bange, S. P., & Dean, D. J. (1991). River float trip encounter norms:
Questioning the use of the social norms concept. Journal of Leisure Research, 23, 133-53.
Ruibal, S. (1996). Off-road now means 2 wheels. USA Today, pp. B1, B2.
Shelby, B., & Heberlein, T. A. (1986). Carrying capacity in recreation settings. Corvallis, OR: Oregon
State University Press.
Shelby, B., Vaske, J. J., & Heberlein, T. A. (1989). Comparative analysis of crowding in multiple
locations: Results from fifteen years of research. Leisure Sciences, 11, 269–291.
Stankey, G. H., Cole, D. N., Lucas, R. C., Petersen, M. E., Frissell, S. S. (1985). The Limits of Acceptable
Change (LAC) System for Wilderness Planning (Report INT-176). Ogden, UT: U.S. Department
of Agriculture, Forest Service, Intermountain Forest and Range Experiment Station.
Vaske, J. J. (2008). Survey research and analysis: Application in parks, recreation, and human
dimensions. State College, PA: Venture Publishing, Inc.
Vaske, J. J., & Roemer, J. M. (2013). Differences in reported satisfaction ratings by consumptive and
nonconsumptive recreationists: A comparative analysis of three decades of research. Human
Dimensions of Wildlife, 18(3), 1–22.
Vaske, J. J., & Shelby, L. B. (2008). Crowding as a descriptive indicator and an evaluative standard:
Results from 30 years of research. Leisure Sciences, 30(2), 111–126.
Vaske, J. J., & Whittaker, D. (2004). Normative approaches to natural resources. (pp. 283 – 294). In M. J.
Manfredo, J. J. Vaske, B. L. Bruyere, D. R. Field, & P. Brown (Eds.), Society and natural
resources: A summary of knowledge. Jefferson, MO: Modern Litho.
Vaske, J. J., Donnelly, M. P., & Williamson, B. N. (1991). Monitoring for quality control in state park
management. Journal of Park and Recreation Administration, 9(2), 59–72.
Vaske, J. J., Needham, M. D, & Cline, R. C. (2007). Clarifying interpersonal versus social values conflict
among recreationists. Journal of Leisure Research, 39(1), 182-195.
Vaske, J. J., Beaman, J., Stanley R., & Grenier, M. (1996). Importance performance and segmentation:
Where do we go from here? Journal of Travel and Tourism Marketing, 5(3), 225-240.
Vaske, J. J., Carothers, P., Donnelly, M. P., & Baird, B. (2000). Recreation conflict among skiers and
snowboarders. Leisure Sciences, 22, 297-313.

34
Vaske, J. J., Donnelly, M. P., Heberlein, T. A., & Shelby, B. (1982). Differences in reported satisfaction
ratings by consumptive and nonconsumptive recreationists. Journal of Leisure Research, 14(3),
195–206.
Vaske, J. J., Donnelly, M. P., Wittmann, K., & Laidlaw, S. (1995). Interpersonal versus social-values
conflict. Leisure Sciences, 17(3), 205-222.
Vaske, J. J., Shelby, B, Graefe, A. R., & Heberlein, T. A. (1986). Backcountry encounter norms: Theory,
method, and empirical evidence. Journal of Leisure Research, 18, 137-153.
Vaske, J. J., Whittaker, D., Shelby, B., & Manfredo, M. J. (2002). Indicators and standards: Developing
definitions of quality. In M. J. Manfredo (Ed.), Wildlife viewing in North America: A
management planning handbook (pp. 143–171). Corvallis, OR: Oregon State University Press.
Wall, G., & Wright, C. (1977). The Environmental Impact of Outdoor Recreation. (Publication Series No.
11). Waterloo, Ontario: University of Waterloo, Department of Geography.
Watson, A. E., Williams, D. R., & Daigle, J. J. (1991). Sources of conflict between hikers and mountain
bike riders in the Rattlesnake NRA. Journal of Park and Recreation Administration, 9, 59-71.
Watson, A., Zaglauer, H., & Stewart, S. (1996). Activity orientation as a discriminant variable in
recreation conflict research. In Proceedings of the 1995 Northeastern Recreation Research
Symposium. (Gen. Tech. Rep. NE-218, pp. 103-108). Saratoga Springs, NY: U. S. Department of
Agriculture, Forest Service, Northeastern Forest Experiment Station.
Wellner, A. S. (1997). Americans at play: Demographics of outdoor recreation and travel. New York:
New Strategist Publications.
Whittaker, D., & Shelby, B. (1988). Types of norms for recreation impacts: Extending the social norms
concept. Journal of Leisure Research, 20, 261-73.
Williams, P. W., Dossa, K. B., & Fulton, A. (1994). Tension on the slopes: managing conflict between
skiers and snowboarders. Journal of Applied Recreation Research, 19, 191-213.

35
Appendix A. Ranking of perceived crowding for Colorado resources and evaluation contexts
Evaluation context
Study site Date Evaluation by: Evaluation for:
Crowding
Scale 3-9
%
Mesa Verde National Park 2001 Visitors at Cliff Palace Other visitors 76
Rocky Mountain National Park 2001 Tourists Visitors at Alpine Visitor Center 74
Mt Evans 1994 Deer Hunter Other Deer Hunters 72
Mt Evans 1994 Tourists Regional Survey 70
Rocky Mountain National Park 2001 Hikers Longs Peak Hikers on the Trail 69
Rocky Mountain National Park 2001 Hikers Longs Peak Hikers at the Summit 69
Rocky Mountain National Park 2001 Tourists Trails near Bear Lake 68
Mesa Verde National Park 2001 Visitors at Museum Other visitors - overall 67
Mesa Verde National Park 2001 Visitors at Spruce Tree House Visitors at Spruce Tree House 67
Mesa Verde National Park 2001 Visitors at Museum Other visitors at Museum 66
Rocky Mountain National Park 2001 Tourists Bear Lake by Kiosk 66
Rocky Mountain National Park 2001 Tourists Trail around Bear Lake 65
Mesa Verde National Park 2001 Visitors at Spruce Tree House Other visitors - overall 64
Mesa Verde National Park 2001 Visitors at Step House Other visitors - overall 63
Mt Evans 1994 Tourists Other Tourist 61
Mesa Verde National Park 2001 Visitors at Cliff Palace Other visitors - overall 60
City of Fort Collins – Maxwell 2018 Mountain bikers Hikers on trail 58
Vail Pass White River NF 2003 Nonmotorized Users snowmobilers at trailhead 57
Vail Pass White River NF 2003 Nonmotorized Users snowmobilers on trail 57
Rocky Mountain National Park 2001 Tourists Bear Lake Glacier Basin Shuttle Lot 55
City of Fort Collins – Maxwell 2018 Mountain bikers Mountain bikers on trail 49
Mesa Verde National Park 2001 Visitors at Sun Point Overlook Other visitors 48
Appalachian National Scenic Trail 1999 Non-Thru hiker Other hikers 47
Gunnison Gorge Natl Conserv Area 2002 Gunnison Gorge Wilderness All users 47
Gunnison Gorge Natl Conserv Area 2002 Gunnison River non-wilderness All users 42
City of Fort Collins – Reservoir Ridge 2018 Mountain bikers Hikers on trail 41
Cache la Poudre River 1993 Anglers Other anglers 40
Colorado Reservoirs 1998 Anglers Other anglers 39
Gunnison Gorge Natl Conserv. Area 2002 Flat Top & Peach Valley - OHVs All users 39
Rocky Mountain National Park 2001 Hikers Longs Peak hikers at trailhead 37
City of Fort Collins – Maxwell 2018 Mountain bikers Hikers at trailhead 37
Colorado Reservoirs 1998 Anglers South Catamount Reservoir anglers 35

36
Evaluation context
Study site Date Evaluation by: Evaluation for:
Crowding
Scale 3-9
%
Wolf Creek Pass 2003 Nonmotorized Users Snowmobilers at trailhead 35
Cache la Poudre River 1993 Anglers Evaluations of rafters 34
City of Fort Collins – Coyote Ridge 2018 Mountain bikers Hikers on trail 33
Cache la Poudre River 1993 Kayakers Rafters at the put-in 31
Vail Pass - White River NF 2003 Motorized Users skiers/snowboarders at trailhead 31
Jefferson County 1996 Hikers Bikers 30
Vail Pass - White River NF 2003 Motorized users snowmobilers at trailhead 30
Horsetooth Mountain Open Space 2018 Visitors Hikers on trail 30
City of Fort Collins – Maxwell 2018 Hikers Mountain bikers on trail 30
City of Fort Collins – Pineridge 2018 Mountain bikers Mountain bikers on trail 30
Cache la Poudre River 1993 Anglers Kayakers 29
Vail Pass White River NF 2003 Nonmotorized Users skiers/snowboarders at trailhead 29
Wolf Creek Pass 2003 Nonmotorized Users snowmobilers on trail 29
Vail Pass White River NF 2003 Nonmotorized Users skiers/snowboarders on trail 28
Wolf Creek Pass 2003 Nonmotorized Users skiers/snowboarders on trailhead 27
City of Fort Collins – Coyote Ridge 2018 Mountain bikers Mountain bikers on trail 26
City of Fort Collins – Maxwell 2018 Hikers Hikers on trail 25
City of Fort Collins – Pineridge 2018 Hikers Mountain bikers on trail 25
City of Fort Collins – Pineridge 2018 Mountain bikers Hikers on trail 25
Horsetooth Mountain Open Space 2018 Visitors Hikers at trailhead 24
City of Fort Collins – Maxwell 2018 Mountain bikers Mountain bikers at trailhead 23
City of Fort Collins – Pineridge 2018 Mountain bikers Mountain bikers at trailhead 23
Cache la Poudre River 1993 Rafters Other rafters at the put-in 22
Jefferson County 1996 Bikers and hikers (Dual sport) Bikers 22
Cache la Poudre River 1993 Kayakers Rafters at the take-out 21
City of Fort Collins – Coyote Ridge 2018 Mountain bikers Hikers at trailhead 21
City of Fort Collins – Coyote Ridge 2018 Hikers Mountain bikers on trail 20
Jefferson County 1996 bikers Other bikers 19
City of Fort Collins – Reservoir Ridge 2018 Hikers Mountain bikers on trail 19
Colorado Reservoirs 1998 Anglers Crystall Reservoir anglers 18
Vail Pass White River NF 2003 Motorized Users skiers/snowboarders on trail 18
City of Fort Collins – Maxwell 2018 Hikers Hikers at trailhead 18
City of Fort Collins – Reservoir Ridge 2018 Hikers Hikers on trail 18

37
Evaluation context
Study site Date Evaluation by: Evaluation for:
Crowding
Scale 3-9
%
City of Fort Collins – Coyote Ridge 2018 Hikers Hikers on trail 16
City of Fort Collins – Pineridge 2018 Hikers Hikers on trail 14
City of Fort Collins – Coyote Ridge 2018 Mountain bikers Mountain bikers at trailhead 14
City of Fort Collins – Pineridge 2018 Mountain bikers Hikers at trailhead 14
Cache la Poudre River 1993 Rafters Other rafters on river 13
Cache la Poudre River 1993 Rafters Other rafters at the take-out 13
Mesa Verde National Park 2001 Visitors at Step House Other visitors - at Step House 13
Vail Pass White River NF 2003 Motorized Users snowmobilers on trail 13
Wolf Creek Pass 2003 Motorized Users snowmobilers at trailhead 13
City of Fort Collins – Reservoir Ridge 2018 Mountain bikers Hikers at trailhead 13
Jefferson County 1996 Bikers Hikers 12
Jefferson County 1996 Hikers & bikers (Dual-sport) Hikers 12
Wolf Creek Pass 2003 Nonmotorized Users skiers/snowboarders on trail 12
Wolf Creek Pass 2003 Motorized Users skiers/snowboarders on trail 12
City of Fort Collins – Reservoir Ridge 2018 Mountain bikers Mountain bikers on trail 12
Mesa Verde National Park 2001 Visitors at Sun Point Overlook Visitors at Sun Point Overlook 11
Horsetooth Mountain Open Space 2018 Visitors Mountain bikers on trail 11
City of Fort Collins – Reservoir Ridge 2018 Hikers Hikers at trailhead 11
City of Fort Collins – Maxwell 2018 Hikers Mountain bikers at trailhead 10
Cache la Poudre River 1993 Kayakers Other kayakers at the take-out 9
Jefferson County 1996 Hikers Other Hikers 9
Wolf Creek Pass 2003 Motorized Users Snowmobilers on trail 9
City of Fort Collins – Coyote Ridge 2018 Hikers Hikers at trailhead 9
City of Fort Collins – Reservoir Ridge 2018 Hikers Mountain bikers at trailhead 9
Wolf Creek Pass 2003 Motorized Users Skiers/snowboarders at trailhead 8
Cache la Poudre River 1993 Kayakers Kayakers at the put-in 7
Horsetooth Mountain Open Space 2018 Visitors Mountain bikers at trailhead 7
Cache la Poudre River 1993 Rafters Kayakers on river 7
City of Fort Collins – Coyote Ridge 2018 Hikers Mountain bikers at trailhead 7
Cacvhe la Poudre River 1993 Rafters Kayakers at the put-in 6
Cache la Poudre River 1993 Rafters Kayakers at the take-out 4
Red Mountain Open Space 2018 Visitors Hikers at trailhead 4
Red Mountain Open Space 2018 Visitors Hikers on trail 4

38
Evaluation context
Study site Date Evaluation by: Evaluation for:
Crowding
Scale 3-9
%
City of Fort Collins – Pineridge 2018 Hikers Mountain bikers at trailhead 4
City of Fort Collins 2018 Soapstone visitors Hikers at trailhead 3
Red Mountain Open Space 2018 Visitors Mountain bikers on trail 2
City of Fort Collins 2018 Soapstone visitors Mountain bikers at trailhead 2
City of Fort Collins 2018 Soapstone visitors Mountain bikers on trail 2
City of Fort Collins – Pineridge 2018 Hikers Hikers at trailhead 2
Red Mountain Open Space 2018 Visitors Mountain bikers at trailhead 1
City of Fort Collins 2018 Soapstone visitors Hikers on trail 1
City of Fort Collins 2018 Soapstone visitors Horseback riders at trailhead 1
City of Fort Collins 2018 Soapstone visitors Horseback riders on trail 1
City of Fort Collins – Reservoir Ridge 2018 Mountain bikers Mountain bikers at trailhead 0

39
Appendix B – Additional comments
Number of
Responses
54 Management - Great place
35 Management - Thank you
2 Management - Ban ear buds
1 Management - Too many headphones and radios
1 Management - Entrance road very rough
1 Management - Keep it free
1 Management - Keep it natural
1 Management - Kiosk empty
1 Management - Need better maintenance and parks
1 Management - Need connection between Pineridge & Horsetooth
1 Management - Need hand sanitizer in restroom
1 Management - Need separate trail for horses like at Gowdy
1
Management - No water diversions or "rail road ties" on trail
so dirt has washed away leaving rocks
1
Management - Open a trail from Pineridge to piano keys and
a connector along the power line from 38e and Centenial
1 Management - Road into trailhead need maintenance
1 Management - Small stones make it difficult to hike-->they roll
1 Management - Some musk thistle problems
1 Management - Visitors are courteous and respectful
1 Management - More trails and signs explaining trail etiquette,
2 Coyote Ridge - Need more parking
1 Maxwell - dogs off leash is a problem
1 Maxwell - need signs to encourage audible passing
2 Maxwell - Need more trails
1 Maxwell - too many cyclists
1 Displacement - No longer visit Pineridge, Maxwell, Blue Sky or Horsetooth on the weekends
3 Displacement - Visit weekdays to or early to avoid crowds
2 Dogs - Clean up waste
1 Dogs - Need off leash permit
3 Dogs - Need to be on leash
2 Dogs - Need off leash trails
1 Dogs - Require owners to pick up after their dogs
1 Dogs - Waste bags are a problem
1 Horses - Manure on trails is a problem
1 Mountain biking - Allow mountain bikes on DR trail uphill only (Bobcat ridge)
1 Mountain biking - Educate bikers on all trail etiquette
1 Mountain biking - Need better signage for bikers to show difficulty of trail
1 Mountain biking - Need more audible cyclists
2 Mountain biking - Need more trails
1 Mountain biking - Need restrictions
5 Mountain biking - Need to separate hikers and bikers
1 Mountain biking - Too many discourteous bikers

40
1 Parking - Ample safe parking is a draw for this hike
1 Parking - Don't charge for parking
1 Parking - Too limited
1 Parking - Too much trailer parking
1 Trails - Appreciate trails for multi-use
1 Trails - Don't close trails when it's muddy
1 Trails - Don't spray pesticides on trails
1 Trails - Great
1 Trails - Over to reservoir ridge are in need of maintenance
1 Trails - Well maintained
1 Trails - would like to see more trails go to rocks/cliffs for overlook
1
Trails - Would like to see more trails, better connected-like a direct connector along
the frontside to Reservoir Ridge, Michaud. Seems to be a popular area for dog owners.