Indian Bank Q3FY14 presentation
25
A 02 nd Feb 2015 Chennai
-
Upload
murali-d -
Category
News & Politics
-
view
134 -
download
6
Transcript of Indian Bank Q3FY14 presentation

A
02nd Feb 2015 Chennai

aAbout us
One of the leading PSBs with the Government holding of 81.51% and with a Market Cap of Rs.9720 crore.
Pan India presence with 2389 branches and 2248 ATMs
Also has 3 overseas branches at Singapore, Colombo and Jaffna.
Also has 3 RRBs and 2 Subsidaries.
Servicing 3.86 crore Bank Accounts Pan India
2
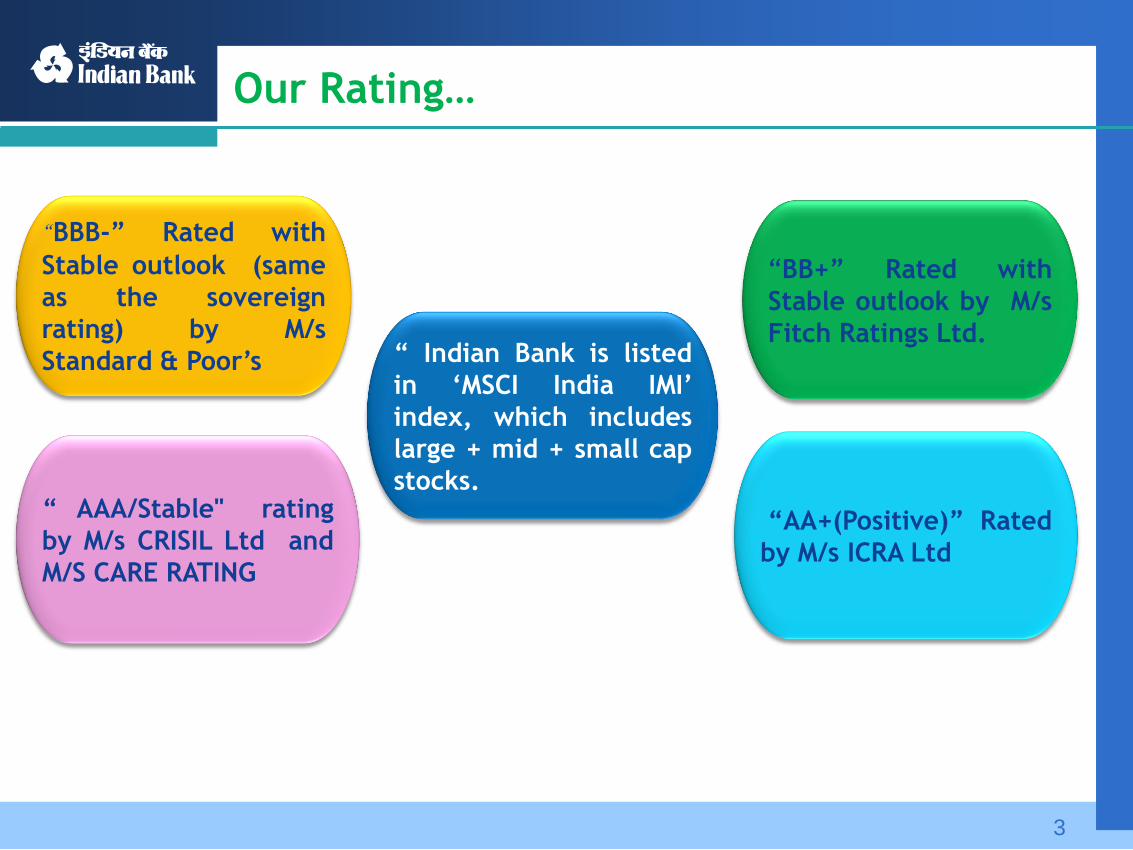
aOur Rating…
“BBB-” Rated with
Stable outlook (same
as the sovereign
rating) by M/s
Standard & Poor‟s
“ AAA/Stable" rating
by M/s CRISIL Ltd and
M/S CARE RATING
“ Indian Bank is listed
in „MSCI India IMI‟
index, which includes
large + mid + small cap
stocks.
“BB+” Rated with
Stable outlook by M/s
Fitch Ratings Ltd.
“AA+(Positive)” Rated
by M/s ICRA Ltd
3

aHighlights of Q3 2014-15
4
26%
Operating Profit
5%
Net Profit
47%
Non Interest Income
164%
Treasury Income
12%
Core Deposits
10%
CASA
9%
Domestic Advances

aHighlights of Q3 2014-15
Retail Business
24.21 lakh accounts opened under PMJDY.
Bank was awarded Rs.65 lakh as cash incentive by NPCI for issuing
maximum Rupay cards.
The Bank shed high cost deposits to the tune of
`11769 crore.
In Home Loan & Vehicle Loan
Mela ` 1900 crore canvassed
in Q3.
MSME campaign canvassed
`1624 crore in Q3.
5

aBusiness
235060
269799282226
Dec-12 Dec-13 Dec-14
CAGR:11%
6
` in crore
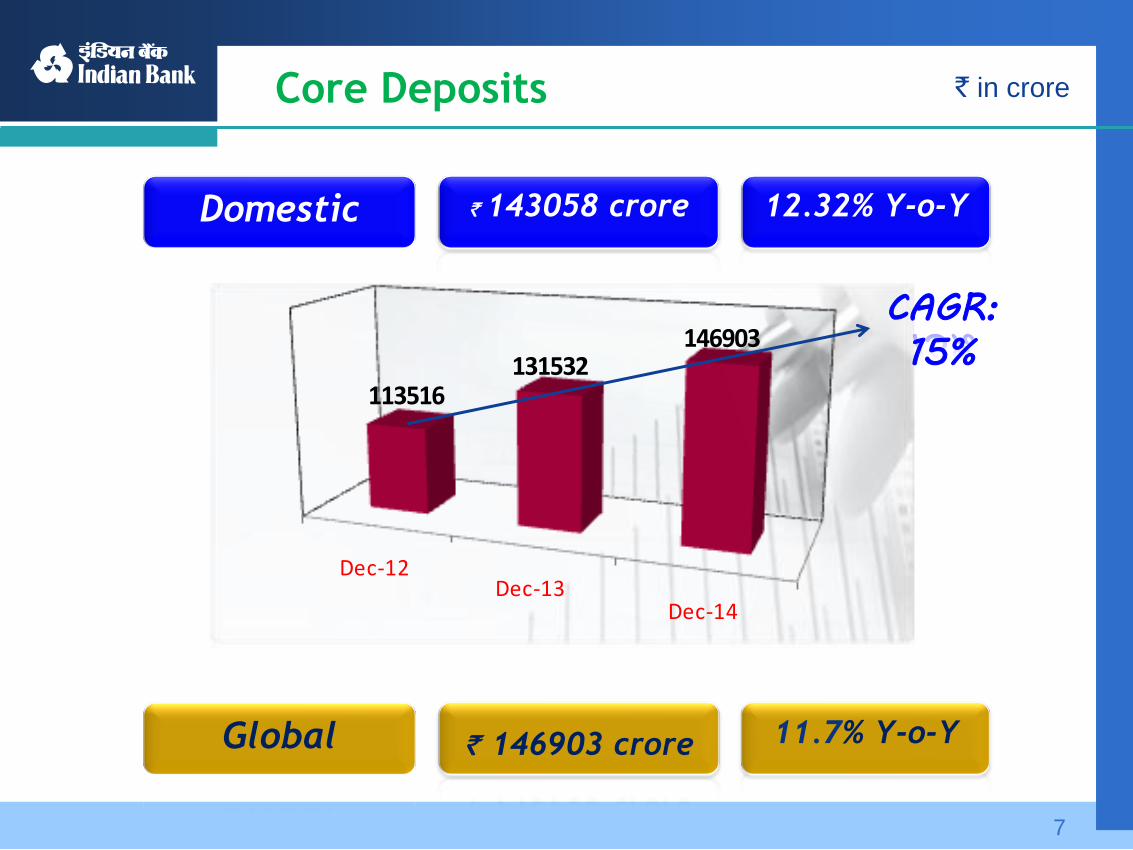
aCore Deposits
Global ` 146903 crore 11.7% Y-o-Y
Domestic ` 143058 crore 12.32% Y-o-Y
Dec-12Dec-13
Dec-14
113516131532
146903CAGR:
15%
7
` in crore
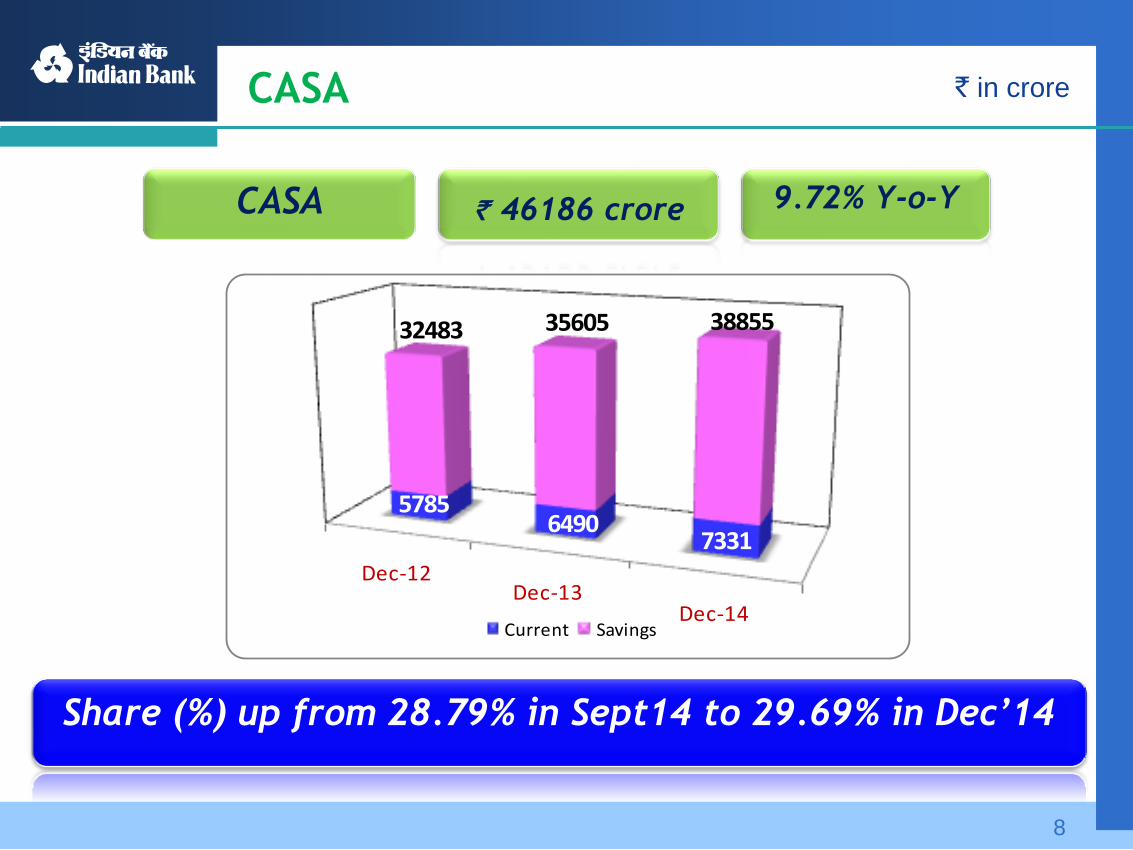
aCASA
CASA ` 46186 crore 9.72% Y-o-Y
Share (%) up from 28.79% in Sept14 to 29.69% in Dec’14
Dec-12Dec-13
Dec-14
57856490
7331
32483 35605 38855
Current Savings
8
` in crore
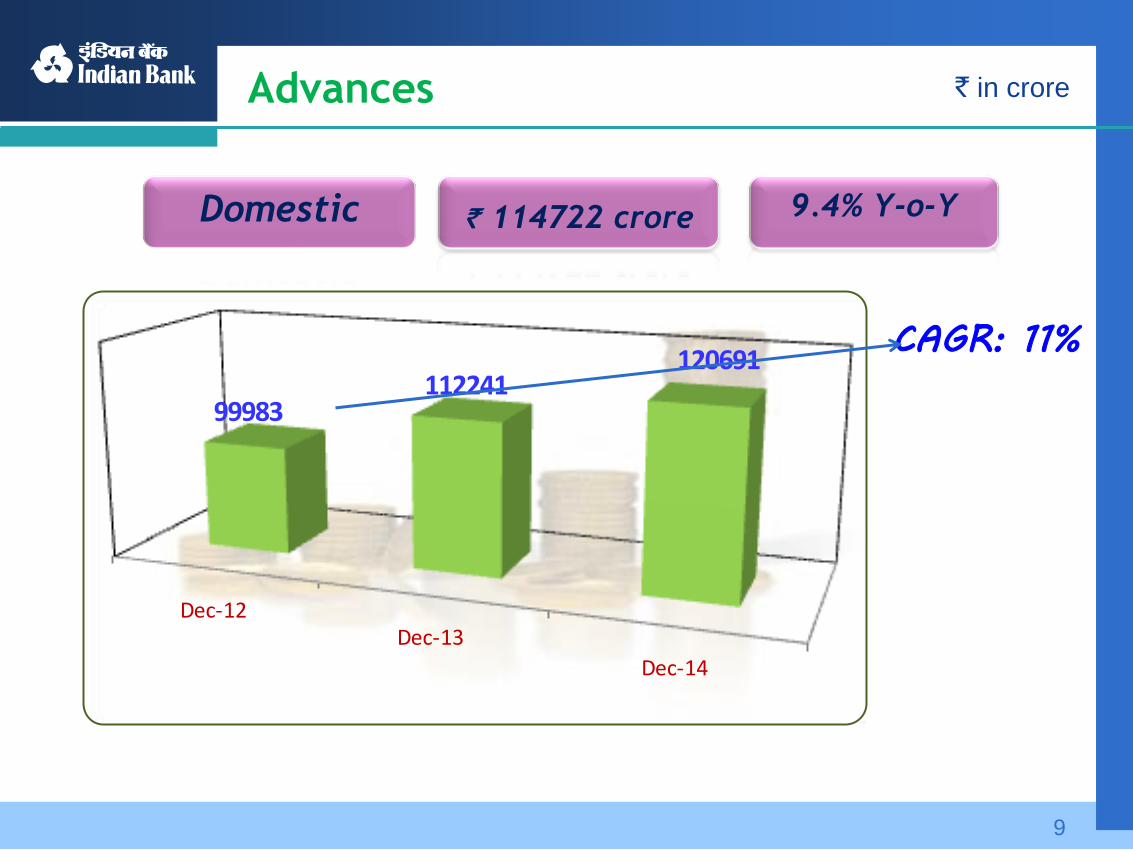
aAdvances
Domestic ` 114722 crore 9.4% Y-o-Y
Dec-12Dec-13
Dec-14
99983112241
120691CAGR: 11%
9
` in crore
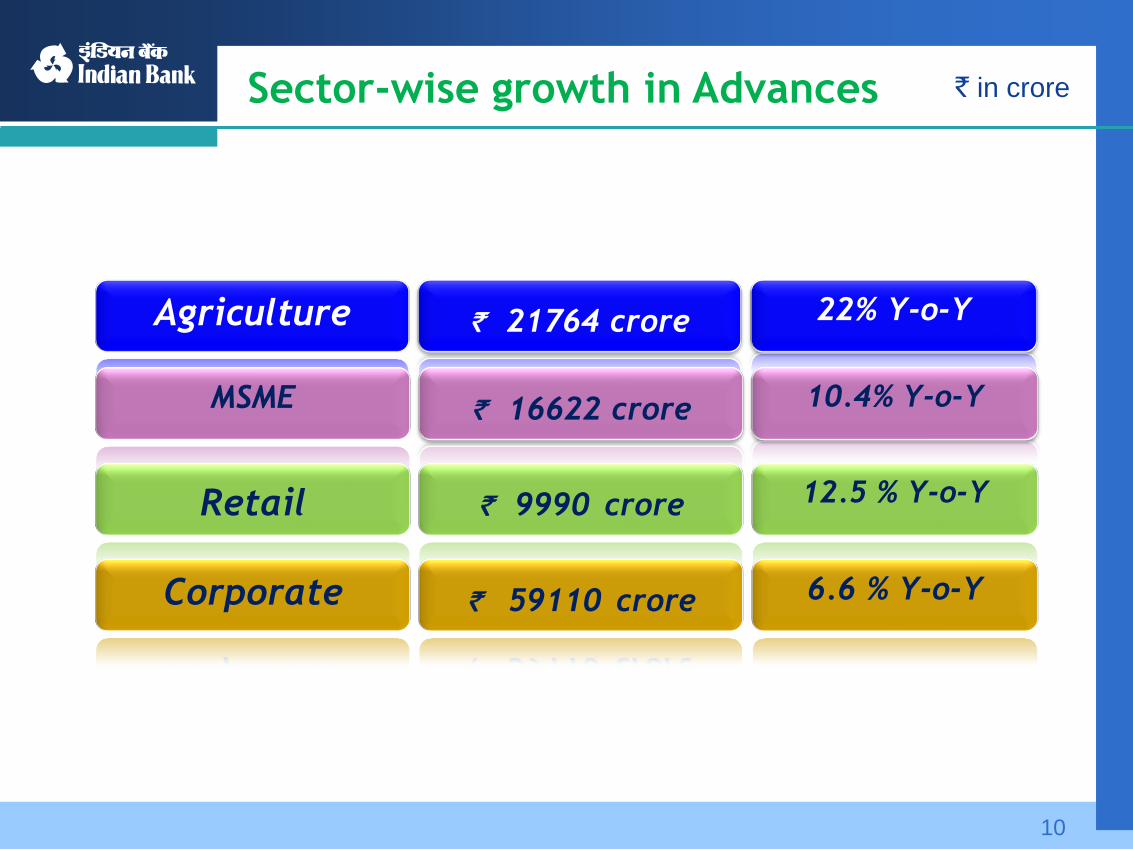
aSector-wise growth in Advances
Agriculture ` 21764 crore 22% Y-o-Y
MSME ` 16622 crore 10.4% Y-o-Y
Retail ` 9990 crore 12.5 % Y-o-Y
Corporate ` 59110 crore 6.6 % Y-o-Y
10
` in crore

aInvestments ` in crore
The Percentage of SLR to NDTL at end Dec’14 was at 25.69%
11
45676 46128
7.6 7.5
Mar -14 Dec -14
Investments (Domestic) and Return on Investments(Qtr)
Mar-14 Dec-14
241 86
0.53% 0.19%
11953 11118
26.17% 24.10%
33482 34924
73.30% 75.71%
4.64 4.78
% Share
% Share
Held to Maturity
Available for sale
Held for Trading
Classification of
Domestic Investments
% Share
M Duration

aFinancial Snap Shot – Quarterly ` in crore
12
Amt (%)
Interest on Advances 2875 3027 152 5.30
Other Income 243 358 115 47.48
of which: Treasury Profit 31 81 51 164.48
Interest Expenditure 2779 2859 80 2.86
Other Expenditure 215 251 36 16.92
Growth over Dec13Parameters 31.12.2013 31.12.2014

aProfitability - Quarter
Operating Profit
` 795 crore
26% Y-o-Y
Net Profit
` 278 crore
5% Y-o-Y
632795
31.12.2013 31.12.2014
Operating Profit Quarterwise (` in crore)
13
31.12.2013 31.12.2014
265 278
Net Profit Quarterwise (` in crore)

aKey Ratios - Quarterly (%)
0.60 0.69 0.60
2.57 2.672.47
31.12.2013 30.09.2014 31.12.2014
ROA and NIM(%)
RoA
NIM
14
10.4310.34
10.24
31.12.2013 30.09.2014 31.12.2014
Yield on Advances(%)
7.21
7.11 7.10
31.12.2013 30.09.2014 31.12.2014
Cost of Deposits (%)

aAsset Quality
15
` in crore
5003.41 5461.05
2975.85 3235.14
4.21 4.52
2.55 2.74
Provision Coverage Ratio (%) 57.41 57.11
30.09.2014 31.12.2014
Gross NPA
Net NPA
Gross NPA (%)
Net NPA (%)
Parameters

aNPA Management –Movement of NPA
16
GROSS / NET NPA (` in crore)
Particulars Global
Gross NPA Opg. Balance 30.09.2014 5003.41
Addition:
Fresh NPA 868.66
Sub-Total 5872.07
Less:
Cash Recovery(Principal) 114.25
Upgradation 140.41Prudential Write off/Exchange 129.11Actual write off 5.23 Assets assigned to ARCs* 22.02Sub-Total 411.02
Gross NPA Closing Balance 5461.05
Gross Advances 120690.84
% of Gross NPA 4.52
Reduction:
Provisions - (NPA + Credit Card) 1904.73
Provision for Restructured NPA 19.39
NET NPA as on 31.12.14 3235.14
NET ADVANCES 118023.80
% of Net NPA 2.74

aQuarterly Sectorwise Fresh NPA
Total Recovery during Q3 at
` 175 crore as against ` 130 crore in Q3 of Previous year.
Fresh
Slippages
during
Q3:
` 869
crore
17
Gross
Advances
Fresh
NPA
Fresh
NPA %
Gross
Advances
Fresh
NPA
Fresh
NPA %
Agriculture 21244 46 0.22% 21764 91 0.42%
Small & Micro ent 13298 150 1.13% 13655 169 1.23%
Housing(Priority) 5089 20 0.39% 5143 19 0.38%
Educational Loans (Priority) 3270 38 1.18% 3077 58 1.88%
Others 417 1 0.25% 368 2 0.51%
Priority - Total 43318 256 0.59% 44006 339 0.77%
Housing - Non -Priority 3149 12 0.38% 3363 12 0.34%
Education - Non Priority 203 1 0.63% 208 2 0.78%
SME - Non Priority 2594 10 0.38% 2576 11 0.44%
Large scale Industries 38416 148 0.39% 39610 254 0.64%
Others 24903 360 1.44% 24959 251 1.01%
Non- Priority - Total 69265 531 0.77% 70716 530 0.75%
Total 112583 787 0.70% 114722 869 0.76%
30.09.2014 31.12.2014SECTOR
` in crore

aRestructured Assets
Of which Standard:
` 9764 crore
Total
Restructured:
` 11777 crore
NPA:
` 2013 crore
18
Sector
Upto
March
2014
Upto Dec
2014
Total
Outstanding
31.12.2014 % share
Agriculture 73.46 21.63 95.09 0.81%
Education 29.85 6.89 36.74 0.31%
Home Loan 14.94 2.38 17.32 0.15%
Non Priority 9226.88 2184.35 11411.23 96.89%
Other Priority 8.71 0.55 9.26 0.08%
SME 149.90 57.66 207.56 1.76%
Total 9503.74 2273.46 11777.20 100.00%
Total
Restructured
during Q3:
` 163 crore
` in crore
Upto March
2014 Dec'14
Power 4868 1240 6108 52 371
Generation 1419 761 2179 19 371
DISCOM 3449 480 3929 33 NIL
Power Sector
Industry
Amount
of which:
Balance
O/S% To Total
Restructure
d Assets
of which
NPA

aCapital Adequacy
CET1: 10.56%
Basel III: 13.06%
19
10.71 10.56 11.3
2.25 2.5 2.5
12.96 13.06 13.8
31.12.2013 31.12.2014 After Plough Back of Profit
CRAR Basel III
Tier II (%) Tier I (%) CRAR as per BASEL III
After Plough back of Profit CRAR would be 13.80%.

aShareholders Value
31.03.2014 30.09.2014 31.12.2014
248
259
265
BOOK VALUE PER SHARE (` )
Networth ` 12334.60
croreBook Value ` 265.35
EPS ` 23.88
20

a Branch Network
2142
2392
31-Dec-2013 31-Dec-2014
No of Branches
21
139 Branches
Opened during Nine
Months Period
Rural69029%
Semi-Urban64327% Urban
60625%
Metro.45019%
Overseas3
Rural Semi-Urban Urban Metro. Overseas

a Alternate Delivery Channels
16802248
31-Dec-2013 31-Dec-2014
No of ATMs
33.5345.33
31-Dec-2013 31-Dec-2014
E Transactions to Total (%)
22
125 ATMs Opened during Nine Months Period

aPattern of Equity holding
Promoters, 81.51
FII, 6.04
Mutual Funds, 4.40
FI, 4.10
Resident, 2.44
Corporate Body, 1.01
Employees, 0.19
Clearing Member, 0.14
NRI, 0.12Bank, 0.05
Trusts, 0.02
Other, 0.51
% of Holdings
23

aPerformance Under PMJDY
Bank has provided thebanking services to all4192 Sub Service Areas(SSAs) & 2053 Urbanwards allotted undervarious SLBCs.
Details No of
Accounts
Basic Savings Bank Deposit Accounts (BSBD Accounts)
Opened under PMJDY as on 30.01.2015:24.21 lakh
Of which:
(i) Rural Accounts: 1525639
(ii) Urban Accounts: 895063
Deposits
Mobilised in
BSBD
Accounts:
Rs 116 crore
Rupay Cards:
2293110
Aadhar Seeded
accounts:
852961
24

Thank you
ACorporate Office,
254-260 Avvai Shanmugam Salai,
Royapettah, Chennai. 600014.
www.indianbank.in
25