India Cotton and Products Annual - USDA GAIN Publications/Cotton...mmt) from 12 million hectares,...
22
THIS REPORT CONTAINS ASSESSMENTS OF COMMODITY AND TRADE ISSUES MADE BY USDA STAFF AND NOT NECESSARILY STATEMENTS OF OFFICIAL U.S. GOVERNMENT POLICY Date: GAIN Report Number: Approved By: Prepared By: Report Highlights: India’s 2013/14 cotton production is forecast at 34.5 million 170 kg bales (26.9 million 480 lb bales /5.9 mmt) from 12 million hectares, the second highest area and production on record. Farmers have shown a strong preference for cotton in recent years and current market prices are already above the levels that informed planting decisions in 2011 and 2012. Exports are expected to reach 7.5 million 170 kg bales (5.8 million 480 lb bales/1.3 mmt), down from the increased 2012/13 estimate of 9.0 million 170 kg bales (7 million 480 lb bales/ 1.5 mmt). Much will depend on the import policies determined by China. Exports to smaller markets like Bangladesh and Vietnam are likely to account for half of the 2013/14 export forecast. India’s textile industry appears to be recovering from the losses and reduced borrowing limits that resulted from market volatility in 2011. The industry is on pace for record yarn exports; spinning margins, which have narrowed of late, have been robust for the past six months. With lower exports, adequate supply and hoped for improvement in global textile demand, cotton consumption is expected to expand to a record to a record 27.5 million 170 kg bales (21.5 million 480 lb bales/4.7 mmt), up 500,000 480 lb bales from the revised 2012/13 estimate. Dhruv Sood David Williams Cotton and Products Annual India IN3028 3/25/2013 Required Report - public distribution
-
Upload
truongkhanh -
Category
Documents
-
view
217 -
download
0
Transcript of India Cotton and Products Annual - USDA GAIN Publications/Cotton...mmt) from 12 million hectares,...

THIS REPORT CONTAINS ASSESSMENTS OF COMMODITY AND TRADE ISSUES MADE BY
USDA STAFF AND NOT NECESSARILY STATEMENTS OF OFFICIAL U.S. GOVERNMENT
POLICY
Date:
GAIN Report Number:
Approved By:
Prepared By:
Report Highlights:
India’s 2013/14 cotton production is forecast at 34.5 million 170 kg bales (26.9 million 480 lb bales /5.9
mmt) from 12 million hectares, the second highest area and production on record. Farmers have shown
a strong preference for cotton in recent years and current market prices are already above the levels that
informed planting decisions in 2011 and 2012. Exports are expected to reach 7.5 million 170 kg bales
(5.8 million 480 lb bales/1.3 mmt), down from the increased 2012/13 estimate of 9.0 million 170 kg
bales (7 million 480 lb bales/ 1.5 mmt). Much will depend on the import policies determined by China.
Exports to smaller markets like Bangladesh and Vietnam are likely to account for half of the 2013/14
export forecast. India’s textile industry appears to be recovering from the losses and reduced borrowing
limits that resulted from market volatility in 2011. The industry is on pace for record yarn exports;
spinning margins, which have narrowed of late, have been robust for the past six months. With lower
exports, adequate supply and hoped for improvement in global textile demand, cotton consumption is
expected to expand to a record to a record 27.5 million 170 kg bales (21.5 million 480 lb bales/4.7
mmt), up 500,000 480 lb bales from the revised 2012/13 estimate.
Dhruv Sood
David Williams
Cotton and Products Annual
India
IN3028
3/25/2013
Required Report - public distribution
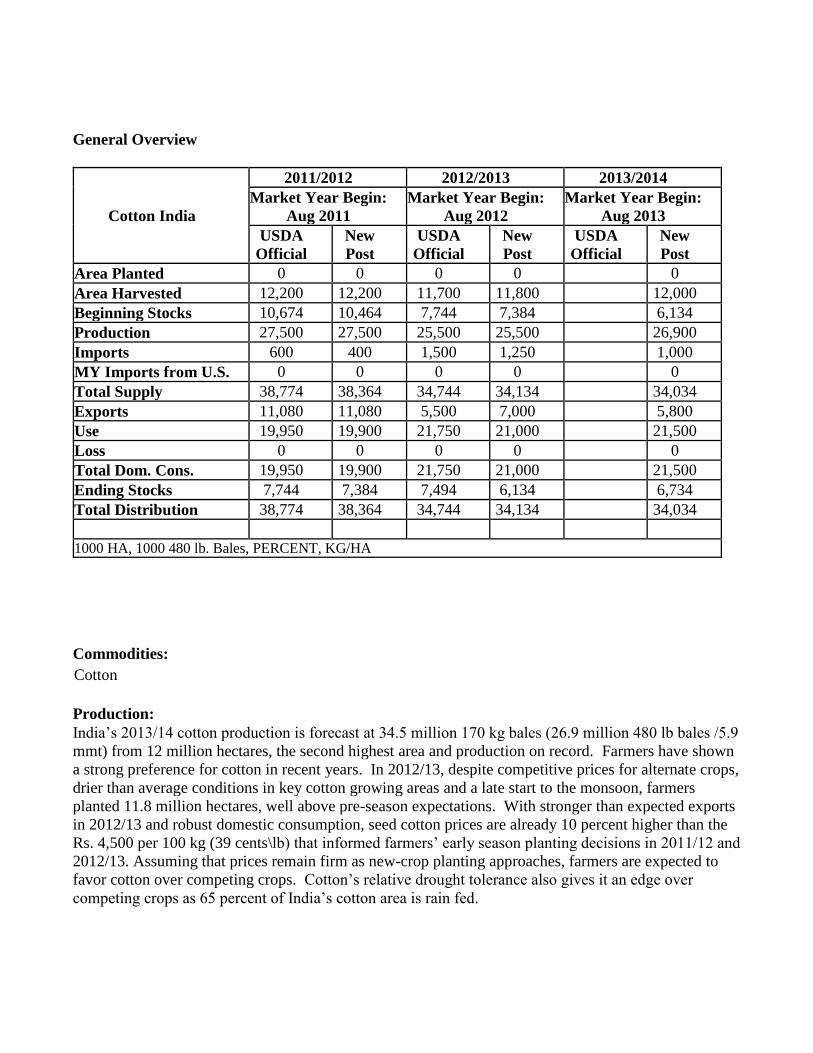
General Overview
Cotton India
2011/2012 2012/2013 2013/2014
Market Year Begin:
Aug 2011
Market Year Begin:
Aug 2012
Market Year Begin:
Aug 2013
USDA
Official
New
Post
USDA
Official
New
Post
USDA
Official
New
Post
Area Planted 0 0 0 0 0
Area Harvested 12,200 12,200 11,700 11,800 12,000
Beginning Stocks 10,674 10,464 7,744 7,384 6,134
Production 27,500 27,500 25,500 25,500 26,900
Imports 600 400 1,500 1,250 1,000
MY Imports from U.S. 0 0 0 0 0
Total Supply 38,774 38,364 34,744 34,134 34,034
Exports 11,080 11,080 5,500 7,000 5,800
Use 19,950 19,900 21,750 21,000 21,500
Loss 0 0 0 0 0
Total Dom. Cons. 19,950 19,900 21,750 21,000 21,500
Ending Stocks 7,744 7,384 7,494 6,134 6,734
Total Distribution 38,774 38,364 34,744 34,134 34,034
1000 HA, 1000 480 lb. Bales, PERCENT, KG/HA
Commodities:
Production:
India’s 2013/14 cotton production is forecast at 34.5 million 170 kg bales (26.9 million 480 lb bales /5.9
mmt) from 12 million hectares, the second highest area and production on record. Farmers have shown
a strong preference for cotton in recent years. In 2012/13, despite competitive prices for alternate crops,
drier than average conditions in key cotton growing areas and a late start to the monsoon, farmers
planted 11.8 million hectares, well above pre-season expectations. With stronger than expected exports
in 2012/13 and robust domestic consumption, seed cotton prices are already 10 percent higher than the
Rs. 4,500 per 100 kg (39 cents\lb) that informed farmers’ early season planting decisions in 2011/12 and
2012/13. Assuming that prices remain firm as new-crop planting approaches, farmers are expected to
favor cotton over competing crops. Cotton’s relative drought tolerance also gives it an edge over
competing crops as 65 percent of India’s cotton area is rain fed.
Cotton

In 2012/13, Gujarat, India’s largest cotton producing state was affected by drier than average conditions,
which led to a reduction in cotton acreage and production. While farmers have developed measures to
conserve water in the state, principally through small “check” dams, rainfall was late and sparse enough
to affect planting. Given Gujarat’s role as a key supplier of cotton to export markets and the adequate
ginning capacity in the state, farmers are expected to increase 2013/14 planted area by more than 15
percent to 2.8 million hectares if monsoon rains cooperate. In Maharashtra, which accounts for more
than 30 percent of India’s cotton plantings, area is expected to be largely unchanged from a year ago as
farmers continue to view cotton as one of their best kharif (summer) planting options. Cotton area in
Andhra Pradesh, India’s third largest cotton producing state was a record 2.2 million hectares in
2012/13. Area is expected to decline by more than 10 percent as farmers whose crops were affected by
the late-season cyclone “Nilam” shift some of their cotton acreage to alternate crops like chilies, a crop
less influenced by late-season rains. Area in the well-irrigated cotton areas in the northern states of
Punjab, Haryana and Rajasthan is forecast unchanged from a year ago.
While yields have increased from an estimated 300 kg per hectare to nearly 500 kg per hectare over the
past decade with the introduction of biotech seeds, better hybrids and expanded surface irrigation in
some areas, there is concern within the industry that yields are stagnating or even declining. The
increasing prevalence of “sucking insects” such as whitefly, the need for better micronutrient and
fertilizer management, the spread of cotton into more drought prone areas and occasionally inconsistent
seed quality are all cited as factors affecting yields. Despite these ongoing challenges, yields are forecast
at 490 kg per hectare, up three percent from 2012/13 when erratic rains affected yields. India’s cotton
yields continue to be significantly lower than the global average of 761 kg per hectare, a difference due,
in part, to the relatively low plant populations that farmers deploy in order to create rows that are wide
enough for bullocks to traverse. The advent of biotech cotton has helped to improve the predictability
and stability of cotton as a crop which has supported the expansion of cotton area in recent years.
The Government of India has not announced the minimum support price (MSP) for the 2013/14 crop
year. While prices vary by variety, the 2012/13 MSP for the most commonly traded staple length was
increased 22 percent from Rs. 3,150 per 100 kg (27 cents\lb) of seed cotton to Rs. 3,850 per 100 kg (33
cents\lb). The higher MSP resulted in the Cotton Corporation of India (CCI) and other government
agencies procuring 2.2 million 170 kg bales of cotton of which 2 million 170 kg bales are still in CCI
stocks, much of it in Andhra Pradesh where farmers were affected by cyclone “Nilam” during harvest.
Cotton prices have increased over the past month and the textile industry has pressured CCI to begin
selling its stocks in the domestic market. Higher market prices should enable CCI and other
government agencies to cover their costs when cotton sales begin.
It is difficult to predict the timing of the 2013/14 MSP announcement, some years the new prices are not
announced until planting is nearly complete. However, two factors seem to point to the possibility of an
increase. Currently, seed cotton prices are 25 percent higher than the MSP, if prices remain firm in the
run up to planting, the MSP could be increased without exceeding prevailing market prices.
Additionally, if government agencies are able to sell their 2012/13 stocks at a profit, officials may be
more inclined to consider an MSP increase. The added price certainty of a higher MSP could prompt
farmers to expand area beyond the forecast in this report; area reached 12.2 million hectares in 2011/12.
Policy makers are approaching MSP levels that could lead to more regular market intervention by CCI
and other government agencies if global market prices fall, a situation that would be further exacerbated
if the weakened rupee begins to appreciate.

2012/13 planted area has been adjusted to 11.8 million hectares to better reflect official data. The
production estimate is unchanged at 32.5 million 170 kg bales (25.5 million 480 lb bales / 5.5 mmt).
The pace of cotton arrivals continues to lag the year ago pace. As of March 10, arrivals had reached 22.5
million 170 kg bales (17.6 million 480 lb bales / 3.8 mmt) compared to 23.7 million 170 kg bales (18.5
million 480 lb bales / 4.0 mmt) a year ago. Arrivals in Gujarat and Madhya Pradesh continue to lag
significantly behind the year-ago pace. Industry sources again indicate that farmers are holding cotton in
anticipation of higher prices. With the spread of cellular phones and mobile market information
services, farmers are increasingly able to make more informed crop marketing decisions.
General Production Outlook: Cotton, a predominantly monsoon-season or kharif crop, is planted from
the end of April through September, and harvested in the fall and winter. With the area under Bt cotton
and improved varieties now reaching an estimated 92 percent of total area, prospects for future growth
in productivity are limited as most cotton is grown under rain-fed conditions and on small farms.
Researchers are working on production schemes with higher plant populations that could improve yields
if they gain popularity with farmers. There are an estimated 5.5 million cotton farmers with the average
farm size of 1.5 hectares which limits their ability to adopt capital intensive production technologies and
infrastructure. However, yields would likely benefit from training in the management of irrigation,
fertilizers, micro nutrients, pests and diseases to boost yields above current levels. Future growth in
cotton production is more likely to come from higher yields than a significant area expansion.
India accounts for about a third of global cotton area. Within India, two-thirds of cotton is produced in
the central cotton growing zone in the states of Maharashtra, Madhya Pradesh, Gujarat and Odisha
where much of the crop is rain fed. The northern zone, which consists of the states of Punjab, Haryana
and Rajasthan, produces cotton under irrigated conditions and accounts for about 15 percent of
production. In the south, the states of Andhra Pradesh, Karnataka and Tamil Nadu account for 20
percent of production. The Central and Southern zones typically grow long duration cotton that allows
farmers to reap multiple pickings or harvests. While the number of pickings has declined as traditional
varieties have been replace by biotech hybrids, farmers can still extract up to five pickings per plant
depending on weather conditions. In contrast, the irrigated cotton in the northern zone is mostly a short
duration crop that fits into a cotton-wheat cropping system.
Bt cotton: Since its introduction in 2002, Bt cotton has been widely adopted and now accounts for an
estimated 92 percent of total cotton area and over 95 percent of India’s cotton production. The
Government of India has approved six biotech events and more than 300 hybrids for cultivation in
different agro-climatic zones. In addition to the approved varieties, there are estimated 40-50 Bt cotton
hybrids that are developed and multiplied informally outside of regulated marketing channels and sold
at cheaper rates relative to approved hybrids. One of the results of the adoption of Bt cotton has been a
significant shift in the varietal profile and share of different types of cotton being produced in India.
Most of the Bt hybrids are of medium and long staple cotton (26 to 32 mm), which is resulting in
declining production of short staple (below 22 mm) and extra long staple (35 mm and above). If the
current trend continues, the domestic textile industry may seek to increasingly augment their extra long
staple and short staple cotton requirements through imports.
Consumption:

MY 2013/14 consumption is forecast at a record 27.5 million 170 kg bales (21.5 million 480 lb bales/
4.7 mmt). The textile industry continues to recover from the losses suffered during 2011/12. The
industry has enjoyed strong spinning margins throughout much of 2012/13 and is on pace to export a
record volume of yarn. Margins have started to narrow and the industry is calling on the Government of
India to release the 2.0 million 170 kg bales that are currently held by CCI. Whether favorable spinning
margins will persist in 2013/14 is difficult to determine. However, the industry is optimistic that textile
demand in major western markets will strengthen in 2013/14 and, while India’s GDP growth has cooled
of late, the economy continues to grow at an enviable rate of six percent, suggesting that domestic
demand will at least remain firm. A weakened rupee, if it persists, will also be beneficial for yarn and
textile exports. See the tables at the end of this report for additional information concerning textile
production and cotton consumption.
Trade:
2013/14 exports are forecast at 7.5 million 170 kg bales (5.8 million 480 lb bales/1.3 mmt), down 15
percent from the revised 2012/13 estimate. China is again expected to be the key determiner of India’s
export volumes. Exportable supplies of cotton are forecast to be adequate and exports to regional buyers
like Pakistan and Bangladesh and Asian buyers like Vietnam and Indonesia are expected to average
about 300,000 170 kg bales per month or 3.6 million 170 kg bales for the year. The degree to which
exports exceed that level will depend on China. Currently, assuming that China will again be buyer of
foreign cotton, albeit it at reduced levels, India’s exports to China are forecast at 4.0 million 170 kg
bales. The rupee has consistently traded at Rs. 53-55 per dollar over the past six months which has
helped to support export volumes. If the rupee strengthens, India’s price advantage in export markets
could be curbed.
Exports for MY 2012/13 are estimated at 9.0 million 170 kg bales (7 million 480 lb bales/ 1.5 mmt),
well above earlier expectations as strong demand from China, a weak rupee and competitive pricing
spurred exports. Trade sources indicate that export shipments for 2012/13 had reached 7.8 million 170
kg bales (6.1 million 480 lb bales/1.3 mmt) through mid-March. China, Bangladesh, Pakistan and
Vietnam are the biggest export markets for Indian cotton. With strong domestic demand, assumed
weaker demand from China and a recent halving of the margin (from 8-9 cents per pound to 3-4 cents
per pound) between Indian ex-gin prices and the Cotlook A index, the pace of exports is expected to
slow through the balance of the August/July marketing year. Nevertheless, demand from regional and
Asian buyers will likely lead to average monthly exports of 300,000 170 kg bales from April to July.
Additionally, CCI may make a portion of the 2.0 million 170 kg bales it currently holds available to
exports. Thus far, the higher than expected export pace has not prompted the textile industry to press for
cotton export controls, instead the industry is actively encouraging the government to initiate the sale of
CCI stocks in the domestic market.
India typically imports long staple cottons to augment domestic supplies for processing and re-export as
high-end textiles. However, prior to the onset of the delayed 2012/13 harvest, mills imported larger
volumes of cotton to augment general cotton supplies. Given the pace of exports and strong
consumption thus far, mills could again be required to import larger volumes of cotton prior to the onset
of the 2013 harvest. 2012/13 imports are estimated at 1.6 million 170 kg bales (1.2 million 480 lb
bales/270,000 mt). For 2013/14, imports are estimated marginally lower at 1.0 million 480 lb bales
/255,000 mt.
Policy:
As India has emerged as a cotton exporter in recent years, the Government of India has enacted a variety
of trade policies to ensure that competitively-priced adequate supplies are available to the textile
industry. India’s national fiber policy affirms that cotton exports should be limited to the exportable
surplus. In March 2012, the Government of India enacted a ban on exports on account of the rapid pace
of exports and the potential effect on domestic supplies of cotton. The ban was lifted in May of 2012
and replaced with a new export registration policy that enabled closer monitoring of exports. In
October 2012, the Government of India announced the cotton export policy for MY 2012/13 (Oct/Sep).
The policy was largely a continuation of the previous May 2012 policy. Cotton exports are allowed
under Open General License subject to relatively strict export registration requirements, but are not
currently subject to a quantitative limit or quota. For more information on India’s export policies see
table 13.
Thus far, the textile industry has not pressed the government for export controls during 2012/13.
Instead, the focus has been on releasing cotton from government-held stocks. While the export pace has
exceeded expectations, it remains well below the record 2011/12 pace that prompted the government to
briefly ban exports. Unless exports surge unexpectedly over the next few months, it seems unlikely that
the textile industry will press for export controls. However, officials continue to monitor the pace of
exports and could seek to tighten export registration requirements or deploy some other means of
slowing exports if the pace continues to exceed expectations.
Cotton Advisory Board (CAB) Reconstituted: The CAB, which is comprised of inter-ministerial
experts, meets regularly to estimate domestic cotton production, consumption and trade. The
reconstituted CAB will now have a consultative committee that will give input to the Board. The
consultative committee includes members from the textile industry and cotton trade. Both the
consultative committee and the CAB are headed by the Textile Commissioner.
Production Policy
The Government of India establishes a minimum support price for cotton. New prices are typically
announced annually and may or may not precede the start of planting. CCI, a central government
organization, is responsible for price support operations in all states, but is occasionally assisted by
other federal or state government marketing organizations. Government agencies purchase seed cotton
at the MSP, and sell the processed cotton at market prices, and the losses incurred in the operation are
borne by the government. In 2012\13, CCI procured 2.2 million 170 kg bales (1.7 million 480 lb
bales/374,000 mt), of which 95 percent was from Andhra Pradesh to support farmers affected by tropical
cyclone ‘Nilam’ in the first week of November. CCI was also involved in small procurement operations in
the states of Maharashtra, Orissa, Karnataka and Madhya Pradesh but through most of the season,

market prices have been above the MSP. Besides the MSP operations, CCI and state marketing
organizations are also involved in purchasing cotton at open market prices for commercial sales.
Purchases have been very limited thus far in 2012/13 amounting to 50,000 170 kg bales (39,040 480 lb
bales /8,500 mt). See the production section for a discussion of the current MSP situation.
Various central and state government agencies and research institutions are engaged in cotton varietal
development, seed distribution, crop surveillance, integrated pest management, extension and marketing
activities. In 1999, the central government launched the Technology Mission on Cotton (TMC) to
improve the availability of quality cotton at reasonable prices. The goal of the TMC is bring about
improvement in the production, productivity and quality of cotton through research, transfer of
technology and improvement in the marketing and raw cotton processing sectors.
Marketing:
India exports medium-to-long staple cotton (25 to 32 mm length) to China, Bangladesh and East Asian
countries. However, India will likely continue to import ELS and quality long staple cotton (28-34 mm),
with occasional imports of short staple cotton (below 22 mm) when international prices are favorable.
The United States has been the leading supplier of cotton to India over the past few years. Indian mills
importing U.S. Pima and upland cotton recognize its quality and consistency, and are ready to pay a
premium over competing origins. However, U.S. cotton faces competition from suppliers like Egypt and
Australia due to their freight advantage and shorter delivery periods. Due to warm weather conditions
and tradition, cotton is typically the preferred fiber in India. However, poly-cotton blends are becoming
increasingly popular due to their durability and ease of maintenance. Prices of cotton relative to man-
made fibers will be key in determining the future growth of cotton usage in India.
Due to warm weather conditions and tradition, cotton is typically the preferred fiber in India. However,
poly-cotton blends are becoming increasingly popular due to their durability and ease of maintenance.
Industry sources report that higher cotton prices have caused some mills to shift their cotton/polyester
blends in favor of polyester. Prices of cotton relative to man-made fibers (MMF) will be key in
determining the future growth of cotton usage in India.
Value Added Cotton
The textile and clothing industry is largely cotton-based, accounting for 14 percent of total industrial
production, 17 percent of total export earnings, four percent of GDP and providing direct employment
to over 35 million people and indirect employment to an additional 55 million people. After agriculture,
the textile industry is India’s largest employer. The “organized” or modern textile sector is dominated
by spinning units which, in terms of numbers, account for 80 percent of the “units” in the modern
industry. India’s textile industry would likely benefit from increased value addition in terms of weaving
and garment manufacturing, but the industry continues to focus much of its effort on expansion of the
spinning sector. The Indian textile industry includes both an "organized" sector (large-scale spinning
units and composite mills) and an "unorganized" sector (small-scale spinning units, power looms,
handlooms, hosiery units). More than 95 percent of yarn is produced in the organized sector. The
weaving industry is mainly supplied by the unorganized sector, with power looms accounting for 63
percent, handlooms for 12 percent, and hosiery units for 21 percent of total cloth production. The
organized sector weaving mills account for the remaining four percent of cloth production.

According to the Government of India, India ranks third in global exports of textiles and sixth in global
exports of clothing with shares of 5.1 percent and 3.2 percent respectively. The United States and China
are the top markets for textile exports with Bangladesh also emerging as a strong market. Cotton textile
exports account for 50 percent of total textile exports. Cotton ready-made garments account for the
major share of cotton textile exports followed by cotton yarn and cotton fabric. Cotton yarn exports
have been on “Open General License” (not subject to quotas) since April of 2011. For additional
information on textile exports and production see the tables at the end of this report.
In an effort to promote the export of value-added cotton textiles, the Government of India in its latest
budget announcement for the upcoming 2013/14 fiscal year (Apr/Mar) has largely continued with major
schemes to ensure affordable credit, technology improvement, skill development and duty relief to the
textile sector. India’s current trade policy provides incentives to encourage textile exports such as
favourable interest rates on pre-shipment credit, duty-free import of trimmings required by the garment
industry and duty-free import of tools by the handicrafts industry. Firms with export oriented unit status
and firms importing against an advance export license receive a duty drawback on imports of raw
materials for the export of value-added goods. The Export Promotion Capital Goods plan, which
enabled imports of capital goods and machinery at reduced duty rates against export obligations, will
expire on March 31, 2013. Additionally, the Market Linked Focus Product Scheme, where exporters
can earn credits valued at two percent of their exports to the United States and European Union, is also
set to expire on March 31, 2013.
Debt Restructuring Package: To ease the financial distress from the global economic slowdown of
the past few years and the losses from the market volatility during 2011, the government approved a
debt restructuring package to aid textile mills. The program is administered on a case-by-case basis
within parameters set by the Reserve Bank of India. Banks have extended the program to 307 textiles
mills and 200 readymade garments factories.
The Technology Upgradation Fund Scheme (TUFS): TUFS has provided support for the
modernization of the textile industry since 1999 through lower rates of interest on loans for the purchase
of capital goods and improved technology. The Ministry of Textiles has proposed a budget of $442
million for the upcoming 2013/14 fiscal year (Apr/Mar).
Zero Excise Duty Route: The Government of India in its latest budget announcement for the
upcoming 2013/14 fiscal year has cut the excise duty on ready garments made from cotton from 3.5
percent to zero.
Scheme for Integrated Textile Parks (SITP): SITP provides the textile industry with infrastructure
facilities for setting up their textile units. SITP has created 61 new textile parks. The scheme is based on
a public private partnership model where the Government of India share is restricted to 40 percent of the
project cost or $7.3 million (Rs. 400 million) whichever is lower. An additional grant of $1.8 million
(Rs. 100 million) will soon be available to each new project to assist firms in the apparel sector.
Scheme for Integrated Processing Development (IPD): IPD is a new scheme with an initial annual
outlay of $92 million (Rs. 5 billion) to address the environmental concerns relating to effluent treatment.
Various Schemes for Handloom Sector: For the overall development of the handloom sector, the
Government of India has taken various policy initiatives to sustain and develop the industry. The latest
federal budget provides $17 million for FY 2013/14 (Apr/May) to make loans available at a reduced
interest rate. This is in addition to two existing programs, the $710 million Comprehensive Handloom
Package and the $430 million Revival, Reform and Restructuring Package.
State Textile Policies: The major cotton producing states of Gujarat and Maharashtra announced their
textile policies in 2012, with several programs and schemes encouraging industries to locate their textile
units in their respective states. The Gujarat Textile Policy will provide a five year interest subsidy on
new plants, a power tariff concession for five years and a refund of the valued added tax on raw
materials for new units and the expansion of existing units. The policy is aimed at bringing additional
textile processing capacity closer to growers in India’s leading cotton producing state. Gujarat currently
supplies a large volume of India’s cotton exports. In Maharashtra, similar interest subsidies are being
provided on long-term loans for setting up new units. A significant volume of cotton is shipped out of
Maharashtra to states where there is greater processing capacity; these measures are aimed at keeping
cotton in the state and creating jobs. Over the next 5 years, some processing capacity may shift from the
south (where about half of India’s cotton is processed) to the central states in view of the continuous
power shortage problems faced by the industry in the south.
Production, Supply and Demand Data Statistics:
Extra Long Staple Cotton:
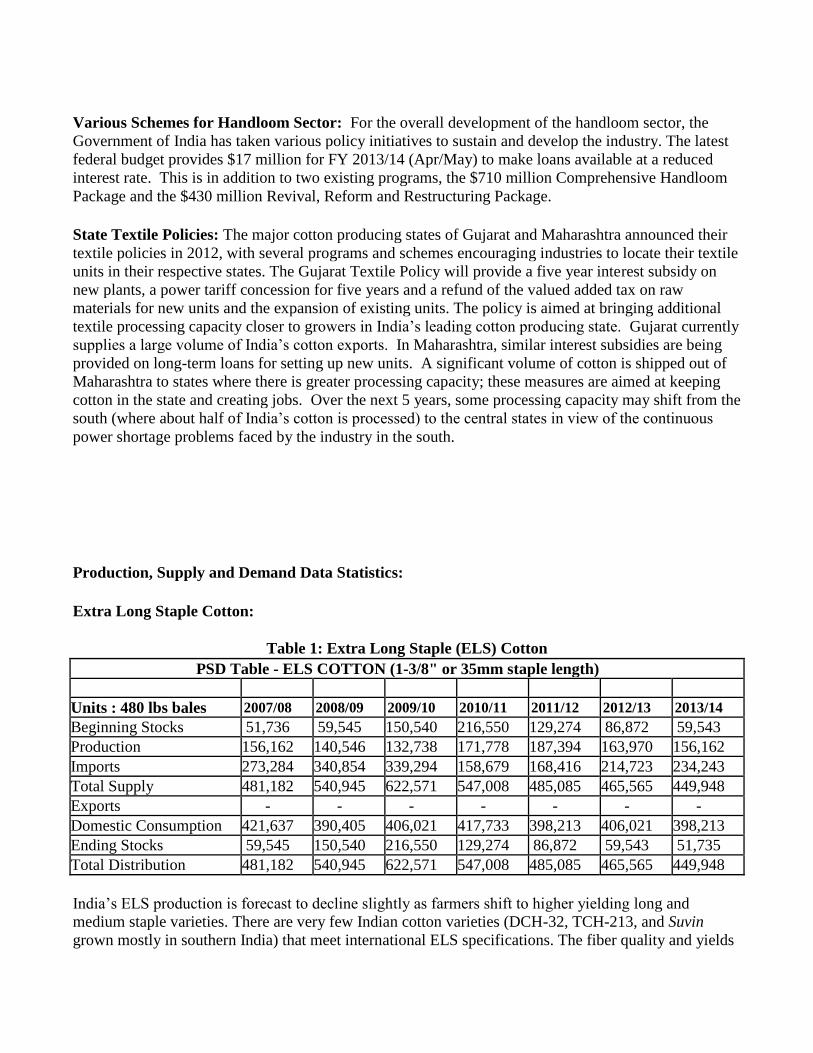
Table 1: Extra Long Staple (ELS) Cotton
PSD Table - ELS COTTON (1-3/8" or 35mm staple length)
Units : 480 lbs bales 2007/08 2008/09 2009/10 2010/11 2011/12 2012/13 2013/14
Beginning Stocks 51,736 59,545 150,540 216,550 129,274 86,872 59,543
Production 156,162 140,546 132,738 171,778 187,394 163,970 156,162
Imports 273,284 340,854 339,294 158,679 168,416 214,723 234,243
Total Supply 481,182 540,945 622,571 547,008 485,085 465,565 449,948
Exports - - - - - - -
Domestic Consumption 421,637 390,405 406,021 417,733 398,213 406,021 398,213
Ending Stocks 59,545 150,540 216,550 129,274 86,872 59,543 51,735
Total Distribution 481,182 540,945 622,571 547,008 485,085 465,565 449,948
India’s ELS production is forecast to decline slightly as farmers shift to higher yielding long and
medium staple varieties. There are very few Indian cotton varieties (DCH-32, TCH-213, and Suvin
grown mostly in southern India) that meet international ELS specifications. The fiber quality and yields

of these varieties have deteriorated in recent years causing marketing problems and lower returns to
growers. Therefore, farmers are increasingly shifting to long staple varieties (Bunny, Brahma, and other
30-34 mm cotton varieties), which have higher yields and fewer quality problems. Efforts to improve
the productivity of ELS parent lines have met with limited success. There are some early efforts to
develop biotech ELS varieties.
ELS cotton consumption is forecast marginally lower. India’s domestic consumption requirement for
ELS cotton is largely met through imports and the United States and Egypt are the major suppliers. ELS
cotton is used for the production of quality yarn, fabric, and dress material for a small but growing high-
end domestic market segment and for export. Demand for luxury goods has fallen. Mills are still
seeking ELS, but only for quantities equal to their orders. Local mills are increasingly using the long
staple varieties for blending with imported ELS cotton for the production of quality yarn and fabric.
Table 2: Planting Season, Irrigation & Cotton Type by Major Region
REGION STATES COTTON
GROWN
PLANTING SEASON AND
IRRIGATION STATUS
North Punjab, Haryana,
Rajasthan
Medium & Short
Staple End April-May/Largely Irrigated
Central Gujarat, Maharashtra,
Madhya Pradesh
Medium and Long
Staple
Mid June -July ( after onset of
monsoon) /Largely rain fed
South Andhra Pradesh,
Karnataka, Tamil Nadu
Long and Extra
Long Staple August-September/Largely rain fed
Note: There is a small cotton crop planted in January-February in South India
Table 3: Cotton Consumption (Mill & Small Sector Units) By Month
(Figures in Million 480lb Bales)
Month\Year 2010/11* 2011/12* 2012/13
Aug 1.697 1.455 1.725
Sept 1.673 1.694 1.659
Oct 1.725 1.387 1.708

Nov 1.647 1.432 1.637
Dec 1.762 1.572 1.744
Jan 1.726 1.587 1.562
Feb 1.580 1.585
Mar 1.699 1.591
Apr 1.575 1.586
May 1.455 1.662
Jun 1.423 1.653
Jul 1.484 1.728
Loss 1.045 0.780 1.171
TOTAL 20.491 19.713 21.121
Source: * Figures in Bold are Provisional
Source: Textile Commissioner's Office, GOI
Table 4: Month End Spot Prices of Popular Indian Varieties (cents per pound)
Year Bengal Deshi
(below 22 mm)
SG J-34
(25 mm)
H-4
(28mm)
Shankar-6
(29mm)
MCU-5
33mm
DCH-32
(35 mm)
2010/11
Aug 0.73 0.90 0.91 0.94 1.00 1.19
Sept 0.76 0.98 1.01 1.04 1.14 1.26
Oct 0.81 1.10 1.19 1.02 1.25 1.44
Nov 0.86 1.09 1.13 0.99 1.22 1.42
Dec 0.98 1.17 1.18 1.02 1.23 1.49
Jan 1.19 1.29 1.35 1.15 1.47 2.10
Feb 1.38 1.61 1.57 1.37 1.74 2.33
Mar 1.49 1.76 1.68 1.45 1.83 2.33
Apr 1.36 1.43 1.26 1.37 1.72 2.14
May 1.21 1.21 1.14 1.09 1.51 1.93
Jun 1.23 1.11 1.05 0.90 1.40 1.84
Jul 1.25 0.92 0.88 0.73 1.26 1.67
2011/12
Aug 1.38 0.96 0.92 0.86 1.22 1.56
Sept 1.36 1.02 0.98 1.06 1.12 1.44

Oct 0.95 0.90 1.02 0.97 1.06 1.28
Nov 0.92 0.77 0.88 0.94 0.97 1.21
Dec 0.83 0.74 0.80 0.82 0.88 1.04
Jan 0.91 0.83 0.87 0.93 0.94 1.20
Feb 0.88 0.78 0.84 0.92 - 1.21
Mar 0.88 0.79 0.84 0.85 - 1.13
Apr 0.85 0.75 0.82 0.81 - 1.11
May 0.83 0.71 0.77 0.72 0.78 0.75
Jun 0.92 0.75 0.77 0.76 0.77 0.77
Jul 1.01 0.80 0.83 0.89 0.83 0.84
2012/13
Aug 0.97 0.81 0.85 0.88 - 0.85
Sept 0.87 0.75 0.79 0.81 - 0.79
Oct 1.00 0.76 0.77 0.80 - 1.10
Nov 0.90 0.75 0.76 0.78 - 1.05
Dec 0.81 0.76 0.77 0.79 - 1.06
Jan 0.80 0.79 0.80 0.82 - 1.06
Feb 0.86 0.89 0.90 0.87 - 1.12
Mar 0.87 0.90 0.90 0.90 - 1.12
Source: Cotton Association of India (formerly East India Cotton Association), Mumbai
Table 5a: India's Cotton Exports by Month
(Figures in 480lb Bales)
Month\Year 2010/11 2011/12 2012/13
Aug 77,355 340,780 44,423
Sept 15,556 740,873 81,461
Oct 19,915 543,692 125,324
Nov 1,410,798 1,635,913 598,973
Dec 2,004,301 1,266,216 1,414,849
Jan 285,940 1,970,873
Feb 917,215 1,814,992
Mar 450 399,840
Apr 294 1,069,467
May 501 623,467
Jun 3,858 460,803
Jul 252,484 203,790
TOTAL 4,988,667 11,070,706 2,265,030
Source: Directorate General of Foreign Trade, Ministry of Commerce

Table 5b: India's Cotton Imports by Month
(Figures in 480lb Bales)
Month\Year 2010/11 2011/12 2012/13
Aug 4,689 6,821 49,140
Sept 5,535 1,966 158,710
Oct 8,212 9,875 243,997
Nov 7,317 11,450 166,435
Dec 11,257 10,031 81,397
Jan 11,533 29,096
Feb 25,124 62,639
Mar 20,131 72,252
Apr 26,570 76,868
May 34,704 61,936
Jun 21,752 26,552
Jul 10,270 20,544
TOTAL 187,094 390,030 699,678
Source: Directorate General of Foreign Trade, Ministry of Commerce
Table 6a: Cotton Export Trade Matrix
Period Aug-Jul Units 480 lb bales
2010/11 2011/12 2012/13 (Aug-Dec, 2012)
United States 335 United States 395 United States -
China 3,051,239 China 8,547,437 China 1,492,236
Bangladesh 785,925 Bangladesh 1,214,862 Bangladesh 345,685
Pakistan 456,215 Pakistan 375,856 Pakistan 219,006
Taiwan 156,326 Vietnam 235,748 Taiwan 82,650
Vietnam 145,960 Indonesia 179,296 Vietnam 56,268
Indonesia 131,689 Malaysia 161,479 Indonesia 26,988
Malaysia 66,598 Taiwan 112,840 Malaysia 18,675
Hong Kong 52,328 Thailand 81,199 Hong Kong 7,886
Turkey 41,957 Hong Kong 66,336 Turkey 3,638
Total of Top 10 4,888,572 Total of Top 10 10,975,447 Total of Top 10 2,253,033
Others 100,094 Others 95,263 Others 11,997
Grand Total 4,988,666 Grand Total 11,070,710 Grand Total 2,265,030
Source: Directorate General of Foreign Trade, Ministry of Commerce

Table 6b: Cotton Import Trade Matrix
Period Aug-Jul Units 480 lb bales
2010/11 2011/12 2012/13 (Aug-Dec, 2012)
United States 76,257 United States 95,382 United States 32,569
Egypt 71,094 Pakistan 180,627 Tanzania 109,528
Turkmenistan 5,746 Egypt 49,751 Australia 78,402
Israel 5,686 Australia 12,787 Kenya 70,479
Australia 5,640 Israel 8,970 Thailand 52,282
Sudan 5,231 China 8,943 Cote d Ivoire 49,544
China 2,714 Nigeria 4,758 Pakistan 48,580
Sri Lanka 1,456 Sudan 3,220 Egypt 28,302
Korea South 1,419 Argentina 2,108 Mali 25,799
Japan 1,350 Zambia 2,081 Argentina 24,260
Total of Top 10 176,595 Total of Top 10 181,326 Total of Top 10 519,744
Others 10,500 Others 208,700 Others 180,526
Grand Total 187,094 Grand Total 390,025 Grand Total 700,271
Source: Directorate General of Foreign Trade, Ministry of Commerce
Table 7: Growth of the Indian Textile Industry
Item* 1991/92 1995/96 2000/01 2003/04 2004/05 2005/06 2008/09 2009/10 2010/11 2011/12 2012/13
(Apr-
Jan) (P)
Organized Mills
Spinning 846 1,294 1,565 1,564 1,566 1,570 1,653 1,673 1,692 1,761 1,769
Composite 271 275 281 223 223 210 177 180 186 194 198
Exclusive Weaving
na 172 203 206 202 204 184 183 182 173 175
Small
Scale Spinning
Units
na 750 996 1,135 1,161 1,173 1,247 1,260 1,398 1,338 1,347
Power
Loom Units
('000s)
na 327 373 413 425 433 494 505 513 520 523
Spindles (millions)
28 32 38 37 37 38 41 42 48 43 44
Rotors ('000s)
113 226 454 482 500 520 659 675 750 523 541
Looms 169 148 140 105 103 92 71 71 70 52 52

('000s)
Power
Loom ('000s)
na 1,372 1,661 1,836 1,902 1,943 2,205 2,246 2,278 2,299 2,323
* - Indian fiscal Year (April/March)
na - not available
P - Provisional
Source: The Textile Commissioner’s Office, GOI
Table 8: Production of Spun Yarn (Million Kg.)
Year /1 Cotton Blended 100% Non-Cotton Total
1995-96 1,894 395 196 2,485
2000-01 2,267 646 247 3,160
2001-02 2,212 609 280 3,101
2002-03 2,177 585 319 3,081
2003-04 2,121 589 342 3,052
2004-05 2,272 585 366 3,223
2005-06 2,521 588 349 3,458
2006-07 2,824 635 354 3,813
2007-08 2,948 677 378 4,003
2008-09 2,896 655 361 3,912
2009-10 3,079 707 407 4,193
2010-11 3,490 796 427 4,713
2011-12 3,127 789 457 4,373

2012/13
(Apr-Dec) (P) 2,631 610 340 3,580
/1: Indian fiscal year (April-March)
P: Provisional estimate for April 2012 to Dec 2012.
Source: Textile Commissioner’s Office, GOI
Table 9: Production of Manmade Fiber (Million Kg.)
Year /1 Viscose Acrylic Polyester Poly-Propylene Total
1995-96 194 74 228 2 498
1997-98 188 79 439 2 708
1998-99 178 79 523 2 782
1999-00 202 79 551 2 835
2000-01 236 99 566 2 904
2001-02 185 95 551 2 834
2002-03 225 105 582 2 914
2003-04 221 117 613 3 953
2004-05 248 128 644 3 1,023
2005-06 229 108 628 3 968
2006-07 247 97 792 4 1,139
2007-08 280 81 880 3 1,244
2008-09 233 80 750 3 1,066
2009-10 302 90 872 3 1,268
2010-11 305 79 896 4 1,285

2011-12 323 78 830 4 1,234
2012-13
(Apr-Dec) (P) 251 56 638 3 948
/1: Indian fiscal year (April-March)
P: Provisional estimate for April 2012 to Dec 2012.
Source: Textile Commissioner’s Office, GOI
Table 10: Production of Manmade Filament Yarn (Million Kg.)
Year/1 Viscose Polyester Nylon Poly-Propylene Total
1995-96 61 376 42 15 494
1997-98 57 668 30 14 769
1998-99 61 745 29 15 850
1999-00 49 801 26 17 894
2000-01 55 820 26 18 920
2001-02 48 866 28 20 962
2002-03 51 995 30 24 1,100
2003-04 53 1,013 31 21 1,118
2004-05 54 1,004 35 16 1,109
2005-06 53 1,076 37 14 1,179
2006-07 54 1,271 32 13 1,370
2007-08 51 1,420 28 11 1,509
2008-09 42 1,330 28 15 1,416
2009-10 43 1,434 30 15 1,522
2010-11 41 1,462 33 13 1,550
2011-12 42 1,380 28 13 1,463

2012-13
(Apr-Dec) (P) 32 997 17 15 1,061
/1: Indian fiscal year (April-March)
P: Provisional estimate for April 2012 to Dec 2012.
Source: Textile Commissioner’s Office, GOI
Table 11: India's Exports of Textile Products (US$ million)
Indian fiscal year (April-March)
Item 2009-10 2010-11 2011-12 2012-13 (P)*
Cotton Textiles
Yarn/Fabric/Made-up 3,695 5,792 6,808 6,040
Readymade Garments 8,048 8,577 9,627 6,721
Sub-total 11,743 14,369 16,435 12,761
Man-made Textiles
Yarn/Fabric/Made-up 3,613 4,283 5,065 3,732
Readymade garments 1,215 1,479 2,177 1,982
Sub-total 4,828 5,762 7,242 5,714
Wool Textiles (Yarn/Fabric/Made-up) 470 442 508 354
Silk Textiles (Yarn/Fabric/Made-up) 596 632 473 337
Handloom Products 265 346 554 449
Handicrafts 962 1,294 1,079 992
Coir & Coir Manufacturers 161 160 213 164
Jute 218 460 457 324

Other Textiles Items (Carpets, floor covering, etc) 2,374 3,314 5,079 3,010
Other Textiles Readymade garments 802 971 1,269 1,159
Total Exports 22,419 27,748 33,310 25,264
Export statistics in the table exclude exports of fiber & fiber waste (cotton/ manmade/ silk/ wool/
others)
P - Provisional estimates
2012* refers to provisional estimates for April 2012 to Jan 2013, i.e., 10 months of IFY 2012/13.
Source: Textile Commissioner's Office and Directorate General of Commercial Intelligence and
Statistics, Ministry of Commerce
Table 12a: India’s Cotton Yarn* Exports by Month
(Figures in thousand Metric Tons)
Month/Year 2010-11 2011-12 2012-13
Aug 63.38 58.28 92.81
Sep 57.18 99.97 65.45
Oct 57.26 48.14 75.73
Nov 77.47 57.95 86.73
Dec 78.67 66.33 108.35
Jan 30.62 74.50 -
Feb 2.15 62.60 -
Mar 67.97 65.90 -
Apr 51.34 68.07 -
May 47.46 94.40 -
Jun 50.49 77.60 -
Jul 62.25 88.99 -
TOTAL 646.24 862.73 429.07
*HS code: 5204, 5205 and 5207
Source: Directorate General of Foreign Trade, Ministry of Commerce
Table 12a: India’s Cotton Fabric* Exports by Month
(Figures in thousand Metric Tons)
Month/Year 2010-11 2011-12 2012-13
Aug 160,275 69,847 76,236

Sep 54,091 78,881 72,229
Oct 58,393 57,317 70,239
Nov 44,896 59,584 65,249
Dec 58,806 84,697 74,432
Jan 69,052 79,762 -
Feb 70,709 80,219 -
Mar 61,286 80,233 -
Apr 74,807 68,851 -
May 68,259 71,988 -
Jun 65,899 83,648 -
Jul 82,835 68,129 -
TOTAL 869,309 883,157 358,383
*HS code: 5208 and 5209
Source: Directorate General of Foreign Trade, Ministry of Commerce
Table 13: India’s Cotton Export Policies Since 2010
Prior to April, 2010, exports of raw cotton were allowed without any restrictions or export taxes.
Export contracts had to be registered with the Textile Commissioner’s Office (TCO).
On April 9, 2010, the GOI imposed an export tax of Rs. 2,500 ($5.6) per metric ton on raw
cotton.
On April 19, 2010, the TCO suspended registration and exports of raw cotton (GAIN IN1039).
On May 21, 2010, the government moved exports of raw cotton to the restricted list, thereby
imposing licensing restrictions on exports of raw cotton. The Directorate General of Foreign
Trade (DGFT) issued export licenses for the unshipped export contracts registered with the TCO
prior to April 19, 2010 (GAIN IN1049).
On August 17, 2010, the government removed licensing restrictions on exports of raw cotton by
moving it from the restricted list to the free list and removed export tax. However, all export
contracts had to be registered with the TCO (GAIN IN1081).
On September 18, 2010, the Empowered Group of Ministers established an export quota of 4.3
million bales (5.5 million Indian bales) for Indian marketing year 2010/11 (October/September).
On October 1, 2010, the TCO commenced export contract registration and closed registration on
October 10, 2010 when the quota limit was reached. The TCO issued export authorization for
3.92 million bales to be shipped within the period of November 1 to December 15, 2010.
On December 16, 2010, the GOI issued a notification stating that exports of cotton were to be
registered with the DGFT instead of the TCO.
On December 16, 2010, the DGFT issued a circular stating the modalities of registration and
export of the “unutilized” export quota that could not be shipped before December 15, 2010
(GAIN IN1101).

In early January, the DGFT registered about 1.48 million 480 lb bales (1.9 million 170 kg bales)
of export contracts against the estimated ‘unutilized’ cotton quota that could not be shipped prior
to December 15, 2010, for shipment during January 27-February 26, 2011.
After February 27, 2011, no further exports of raw cotton were allowed.
On August 2, 2011, Cotton exports were placed on OGL (Open General License) without any
quantitative limits on exports subject to registration of export contracts with DGFT.
In November 2011, the Government of India lifted the import quota restrictions and allowed
duty free import of textile items from the Least Developed Member countries (LDCs) of South
Asia Free Trade Agreement (SAFTA) including Bangladesh, Bhutan, Maldives, Nepal and
Afghanistan.
On March 5, 2012, the Ministry of Textiles issued a notification effectively banning all raw
cotton exports.
On March 12, 2012, the Ministry of Textiles issued a notification clarifying the terms of the
export ban. Exports registered but not shipped before March 4, 2012 would be allowed but fresh
raw cotton exports were prohibited indefinitely.
On March 16, 2012, the Ministry of Textiles issued a notification outlining the procedure for
scrutiny and revalidation of registration certificates (RCs).
On March 22, 2012, the Ministry of Textiles issued a notification exempting 5,000 170 kg bales
of Assam Comilla Cotton exports from the ban.
On March 24, 2012, a trade notice was issued by the Ministry of Textiles notifying that priority
in scrutiny and revalidation of RCs for cotton exports will be given to neighboring countries
such as Bangladesh and Pakistan via land route to ease congestion at land borders.
On May 1, 2012, a policy circular was issued by the Ministry of Textiles on Clarification
regarding withdrawal of provision of revalidation of RCs by regional authorities (RAs) for
export of cotton and cotton yarn.
On May 4, 2012, a notification was issued by the Ministry of Textiles permitting the Cotton
Corporation of India (CCI) to export cotton during Indian cotton season MY 2011/12 (Oct/Sep).
On May 4 and May 8, 2012, shortly after lifting its ban on cotton exports, the Ministry of
Textiles issued notifications outlining new procedures for the registration of new cotton export
contracts. The new policy limited the amount of each RC to 10,000 170 kg bales (1,700 mt) of
cotton for established exporters and to 1,500 170 kg bales for exporters who have not exported
previously.
On May 10, 2012, the DGFT issued a circular stipulating additional conditions for obtaining
cotton RCs. Exporters were required to notify DGFT by e-mail of their intent to register
additional quantities followed by a hard copy of their application within two working days.
On May 24, 2012, a clarification was issued by DGFT regarding standard weight and tolerance
in weight of 1 Indian bale of cotton which is equivalent to 170 kilograms. The clarification was
issued in respect of exporters exporting cotton bales of non-standard weight. Weight of each bale
must be within the prescribed limit of 170 kg irrespective of the number of non-standard bales
shipped.
On October 1, 2012, procedure and conditions for registration of contracts for export of cotton
for 2012/13 were announced. The new policy limits the amount of each RC to 10,000 170 kg
bales (1,700 mt) of cotton for established exporters and to 1,500 170 kg bales for exporters who
have not exported previously. (GAIN IN2136)
On October 1, 2012, the Ministry of Textiles issued a notification exempting 5,000 170 kg bales
of Assam Comilla Cotton exports from any export restrictions.

On November 30, 2012, DGFT issued a notification modifying procedures and conditions
related to cotton export registration for Indian MY 2012/13 (Oct/Sep). The export policy was
amended to allow registration of cotton exports up to a maximum quantity of 30,000 170 kg
bales. Exporters must export 50 percent (15,000 170 kg bales) of a registration before they can
register an additional 30,000 170 kg bales. (GAIN IN2159)
On January 3, 2013, India’s Ministry of Commerce and Industry issued a policy circular
modifying procedures for cotton exports sent via the land route through the Wagah-Atari border
to Pakistan for the 2012/13 marketing year. To ease land congestion, Indian exporters have the
option to seek a onetime maximum 30 day extension based on the validity of the registration
certificate (RC) to complete any outstanding commitments due to delays. (GAIN IN3015)