India COTTON AND PRODUCTS ANNUAL Annual 2009 GAIN Publications/Commodity Report... · India COTTON...
31
Required Report - public distribution Date: 4/20/2009 GAIN Report Number: IN9058 India COTTON AND PRODUCTS ANNUAL Annual 2009 Approved By: Oliver Flake Prepared By: Santosh Singh Report Highlights: India‟s MY 2009/10 (August/July) cotton production is forecast to increase to a record 25.0 million U.S. bales on expected higher planted area and yields. Bt cotton coverage is expected to account for 87 percent of the forecast cotton area of 9.6 million hectares. Consumption is forecast to increase to 18.5 million bales on expected improvement in export and domestic demand for cotton textiles. Exports are forecast higher at a record 7.8 million bales; and imports at 390,000 bales, mostly extra long staple cotton.
Transcript of India COTTON AND PRODUCTS ANNUAL Annual 2009 GAIN Publications/Commodity Report... · India COTTON...
Required Report - public distribution
Date: 4/20/2009
GAIN Report Number: IN9058
India
COTTON AND PRODUCTS ANNUAL
Annual 2009
Approved By:
Oliver Flake
Prepared By:
Santosh Singh
Report Highlights: India‟s MY 2009/10 (August/July) cotton production is forecast to increase to a record 25.0
million U.S. bales on expected higher planted area and yields. Bt cotton coverage is expected
to account for 87 percent of the forecast cotton area of 9.6 million hectares. Consumption is
forecast to increase to 18.5 million bales on expected improvement in export and domestic
demand for cotton textiles. Exports are forecast higher at a record 7.8 million bales; and
imports at 390,000 bales, mostly extra long staple cotton.
Commodities:
Cotton
Production:
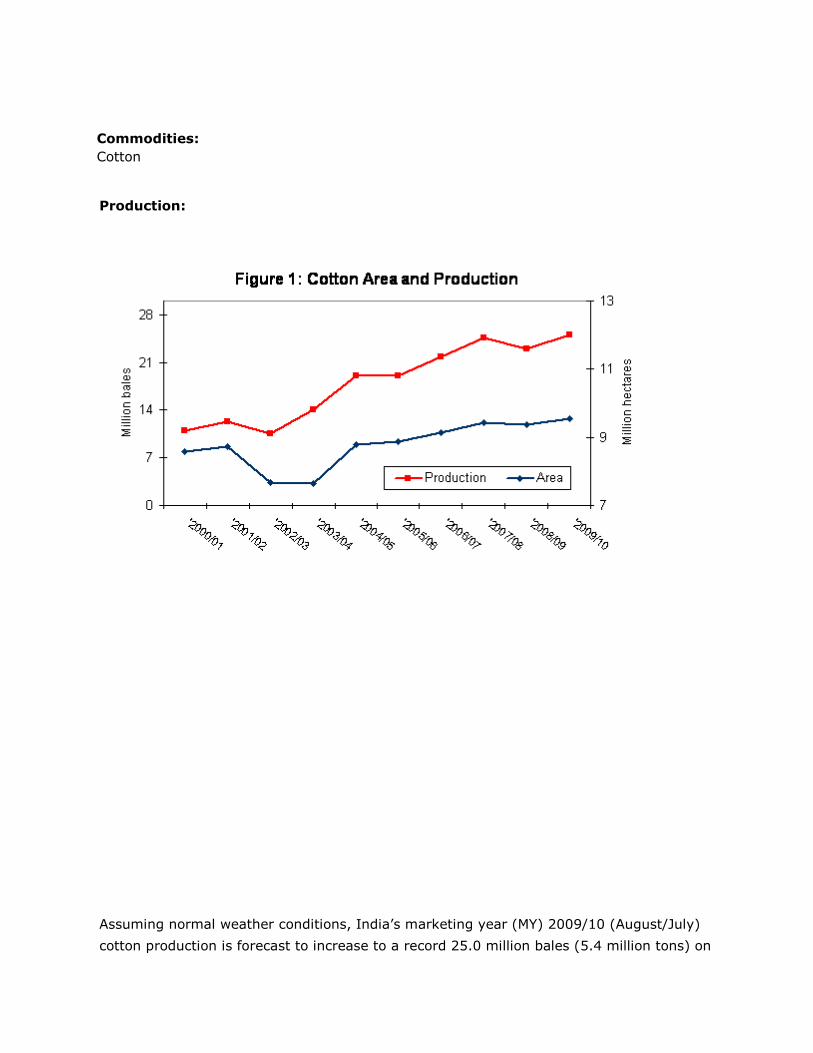
Assuming normal weather conditions, India‟s marketing year (MY) 2009/10 (August/July)
cotton production is forecast to increase to a record 25.0 million bales (5.4 million tons) on
expected higher planted area and yields (see Table 1). Cotton area in MY 2009/10 is
forecast to increase to a record 9.6 million hectares as cotton farmers this past year
realized higher net returns vis-à-vis other competing crop because of the significant hike in
the minimum support price (MSP) for seed cotton in MY 2008/09. Bt cotton is expected to
account for about 87 percent of the total planted area. Assuming timely and well
distributed monsoon rains and normal weather conditions, cotton yields are expected to
increase to 567 kg per hectare, a six percent increase over last year‟s weather impacted
crop.
Cotton, a predominantly monsoon-season crop, is planted from the end of April through
September, and harvested in the fall and winter (Table 4B). Planting intentions are largely
influenced by the relative price and profitability of cotton vis-à-vis competing crops (rice,
guar, and fodder crops in the north; coarse grains, pulses, and sugarcane in the central
region; and rice, tobacco, and chilies in the south). With farmers assured of the „highly‟
remunerative MSP prices in the upcoming season, cotton area in most cotton growing
states is forecast the same or slightly higher than last year. Strong end-season prices of
competing crops (paddy, maize, soybean, and peanuts) will limit any major shift in area
from competing crops to cotton (Table 3A). Assuming normal weather at planting time,
cotton planting is forecast to expand by 2 percent over last year‟s area to 9.58 million
hectares.
Cotton production has been a major success story in Indian agriculture as production more
than doubled from 10.6 million bales in MY 2002/03 to a record 24.6 million bales in
2007/08. Cotton production in MY 2008/09 faltered on late planting due to a prolonged
dry monsoon spell in July/August 2008. The latest cotton arrival estimates [1] indicate
that MY 2008/09 production will reach 23.0 million bales [2] from 9.5 million hectares with
the yield of 535 kg/hec. About 70 percent of total cotton production is accounted by the
states of Gujarat, Maharashtra and Andhra Pradesh (Table 3A).
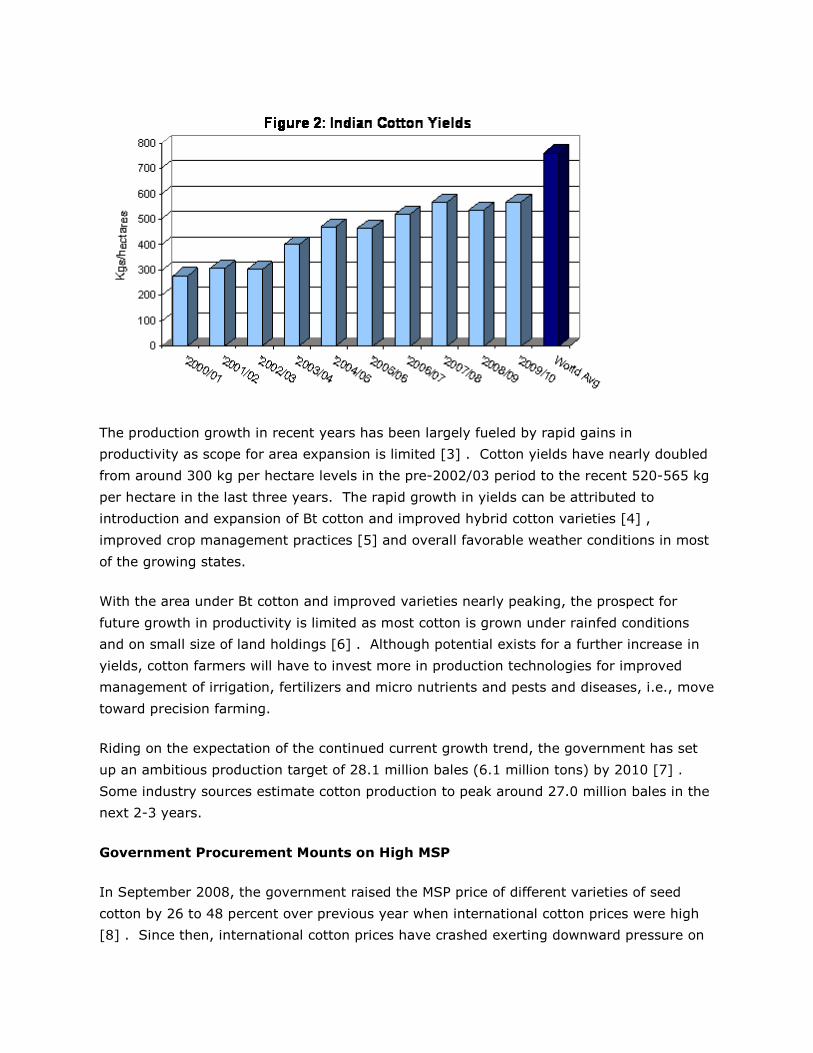
The production growth in recent years has been largely fueled by rapid gains in
productivity as scope for area expansion is limited [3] . Cotton yields have nearly doubled
from around 300 kg per hectare levels in the pre-2002/03 period to the recent 520-565 kg
per hectare in the last three years. The rapid growth in yields can be attributed to
introduction and expansion of Bt cotton and improved hybrid cotton varieties [4] ,
improved crop management practices [5] and overall favorable weather conditions in most
of the growing states.
With the area under Bt cotton and improved varieties nearly peaking, the prospect for
future growth in productivity is limited as most cotton is grown under rainfed conditions
and on small size of land holdings [6] . Although potential exists for a further increase in
yields, cotton farmers will have to invest more in production technologies for improved
management of irrigation, fertilizers and micro nutrients and pests and diseases, i.e., move
toward precision farming.
Riding on the expectation of the continued current growth trend, the government has set
up an ambitious production target of 28.1 million bales (6.1 million tons) by 2010 [7] .
Some industry sources estimate cotton production to peak around 27.0 million bales in the
next 2-3 years.
Government Procurement Mounts on High MSP
In September 2008, the government raised the MSP price of different varieties of seed
cotton by 26 to 48 percent over previous year when international cotton prices were high
[8] . Since then, international cotton prices have crashed exerting downward pressure on
domestic cotton prices, but the „artificially inflated‟ MSPs unrelated to the declining cotton
prices constrained the private trade from making normal seed cotton purchases from the
farmers. Consequently, government agencies like Cotton Corporation of India (CCI) and
state marketing federations have been forced to buy large quantities of cotton compared to
the previous years at the MSP [9] . While government procurement may have helped
stabilized domestic cotton prices, Indian cotton became uncompetitive in the international
market.
Industry sources report that government agencies have procured about 9.6 million bales
by April 5, 2009, nearly half of the total cotton arrivals. While government agencies had
been selling cotton at market prices, unrelated to the cost of procurement and processing,
sales had been very poor initially. In order to liquidate the ballooning stocks, the CCI
announced a bulk discount scheme, offering a discount of $23 to $29 per ton on the ruling
market price and other benefits for buyers purchasing cotton in bulk quantities of 10,000
bales and above (see Cotton Quarterly Update March IN9028). Industry sources report
that CCI and marketing federations have been able to sell about 5.1 million bales, but still
have about 4.5 million bales of unsold cotton. With the domestic cotton prices improving,
CCI has been slow in offering cotton for sale in the recent weeks. Industry sources report
that government agencies may procure about 10.5 million bales by the end of the season.
While the private trade (ginners/traders) and textile mills have been strongly advocating
the lowering of MSP prices, the government is highly unlikely to lower the MSP due to
political compulsions. With forecast bumper MY 2009/10 production, government agencies
will have to undertake significant MSP procurement from the beginning of the upcoming
season. Industry sources report that government agencies will be under tremendous
pressure by June/July to sell cotton and reduce their stocks to manageable levels to enable
them to undertake the MSP operation in the upcoming season. Given the reports that the
quality of government stocks may not be good, government agencies will have to offer
price incentives for liquidating their cotton stocks if the current price parity between local
and international cotton remains steady. Consequently, government agencies will have to
write off huge costs incurred in procurement, processing and carrying of cotton under the
MSP. The new government to be elected in May after the parliamentary elections will have
to take a decision on management of government cotton stocks and MSP procurement for
the upcoming season.
Bt Cotton – The Success Story
After the „Green Revolution‟ in cereal crops in late the 1960‟s, Bt cotton has been the
genesis for the „Cotton Revolution‟ in Indian agriculture. Since the introduction of Bt
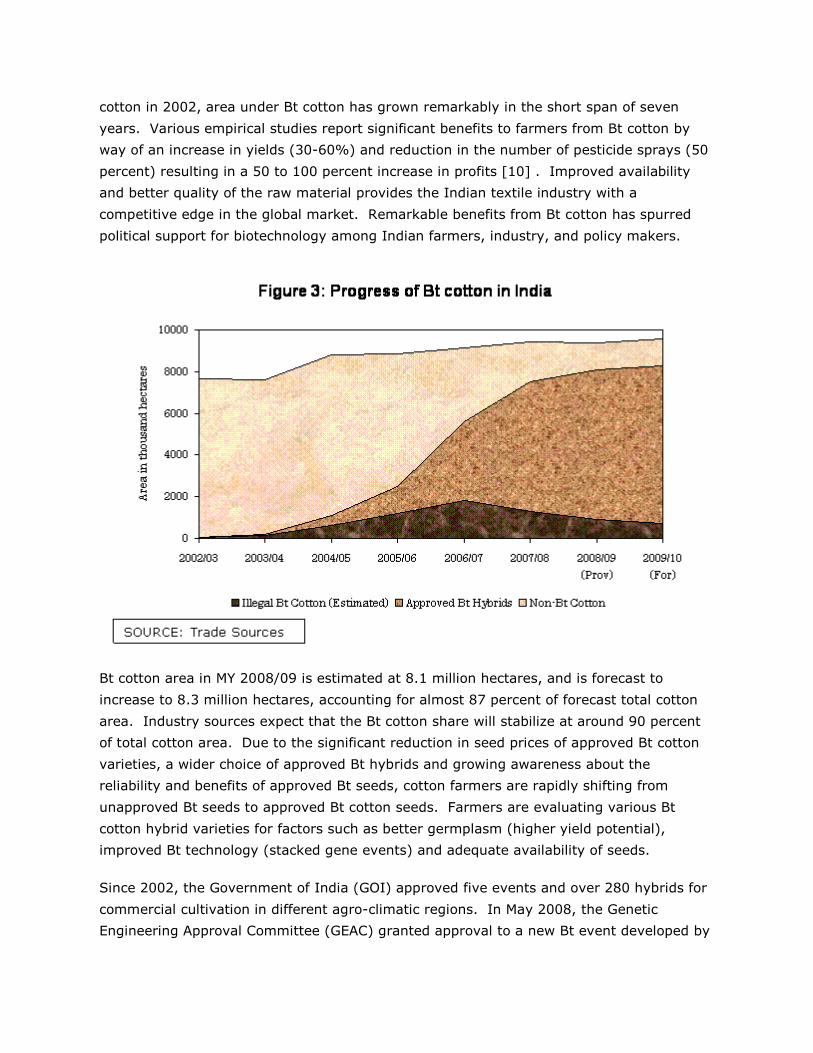
cotton in 2002, area under Bt cotton has grown remarkably in the short span of seven
years. Various empirical studies report significant benefits to farmers from Bt cotton by
way of an increase in yields (30-60%) and reduction in the number of pesticide sprays (50
percent) resulting in a 50 to 100 percent increase in profits [10] . Improved availability
and better quality of the raw material provides the Indian textile industry with a
competitive edge in the global market. Remarkable benefits from Bt cotton has spurred
political support for biotechnology among Indian farmers, industry, and policy makers.
Bt cotton area in MY 2008/09 is estimated at 8.1 million hectares, and is forecast to
increase to 8.3 million hectares, accounting for almost 87 percent of forecast total cotton
area. Industry sources expect that the Bt cotton share will stabilize at around 90 percent
of total cotton area. Due to the significant reduction in seed prices of approved Bt cotton
varieties, a wider choice of approved Bt hybrids and growing awareness about the
reliability and benefits of approved Bt seeds, cotton farmers are rapidly shifting from
unapproved Bt seeds to approved Bt cotton seeds. Farmers are evaluating various Bt
cotton hybrid varieties for factors such as better germplasm (higher yield potential),
improved Bt technology (stacked gene events) and adequate availability of seeds.
Since 2002, the Government of India (GOI) approved five events and over 280 hybrids for
commercial cultivation in different agro-climatic regions. In May 2008, the Genetic
Engineering Approval Committee (GEAC) granted approval to a new Bt event developed by
the Central Institute of Cotton Research (CICR), and incorporated in a popular cotton
variety Bikaneri Narma. With this, Bt technology has been for the first time introduced in a
varietal background whereby farmers can save the seeds. The Bt seeds of the CICR event
will be available to farmers for planting in the upcoming 2009/10 season.
Most of the approved Bt cotton hybrids are from two Monsanto events, including the
Bollgard II (stacked gene event) that provides protection against a wider range of
bollworm pest. Indian cotton farmers have a wider choice of Bt cotton hybrids as they
increasingly adopt higher yielding Bt hybrids (better germplasm or improved Bt technology
like BG-II) among range of available approved Bt hybrids.
Approval of Bt Events and Hybrids for Commercial Cultivation
Year Events No. of Hybrid
Varieties
2002/03 MMBL‟s Bollgard I Three
2003/04 MMBL‟s Bollgard I Three
2004/05 MMBL‟s Bollgard I Four
2005/06 MMBL‟s Bollgard I Twenty
2006/07 MMBL‟s Bollgard I & II; JK Seed‟s Event 1, and Nath
Seeds GFM Event
Sixty Two
2007/08 MMBL‟s Bollgard I & II; JK Seed‟s Event 1, and Nath
Seeds GFM Event
One hundred and
sixty two
2008/09 MMBL‟s Bollgard I & II; JK Seed‟s Event 1, Nath Seeds
GFM Event, and CICR Event
Two Hundred and
Eighty One
According to industry sources [11] , in addition to the approved varieties, there are several
(about fifty) Bt cotton hybrids, illegally developed, multiplied and marketed by farmers and
seed companies, which are available at cheaper rates vis-à-vis approved hybrids.
However, area under unapproved Bt cotton seed has been rapidly declining since 2006
after seed companies were forced to slash the Bt cotton seed prices by state governments.
The price differential between approved and unapproved Bt hybrids has declined
significantly and farmers prefer to plant approved Bt hybrid seeds due to the higher risk
associated with production from unapproved Bt cotton seeds.
The success of Bt cotton is resulting in a significant change in the varietal profile and share
of different types of cotton produced in India. As most of the Bt hybrids are of medium
and long staple cotton (26 to 32 mm), there is an increasing shortage of domestic cotton
of short staple (below 22 mm) and extra long staple (35 mm and above). If the current
trend continues, the domestic textile industry may have to augment their short staple
cotton requirements through imports which they are already doing in the case of extra long
staple cotton.
[1] Market arrivals, through April 11, 2009, are estimated at 20.4 million bales vis-à-vis 22.3 million bales for the
comparable period last year. [2] India's second largest crop to date. [3] Industry sources estimate cotton area to peak at 9.8 million hectares. [4] Bt cotton in India is nearly all hybrid cotton varieties, which have better yield potential due to better
germplasm vis-à-vis traditional varieties. With the successful adoption of Bt cotton, the share of hybrid cotton
has expanded from 30-35 percent in pre-Bt cotton era to about 85 percent. The expansion in area under hybrid
cotton varieties coupled with lower crop losses due to the Bt technology has supported the phenomenal yield
gains of the recent years. [5] The cost of Bt and hybrid cotton seeds (Rs. 750per acre) significantly higher than traditional varieties (Rs.200-
400 per acre). Higher investment at the time of planting encourages farmers to follow better crop management
practices. [6] There are about 5.5 million cotton farmers with the average size of holding of less than a hectare which limits
their ability to adopt capital intensive production technologies and infrastructure. [7] Report from the working group on textile and jute industry for the 11th five year plan (2007-2012)
http://www.txcindia.com. [8] For more information, refer Cotton Quarterly Update-December (IN8140) [9] MSP operations in MY 2007/08 were minimal as market prices were higher than the MSP in most purchase
centers. The highest government procurement (CCI‟s MSP and Maharashtra Monopoly procurement) was
recorded in MY 2004/05 at an estimated 5.1 million bales. [10] Source: James Clive, “Global Status of Commercialized Biotech/GM Crops: 2007”, ISAA Brief 37 [11] No official estimates are available for the number of illegal Bt hybrids and area under illegal Bt cotton.
Consumption:
Cotton consumption in MY 2009/10 is forecast to recover to 18.5 million bales (4.0 million
tons) on expected improvement in domestic and export demand for textiles and sufficient
domestic supplies (see Table 1). With the value of the Indian rupee vis-à-vis U.S. dollar
expected to remain steady at the current low [1] , industry sources expect recovery in
export demand for Indian textiles. Expected continued growth in the Indian population and
economy [2] should support domestic demand for textile.
Post‟s MY 2008/09 consumption estimate is revised marginally upward to 17.3 million bales
(3.9 million tons) based on the latest monthly consumption figures (Table 4) and
information from market sources.
After robust growth for three consecutive years, India‟s cotton consumption faltered in MY
2008/09 due to a slowdown in export demand and high cotton prices. However, the recent
strong depreciation in the value of Indian rupee vis-à-vis the U.S. dollar since the beginning
of 2009 has resulted in a revival in export demand. There has been a recovery in exports
of cotton yarn and textiles since February, resulting in a lowering of their inventories to
manageable levels and improvement in production activities. Industry sources report a
recovery in prices of cotton yarn and textiles since March 2008, which should improve the
prospects for domestic consumption. Industry sources expect cotton consumption to
recover further in MY 2009/10 on continued growth in the economy, an expanding middle
class and a strong rural economy. Consequently, MY 2009/10 consumption is forecast to
increase by about 6 percent to 18.5 million bales.
Cotton‟s share in the textile industry‟s total fiber use (Table 13) in Indian fiscal year (IFY)
2008/09 (April/March) is estimated to increase to 59.5 percent due to relatively higher
cotton prices vis-à-vis man-made fiber (MMF) during most of 2008. However, prices of
man-made fibers have sharply declined since November/December 2008, while cotton
prices have gained in recent months. Assuming the current relative price ratio remains
stable in the future, cotton‟s share in total fiber use is estimated to decrease by one percent
to 58.5 percent in IFY 2009/10.
Due to tropical weather conditions and tradition, cotton is the preferred fiber in India.
However, poly-cotton blends are becoming increasingly popular in India due to their
durability and ease of maintenance under tropical conditions. Mills are increasingly shifting
their cotton/polyester blends in favor of polyester. Future growth in cotton usage is likely
to be determined by the relative prices of cotton vis-à-vis MMFs.
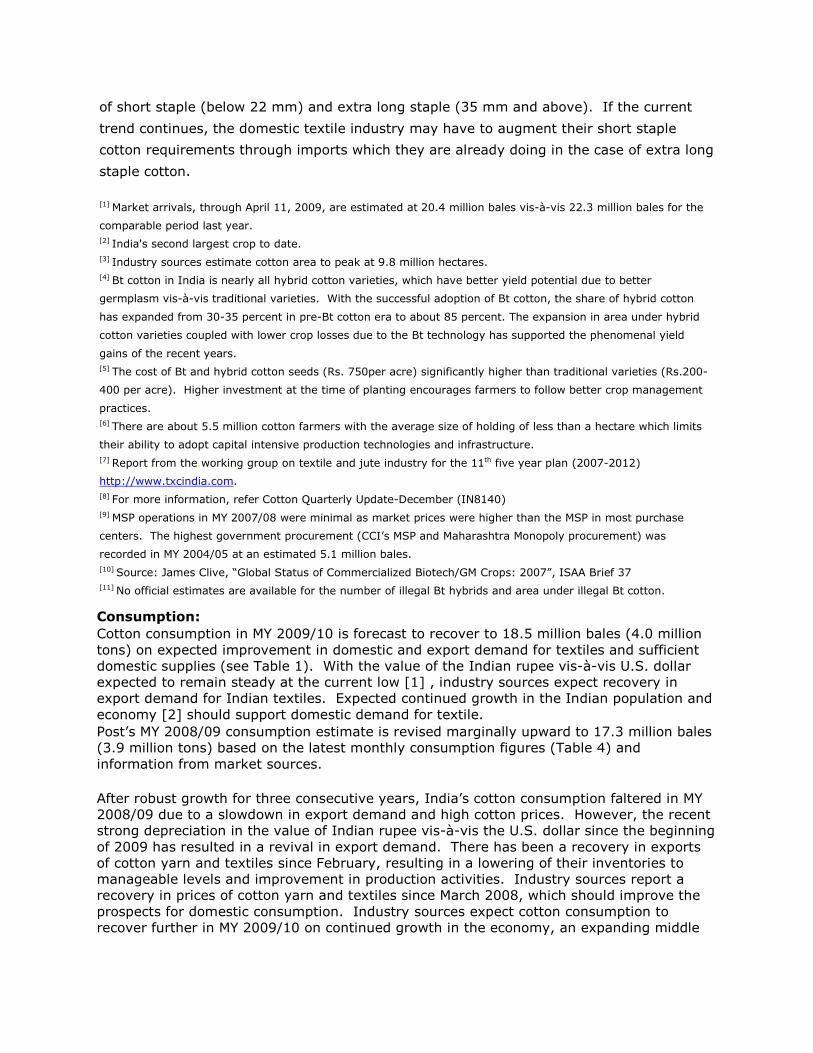
Prices
The government‟s MSP operations steadied the domestic cotton prices during MY 2008/09
despite weak international cotton prices and bumper production (Table 6). Nevertheless,
current prices of most cotton varieties are 18 to 25 percent lower than last year‟s record
ending prices.
Prices of the most commonly traded varieties are currently ranging between 58 to 60 cents
per lb. While the domestic cotton prices during the upcoming MY 2009/10 should closely
follow the international cotton price movement, prices are expected to be steady on
sufficient domestic supplies.
[1] Value of the Indian rupee vis-à-vis US Dollars has depreciated by over 30 percent from Rs. 39.4 in January 2008 to Rs. 52.0 by March, 2009. [2] Due to the global recession, the growth of the Indian economy has slowed down from 9.0 percent in 2007/08 to an estimated 7.0 percent in 2008/09 and may grow at 5-6 percent in 2009/10. As per the latest census, Indian population has been growing at 1.8 percent per annum.
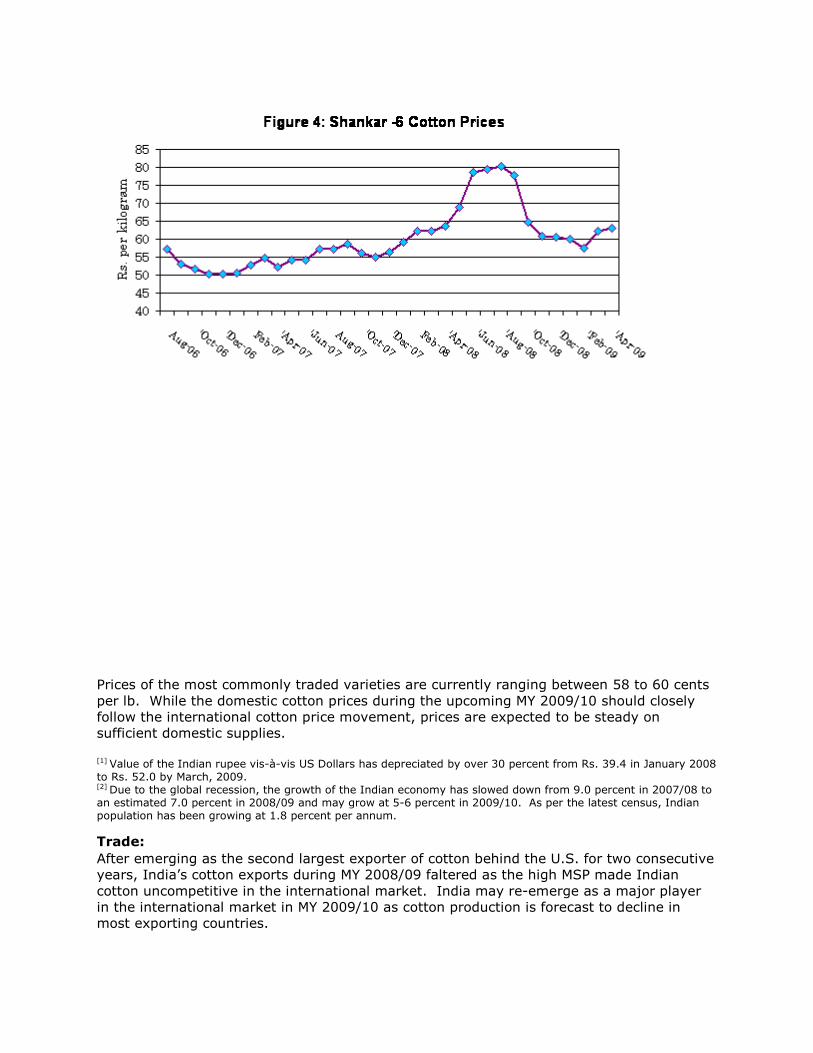
Trade:
After emerging as the second largest exporter of cotton behind the U.S. for two consecutive
years, India‟s cotton exports during MY 2008/09 faltered as the high MSP made Indian
cotton uncompetitive in the international market. India may re-emerge as a major player
in the international market in MY 2009/10 as cotton production is forecast to decline in
most exporting countries.
Post forecast‟s cotton exports in MY 2009/10 to increase to a record 7.8 million bales (1.7
million tons) on forecast sufficient domestic supplies and the weak Indian rupee vis-à-vis
other currencies (see Table 1). Imports in MY 2009/10 are forecast at 390,000 bales
(85,000 tons), mostly extra long staple (ELS) and some short staple cotton to augment
declining local supplies of ELS and short staple cotton. However, the relative price of local
cotton vis-à-vis world cotton and the quality of domestic cotton during the upcoming season
may temper these forecast trade volumes.
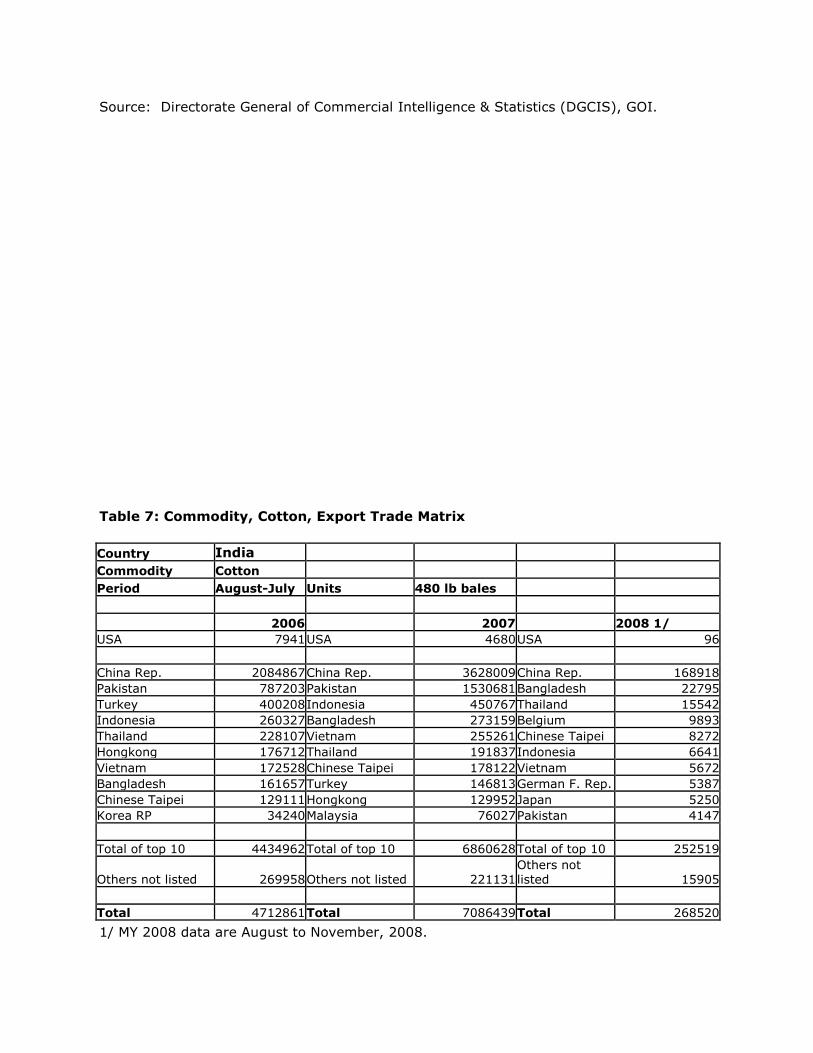
Post‟s MY 2008/09 export estimate has been lowered to 2.0 million bales (0.4 million tons)
based on available official estimates for the first four months of the marketing year and
information from trade sources [1] . Official export registration with the Textile
Commissioner‟s Office indicate that about 1.54 million bales have been registered for export
from August 2008 to March 2009, of which only about 790,000 bales have been shipped.
Major export destinations have been Bangladesh, Pakistan, China and other Far-east
countries. The export registrations during the months of February/March have been
reported at 0.8 million bales for delivery through May, 2009. Market sources report that
export prospects for Indian cotton have improved since February, 2009 due to the decline
in the value of Indian rupee vis-à-vis the U.S. dollar. Assuming current price parity
between Indian cotton vis-à-vis other origin remains stable, MY 2008/09 exports are
expected to reach 2.0 million bales due to strong exports during the coming months.
Post‟s MY 2008/09 import estimate has been revised higher to 625,000 bales based on
available official statistics for the first four months of the marketing year. Most of the
imports have been ELS and some short staple cotton from the U.S., Egypt, and West
Africa. Based on the revised official statistics, MY 2007/08 imports have been revised
higher to 600,000 bales. [1] Official export figures are available for four months of the MY 2007/08, i.e., August –November 2008 (see table 6).
Stocks:
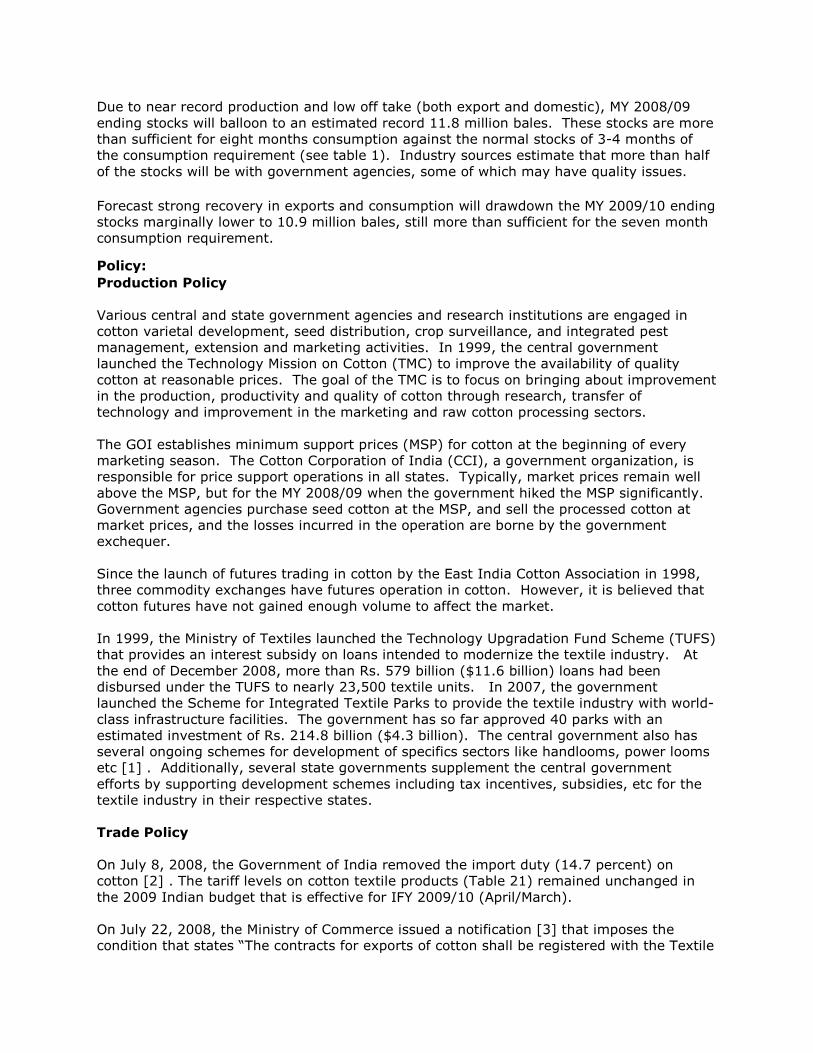
Due to near record production and low off take (both export and domestic), MY 2008/09
ending stocks will balloon to an estimated record 11.8 million bales. These stocks are more
than sufficient for eight months consumption against the normal stocks of 3-4 months of
the consumption requirement (see table 1). Industry sources estimate that more than half
of the stocks will be with government agencies, some of which may have quality issues.
Forecast strong recovery in exports and consumption will drawdown the MY 2009/10 ending
stocks marginally lower to 10.9 million bales, still more than sufficient for the seven month
consumption requirement.
Policy:
Production Policy
Various central and state government agencies and research institutions are engaged in
cotton varietal development, seed distribution, crop surveillance, and integrated pest
management, extension and marketing activities. In 1999, the central government
launched the Technology Mission on Cotton (TMC) to improve the availability of quality
cotton at reasonable prices. The goal of the TMC is to focus on bringing about improvement
in the production, productivity and quality of cotton through research, transfer of
technology and improvement in the marketing and raw cotton processing sectors.
The GOI establishes minimum support prices (MSP) for cotton at the beginning of every
marketing season. The Cotton Corporation of India (CCI), a government organization, is
responsible for price support operations in all states. Typically, market prices remain well
above the MSP, but for the MY 2008/09 when the government hiked the MSP significantly.
Government agencies purchase seed cotton at the MSP, and sell the processed cotton at
market prices, and the losses incurred in the operation are borne by the government
exchequer.
Since the launch of futures trading in cotton by the East India Cotton Association in 1998,
three commodity exchanges have futures operation in cotton. However, it is believed that
cotton futures have not gained enough volume to affect the market.
In 1999, the Ministry of Textiles launched the Technology Upgradation Fund Scheme (TUFS)
that provides an interest subsidy on loans intended to modernize the textile industry. At
the end of December 2008, more than Rs. 579 billion ($11.6 billion) loans had been
disbursed under the TUFS to nearly 23,500 textile units. In 2007, the government
launched the Scheme for Integrated Textile Parks to provide the textile industry with world-
class infrastructure facilities. The government has so far approved 40 parks with an
estimated investment of Rs. 214.8 billion ($4.3 billion). The central government also has
several ongoing schemes for development of specifics sectors like handlooms, power looms
etc [1] . Additionally, several state governments supplement the central government
efforts by supporting development schemes including tax incentives, subsidies, etc for the
textile industry in their respective states.
Trade Policy
On July 8, 2008, the Government of India removed the import duty (14.7 percent) on
cotton [2] . The tariff levels on cotton textile products (Table 21) remained unchanged in
the 2009 Indian budget that is effective for IFY 2009/10 (April/March).
On July 22, 2008, the Ministry of Commerce issued a notification [3] that imposes the
condition that states “The contracts for exports of cotton shall be registered with the Textile
Commissioner prior to shipment. Clearance of cotton consignments by customs should be
done after verifying that the contracts have been registered.”
This was done to enable the government to monitor India‟s exports of cotton as well as the
domestic cotton supply situation. Earlier, export statistics were made available to the
government with a lag of 4-6 months after physical exports since the Directorate General of
Commercial Intelligence takes some time in collecting, compiling and tabulating the custom
statistics from each port
On February 17, 2009, the government announced the Vishesh Krishi Gram Upaj Yojana [4]
(VKGUY) benefit to exports of raw cotton to encourage cotton exports and liquidate
burdensome cotton stocks from the domestic market. The benefits have been extended on
a retrospective basis for cotton exports from April 1, 2008 to June 30, 2009, wherein
exporters are entitled to a five percent duty credit scrip on the FOB value, which can be
traded and used for availing a duty relief for imports. The Indian textile industry has
strongly opposed the move as the policy to subsidize cotton exports will give undue benefit
to their competitors from China, Pakistan, Bangladesh and Indonesia in the global cotton
textile market. However, market sources believe that the government may extend the June
30, 2009 deadline further through the MY 2009/10 season if the current price parity
between the domestic and international market does not change substantially in favor of
exports.
With the expiration of the MFA in January 2005, Indian exports of all textile products have
been liberalized. In an effort to promote the export of value-added cotton textiles, the GOI
provides various incentives. Export oriented units (EOUs) and firms importing against an
advance license receive a duty drawback (zero duty for EOUs, and duty discounts for
others) on imports of raw materials for the export of value-added goods. Under the “Export
Promotion Capital Goods” plan, imports of capital goods and machinery are allowed at
reduced duty rates against export obligations (zero duty for a 100 percent EOU).
In the recent annual supplement to the foreign trade policy, the government announced
that textile and leather product exporters will get direct government assistance of 2% of
their FOB value of exports to the U.S. and E.U as duty free scrip‟s. The scheme will be
effective for the period April August 2009 and a sum of Rs. 32.5 million ($0.65 million) has
been allotted for the scheme.
[1] For more information on TUFS and other central government schemes for the textile industry, refer the website of Office of the Textile Commissioner http://www.txcindia.com/ and review various schemes in the heading „Progress of Central Schemes‟. [2] http://www.cbec.gov.in/customs/cs-act/notifications/notfns-2k8/cs84-2k8.htm [3] No 26(RE-2008)/2004-09 http://164.100.9.245/exim/2000/not/not08/not2608.htm) [4] Special Agriculture & Village Produce Scheme
Marketing:
India should be in the cotton export market for the next few (3-4) years, until domestic
consumption catches up with production. Most exports are expected to be of medium-to-
long staple cotton (25 to 32 mm length) to neighboring countries, China, and Far East
countries. Post expects India to continue to import ELS and quality long staple cotton (28-
34 mm), with occasional imports of short staple cotton (below 22 mm) when international
prices are favorable. The United States has been the leading supplier of cotton to India
over the past few years, but volumes have declined in recent years on sufficient domestic
supplies.
Indian mills importing U.S. Pima and upland cotton are appreciative of its quality and
consistency. However, U.S. cotton faces severe competition from neighboring suppliers like
Egypt, West Africa, the Commonwealth of Independent States (CIS), and Australia due to
their freight advantage and shorter delivery periods.
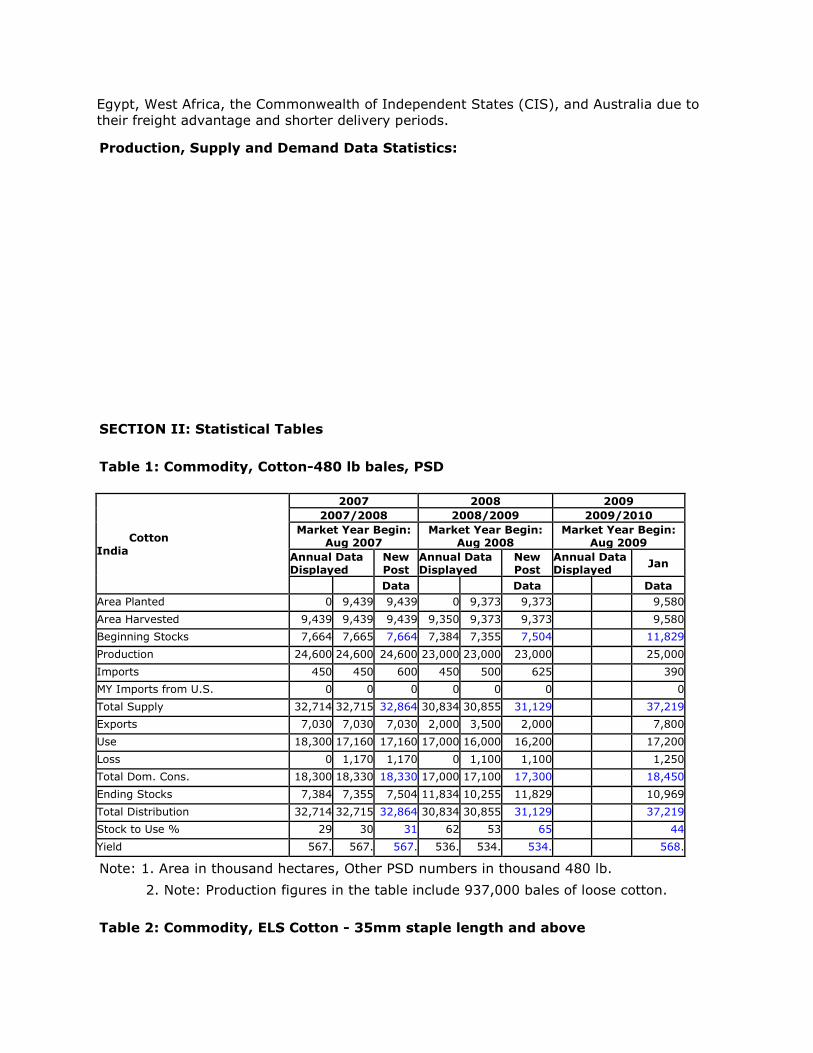
Production, Supply and Demand Data Statistics:
SECTION II: Statistical Tables
Table 1: Commodity, Cotton-480 lb bales, PSD
Cotton
India
2007 2008 2009 2007/2008 2008/2009 2009/2010
Market Year Begin: Aug 2007
Market Year Begin: Aug 2008
Market Year Begin: Aug 2009
Annual Data Displayed
New Post
Annual Data Displayed
New Post
Annual Data Displayed Jan
Data Data Data Area Planted 0 9,439 9,439 0 9,373 9,373 9,580
Area Harvested 9,439 9,439 9,439 9,350 9,373 9,373 9,580
Beginning Stocks 7,664 7,665 7,664 7,384 7,355 7,504 11,829
Production 24,600 24,600 24,600 23,000 23,000 23,000 25,000
Imports 450 450 600 450 500 625 390
MY Imports from U.S. 0 0 0 0 0 0 0
Total Supply 32,714 32,715 32,864 30,834 30,855 31,129 37,219
Exports 7,030 7,030 7,030 2,000 3,500 2,000 7,800
Use 18,300 17,160 17,160 17,000 16,000 16,200 17,200
Loss 0 1,170 1,170 0 1,100 1,100 1,250
Total Dom. Cons. 18,300 18,330 18,330 17,000 17,100 17,300 18,450
Ending Stocks 7,384 7,355 7,504 11,834 10,255 11,829 10,969
Total Distribution 32,714 32,715 32,864 30,834 30,855 31,129 37,219
Stock to Use % 29 30 31 62 53 65 44
Yield 567. 567. 567. 536. 534. 534. 568.
Note: 1. Area in thousand hectares, Other PSD numbers in thousand 480 lb.
2. Note: Production figures in the table include 937,000 bales of loose cotton.
Table 2: Commodity, ELS Cotton - 35mm staple length and above
Units : 480 lbs bales 2006/07
Final
2007/08
Final
2008/09
Revised
2009/10
Forecast
Beginning Stocks 59400 51450 51450 21950
Production 156000 156000 140500 135000
Imports 265500 250000 175000 230000
Total Supply 480900 457450 366950 386950
Exports 0 0 0 0
Domestic Consumption 429450 406000 345000 375000
Ending Stocks 51450 51450 21950 11950
Total Distribution 480900 457450 366950 386950
Source: Trade sources
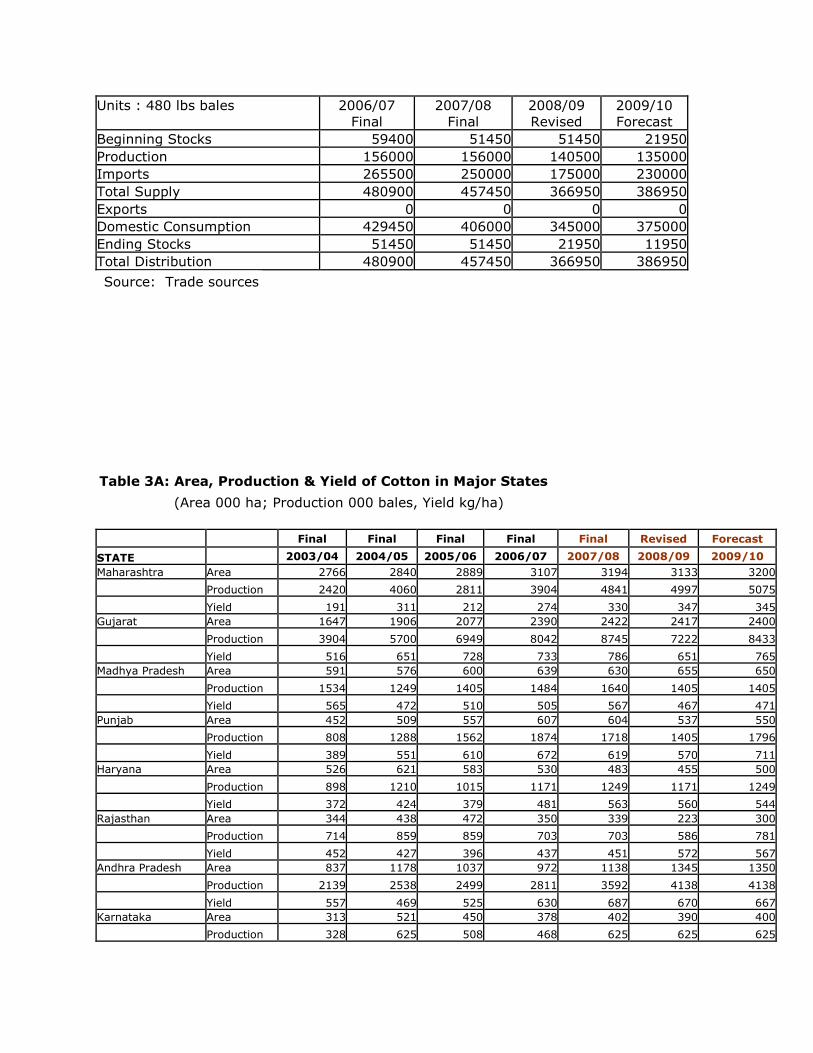
Table 3A: Area, Production & Yield of Cotton in Major States
(Area 000 ha; Production 000 bales, Yield kg/ha)
Final Final Final Final Final Revised Forecast
STATE 2003/04 2004/05 2005/06 2006/07 2007/08 2008/09 2009/10 Maharashtra Area 2766 2840 2889 3107 3194 3133 3200
Production 2420 4060 2811 3904 4841 4997 5075
Yield 191 311 212 274 330 347 345 Gujarat Area 1647 1906 2077 2390 2422 2417 2400
Production 3904 5700 6949 8042 8745 7222 8433
Yield 516 651 728 733 786 651 765 Madhya Pradesh Area 591 576 600 639 630 655 650
Production 1534 1249 1405 1484 1640 1405 1405
Yield 565 472 510 505 567 467 471 Punjab Area 452 509 557 607 604 537 550
Production 808 1288 1562 1874 1718 1405 1796
Yield 389 551 610 672 619 570 711 Haryana Area 526 621 583 530 483 455 500
Production 898 1210 1015 1171 1249 1171 1249
Yield 372 424 379 481 563 560 544 Rajasthan Area 344 438 472 350 339 223 300
Production 714 859 859 703 703 586 781
Yield 452 427 396 437 451 572 567 Andhra Pradesh Area 837 1178 1037 972 1138 1345 1350
Production 2139 2538 2499 2811 3592 4138 4138
Yield 557 469 525 630 687 670 667 Karnataka Area 313 521 450 378 402 390 400
Production 328 625 508 468 625 625 625
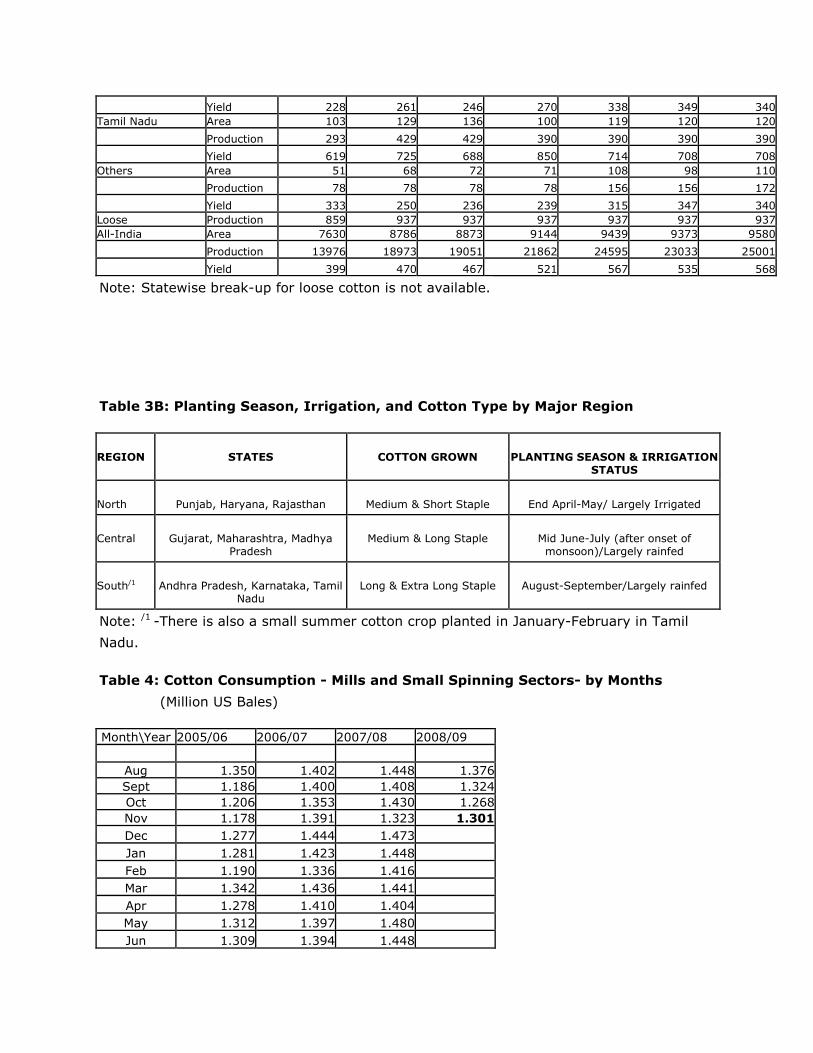
Yield 228 261 246 270 338 349 340 Tamil Nadu Area 103 129 136 100 119 120 120
Production 293 429 429 390 390 390 390
Yield 619 725 688 850 714 708 708 Others Area 51 68 72 71 108 98 110
Production 78 78 78 78 156 156 172
Yield 333 250 236 239 315 347 340 Loose Production 859 937 937 937 937 937 937 All-India Area 7630 8786 8873 9144 9439 9373 9580
Production 13976 18973 19051 21862 24595 23033 25001
Yield 399 470 467 521 567 535 568
Note: Statewise break-up for loose cotton is not available.
Table 3B: Planting Season, Irrigation, and Cotton Type by Major Region
REGION
STATES
COTTON GROWN
PLANTING SEASON & IRRIGATION
STATUS
North
Punjab, Haryana, Rajasthan
Medium & Short Staple
End April-May/ Largely Irrigated
Central
Gujarat, Maharashtra, Madhya
Pradesh
Medium & Long Staple
Mid June-July (after onset of monsoon)/Largely rainfed
South/1
Andhra Pradesh, Karnataka, Tamil
Nadu
Long & Extra Long Staple
August-September/Largely rainfed
Note: /1 -There is also a small summer cotton crop planted in January-February in Tamil
Nadu.
Table 4: Cotton Consumption - Mills and Small Spinning Sectors- by Months
(Million US Bales)
Month\Year 2005/06 2006/07 2007/08 2008/09
Aug 1.350 1.402 1.448 1.376 Sept 1.186 1.400 1.408 1.324 Oct 1.206 1.353 1.430 1.268 Nov 1.178 1.391 1.323 1.301
Dec 1.277 1.444 1.473
Jan 1.281 1.423 1.448
Feb 1.190 1.336 1.416
Mar 1.342 1.436 1.441
Apr 1.278 1.410 1.404
May 1.312 1.397 1.480
Jun 1.309 1.394 1.448
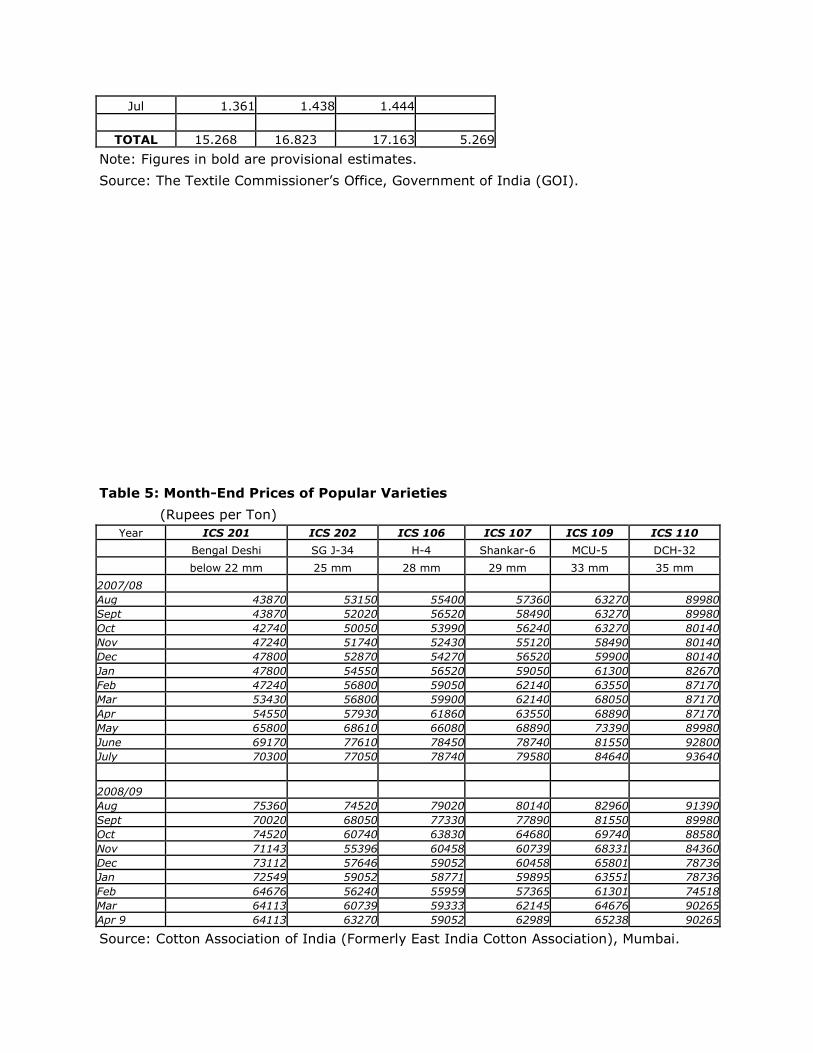
Jul 1.361 1.438 1.444
TOTAL 15.268 16.823 17.163 5.269
Note: Figures in bold are provisional estimates.
Source: The Textile Commissioner‟s Office, Government of India (GOI).
Table 5: Month-End Prices of Popular Varieties
(Rupees per Ton)
Year ICS 201 ICS 202 ICS 106 ICS 107 ICS 109 ICS 110
Bengal Deshi SG J-34 H-4 Shankar-6 MCU-5 DCH-32
below 22 mm 25 mm 28 mm 29 mm 33 mm 35 mm
2007/08 Aug 43870 53150 55400 57360 63270 89980 Sept 43870 52020 56520 58490 63270 89980 Oct 42740 50050 53990 56240 63270 80140 Nov 47240 51740 52430 55120 58490 80140 Dec 47800 52870 54270 56520 59900 80140 Jan 47800 54550 56520 59050 61300 82670 Feb 47240 56800 59050 62140 63550 87170 Mar 53430 56800 59900 62140 68050 87170 Apr 54550 57930 61860 63550 68890 87170 May 65800 68610 66080 68890 73390 89980 June 69170 77610 78450 78740 81550 92800 July 70300 77050 78740 79580 84640 93640
2008/09 Aug 75360 74520 79020 80140 82960 91390 Sept 70020 68050 77330 77890 81550 89980 Oct 74520 60740 63830 64680 69740 88580 Nov 71143 55396 60458 60739 68331 84360 Dec 73112 57646 59052 60458 65801 78736 Jan 72549 59052 58771 59895 63551 78736 Feb 64676 56240 55959 57365 61301 74518 Mar 64113 60739 59333 62145 64676 90265 Apr 9 64113 63270 59052 62989 65238 90265
Source: Cotton Association of India (Formerly East India Cotton Association), Mumbai.
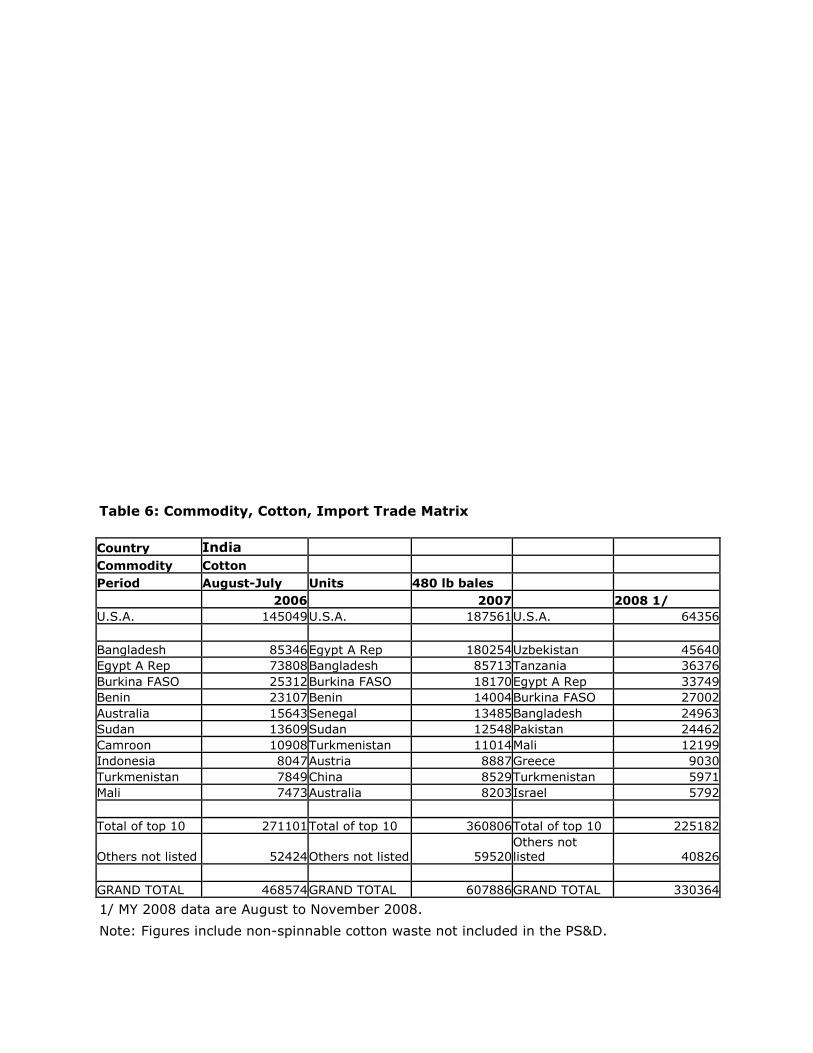
Table 6: Commodity, Cotton, Import Trade Matrix
Country India
Commodity Cotton
Period August-July Units 480 lb bales
2006 2007 2008 1/ U.S.A. 145049 U.S.A. 187561 U.S.A. 64356
Bangladesh 85346 Egypt A Rep 180254 Uzbekistan 45640 Egypt A Rep 73808 Bangladesh 85713 Tanzania 36376 Burkina FASO 25312 Burkina FASO 18170 Egypt A Rep 33749 Benin 23107 Benin 14004 Burkina FASO 27002 Australia 15643 Senegal 13485 Bangladesh 24963 Sudan 13609 Sudan 12548 Pakistan 24462 Camroon 10908 Turkmenistan 11014 Mali 12199 Indonesia 8047 Austria 8887 Greece 9030 Turkmenistan 7849 China 8529 Turkmenistan 5971 Mali 7473 Australia 8203 Israel 5792
Total of top 10 271101 Total of top 10 360806 Total of top 10 225182
Others not listed 52424 Others not listed 59520 Others not listed 40826
GRAND TOTAL 468574 GRAND TOTAL 607886 GRAND TOTAL 330364
1/ MY 2008 data are August to November 2008.
Note: Figures include non-spinnable cotton waste not included in the PS&D.
Source: Directorate General of Commercial Intelligence & Statistics (DGCIS), GOI.
Table 7: Commodity, Cotton, Export Trade Matrix
Country India
Commodity Cotton
Period August-July Units 480 lb bales
2006 2007 2008 1/ USA 7941 USA 4680 USA 96
China Rep. 2084867 China Rep. 3628009 China Rep. 168918 Pakistan 787203 Pakistan 1530681 Bangladesh 22795 Turkey 400208 Indonesia 450767 Thailand 15542 Indonesia 260327 Bangladesh 273159 Belgium 9893 Thailand 228107 Vietnam 255261 Chinese Taipei 8272 Hongkong 176712 Thailand 191837 Indonesia 6641 Vietnam 172528 Chinese Taipei 178122 Vietnam 5672 Bangladesh 161657 Turkey 146813 German F. Rep. 5387 Chinese Taipei 129111 Hongkong 129952 Japan 5250 Korea RP 34240 Malaysia 76027 Pakistan 4147
Total of top 10 4434962 Total of top 10 6860628 Total of top 10 252519
Others not listed 269958 Others not listed 221131 Others not listed 15905
Total 4712861 Total 7086439 Total 268520
1/ MY 2008 data are August to November, 2008.
Note: Figures include non-spinnable cotton waste not included in the PS&D.
Source: Directorate General of Commercial Intelligence & Statistics (DGCIS), GOI.
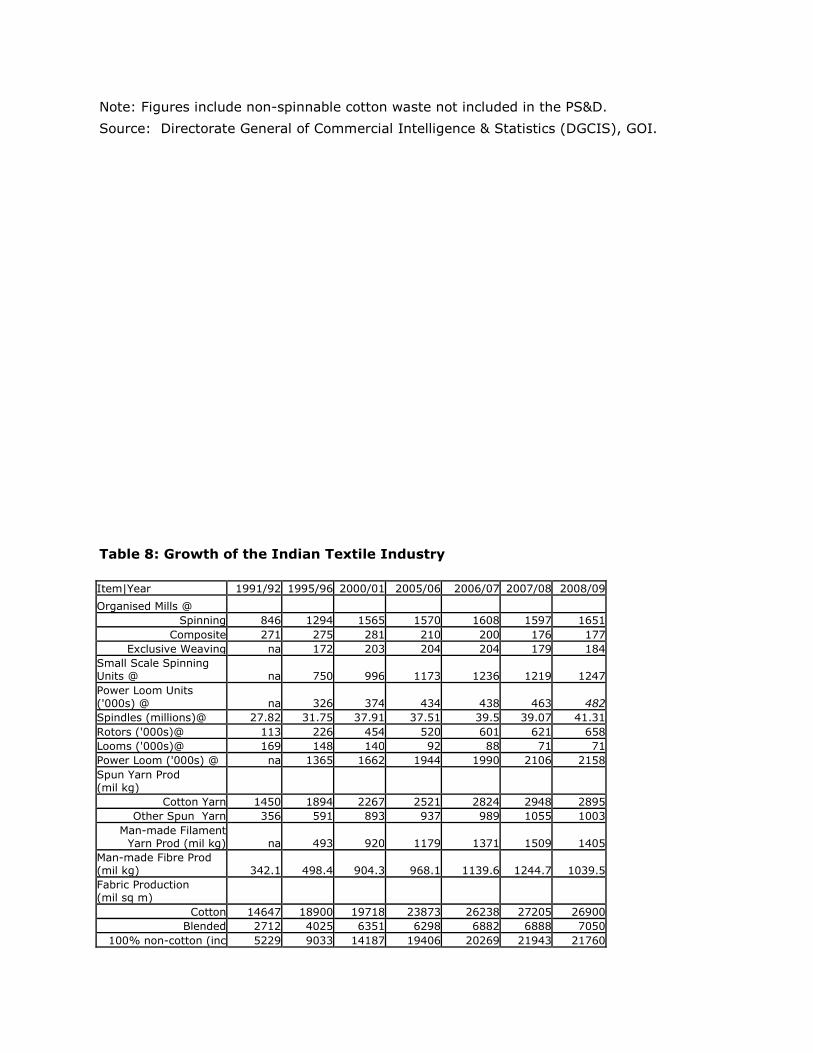
Table 8: Growth of the Indian Textile Industry
Item|Year 1991/92 1995/96 2000/01 2005/06 2006/07 2007/08 2008/09
Organised Mills @ Spinning 846 1294 1565 1570 1608 1597 1651
Composite 271 275 281 210 200 176 177 Exclusive Weaving na 172 203 204 204 179 184
Small Scale Spinning Units @ na 750 996 1173 1236 1219 1247 Power Loom Units ('000s) @ na 326 374 434 438 463 482 Spindles (millions)@ 27.82 31.75 37.91 37.51 39.5 39.07 41.31 Rotors ('000s)@ 113 226 454 520 601 621 658 Looms ('000s)@ 169 148 140 92 88 71 71 Power Loom ('000s) @ na 1365 1662 1944 1990 2106 2158 Spun Yarn Prod (mil kg)
Cotton Yarn 1450 1894 2267 2521 2824 2948 2895 Other Spun Yarn 356 591 893 937 989 1055 1003
Man-made Filament Yarn Prod (mil kg) na 493 920 1179 1371 1509 1405
Man-made Fibre Prod (mil kg) 342.1 498.4 904.3 968.1 1139.6 1244.7 1039.5 Fabric Production (mil sq m)
Cotton 14647 18900 19718 23873 26238 27205 26900 Blended 2712 4025 6351 6298 6882 6888 7050
100% non-cotton (inc 5229 9033 14187 19406 20269 21943 21760
Khadi/wool/silk)
Notes: @ - As on end of the Indian fiscal year (31st March).
NA- not available.
2008/09 are Post estimate based on official estimates for April 2008 to January
2009.
Source: The Textile Commissioner‟s Office, GOI.
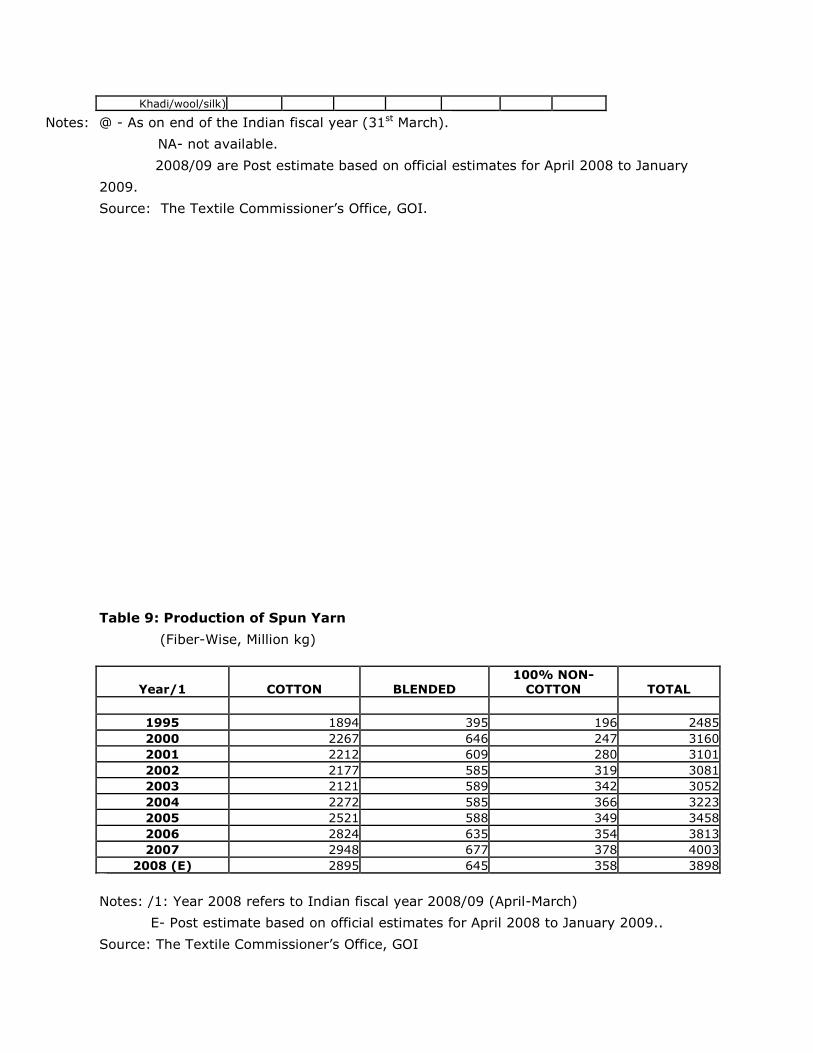
Table 9: Production of Spun Yarn
(Fiber-Wise, Million kg)
Year/1 COTTON BLENDED 100% NON-
COTTON TOTAL
1995 1894 395 196 2485 2000 2267 646 247 3160 2001 2212 609 280 3101 2002 2177 585 319 3081 2003 2121 589 342 3052 2004 2272 585 366 3223 2005 2521 588 349 3458 2006 2824 635 354 3813 2007 2948 677 378 4003
2008 (E) 2895 645 358 3898
Notes: /1: Year 2008 refers to Indian fiscal year 2008/09 (April-March)
E- Post estimate based on official estimates for April 2008 to January 2009..
Source: The Textile Commissioner‟s Office, GOI
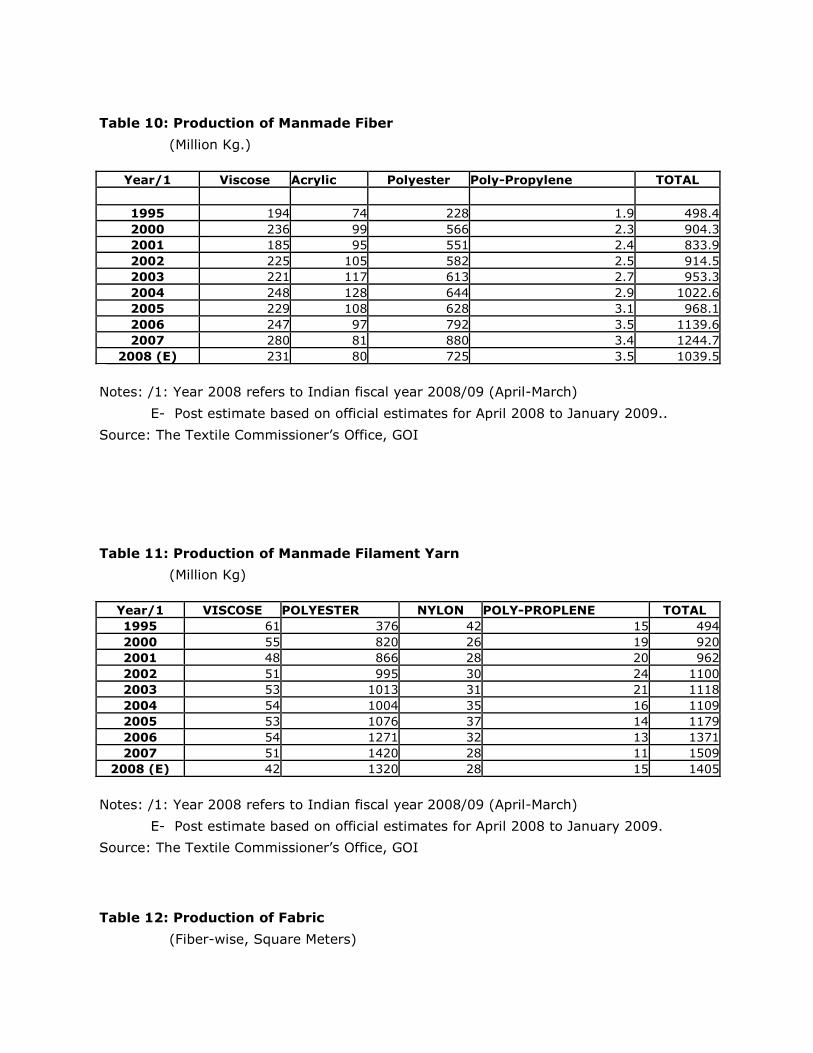
Table 10: Production of Manmade Fiber
(Million Kg.)
Year/1 Viscose Acrylic Polyester Poly-Propylene TOTAL
1995 194 74 228 1.9 498.4 2000 236 99 566 2.3 904.3 2001 185 95 551 2.4 833.9 2002 225 105 582 2.5 914.5 2003 221 117 613 2.7 953.3 2004 248 128 644 2.9 1022.6 2005 229 108 628 3.1 968.1 2006 247 97 792 3.5 1139.6 2007 280 81 880 3.4 1244.7
2008 (E) 231 80 725 3.5 1039.5
Notes: /1: Year 2008 refers to Indian fiscal year 2008/09 (April-March)
E- Post estimate based on official estimates for April 2008 to January 2009..
Source: The Textile Commissioner‟s Office, GOI
Table 11: Production of Manmade Filament Yarn
(Million Kg)
Year/1 VISCOSE POLYESTER NYLON POLY-PROPLENE TOTAL 1995 61 376 42 15 494 2000 55 820 26 19 920 2001 48 866 28 20 962 2002 51 995 30 24 1100 2003 53 1013 31 21 1118 2004 54 1004 35 16 1109 2005 53 1076 37 14 1179 2006 54 1271 32 13 1371 2007 51 1420 28 11 1509
2008 (E) 42 1320 28 15 1405
Notes: /1: Year 2008 refers to Indian fiscal year 2008/09 (April-March)
E- Post estimate based on official estimates for April 2008 to January 2009.
Source: The Textile Commissioner‟s Office, GOI
Table 12: Production of Fabric
(Fiber-wise, Square Meters)
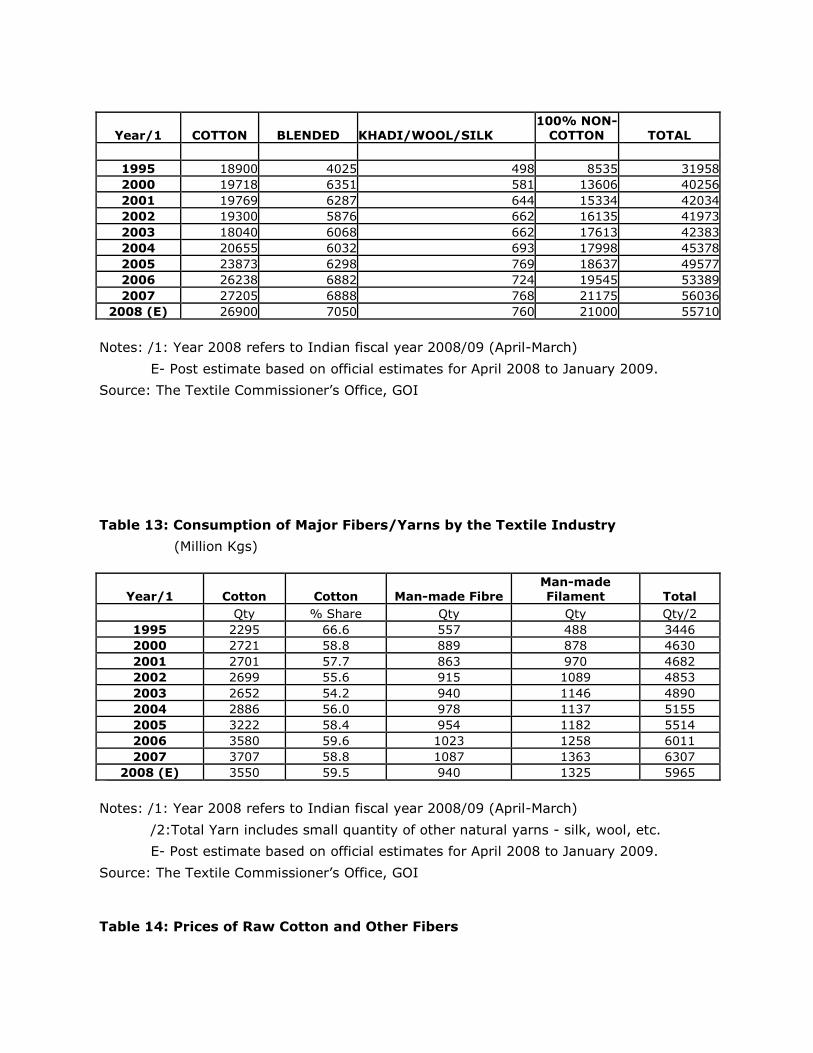
Year/1 COTTON BLENDED KHADI/WOOL/SILK 100% NON-
COTTON TOTAL
1995 18900 4025 498 8535 31958 2000 19718 6351 581 13606 40256 2001 19769 6287 644 15334 42034 2002 19300 5876 662 16135 41973 2003 18040 6068 662 17613 42383 2004 20655 6032 693 17998 45378 2005 23873 6298 769 18637 49577 2006 26238 6882 724 19545 53389 2007 27205 6888 768 21175 56036
2008 (E) 26900 7050 760 21000 55710
Notes: /1: Year 2008 refers to Indian fiscal year 2008/09 (April-March)
E- Post estimate based on official estimates for April 2008 to January 2009.
Source: The Textile Commissioner‟s Office, GOI
Table 13: Consumption of Major Fibers/Yarns by the Textile Industry
(Million Kgs)
Year/1 Cotton Cotton Man-made Fibre Man-made Filament Total
Qty % Share Qty Qty Qty/2 1995 2295 66.6 557 488 3446 2000 2721 58.8 889 878 4630 2001 2701 57.7 863 970 4682 2002 2699 55.6 915 1089 4853 2003 2652 54.2 940 1146 4890 2004 2886 56.0 978 1137 5155 2005 3222 58.4 954 1182 5514 2006 3580 59.6 1023 1258 6011 2007 3707 58.8 1087 1363 6307
2008 (E) 3550 59.5 940 1325 5965
Notes: /1: Year 2008 refers to Indian fiscal year 2008/09 (April-March)
/2:Total Yarn includes small quantity of other natural yarns - silk, wool, etc.
E- Post estimate based on official estimates for April 2008 to January 2009.
Source: The Textile Commissioner‟s Office, GOI
Table 14: Prices of Raw Cotton and Other Fibers
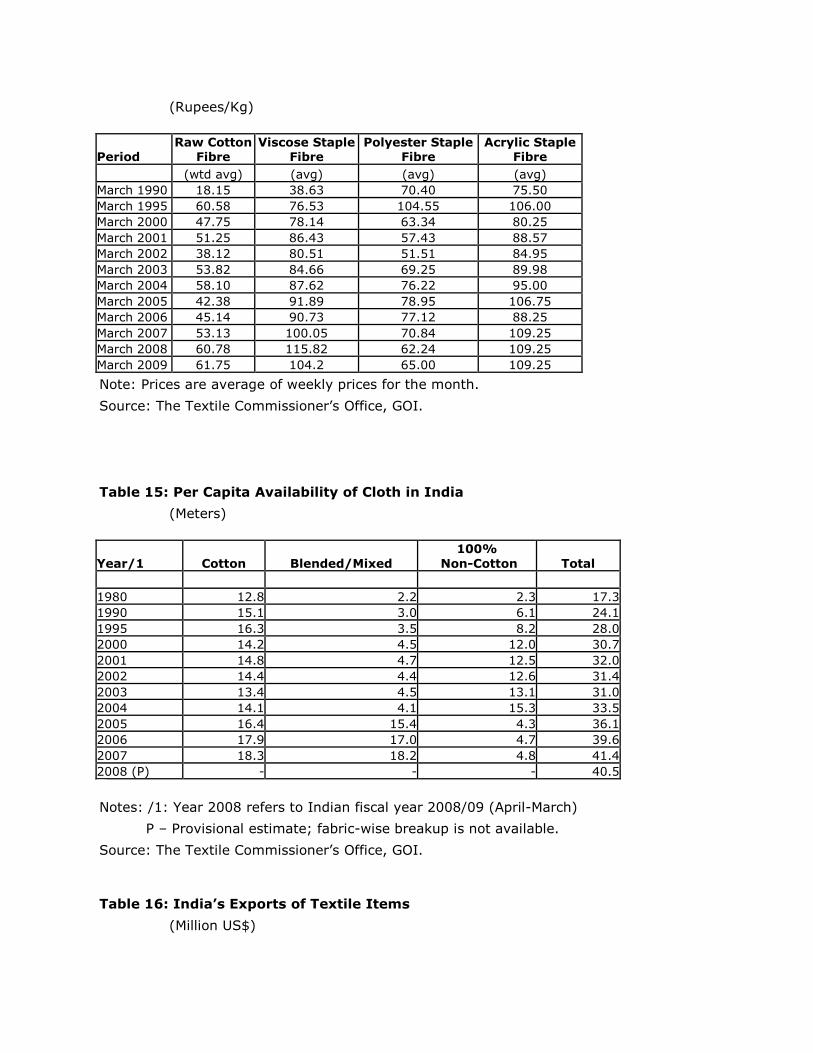
(Rupees/Kg)
Period Raw Cotton
Fibre Viscose Staple
Fibre Polyester Staple
Fibre Acrylic Staple
Fibre
(wtd avg) (avg) (avg) (avg) March 1990 18.15 38.63 70.40 75.50 March 1995 60.58 76.53 104.55 106.00 March 2000 47.75 78.14 63.34 80.25 March 2001 51.25 86.43 57.43 88.57 March 2002 38.12 80.51 51.51 84.95 March 2003 53.82 84.66 69.25 89.98 March 2004 58.10 87.62 76.22 95.00 March 2005 42.38 91.89 78.95 106.75 March 2006 45.14 90.73 77.12 88.25 March 2007 53.13 100.05 70.84 109.25 March 2008 60.78 115.82 62.24 109.25 March 2009 61.75 104.2 65.00 109.25
Note: Prices are average of weekly prices for the month.
Source: The Textile Commissioner‟s Office, GOI.
Table 15: Per Capita Availability of Cloth in India
(Meters)
Year/1 Cotton Blended/Mixed 100%
Non-Cotton Total
1980 12.8 2.2 2.3 17.3 1990 15.1 3.0 6.1 24.1 1995 16.3 3.5 8.2 28.0 2000 14.2 4.5 12.0 30.7 2001 14.8 4.7 12.5 32.0 2002 14.4 4.4 12.6 31.4 2003 13.4 4.5 13.1 31.0 2004 14.1 4.1 15.3 33.5 2005 16.4 15.4 4.3 36.1 2006 17.9 17.0 4.7 39.6 2007 18.3 18.2 4.8 41.4 2008 (P) - - - 40.5
Notes: /1: Year 2008 refers to Indian fiscal year 2008/09 (April-March)
P – Provisional estimate; fabric-wise breakup is not available.
Source: The Textile Commissioner‟s Office, GOI.
Table 16: India’s Exports of Textile Items
(Million US$)
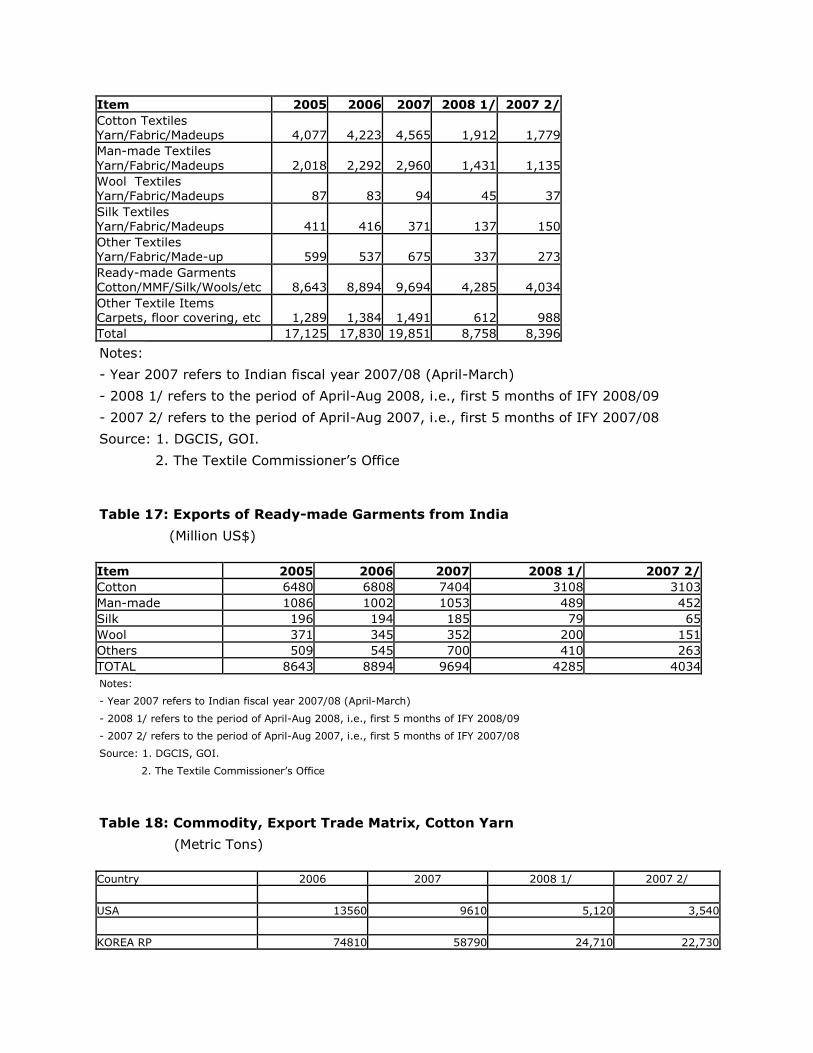
Item 2005 2006 2007 2008 1/ 2007 2/ Cotton Textiles Yarn/Fabric/Madeups 4,077 4,223 4,565 1,912 1,779 Man-made Textiles
Yarn/Fabric/Madeups 2,018 2,292 2,960 1,431 1,135 Wool Textiles Yarn/Fabric/Madeups 87 83 94 45 37 Silk Textiles Yarn/Fabric/Madeups 411 416 371 137 150 Other Textiles Yarn/Fabric/Made-up 599 537 675 337 273 Ready-made Garments Cotton/MMF/Silk/Wools/etc 8,643 8,894 9,694 4,285 4,034 Other Textile Items Carpets, floor covering, etc 1,289 1,384 1,491 612 988 Total 17,125 17,830 19,851 8,758 8,396
Notes:
- Year 2007 refers to Indian fiscal year 2007/08 (April-March)
- 2008 1/ refers to the period of April-Aug 2008, i.e., first 5 months of IFY 2008/09
- 2007 2/ refers to the period of April-Aug 2007, i.e., first 5 months of IFY 2007/08
Source: 1. DGCIS, GOI.
2. The Textile Commissioner‟s Office
Table 17: Exports of Ready-made Garments from India
(Million US$)
Item 2005 2006 2007 2008 1/ 2007 2/ Cotton 6480 6808 7404 3108 3103 Man-made 1086 1002 1053 489 452 Silk 196 194 185 79 65 Wool 371 345 352 200 151 Others 509 545 700 410 263 TOTAL 8643 8894 9694 4285 4034
Notes:
- Year 2007 refers to Indian fiscal year 2007/08 (April-March)
- 2008 1/ refers to the period of April-Aug 2008, i.e., first 5 months of IFY 2008/09
- 2007 2/ refers to the period of April-Aug 2007, i.e., first 5 months of IFY 2007/08
Source: 1. DGCIS, GOI.
2. The Textile Commissioner‟s Office
Table 18: Commodity, Export Trade Matrix, Cotton Yarn
(Metric Tons)
Country 2006 2007 2008 1/ 2007 2/
USA 13560 9610 5,120 3,540
KOREA RP 74810 58790 24,710 22,730
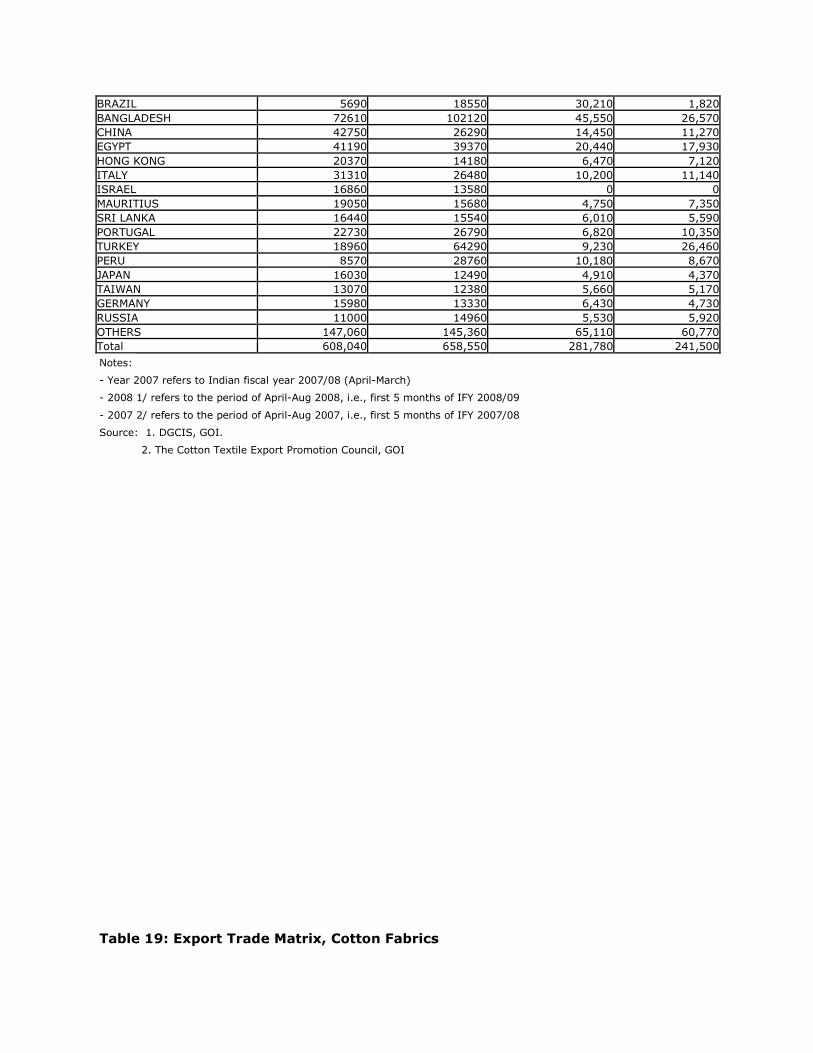
BRAZIL 5690 18550 30,210 1,820 BANGLADESH 72610 102120 45,550 26,570 CHINA 42750 26290 14,450 11,270 EGYPT 41190 39370 20,440 17,930 HONG KONG 20370 14180 6,470 7,120 ITALY 31310 26480 10,200 11,140 ISRAEL 16860 13580 0 0 MAURITIUS 19050 15680 4,750 7,350 SRI LANKA 16440 15540 6,010 5,590 PORTUGAL 22730 26790 6,820 10,350 TURKEY 18960 64290 9,230 26,460 PERU 8570 28760 10,180 8,670 JAPAN 16030 12490 4,910 4,370 TAIWAN 13070 12380 5,660 5,170 GERMANY 15980 13330 6,430 4,730 RUSSIA 11000 14960 5,530 5,920 OTHERS 147,060 145,360 65,110 60,770 Total 608,040 658,550 281,780 241,500
Notes:
- Year 2007 refers to Indian fiscal year 2007/08 (April-March)
- 2008 1/ refers to the period of April-Aug 2008, i.e., first 5 months of IFY 2008/09
- 2007 2/ refers to the period of April-Aug 2007, i.e., first 5 months of IFY 2007/08
Source: 1. DGCIS, GOI.
2. The Cotton Textile Export Promotion Council, GOI
Table 19: Export Trade Matrix, Cotton Fabrics
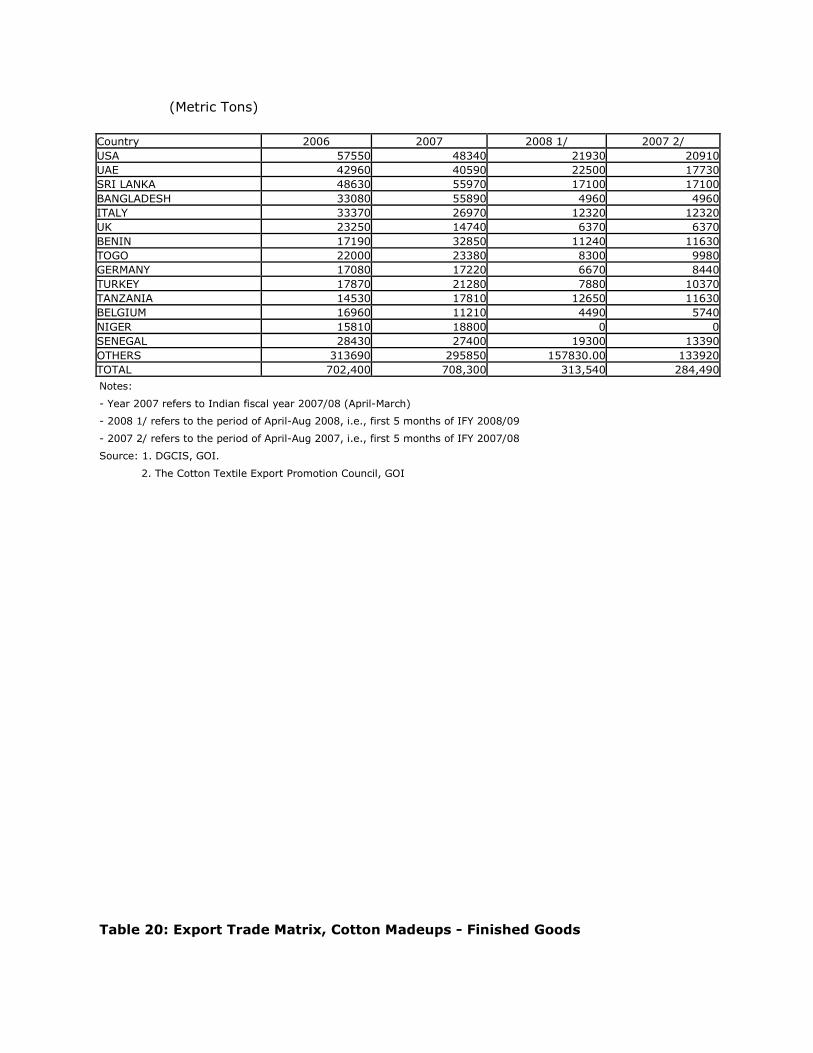
(Metric Tons)
Country 2006 2007 2008 1/ 2007 2/ USA 57550 48340 21930 20910 UAE 42960 40590 22500 17730 SRI LANKA 48630 55970 17100 17100 BANGLADESH 33080 55890 4960 4960 ITALY 33370 26970 12320 12320 UK 23250 14740 6370 6370 BENIN 17190 32850 11240 11630 TOGO 22000 23380 8300 9980 GERMANY 17080 17220 6670 8440 TURKEY 17870 21280 7880 10370 TANZANIA 14530 17810 12650 11630 BELGIUM 16960 11210 4490 5740 NIGER 15810 18800 0 0 SENEGAL 28430 27400 19300 13390 OTHERS 313690 295850 157830.00 133920 TOTAL 702,400 708,300 313,540 284,490
Notes:
- Year 2007 refers to Indian fiscal year 2007/08 (April-March)
- 2008 1/ refers to the period of April-Aug 2008, i.e., first 5 months of IFY 2008/09
- 2007 2/ refers to the period of April-Aug 2007, i.e., first 5 months of IFY 2007/08
Source: 1. DGCIS, GOI.
2. The Cotton Textile Export Promotion Council, GOI
Table 20: Export Trade Matrix, Cotton Madeups - Finished Goods
(Metric Tons)
Country 2006 2007 2008 1/ 2007 2/
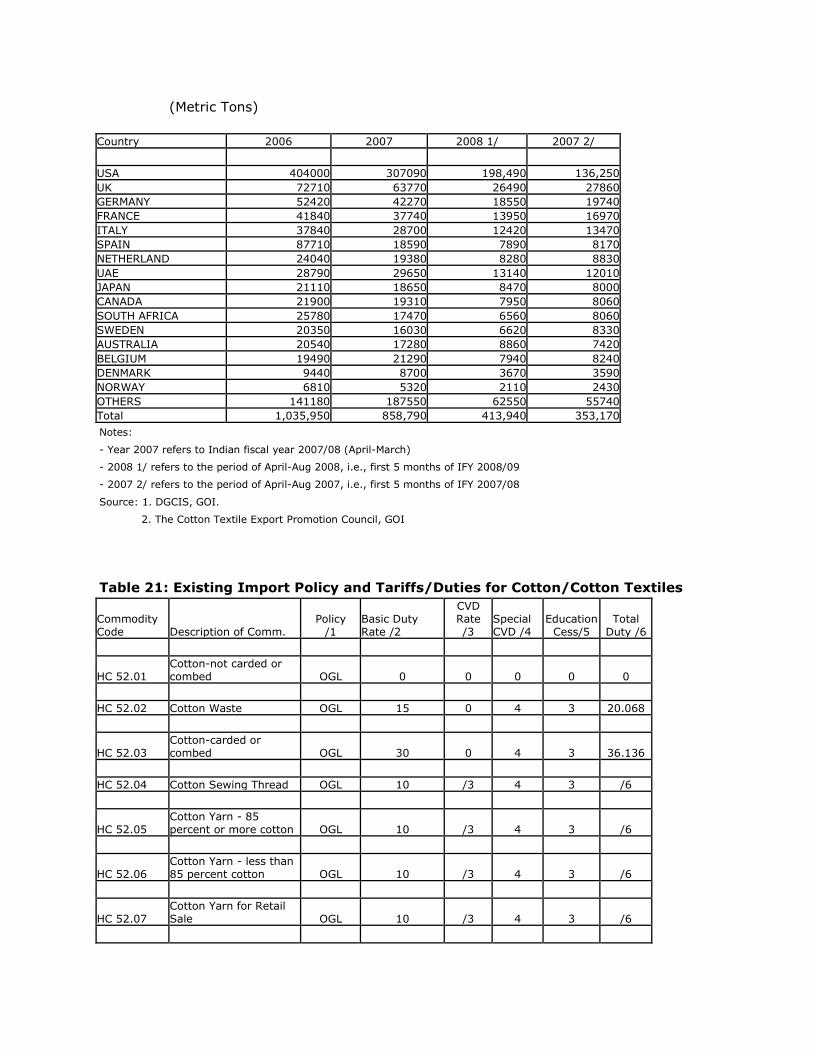
USA 404000 307090 198,490 136,250 UK 72710 63770 26490 27860 GERMANY 52420 42270 18550 19740 FRANCE 41840 37740 13950 16970 ITALY 37840 28700 12420 13470 SPAIN 87710 18590 7890 8170 NETHERLAND 24040 19380 8280 8830 UAE 28790 29650 13140 12010 JAPAN 21110 18650 8470 8000 CANADA 21900 19310 7950 8060 SOUTH AFRICA 25780 17470 6560 8060 SWEDEN 20350 16030 6620 8330 AUSTRALIA 20540 17280 8860 7420 BELGIUM 19490 21290 7940 8240 DENMARK 9440 8700 3670 3590 NORWAY 6810 5320 2110 2430 OTHERS 141180 187550 62550 55740 Total 1,035,950 858,790 413,940 353,170
Notes:
- Year 2007 refers to Indian fiscal year 2007/08 (April-March)
- 2008 1/ refers to the period of April-Aug 2008, i.e., first 5 months of IFY 2008/09
- 2007 2/ refers to the period of April-Aug 2007, i.e., first 5 months of IFY 2007/08
Source: 1. DGCIS, GOI.
2. The Cotton Textile Export Promotion Council, GOI
Table 21: Existing Import Policy and Tariffs/Duties for Cotton/Cotton Textiles
Commodity Code Description of Comm.
Policy /1
Basic Duty Rate /2
CVD Rate /3
Special CVD /4
Education Cess/5
Total Duty /6
HC 52.01 Cotton-not carded or combed OGL 0 0 0 0 0
HC 52.02 Cotton Waste OGL 15 0 4 3 20.068
HC 52.03 Cotton-carded or combed OGL 30 0 4 3 36.136
HC 52.04 Cotton Sewing Thread OGL 10 /3 4 3 /6
HC 52.05 Cotton Yarn - 85 percent or more cotton OGL 10 /3 4 3 /6
HC 52.06 Cotton Yarn - less than 85 percent cotton OGL 10 /3 4 3 /6
HC 52.07 Cotton Yarn for Retail Sale OGL 10 /3 4 3 /6
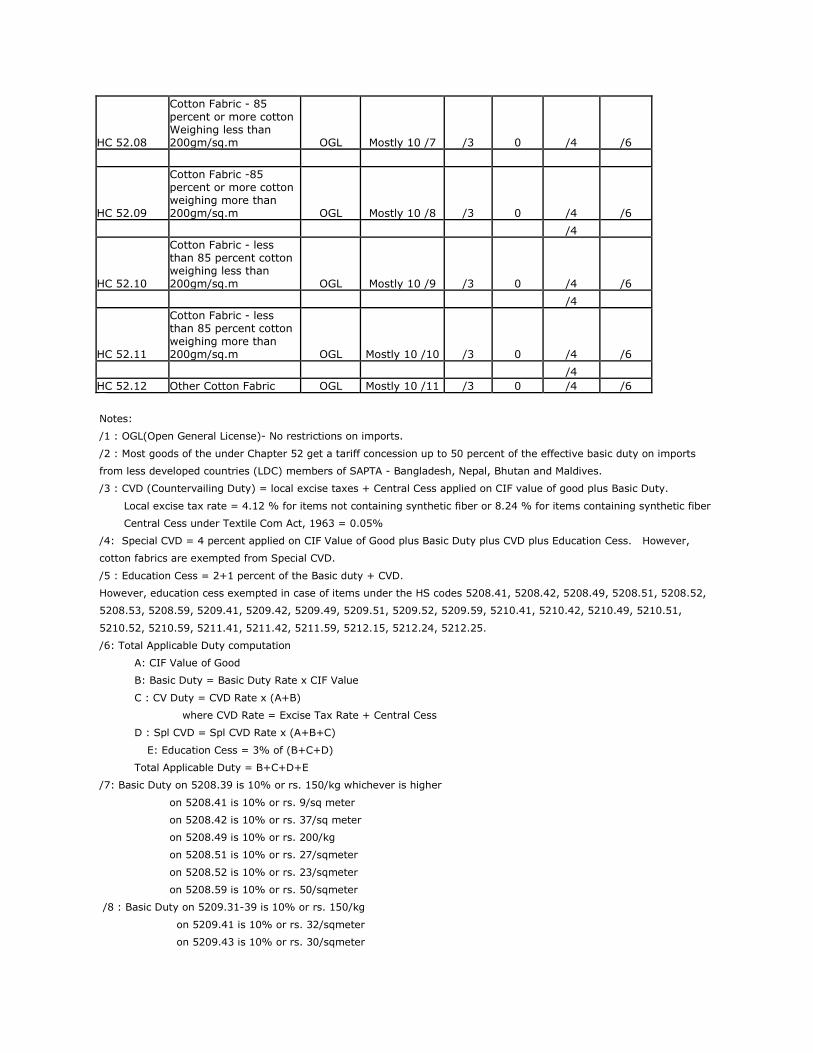
HC 52.08
Cotton Fabric - 85 percent or more cotton Weighing less than 200gm/sq.m OGL Mostly 10 /7 /3 0 /4 /6
HC 52.09
Cotton Fabric -85 percent or more cotton weighing more than 200gm/sq.m OGL Mostly 10 /8 /3 0 /4 /6
/4
HC 52.10
Cotton Fabric - less than 85 percent cotton weighing less than 200gm/sq.m OGL Mostly 10 /9 /3 0 /4 /6
/4
HC 52.11
Cotton Fabric - less than 85 percent cotton weighing more than 200gm/sq.m OGL Mostly 10 /10 /3 0 /4 /6
/4 HC 52.12 Other Cotton Fabric OGL Mostly 10 /11 /3 0 /4 /6
Notes:
/1 : OGL(Open General License)- No restrictions on imports.
/2 : Most goods of the under Chapter 52 get a tariff concession up to 50 percent of the effective basic duty on imports
from less developed countries (LDC) members of SAPTA - Bangladesh, Nepal, Bhutan and Maldives.
/3 : CVD (Countervailing Duty) = local excise taxes + Central Cess applied on CIF value of good plus Basic Duty.
Local excise tax rate = 4.12 % for items not containing synthetic fiber or 8.24 % for items containing synthetic fiber
Central Cess under Textile Com Act, 1963 = 0.05%
/4: Special CVD = 4 percent applied on CIF Value of Good plus Basic Duty plus CVD plus Education Cess. However,
cotton fabrics are exempted from Special CVD.
/5 : Education Cess = 2+1 percent of the Basic duty + CVD.
However, education cess exempted in case of items under the HS codes 5208.41, 5208.42, 5208.49, 5208.51, 5208.52,
5208.53, 5208.59, 5209.41, 5209.42, 5209.49, 5209.51, 5209.52, 5209.59, 5210.41, 5210.42, 5210.49, 5210.51,
5210.52, 5210.59, 5211.41, 5211.42, 5211.59, 5212.15, 5212.24, 5212.25.
/6: Total Applicable Duty computation
A: CIF Value of Good
B: Basic Duty = Basic Duty Rate x CIF Value
C : CV Duty = CVD Rate x (A+B)
where CVD Rate = Excise Tax Rate + Central Cess
D : Spl CVD = Spl CVD Rate x (A+B+C)
E: Education Cess = 3% of (B+C+D)
Total Applicable Duty = B+C+D+E
/7: Basic Duty on 5208.39 is 10% or rs. 150/kg whichever is higher
on 5208.41 is 10% or rs. 9/sq meter
on 5208.42 is 10% or rs. 37/sq meter
on 5208.49 is 10% or rs. 200/kg
on 5208.51 is 10% or rs. 27/sqmeter
on 5208.52 is 10% or rs. 23/sqmeter
on 5208.59 is 10% or rs. 50/sqmeter
/8 : Basic Duty on 5209.31-39 is 10% or rs. 150/kg
on 5209.41 is 10% or rs. 32/sqmeter
on 5209.43 is 10% or rs. 30/sqmeter
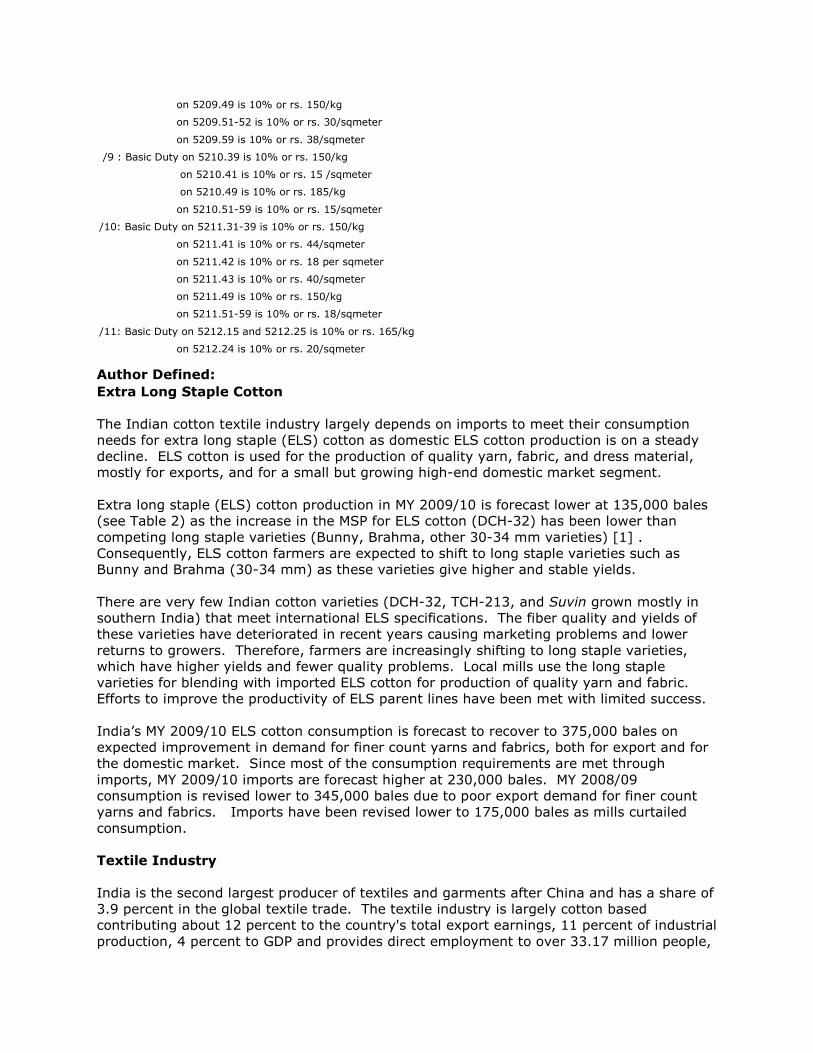
on 5209.49 is 10% or rs. 150/kg
on 5209.51-52 is 10% or rs. 30/sqmeter
on 5209.59 is 10% or rs. 38/sqmeter
/9 : Basic Duty on 5210.39 is 10% or rs. 150/kg
on 5210.41 is 10% or rs. 15 /sqmeter
on 5210.49 is 10% or rs. 185/kg
on 5210.51-59 is 10% or rs. 15/sqmeter
/10: Basic Duty on 5211.31-39 is 10% or rs. 150/kg
on 5211.41 is 10% or rs. 44/sqmeter
on 5211.42 is 10% or rs. 18 per sqmeter
on 5211.43 is 10% or rs. 40/sqmeter
on 5211.49 is 10% or rs. 150/kg
on 5211.51-59 is 10% or rs. 18/sqmeter
/11: Basic Duty on 5212.15 and 5212.25 is 10% or rs. 165/kg
on 5212.24 is 10% or rs. 20/sqmeter
Author Defined:
Extra Long Staple Cotton
The Indian cotton textile industry largely depends on imports to meet their consumption
needs for extra long staple (ELS) cotton as domestic ELS cotton production is on a steady
decline. ELS cotton is used for the production of quality yarn, fabric, and dress material,
mostly for exports, and for a small but growing high-end domestic market segment.
Extra long staple (ELS) cotton production in MY 2009/10 is forecast lower at 135,000 bales
(see Table 2) as the increase in the MSP for ELS cotton (DCH-32) has been lower than
competing long staple varieties (Bunny, Brahma, other 30-34 mm varieties) [1] .
Consequently, ELS cotton farmers are expected to shift to long staple varieties such as
Bunny and Brahma (30-34 mm) as these varieties give higher and stable yields.
There are very few Indian cotton varieties (DCH-32, TCH-213, and Suvin grown mostly in
southern India) that meet international ELS specifications. The fiber quality and yields of
these varieties have deteriorated in recent years causing marketing problems and lower
returns to growers. Therefore, farmers are increasingly shifting to long staple varieties,
which have higher yields and fewer quality problems. Local mills use the long staple
varieties for blending with imported ELS cotton for production of quality yarn and fabric.
Efforts to improve the productivity of ELS parent lines have been met with limited success.
India‟s MY 2009/10 ELS cotton consumption is forecast to recover to 375,000 bales on
expected improvement in demand for finer count yarns and fabrics, both for export and for
the domestic market. Since most of the consumption requirements are met through
imports, MY 2009/10 imports are forecast higher at 230,000 bales. MY 2008/09
consumption is revised lower to 345,000 bales due to poor export demand for finer count
yarns and fabrics. Imports have been revised lower to 175,000 bales as mills curtailed
consumption.
Textile Industry
India is the second largest producer of textiles and garments after China and has a share of
3.9 percent in the global textile trade. The textile industry is largely cotton based
contributing about 12 percent to the country's total export earnings, 11 percent of industrial
production, 4 percent to GDP and provides direct employment to over 33.17 million people,
the second largest employment generator after agriculture [2] . Post MFA (2005/06), the
textile industry had been progressing well for three consecutive years on sufficient raw
material supplies, and strong export and domestic demand. However, the textile industry
has been facing severe challenges since late 2007 due to an increase in the price of raw
material, depressed global demand for textiles, and other infrastructure problems.
Consequently, growth in the production of textiles is estimated to come down in IFY
2008/09 compared to last year (Tables 8-12)
The sharp weakening of value of the Indian rupee since February 2009 has improved export
price realization in rupee terms. Consequently, industry sources report an improvement in
export demand for textile products. Export demand for Indian textiles is expected to
recover in IFY 2009/10 provided the Indian rupee remains stable. Domestic demand for
textiles is expected to grow on continued strong growth in the economy and an expanding
population. Consequently, industry sources expect a turnaround in the textile industry, with
the production in IFY 2009/10 forecast to increase by 4-5 percent over the previous year.
The Indian textile industry includes both an "organized" sector (large-scale spinning units
and composite mills) and an "unorganized" sector (small-scale spinning units, power looms,
handlooms, hosiery units). More than 95 percent of yarn is produced in the organized
sector. The weaving industry is mainly supplied by the unorganized sector, with power
looms accounting for 60 percent, handlooms for 18 percent, and hosiery units for 17
percent of total cloth production. The organized sector weaving mills account for the
remaining 5 percent of cloth production.
After three consecutive years of steady double digit growth, cotton textile exports in the
first five months of IFY 2008/09 slowed down to 4 percent (Table 16). While official
statistics are not available, market sources report a significant decline in exports from
August 2008 onwards, and total exports during IFY 2008/09 may decline by 5-6 percent
over last year. However, there has been a resurgence in export demand since March 2009
and textile export prospects are expected to improve in IFY 2009/10.
Cotton madeups account for the major share of cotton textile exports followed by cotton
yarn, and cotton fabric (Tables 18-20). Indian textile exports are typically targeted at the
lower quality end of the international market. A few modern integrated textile units are
now focusing on exports of finer count yarns, fabric, and branded garments for the upper
segment of the world market. Leading textile groups are making significant investments in
modern equipment and in further integration in the post MFA-era (after January 2005). [1] See India Cotton Quarterly Update – December, 2008 (IN8140) [2] Source: Confederation of Indian Industries http://www.citiindia.com/