Incident Management in Central Arkansas: Current Settings and Proposed Extensions Weihua Xiao Yupo...
19
Incident Management in Incident Management in Central Arkansas: Central Arkansas: Current Settings and Current Settings and Proposed Extensions Proposed Extensions Weihua Xiao Yupo Chan University of Arkansas at Little Rock
-
Upload
elizabeth-glenn -
Category
Documents
-
view
218 -
download
0
Transcript of Incident Management in Central Arkansas: Current Settings and Proposed Extensions Weihua Xiao Yupo...
Incident Management in Central Incident Management in Central Arkansas:Arkansas:
Current Settings and Proposed Current Settings and Proposed ExtensionsExtensions
Weihua XiaoYupo Chan
University of Arkansas at Little Rock
2
Traffic Incident Traffic Incident ManagementManagement
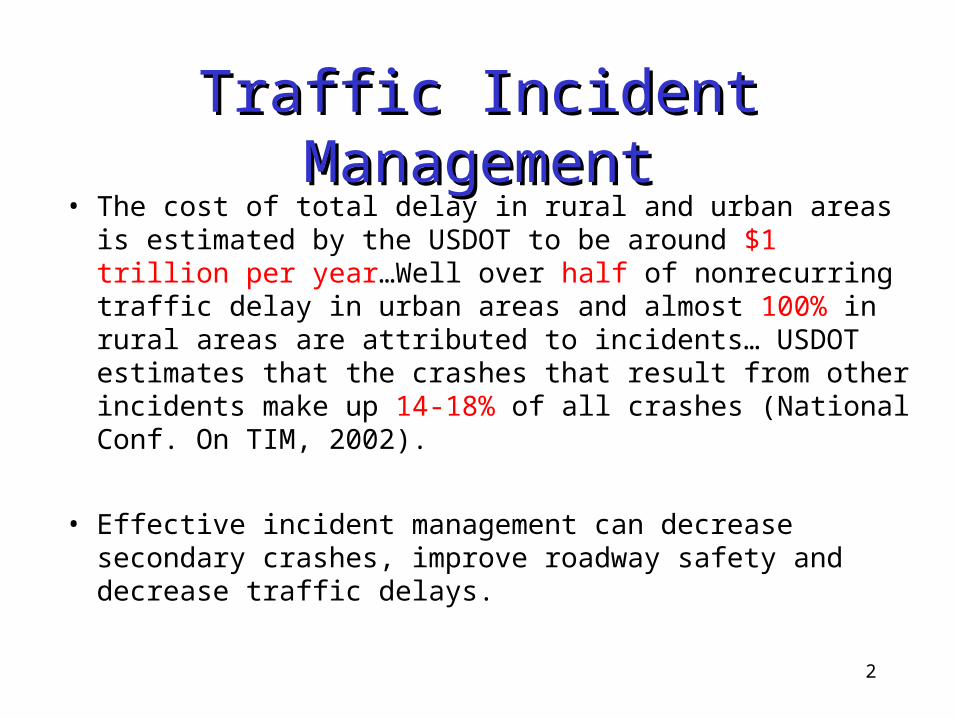
• The cost of total delay in rural and urban areas is estimated by the USDOT to be around $1 trillion per year…Well over half of nonrecurring traffic delay in urban areas and almost 100% in rural areas are attributed to incidents… USDOT estimates that the crashes that result from other incidents make up 14-18% of all crashes (National Conf. On TIM, 2002).
• Effective incident management can decrease secondary crashes, improve roadway safety and decrease traffic delays.
3
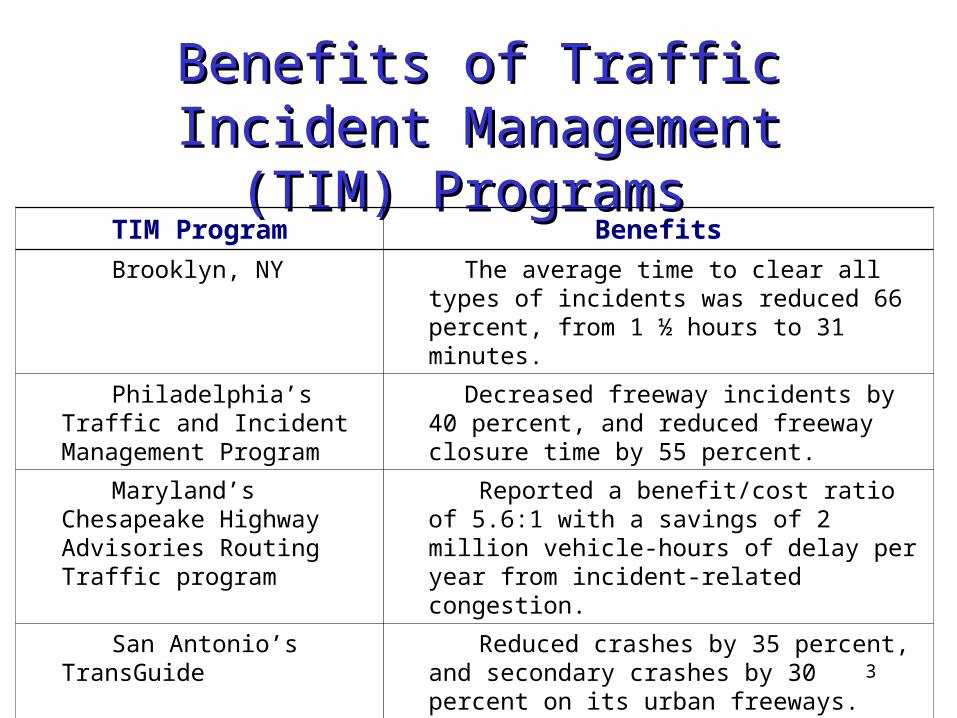
Benefits of Traffic Incident Benefits of Traffic Incident Management (TIM) ProgramsManagement (TIM) Programs
TIM Program Benefits
Brooklyn, NY The average time to clear all types of incidents was reduced 66 percent, from 1 ½ hours to 31 minutes.
Philadelphia’s Traffic and Incident Management Program
Decreased freeway incidents by 40 percent, and reduced freeway closure time by 55 percent.
Maryland’s Chesapeake Highway Advisories Routing Traffic program
Reported a benefit/cost ratio of 5.6:1 with a savings of 2 million vehicle-hours of delay per year from incident-related congestion.
San Antonio’s TransGuide Reduced crashes by 35 percent, and secondary crashes by 30 percent on its urban freeways.
Atlanta The maximum time from incident verification to lane clearance was cut from 6 1/4 hours to 1 1/2 hours, resulting in an estimated decrease of 2 million vehicle-hours of delay per year.

4
Time Line of an Incident Duration

5
Incident Management Incident Management ActivitiesActivities
• Motorist Assistance Patrol (MAP) – 3 vehicles operating on I-30, I-40, I-630, I-430, and I-440 in the urbanized
area.– Proposed to provide some coverage of both US 67/167 and I-530, from I-
30 to Dixon Road • Towing and Wrecker Service
– A rotation list of qualified towing and wrecker services.– Current procedures do not specify a minimum response time.
• Emergency Medical Services (EMS) – 911 calls– Communications upgrades are needed.
• Traffic Management at Work Zones (Meadors 2002) – Queue detectors – Variable message signs (VMS) and highway advisory radio (HAR)
• Traveler Information System– 511 calls

6
Goals of our StudyGoals of our Study
Assess the negative impact of incidents using simulation technology.
Evaluate the overall performance of the incident management program.
Identify those factors that increase chances of incidents via data-mining technology.
Improve incident detection efficiency, accuracy, and response strategy in general
Enhance incident site management strategies to reduce the negative impact of incidents.

7
Study AreaStudy Area

8

9
Major Travel Corridors

10
ImplementationsImplementationsIncident Data Analysis and Incident Data Analysis and
ModelingModeling• Incident Occurrence Model
– Poisson or Negative binominal?– What factors affect the occurrence of incidents: speed
limit, lanes, weather, intersections, etc.
• Incident Duration Model– Normal distribution? Lognormal distribution?– Parameters?
• Blocked-lane Model– The relationship between number of blocked lanes and
incident characteristics

11
ImplementationsImplementationsSimulation Based Decision Support Simulation Based Decision Support
SystemSystem• Evaluate current incident management program.
• Predict the effects of changes or upgrades.
Incident Generation
Incident Response
Location
Occurrence time
Clearance time
Detection time
For Each Incident
Traffic Simulation
Update link travel times
Track status of service vehicles
Update incident waiting list
Update incident duration
Choose current response incident
according to dispatching policy
Identify proper service vehicle to
response the incident
12
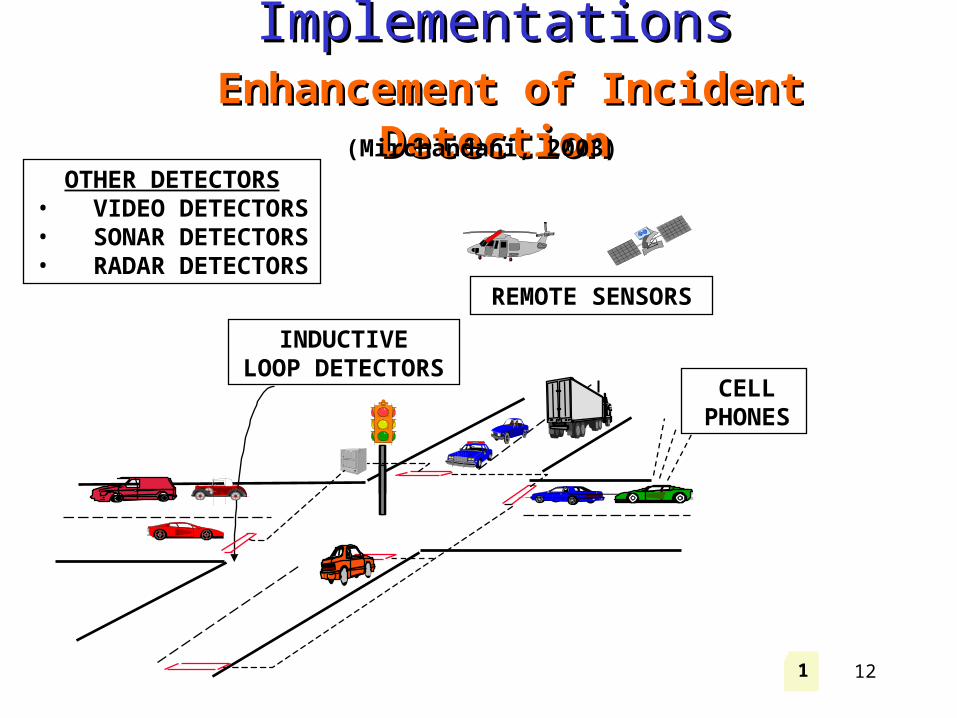
ImplementationsImplementations Enhancement of Incident Enhancement of Incident
DetectionDetection
INDUCTIVELOOP DETECTORS
OTHER DETECTORS• VIDEO DETECTORS• SONAR DETECTORS• RADAR DETECTORS
CELLPHONES
REMOTE SENSORS
654321
(Mirchandani, 2003)

13
ImplementationsImplementationsEnhancement of Incident detectionEnhancement of Incident detection
• Choose the right location to install the sensors.
• Efficient incident detection algorithm.
• Locate the cell phone caller quickly and precisely.

14
Analysis and Modeling of Traffic Incident Data
Incident Delay
Analysis
Simulation-Based Decision Support System
Enhancing Incident
Detection
Optimal Traffic Management at
Incident Site
O-D pair database
Traffic volume predication model
Identify optimal traffic reroute strategy
HAR/VMS
Identify the location of cell caller more precisely
Improve Incident detection algorithm
Choose the right place to install incident detection
devices
Incident generation module
Traffic simulation module
Incident response simulation module
Deterministic queuing model
Queuing theory model
Traffic simulation
ImplementationsImplementations
A
B
CTraffic
incident
D
15
• GPS, Remote sensing & GIS Lab
• Telecommunications and Transportation Lab
• Virtual Reality Center

16
Incident Data of Arkansas collected Incident Data of Arkansas collected fromfrom
Bureau of Transportation Statistics Bureau of Transportation Statistics (BTS)(BTS)
Fatal traffic crashesFatal traffic crashes• Interested information– City, County, Weather, Day of Week, Day of Month, Month,
Year, Fatalities, Injuries, Lanes, Light Condition, Mile point, Speeding, Speed, Speed limit, Surface Condition, Pavement Type
470
480
490
500
510
520
530
540
550
560
570
580
Nu
mb
er
of
fata
cra
sh
es
1991 1992 1993 1994 1995 1996 1997 1998 1999 2000 2001Year

17
We need more detailed data…We need more detailed data…
• Locations of incidents: route, mile post, speed limit, number of lanes, number of blocked lanes, horizontal grade, vertical grade, traffic volume, etc.
• Incident response: response time, incident duration, etc.

18
SummarySummary
• negative consequences are by no means negligible in small and medium communities
• an incident management plan that is articulated with an ITS architecture.
• analysis and modeling of historical incident data • the right intersections to install incident-detection devices • incident-generation module in the incident-management
simulation software • ITS metaLAB with close cooperation with other regional
stakeholders • a case study for other communities of similar population size and
structure

19
Thank you!Thank you!
Questions and Comments