Incentive Plan Design and Employee Recognition Programs · 2008-06-23 · Original Incentive Plans...
50
Incentive Plan Design and Employee Incentive Plan Design and Employee Recognition Programs Recognition Programs June 11, 2008
Transcript of Incentive Plan Design and Employee Recognition Programs · 2008-06-23 · Original Incentive Plans...
Incentive Plan Design and EmployeeIncentive Plan Design and EmployeeRecognition ProgramsRecognition Programs
June 11, 2008
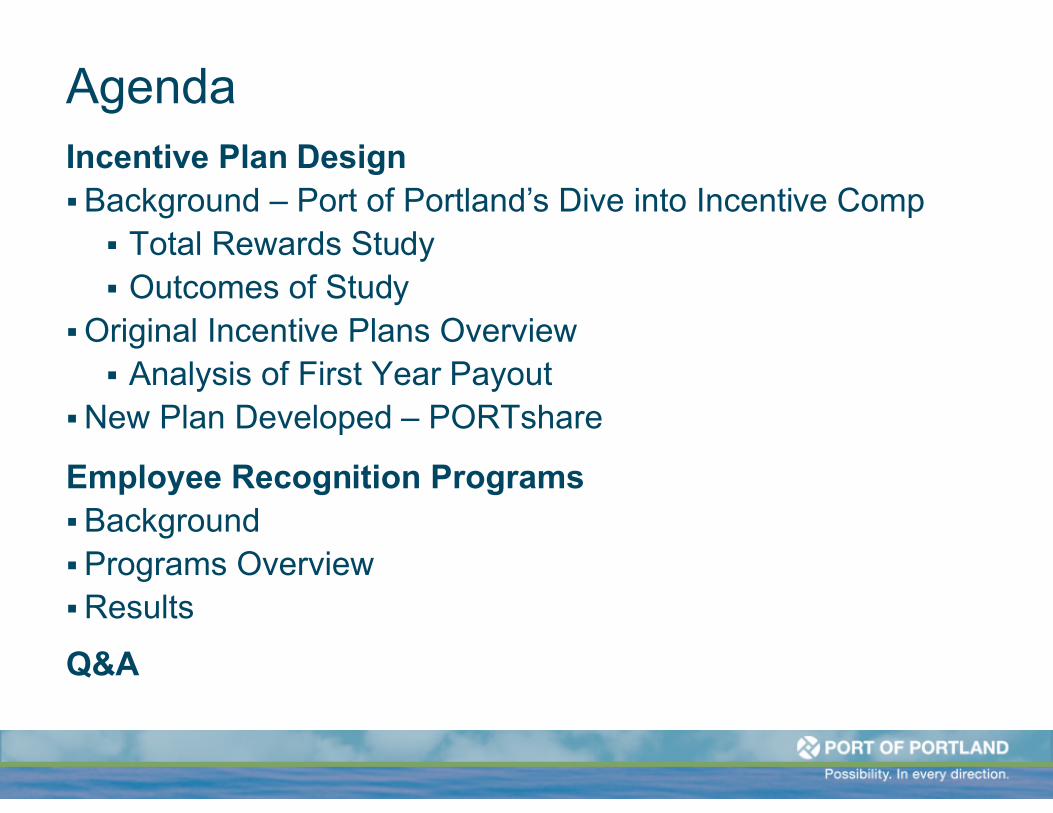
AgendaIncentive Plan DesignBackground – Port of Portland’s Dive into Incentive Comp Total Rewards Study Outcomes of Study
Original Incentive Plans Overview Analysis of First Year Payout
New Plan Developed – PORTshare
Employee Recognition ProgramsBackgroundPrograms OverviewResults
Q&A
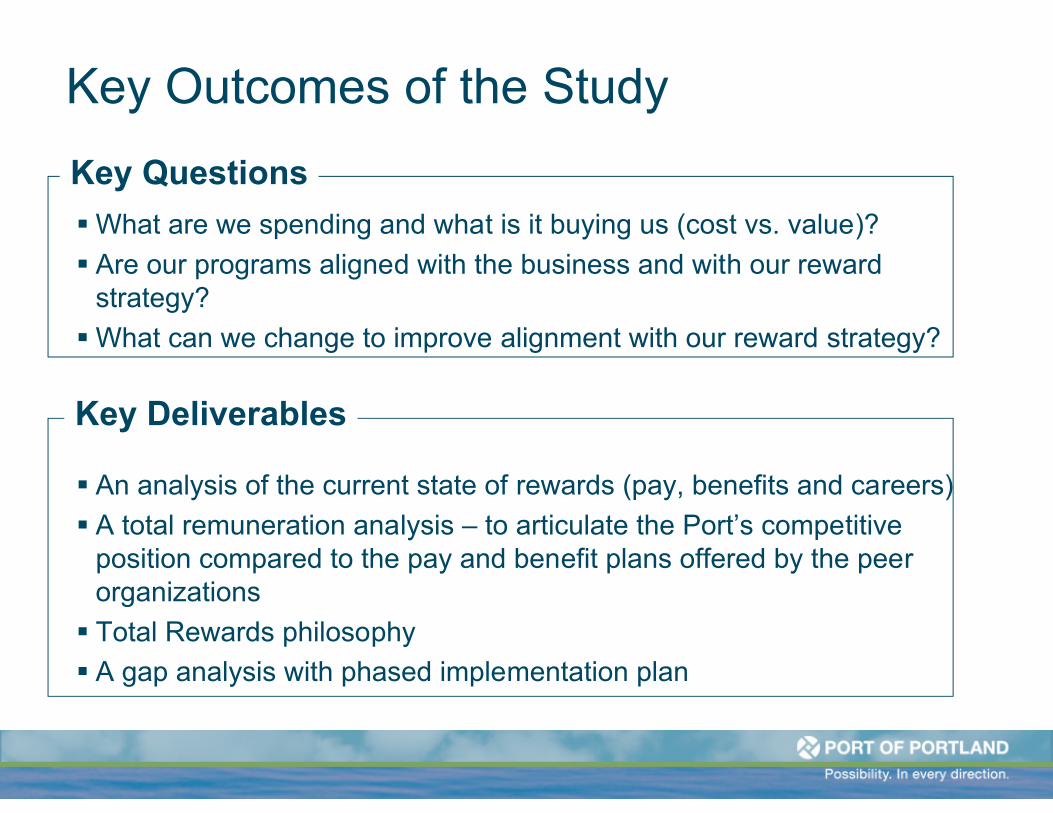
What are we spending and what is it buying us (cost vs. value)?
Are our programs aligned with the business and with our reward strategy?
What can we change to improve alignment with our reward strategy?
Key Deliverables
Key Questions
Key Outcomes of the Study
An analysis of the current state of rewards (pay, benefits and careers)
A total remuneration analysis – to articulate the Port’s competitive position compared to the pay and benefit plans offered by the peer organizations
Total Rewards philosophy
A gap analysis with phased implementation plan
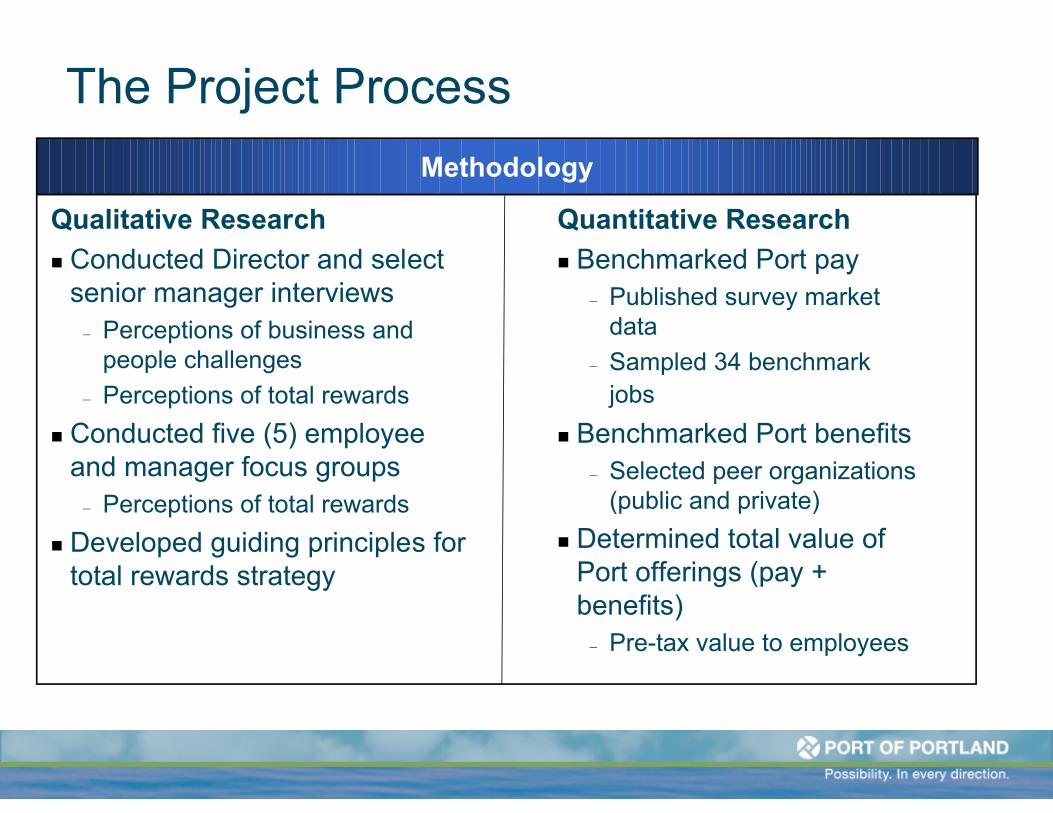
Qualitative Research
Conducted Director and select senior manager interviews
– Perceptions of business and people challenges
– Perceptions of total rewards
Conducted five (5) employee and manager focus groups
– Perceptions of total rewards
Developed guiding principles for total rewards strategy
Methodology
The Project Process
Quantitative Research
Benchmarked Port pay – Published survey market
data
– Sampled 34 benchmark jobs
Benchmarked Port benefits – Selected peer organizations
(public and private)
Determined total value of Port offerings (pay + benefits)
– Pre-tax value to employees
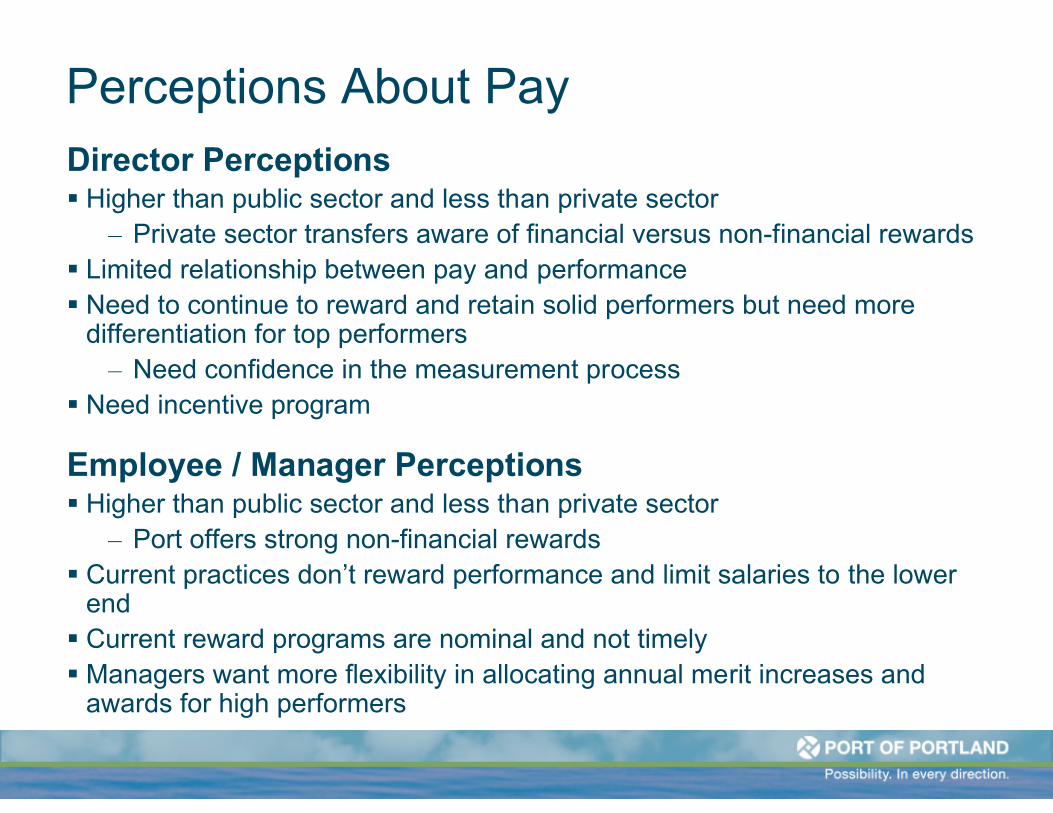
Perceptions About PayDirector Perceptions Higher than public sector and less than private sector
– Private sector transfers aware of financial versus non-financial rewards Limited relationship between pay and performance Need to continue to reward and retain solid performers but need more
differentiation for top performers– Need confidence in the measurement process
Need incentive program
Employee / Manager Perceptions Higher than public sector and less than private sector
– Port offers strong non-financial rewards Current practices don’t reward performance and limit salaries to the lower
end Current reward programs are nominal and not timely Managers want more flexibility in allocating annual merit increases and
awards for high performers
Key Findings – Pay
Base pay is in-line with the market
Pay shows limited relationship with performance
Anecdotal evidence further suggests:– Managers request re-grading as a work-around to increase pay rates
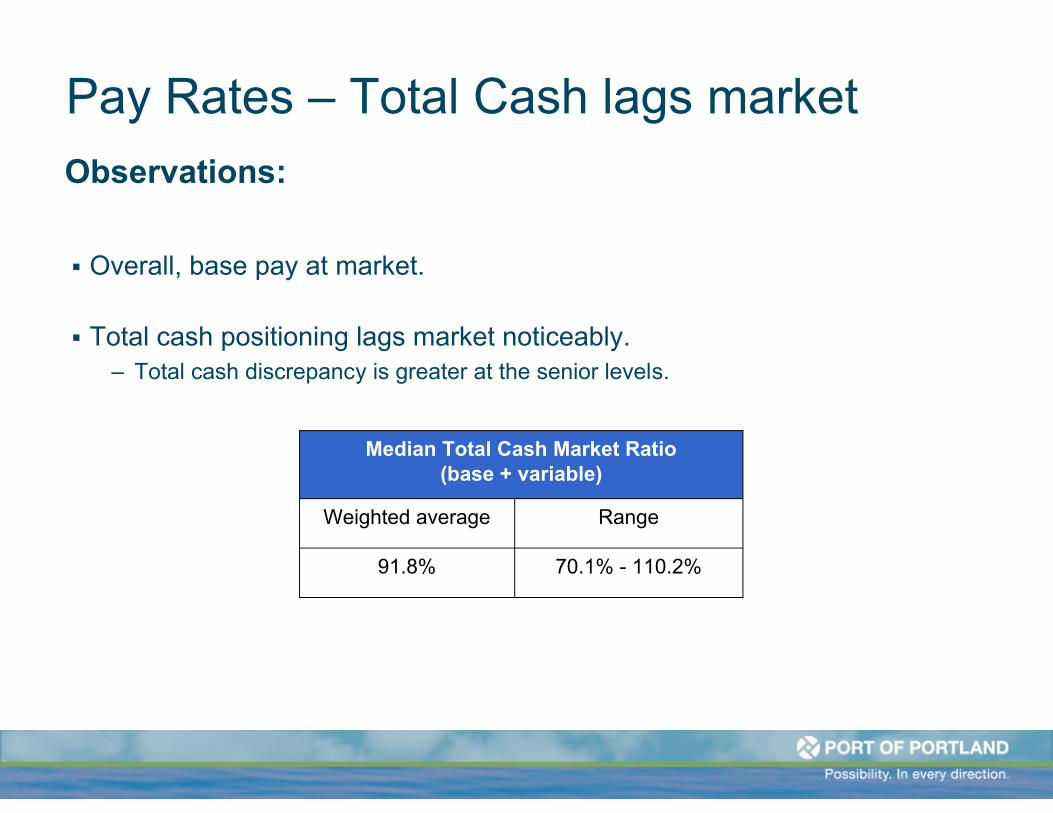
Pay Rates – Total Cash lags market
Observations:
Total cash positioning lags market noticeably.– Total cash discrepancy is greater at the senior levels.
Overall, base pay at market.
70.1% - 110.2%91.8%
RangeWeighted average
Median Total Cash Market Ratio(base + variable)
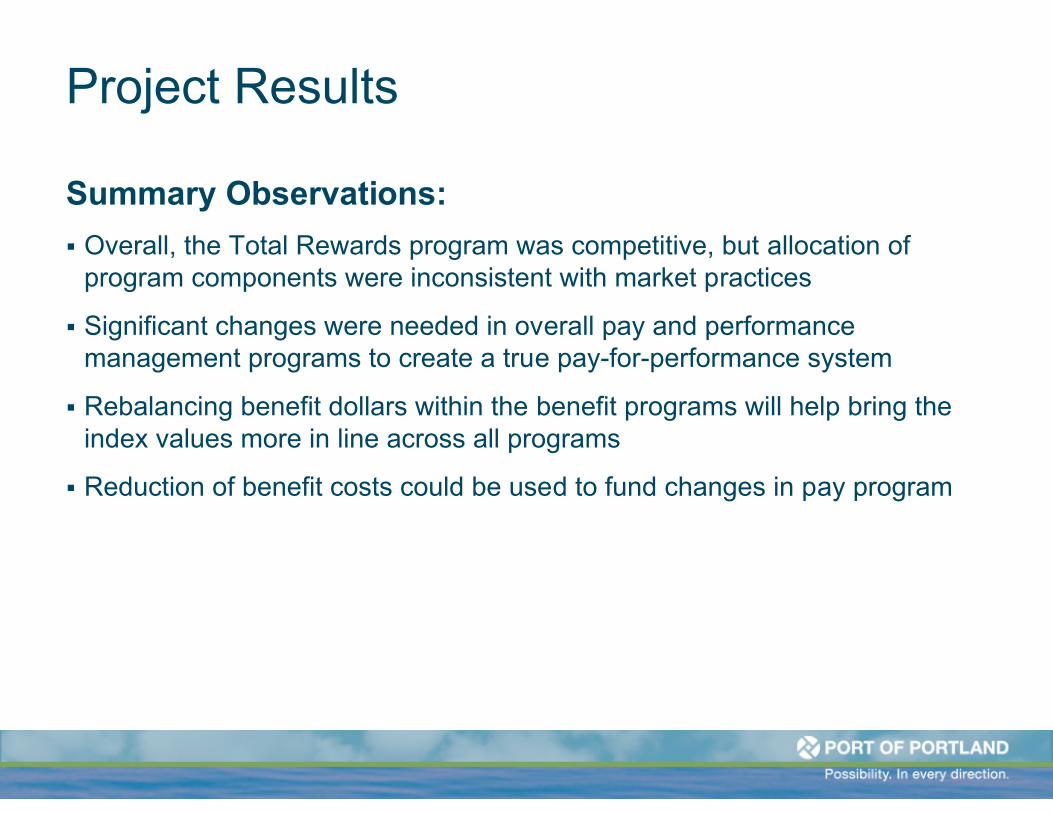
Project Results
Summary Observations:
Overall, the Total Rewards program was competitive, but allocation of program components were inconsistent with market practices
Significant changes were needed in overall pay and performance management programs to create a true pay-for-performance system
Rebalancing benefit dollars within the benefit programs will help bring the index values more in line across all programs
Reduction of benefit costs could be used to fund changes in pay program
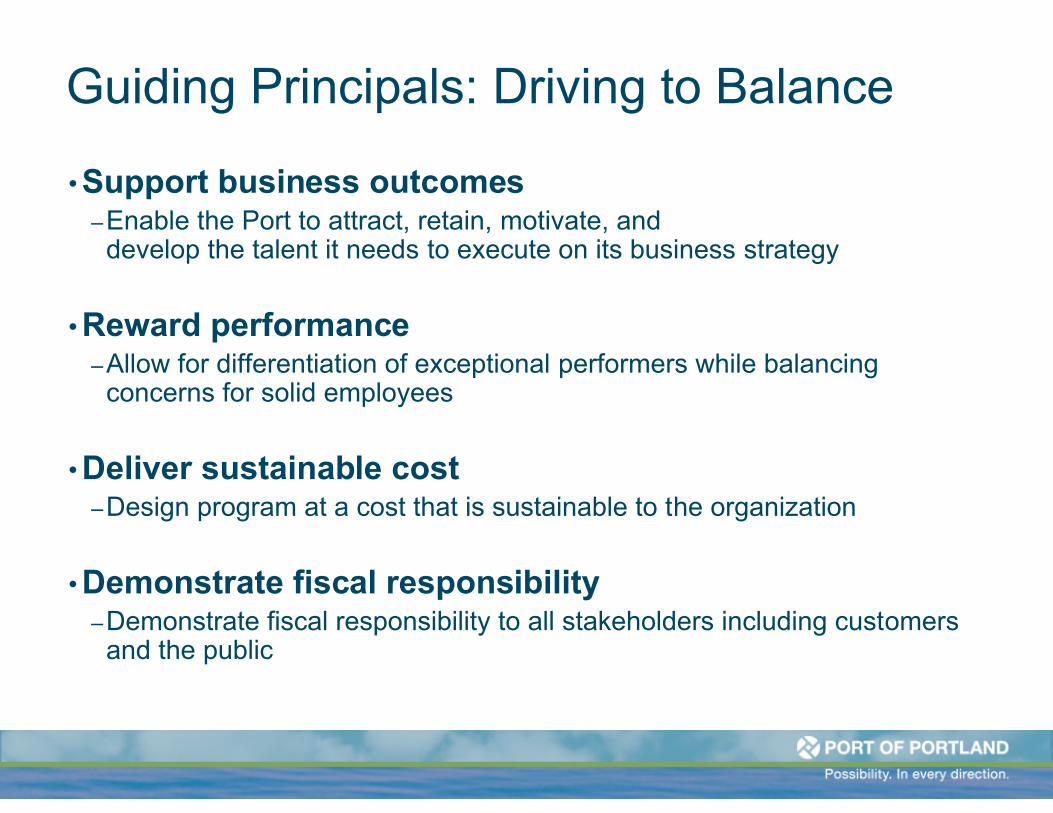
Guiding Principals: Driving to Balance
• Support business outcomes–Enable the Port to attract, retain, motivate, and
develop the talent it needs to execute on its business strategy
• Reward performance–Allow for differentiation of exceptional performers while balancing
concerns for solid employees
• Deliver sustainable cost–Design program at a cost that is sustainable to the organization
• Demonstrate fiscal responsibility–Demonstrate fiscal responsibility to all stakeholders including customers
and the public
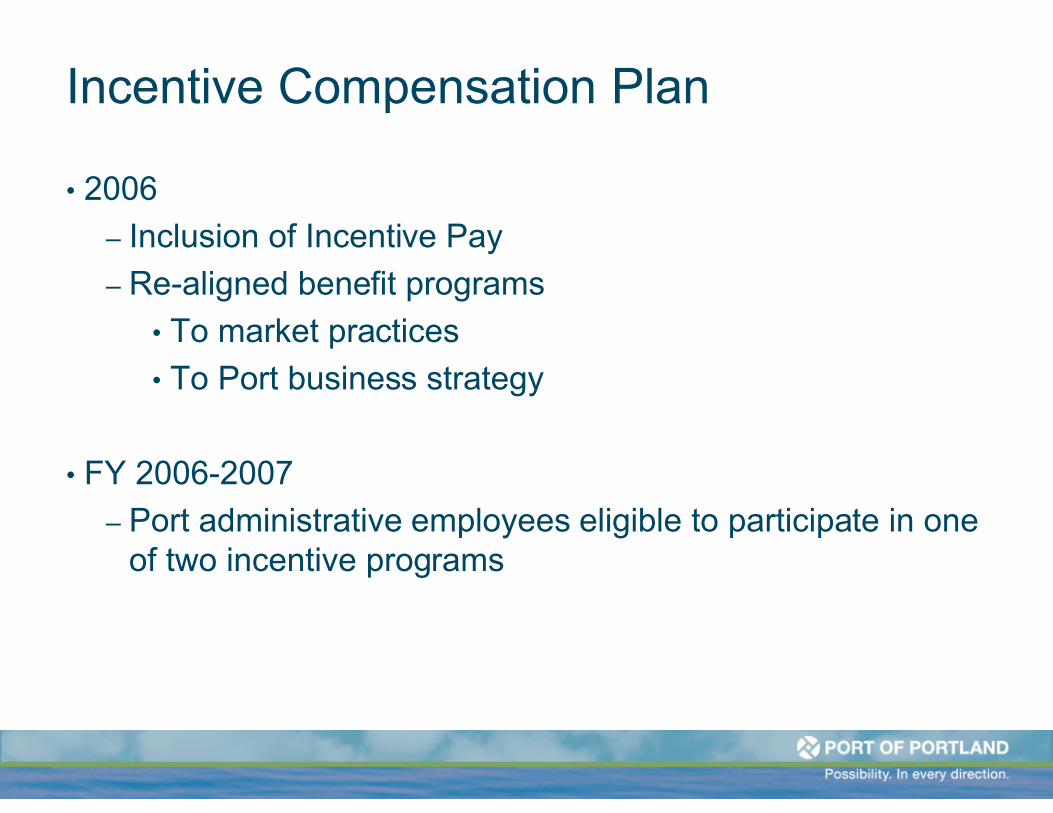
Incentive Compensation Plan
• 2006
– Inclusion of Incentive Pay
– Re-aligned benefit programs
• To market practices
• To Port business strategy
• FY 2006-2007
– Port administrative employees eligible to participate in one of two incentive programs
Original Incentive Plans
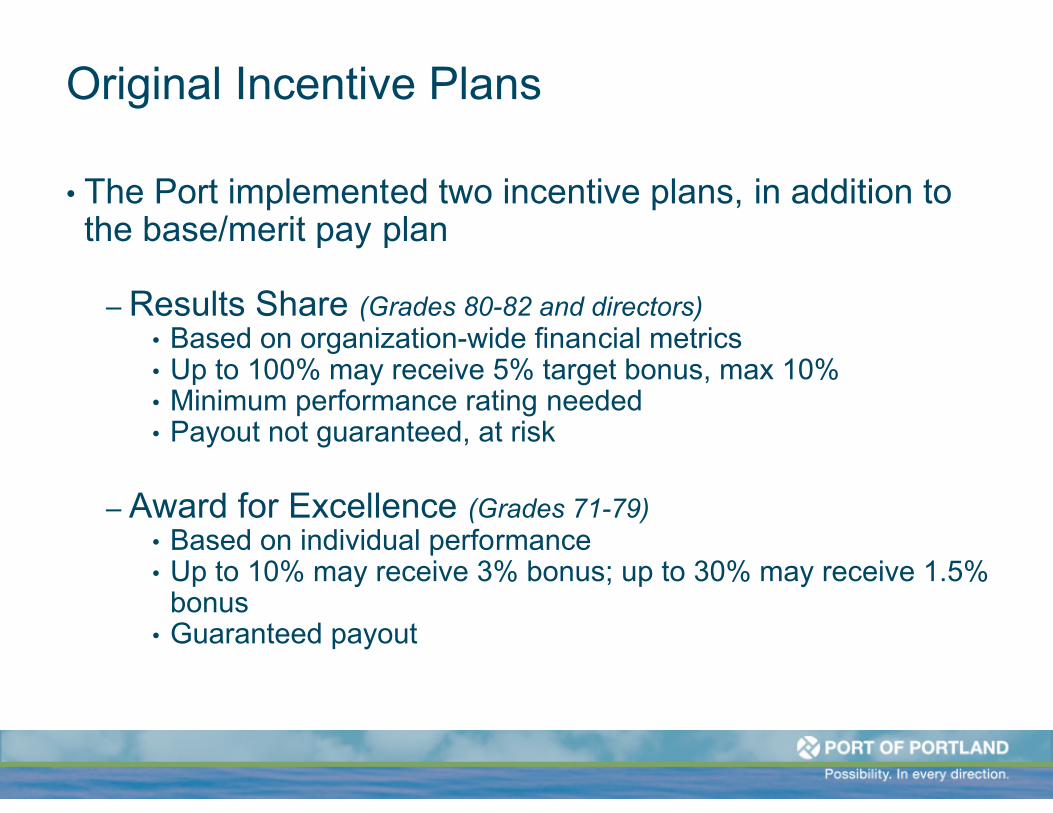
• The Port implemented two incentive plans, in addition to the base/merit pay plan
– Results Share (Grades 80-82 and directors)• Based on organization-wide financial metrics• Up to 100% may receive 5% target bonus, max 10%• Minimum performance rating needed• Payout not guaranteed, at risk
– Award for Excellence (Grades 71-79)• Based on individual performance• Up to 10% may receive 3% bonus; up to 30% may receive 1.5%
bonus• Guaranteed payout
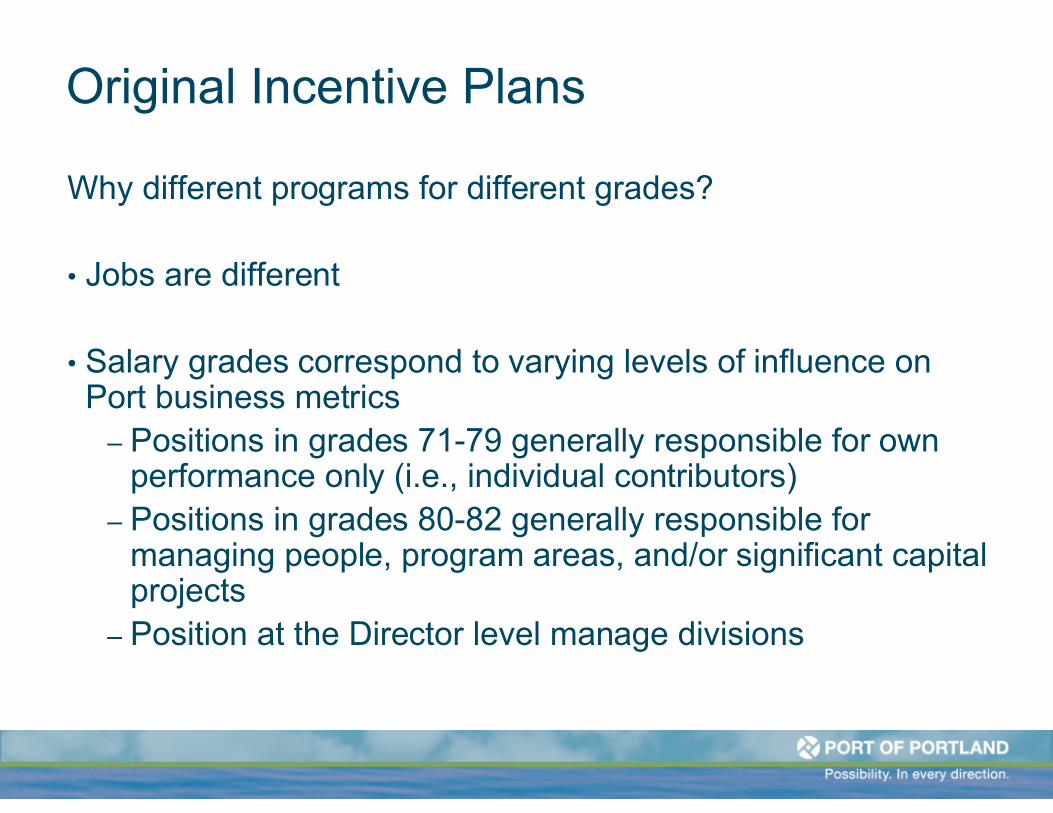
Original Incentive Plans
Why different programs for different grades?
• Jobs are different
• Salary grades correspond to varying levels of influence on Port business metrics
– Positions in grades 71-79 generally responsible for own performance only (i.e., individual contributors)
– Positions in grades 80-82 generally responsible for managing people, program areas, and/or significant capital projects
– Position at the Director level manage divisions
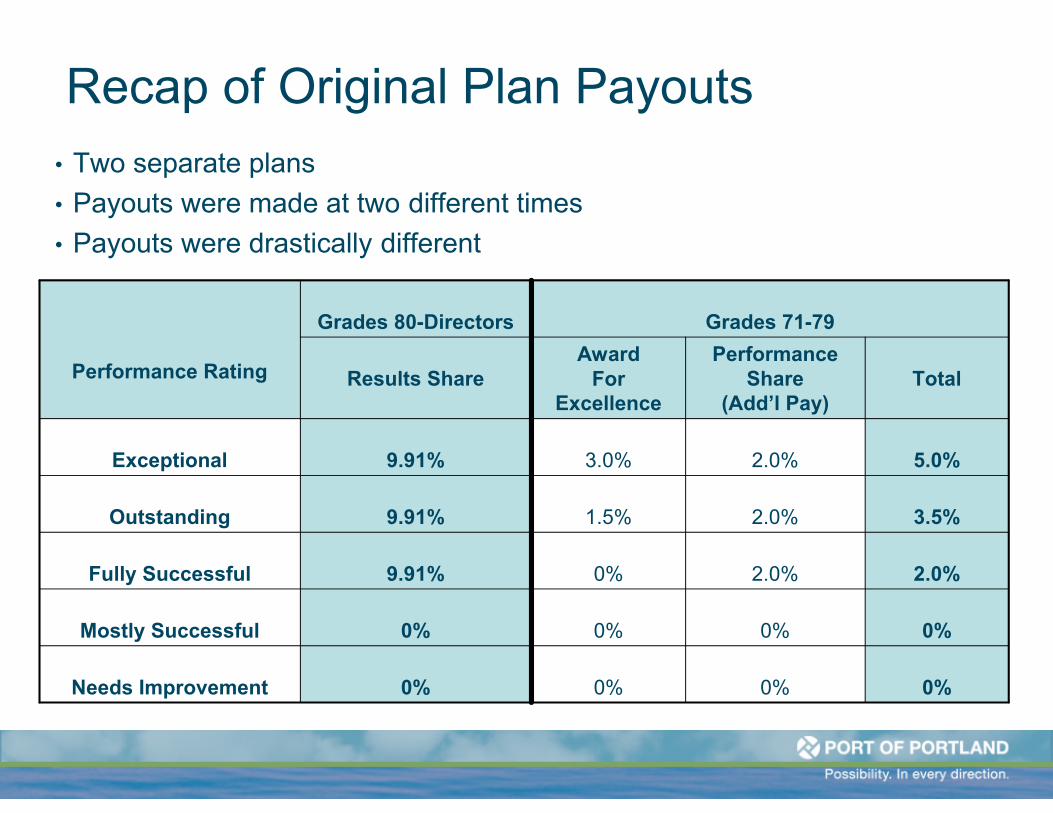
Recap of Original Plan Payouts
• Two separate plans
• Payouts were made at two different times
• Payouts were drastically different
0%0%0%0%Needs Improvement
0%0%0%0%Mostly Successful
2.0%2.0%0%9.91%Fully Successful
3.5%2.0%1.5%9.91%Outstanding
5.0%2.0%3.0%9.91%Exceptional
TotalPerformance
Share(Add’l Pay)
AwardFor
ExcellenceResults Share
Grades 71-79Grades 80-Directors
Performance Rating
Performance Management Evaluation
• Conducted Analysis-
– Ratings
– Merit pay
– Procedures
– Performance Management Survey
• Goal of Performance Management-
– Differentiate Performance
– Reward High Performance
– Improve management performance
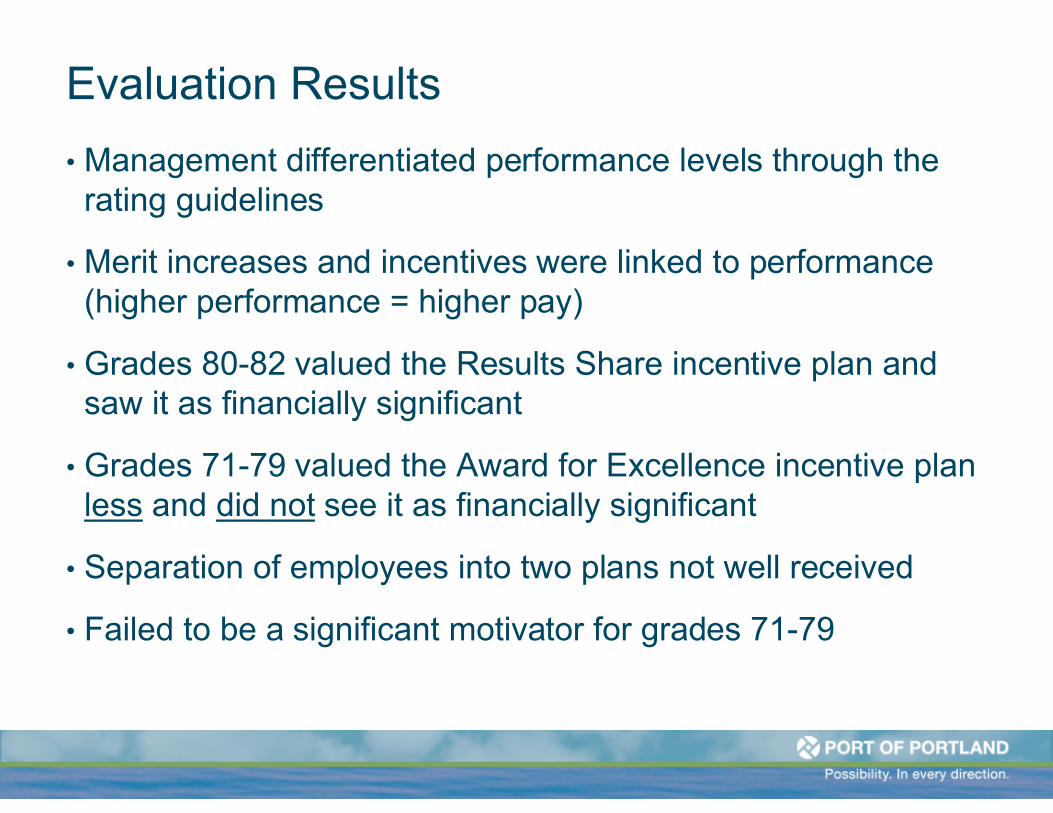
Evaluation Results
• Management differentiated performance levels through the rating guidelines
• Merit increases and incentives were linked to performance (higher performance = higher pay)
• Grades 80-82 valued the Results Share incentive plan and saw it as financially significant
• Grades 71-79 valued the Award for Excellence incentive plan less and did not see it as financially significant
• Separation of employees into two plans not well received
• Failed to be a significant motivator for grades 71-79
•What were we trying to achieve?
–Differentiate performance
–Reward high performance
–Improve management performance
Performance Management Goals

Differentiating Performance
• Differentiate performance through the rating distribution guidelines
• Measurements for differentiating performance:
– Port of Portland distribution
– Division level distribution
– Grade distribution
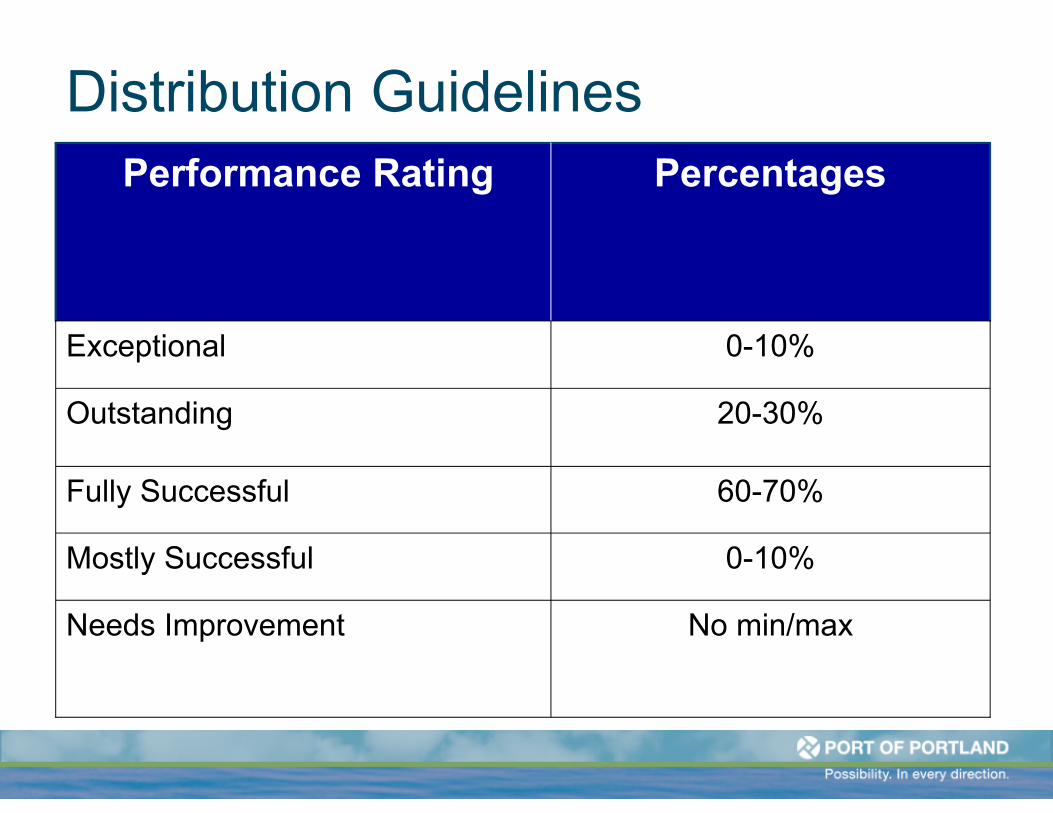
Distribution Guidelines
No min/maxNeeds Improvement
0-10%Mostly Successful
60-70%Fully Successful
20-30%Outstanding
0-10%Exceptional
PercentagesPerformance Rating
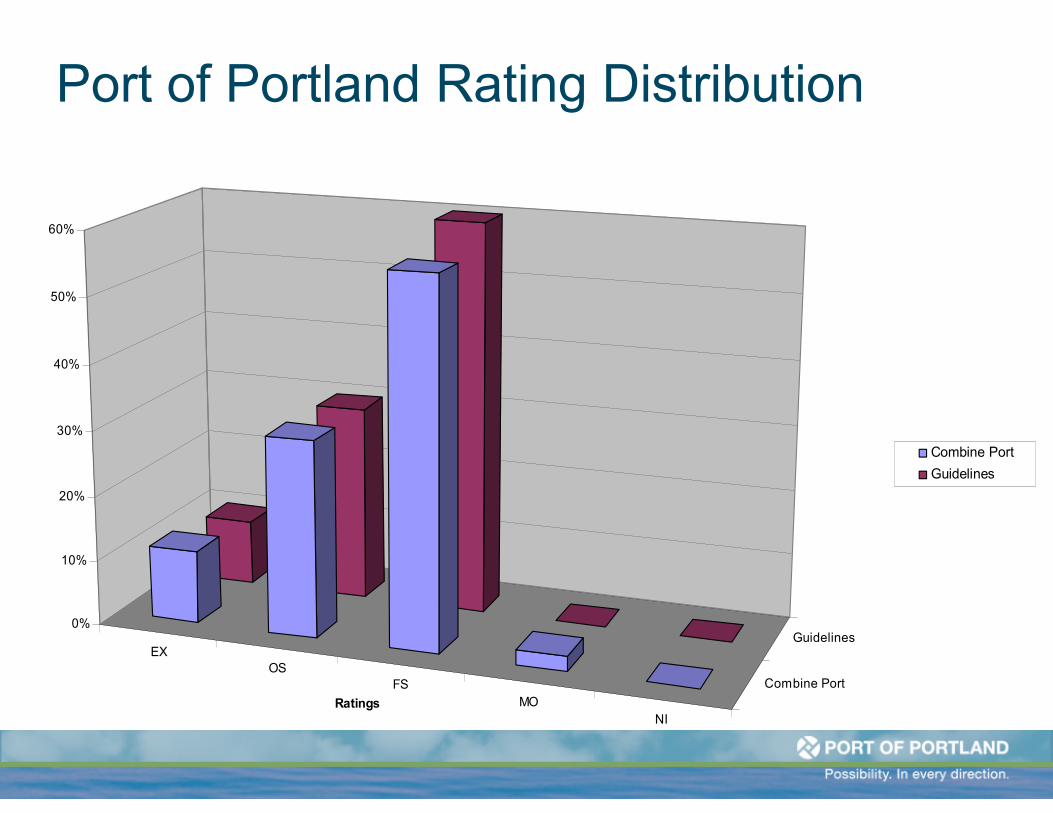
Port of Portland Rating Distribution
EXOS
FSMO
NI
Combine Port
Guidelines0%
10%
20%
30%
40%
50%
60%
Ratings
Combine Port
Guidelines
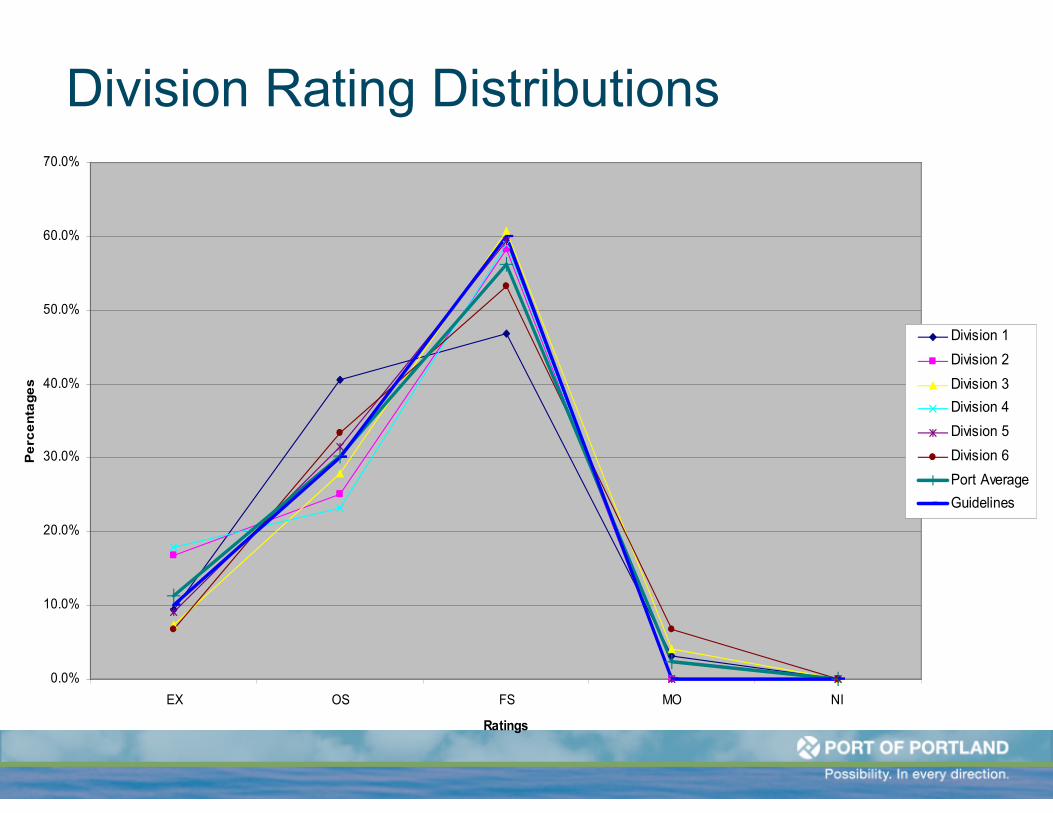
Division Rating Distributions
0.0%
10.0%
20.0%
30.0%
40.0%
50.0%
60.0%
70.0%
EX OS FS MO NI
Ratings
Pe
rce
nta
ge
s
Division 1
Division 2
Division 3
Division 4
Division 5
Division 6
Port Average
Guidelines
Rewarding High Performance
• Strengthen pay-for-performance philosophy with incentive and reward/recognition programs
• Measurements for rewarding high performance:
– Merit pay analysis
– Performance management survey
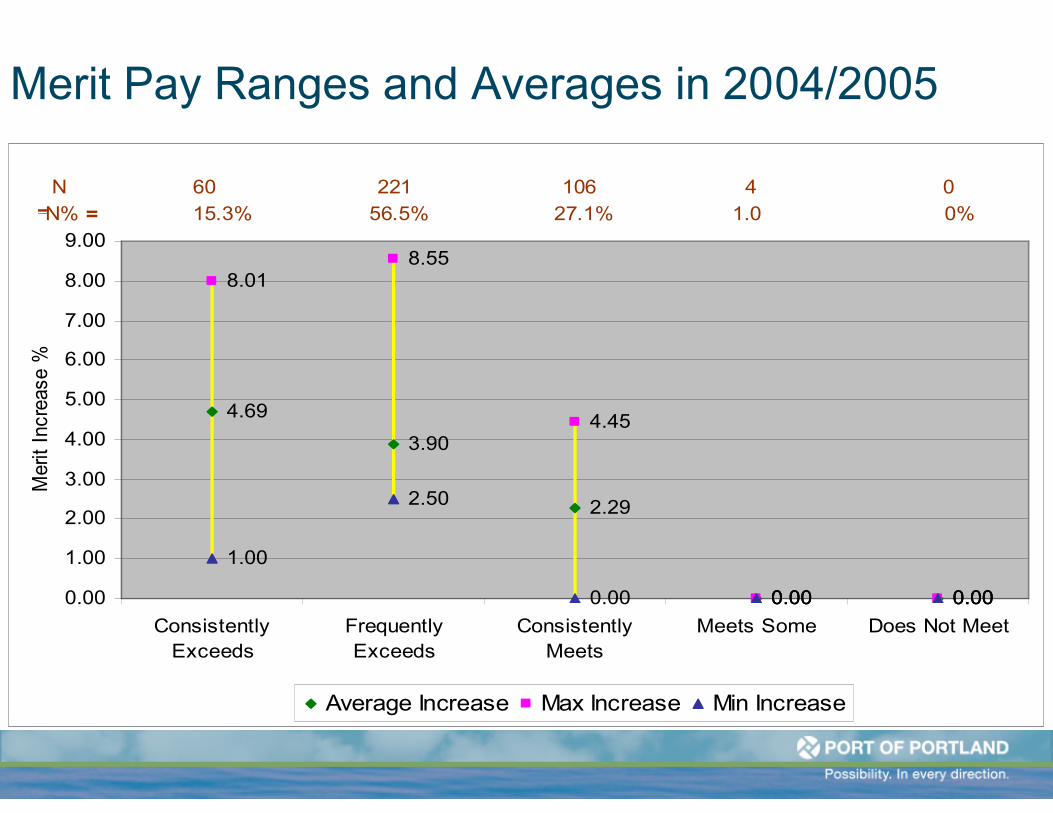
Merit Pay Ranges and Averages in 2004/2005
4.69
3.90
2.29
0.00 0.00
8.018.55
4.45
0.00 0.00
1.00
2.50
0.00 0.00 0.000.00
1.00
2.00
3.00
4.00
5.00
6.00
7.00
8.00
9.00
ConsistentlyExceeds
FrequentlyExceeds
ConsistentlyMeets
Meets Some Does Not Meet
Mer
it In
crea
se %
Average Increase Max Increase Min Increase
060 221 106 4 N = 0%15.3% 56.5% 27.1% 1.0
%N% =
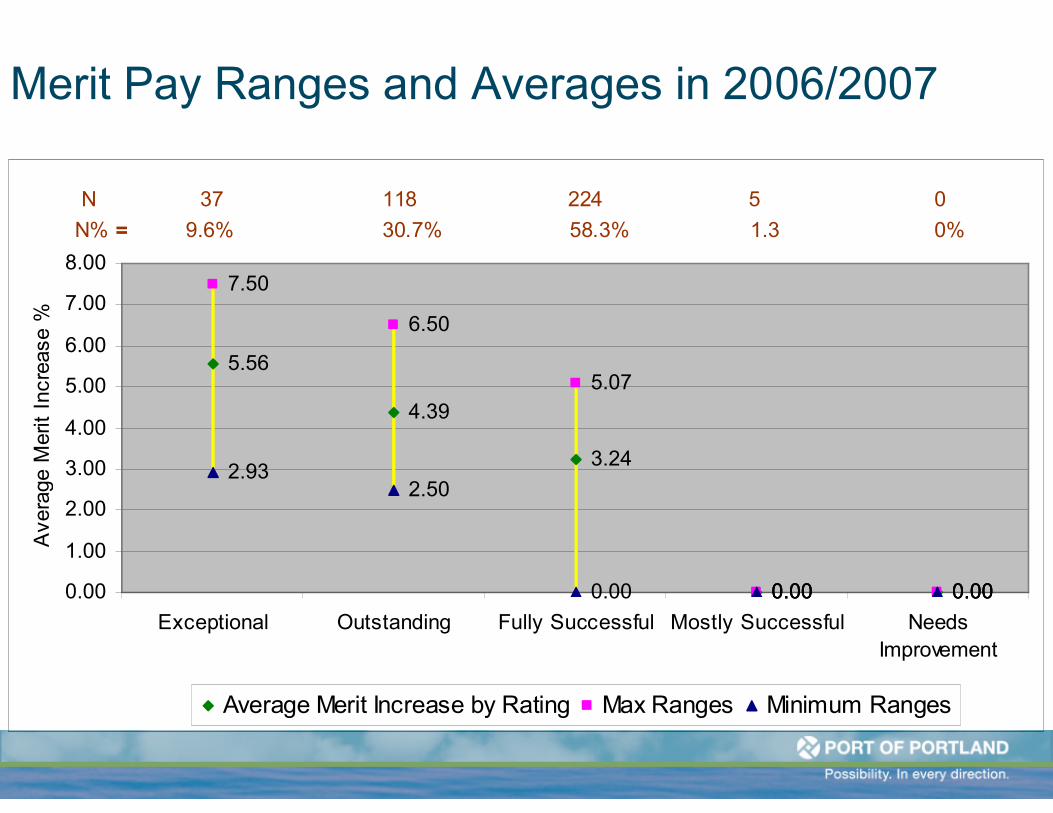
5.56
4.39
3.24
0.00 0.00
7.50
6.50
5.07
0.00 0.00
2.932.50
0.00 0.00 0.000.00
1.00
2.00
3.00
4.00
5.00
6.00
7.00
8.00
Exceptional Outstanding Fully Successful Mostly Successful NeedsImprovement
Ave
rage
Mer
it In
crea
se %
Average Merit Increase by Rating Max Ranges Minimum Ranges
037 118 224 5 N = 0%9.6% 30.7% 58.3% 1.3
% N% =
Merit Pay Ranges and Averages in 2006/2007
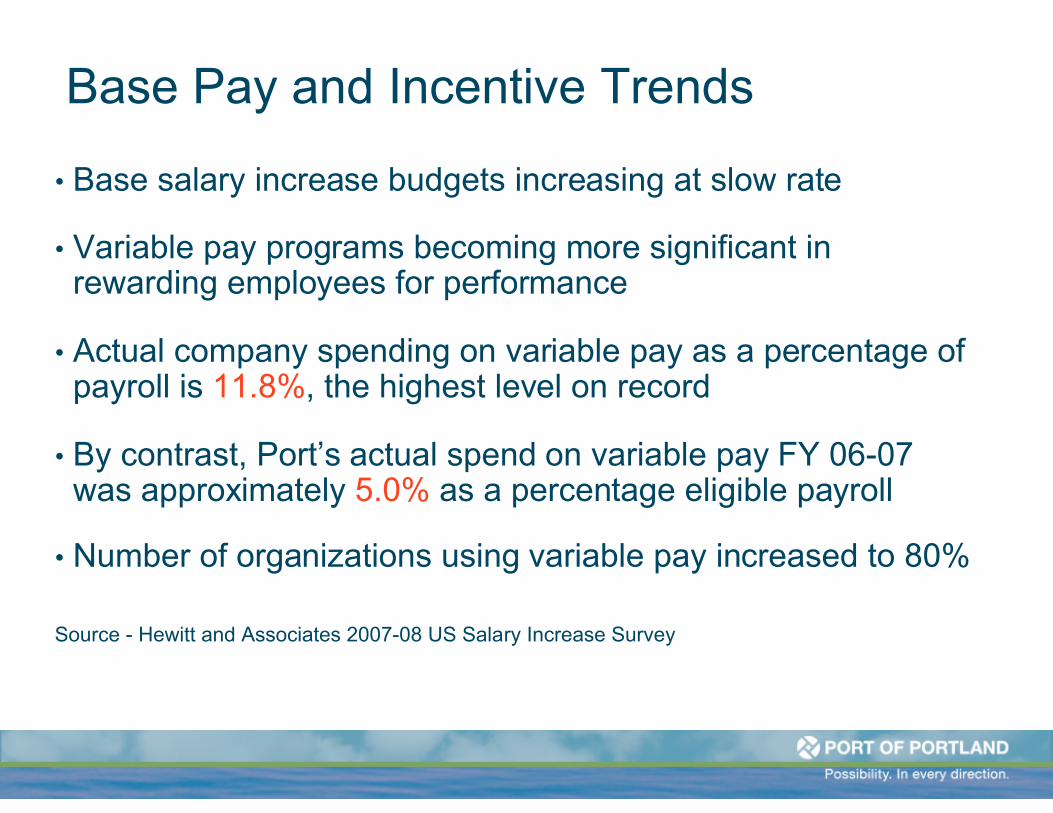
Base Pay and Incentive Trends
• Base salary increase budgets increasing at slow rate
• Variable pay programs becoming more significant in rewarding employees for performance
• Actual company spending on variable pay as a percentage of payroll is 11.8%, the highest level on record
• By contrast, Port’s actual spend on variable pay FY 06-07 was approximately 5.0% as a percentage eligible payroll
• Number of organizations using variable pay increased to 80%
Source - Hewitt and Associates 2007-08 US Salary Increase Survey
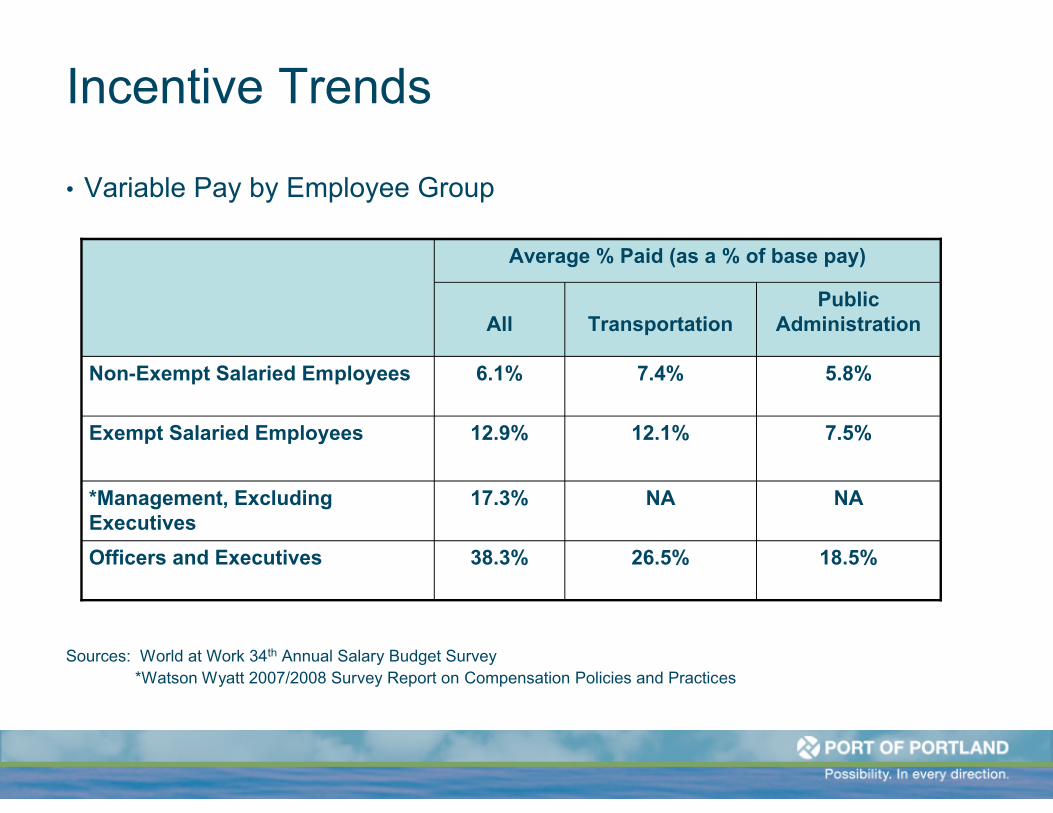
Incentive Trends
• Variable Pay by Employee Group
Sources: World at Work 34th Annual Salary Budget Survey*Watson Wyatt 2007/2008 Survey Report on Compensation Policies and Practices
NANA17.3%*Management, Excluding Executives
Public AdministrationTransportationAll
7.5%12.1%12.9%Exempt Salaried Employees
18.5%26.5%38.3%Officers and Executives
5.8%7.4%6.1%Non-Exempt Salaried Employees
Average % Paid (as a % of base pay)
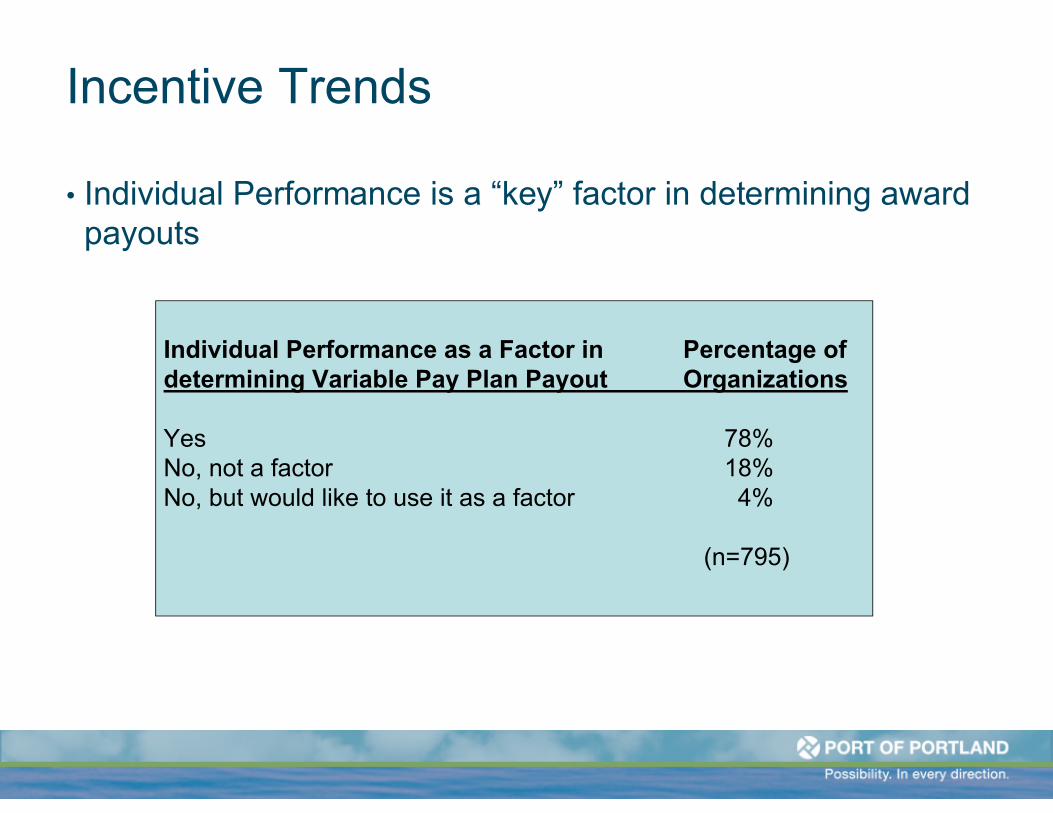
Incentive Trends
• Individual Performance is a “key” factor in determining award payouts
Individual Performance as a Factor in Percentage ofdetermining Variable Pay Plan Payout Organizations
Yes 78%No, not a factor 18%No, but would like to use it as a factor 4%
(n=795)
Objectives of Variable Pay
• Link rewards to business plan and company culture
• Focus employee’s attention on results
• Increase productivity
• Recruit key employees
• Retain key employees
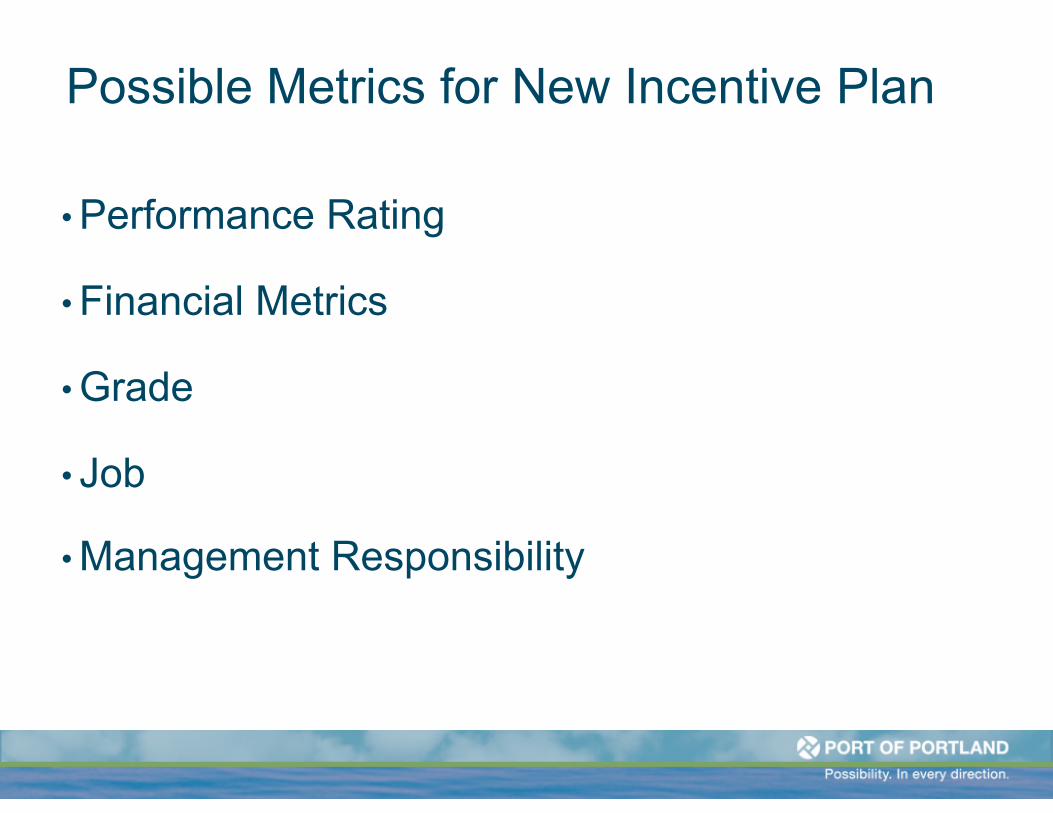
Possible Metrics for New Incentive Plan
• Performance Rating
• Financial Metrics
• Grade
• Job
• Management Responsibility
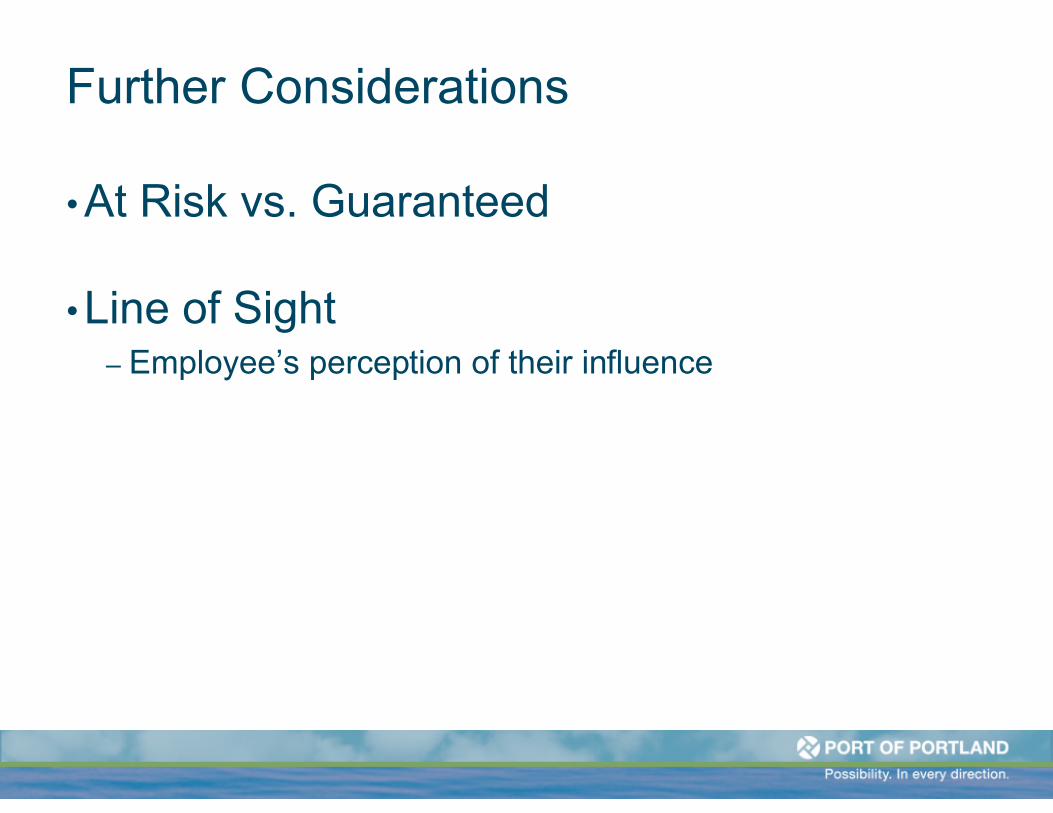
Further Considerations
•At Risk vs. Guaranteed
•Line of Sight– Employee’s perception of their influence
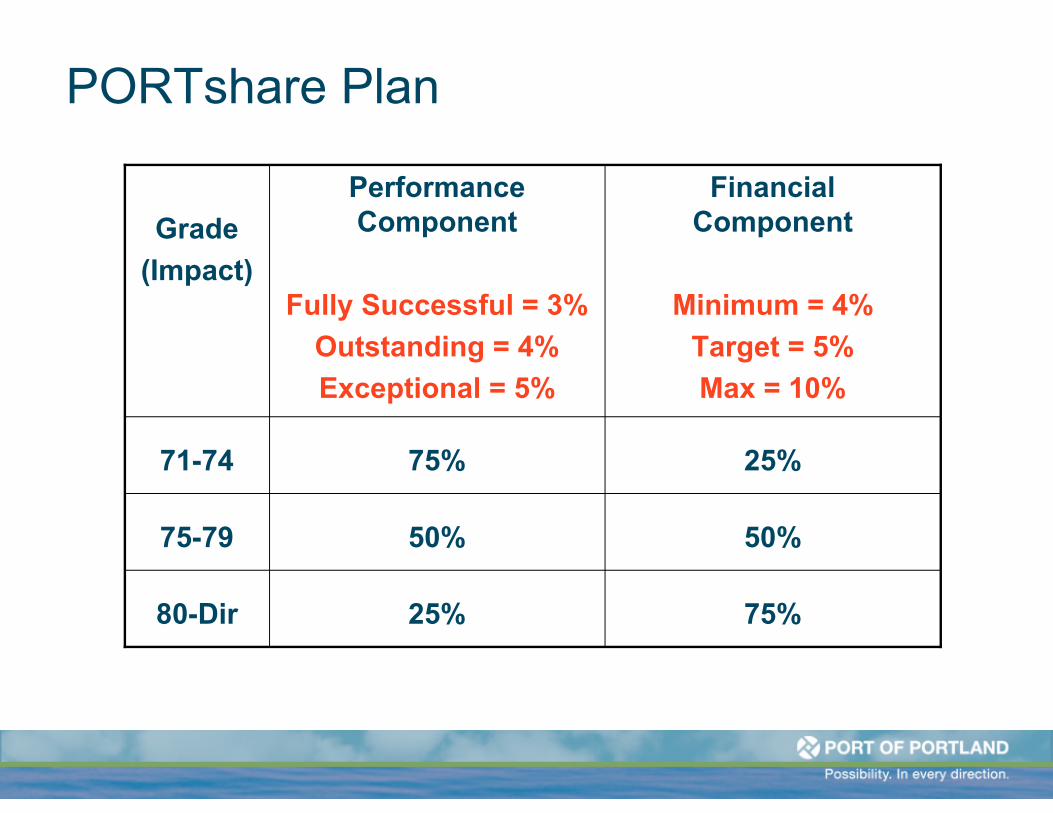
PORTshare Plan
25%75%71-74
50%50%75-79
25%
Performance Component
Fully Successful = 3%
Outstanding = 4%
Exceptional = 5%
80-Dir
Grade
(Impact)
75%
Financial Component
Minimum = 4%
Target = 5%
Max = 10%
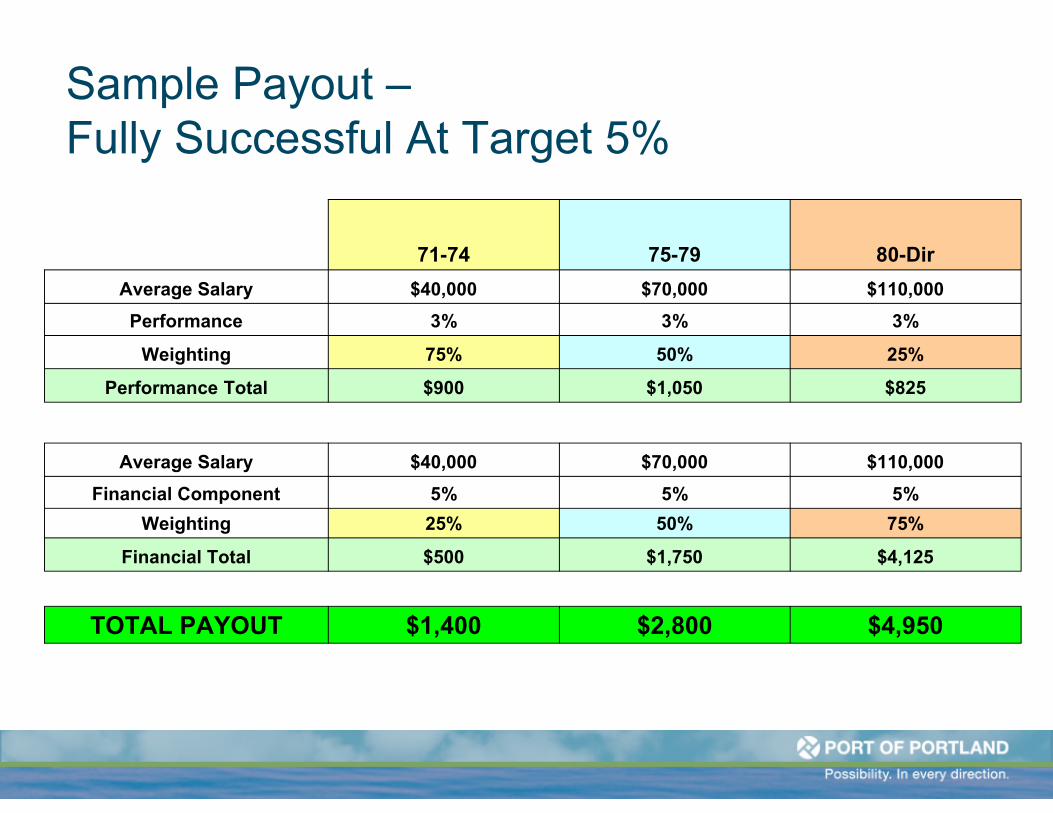
Sample Payout –Fully Successful At Target 5%
$4,950$2,800$1,400TOTAL PAYOUT
$4,125$1,750$500Financial Total
75%50%25%Weighting
5%5%5%Financial Component
$110,000 $70,000 $40,000 Average Salary
$825 $1,050 $900 Performance Total
25%50%75%Weighting
3%3%3%Performance
$110,000 $70,000 $40,000 Average Salary
80-Dir75-7971-74

Sample Payout –Fully Successful At Maximum 10%
$9,075$4,550$1,900TOTAL PAYOUT
$8,250$3,500$1,000Financial Total
75%50%25%Weighting
10%10%10%Financial Component
$110,000 $70,000 $40,000 Average Salary
$825 $1,050 $900 Performance Total
25%50%75%Weighting
3%3%3%Performance
$110,000 $70,000 $40,000 Average Salary
80-Dir75-7971-74
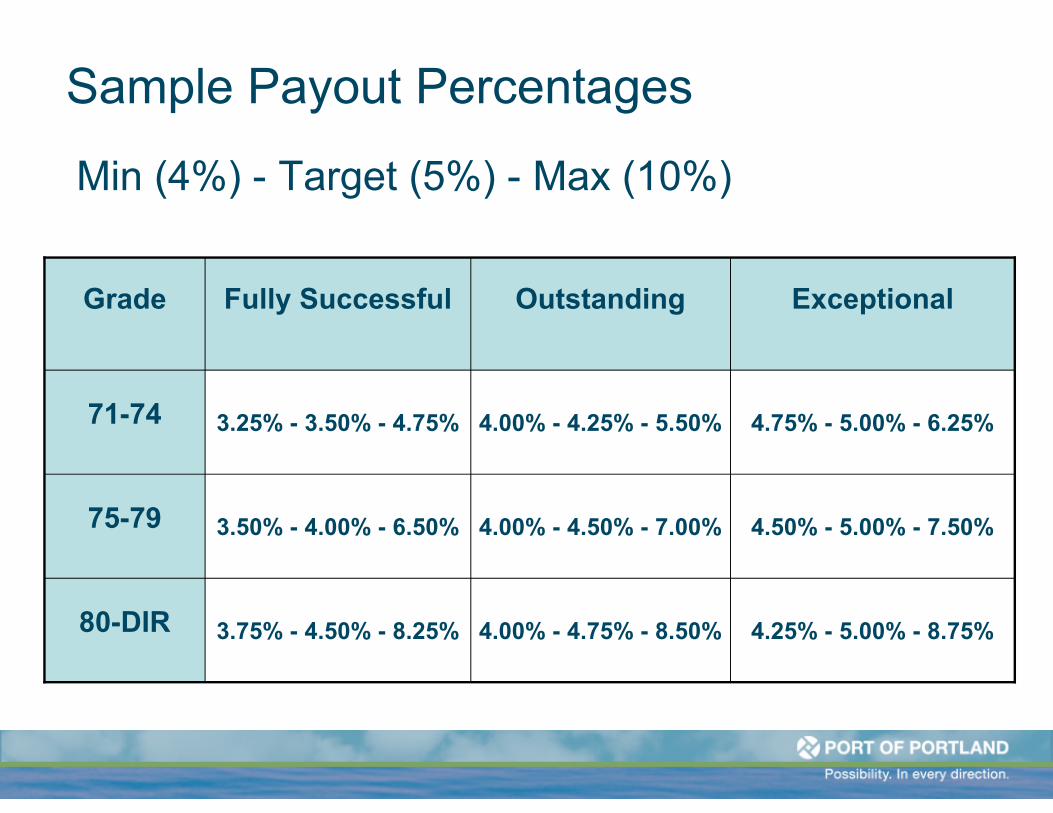
Sample Payout Percentages
4.25% - 5.00% - 8.75%4.00% - 4.75% - 8.50%3.75% - 4.50% - 8.25%80-DIR
4.50% - 5.00% - 7.50%4.00% - 4.50% - 7.00%3.50% - 4.00% - 6.50%75-79
4.75% - 5.00% - 6.25%4.00% - 4.25% - 5.50%3.25% - 3.50% - 4.75%71-74
ExceptionalOutstandingFully SuccessfulGrade
Min (4%) - Target (5%) - Max (10%)

Employee Recognition Programs
Recognition. From Every Direction.
Agenda
• Background
• Programs Overview
• Roles
• Q&A
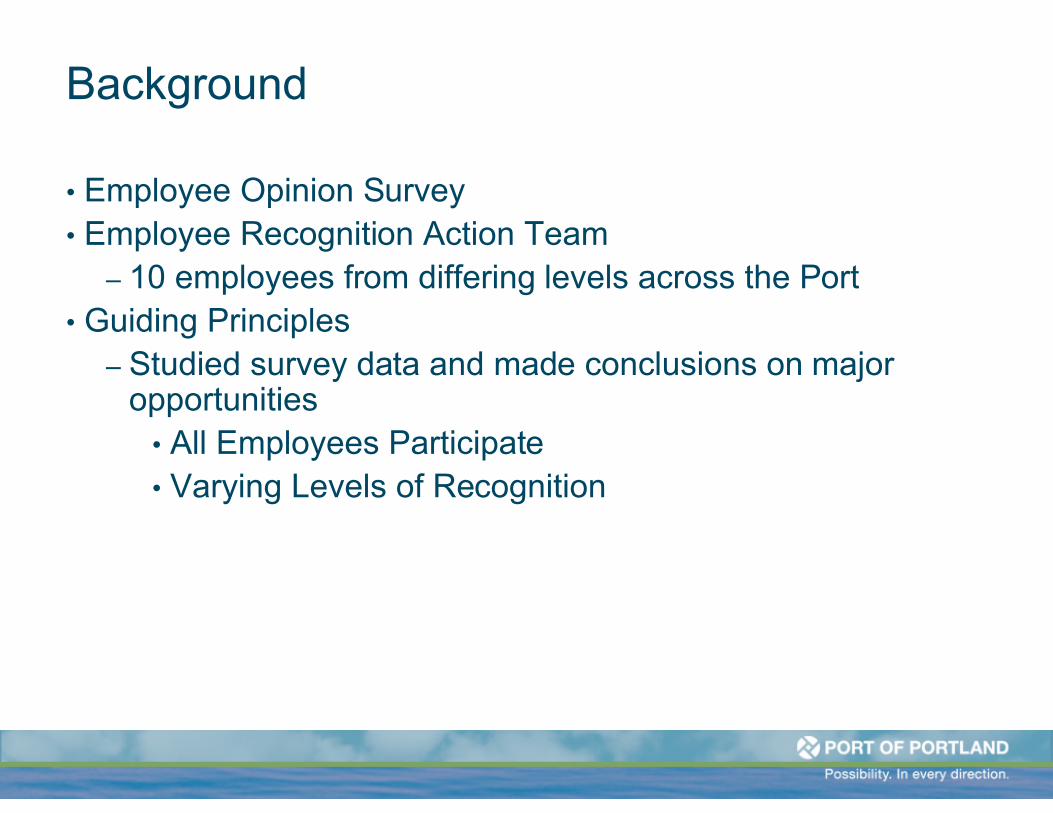
Background
• Employee Opinion Survey• Employee Recognition Action Team
– 10 employees from differing levels across the Port• Guiding Principles
– Studied survey data and made conclusions on major opportunities
• All Employees Participate• Varying Levels of Recognition
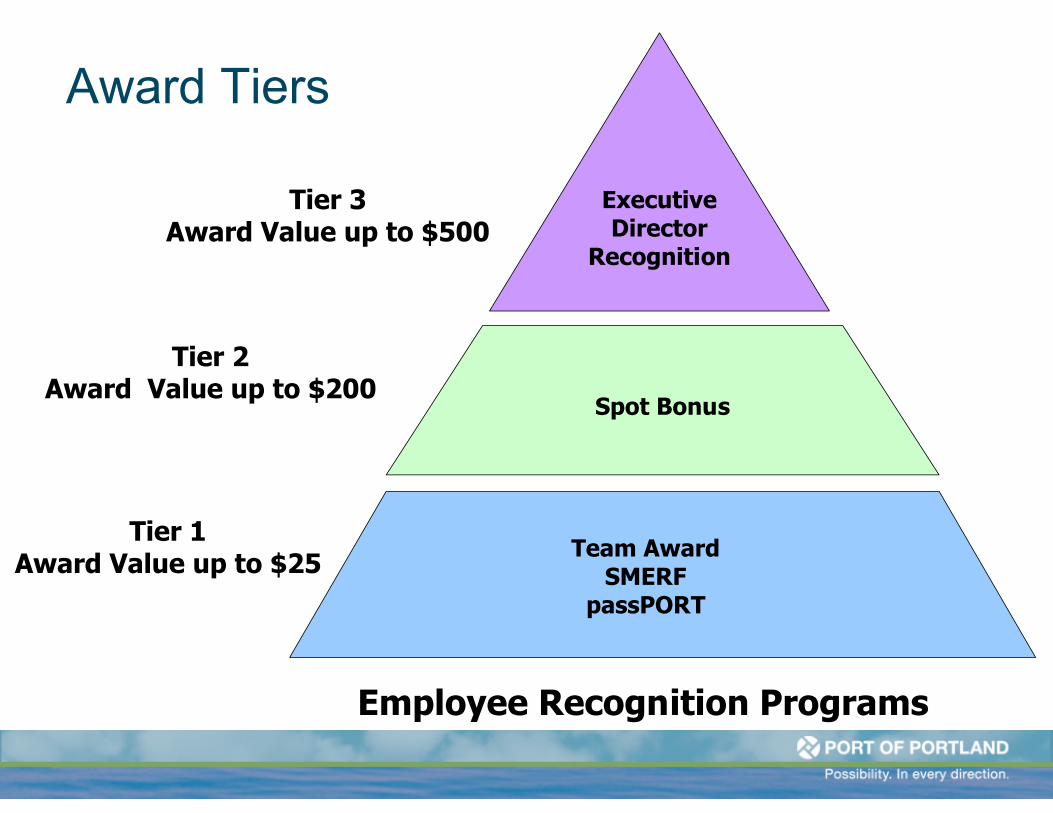
Award Tiers
Employee Recognition Programs
Executive Director
Recognition
Spot Bonus
Team AwardSMERF
passPORT
Tier 3Award Value up to $500
Tier 1Award Value up to $25
Tier 2Award Value up to $200
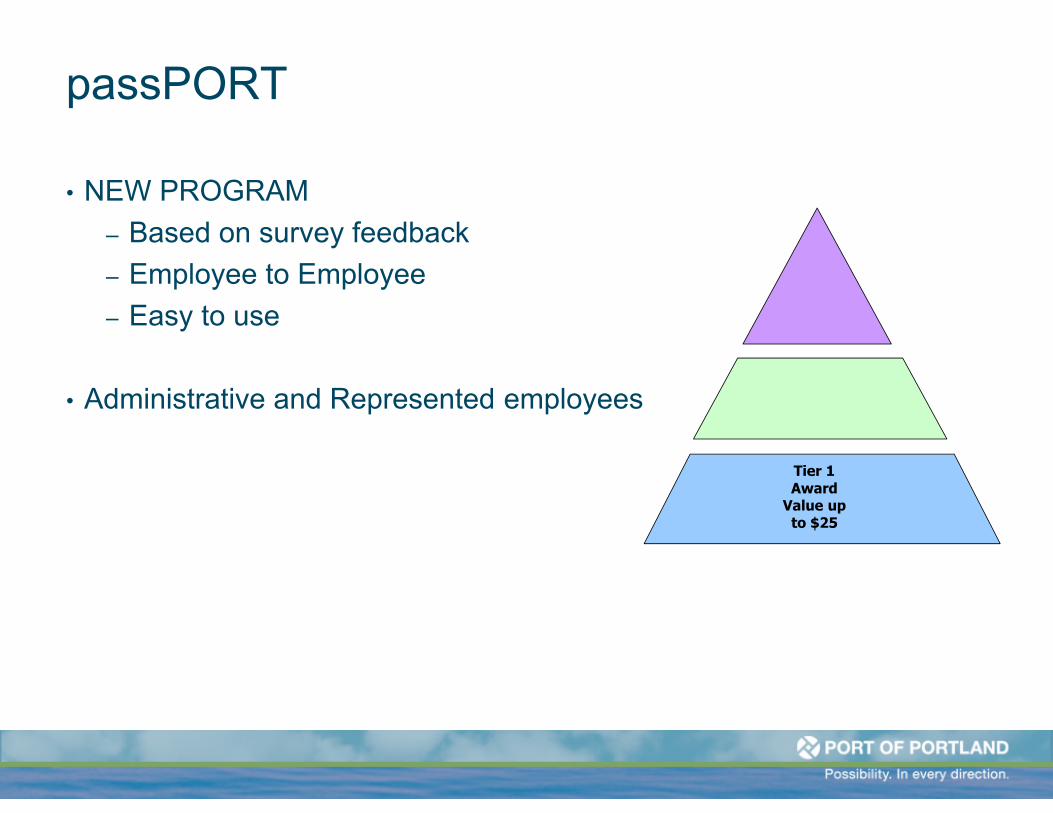
passPORT
• NEW PROGRAM
– Based on survey feedback
– Employee to Employee
– Easy to use
• Administrative and Represented employees
Tier 1Award
Value upto $25
passPORT
• Give for a variety of flexible job-related reasons
– Job well done
– Initiative and innovation
– Memorable customer service experience
– Going the extra mile
– Proactively seeks to provide extra assistance
passPORT• 2 Part Process
– Awarder
• Every employee gets a passPORT and stamps
• See it - Reward it
– Recipient
• Collect stamps for awards
• Share successes with manager
• Redeem page(s) for awards
• $5 value/page
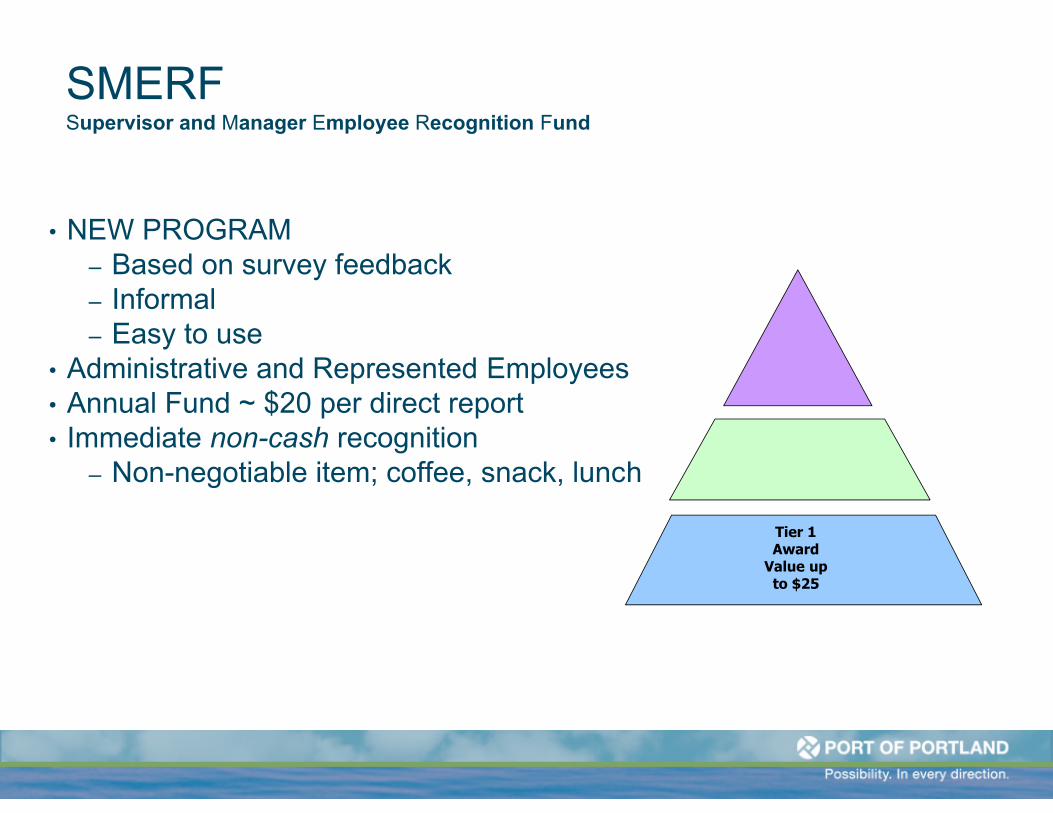
SMERF Supervisor and Manager Employee Recognition Fund
• NEW PROGRAM– Based on survey feedback– Informal– Easy to use
• Administrative and Represented Employees • Annual Fund ~ $20 per direct report• Immediate non-cash recognition
– Non-negotiable item; coffee, snack, lunch
Tier 1Award
Value upto $25
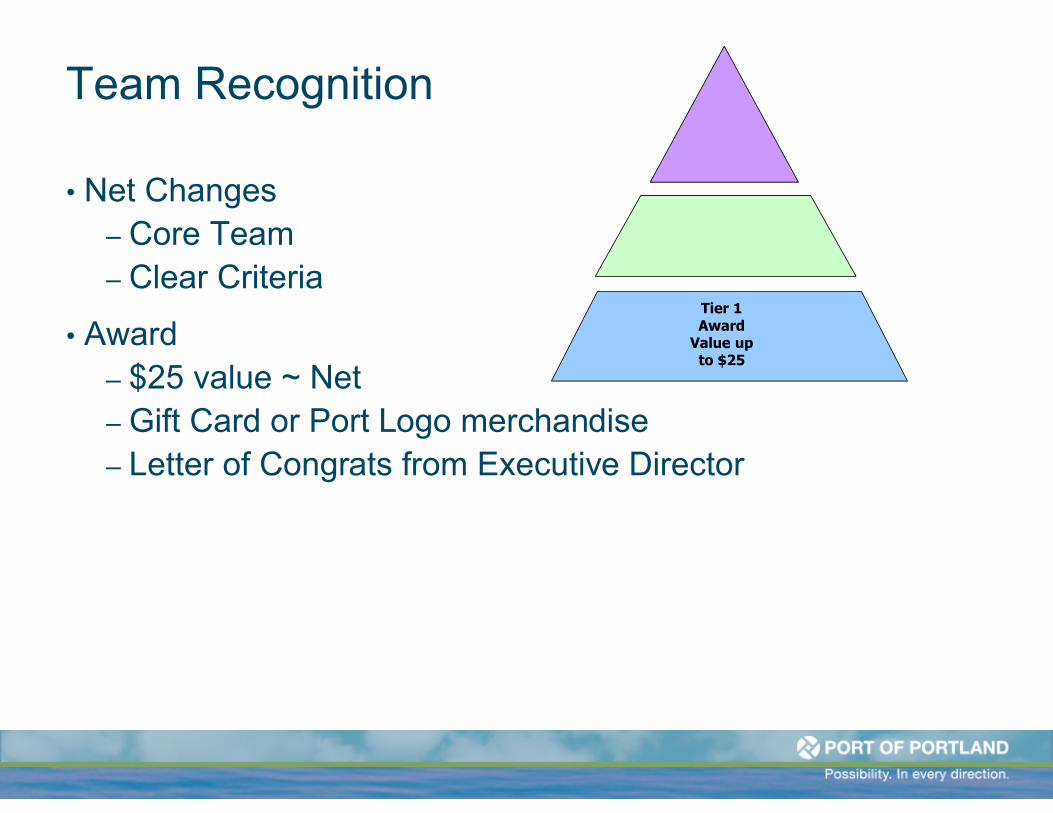
Team Recognition
• Net Changes– Core Team – Clear Criteria
• Award– $25 value ~ Net– Gift Card or Port Logo merchandise – Letter of Congrats from Executive Director
Tier 1Award
Value upto $25
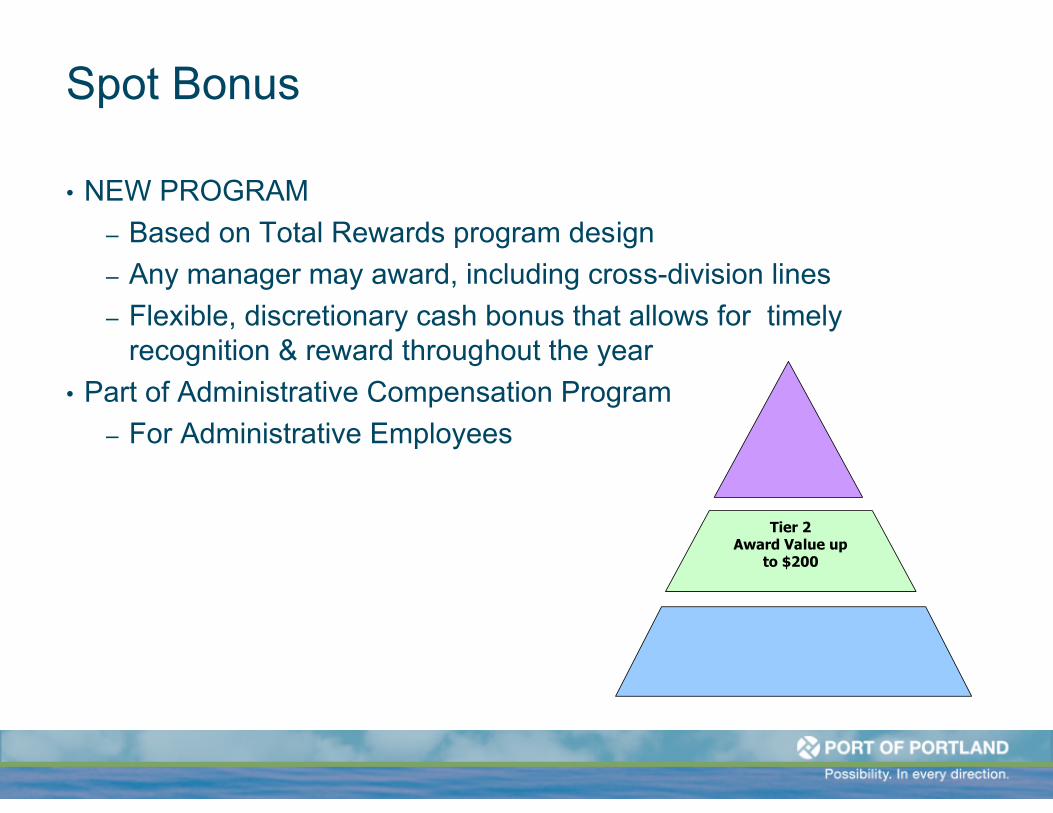
Spot Bonus
• NEW PROGRAM
– Based on Total Rewards program design
– Any manager may award, including cross-division lines
– Flexible, discretionary cash bonus that allows for timely recognition & reward throughout the year
• Part of Administrative Compensation Program
– For Administrative Employees
Tier 2Award Value up
to $200
Spot Bonus
• Awards
– Levels: $50, $100, $200 cash bonus ~ Net
– Award Certificate (optional)
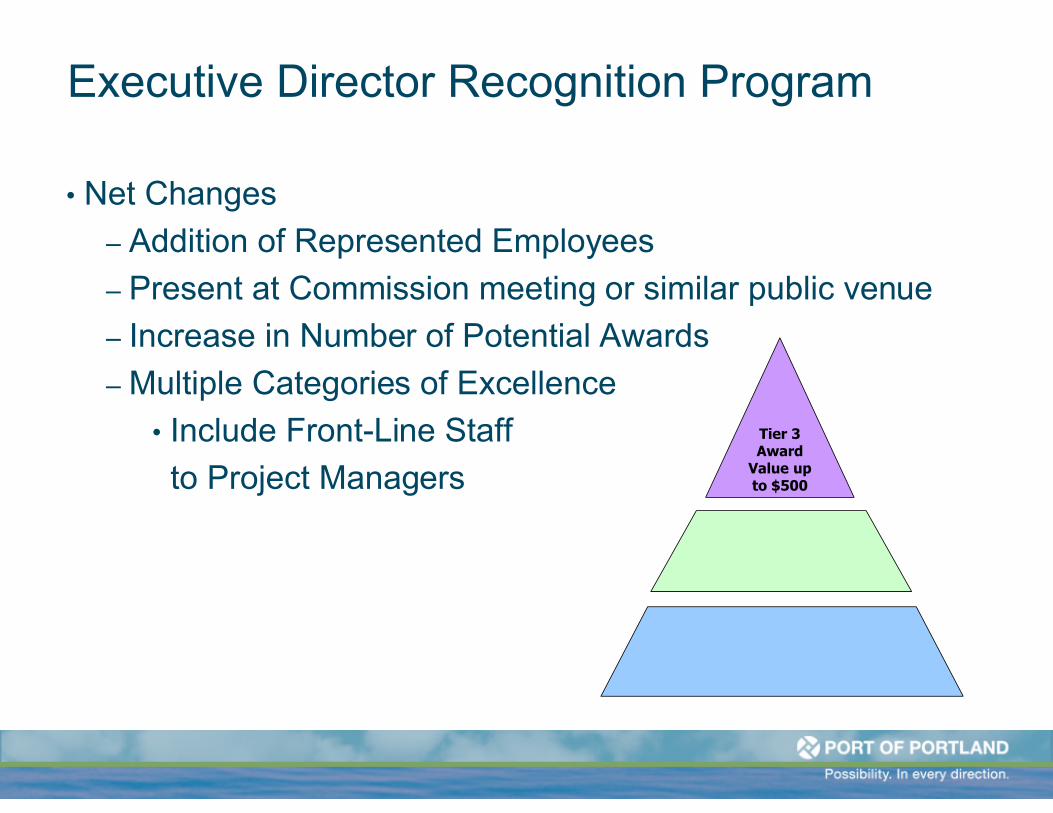
Executive Director Recognition Program
• Net Changes
– Addition of Represented Employees
– Present at Commission meeting or similar public venue
– Increase in Number of Potential Awards
– Multiple Categories of Excellence
• Include Front-Line Staff
to Project Managers
Tier 3 Award
Value up to $500
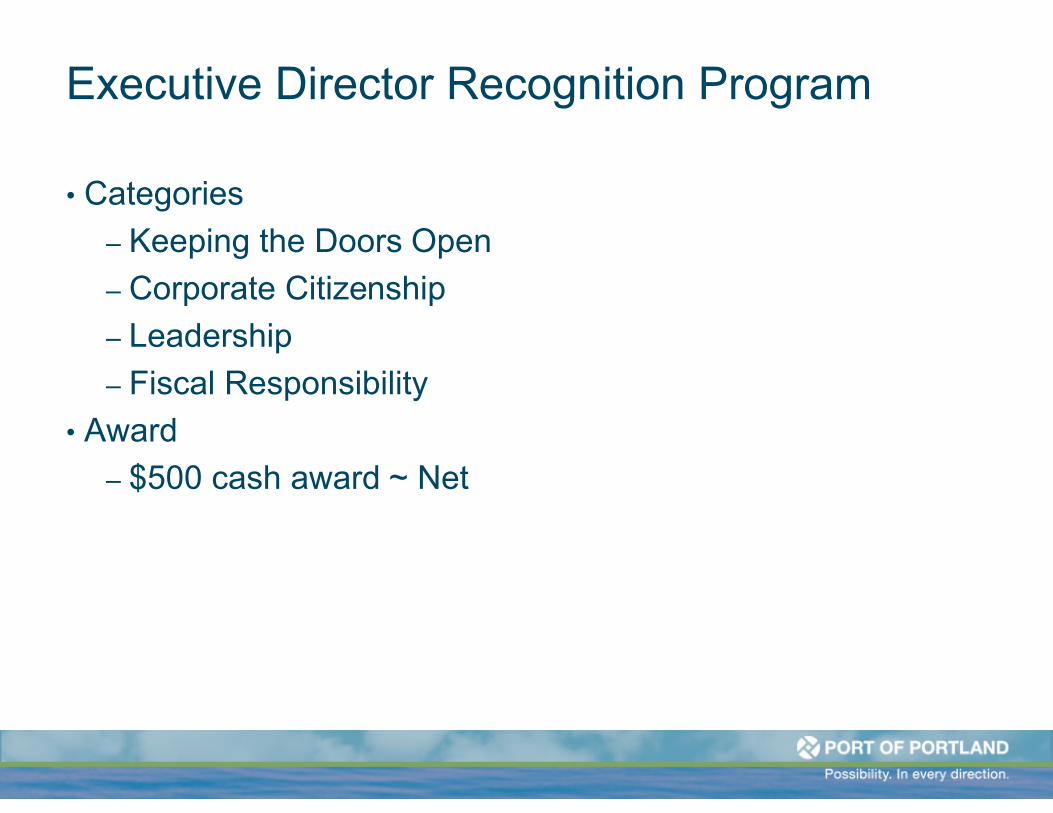
Executive Director Recognition Program
• Categories
– Keeping the Doors Open
– Corporate Citizenship
– Leadership
– Fiscal Responsibility
• Award
– $500 cash award ~ Net
Roles
• Employee
– Positively recognize fellow employees when you see it
• Manager / Supervisor
– Use programs
– Recognize employees with appropriate level of award
– Acknowledge achievement of employees
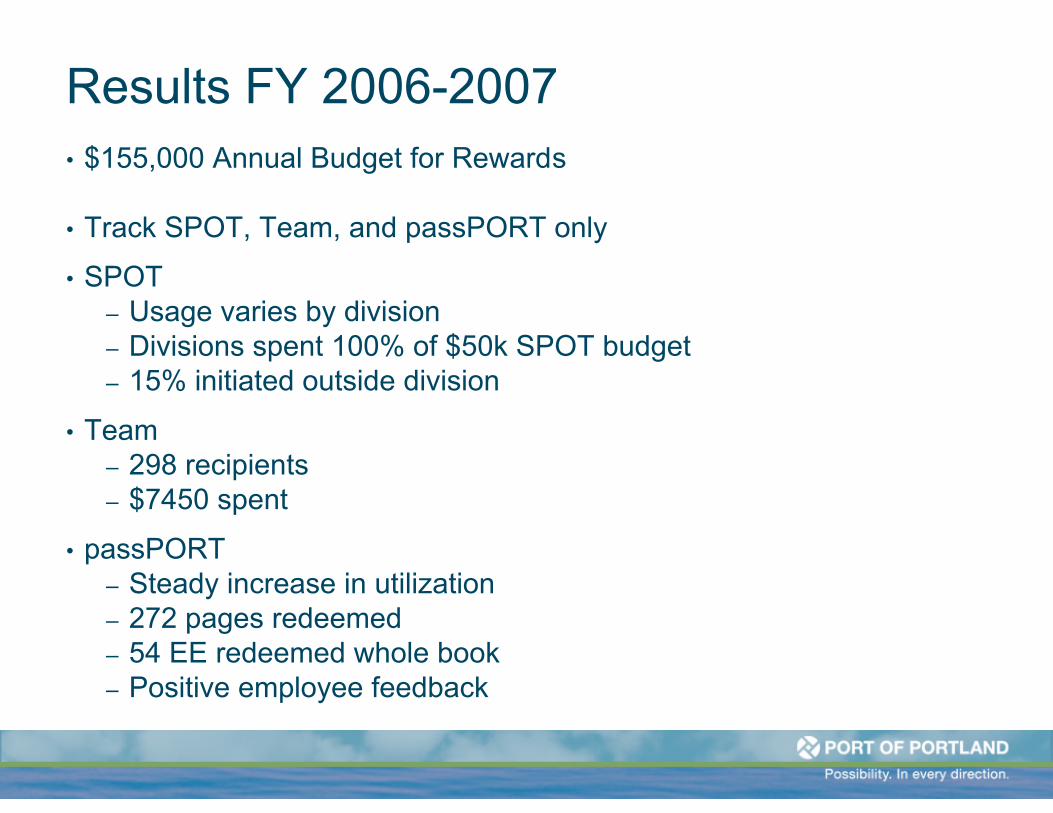
Results FY 2006-2007• $155,000 Annual Budget for Rewards
• Track SPOT, Team, and passPORT only
• SPOT– Usage varies by division– Divisions spent 100% of $50k SPOT budget– 15% initiated outside division
• Team– 298 recipients – $7450 spent
• passPORT– Steady increase in utilization – 272 pages redeemed– 54 EE redeemed whole book– Positive employee feedback
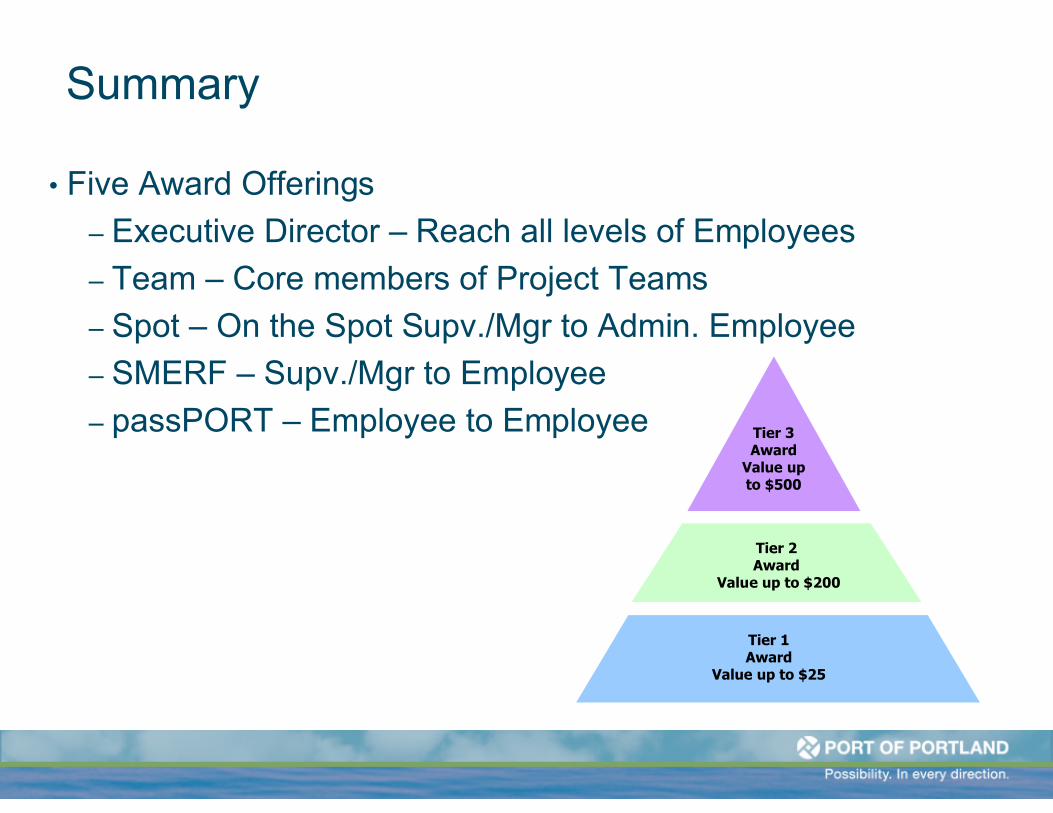
Summary
• Five Award Offerings
– Executive Director – Reach all levels of Employees
– Team – Core members of Project Teams
– Spot – On the Spot Supv./Mgr to Admin. Employee
– SMERF – Supv./Mgr to Employee
– passPORT – Employee to Employee
Tier 2Award
Value up to $200
Tier 1Award
Value up to $25
Tier 3Award
Value upto $500

Q & A