Inbound Logistics Carrier Conference · PDF file5 Logistics Relevancy •We’re often...
26
Wendi Gentry-Stuenkel
Transcript of Inbound Logistics Carrier Conference · PDF file5 Logistics Relevancy •We’re often...

Wendi Gentry-Stuenkel

Automotive Supply Chain- State of the Industry
Minimizing supply chain variability
Managing supply chain variability
Topics
5/25/2016 2
3
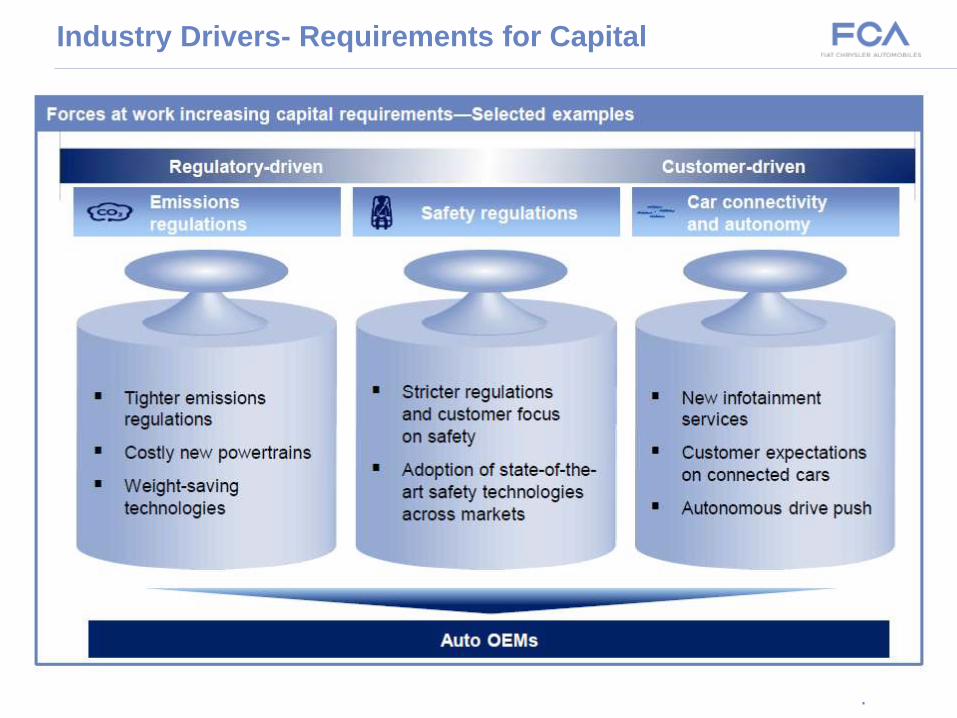
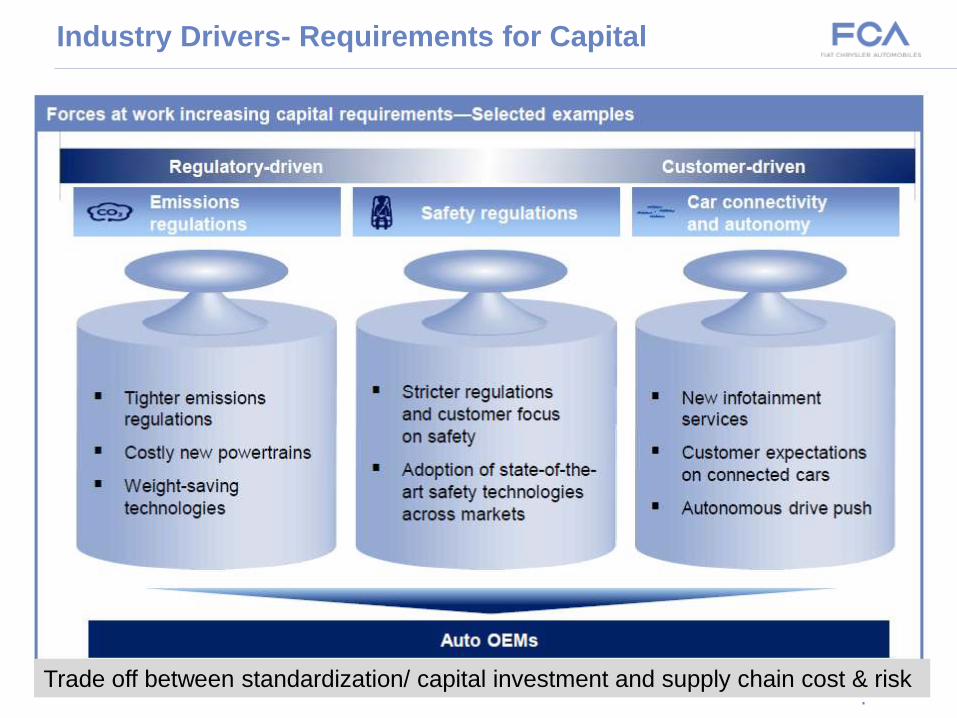
Industry Drivers- Requirements for Capital
3
4
Industry Drivers- Requirements for Capital
4
Trade off between standardization/ capital investment and supply chain cost & risk

5
Logistics Relevancy
• We’re often dealing with the same
– Companies
– Locations
– People
– Capital Equipment
6
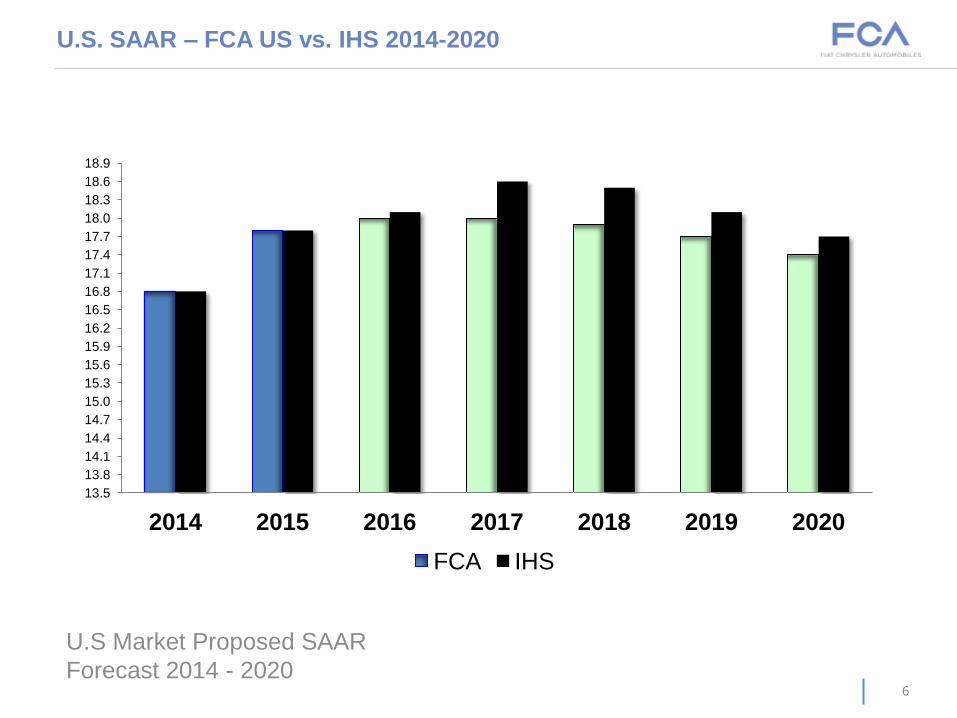
U.S. SAAR – FCA US vs. IHS 2014-2020
U.S Market Proposed SAAR
Forecast 2014 - 2020
13.5
13.8
14.1
14.4
14.7
15.0
15.3
15.6
15.9
16.2
16.5
16.8
17.1
17.4
17.7
18.0
18.3
18.6
18.9
2014 2015 2016 2017 2018 2019 2020
FCA IHS

7
North American Auto Assembly Plants
8
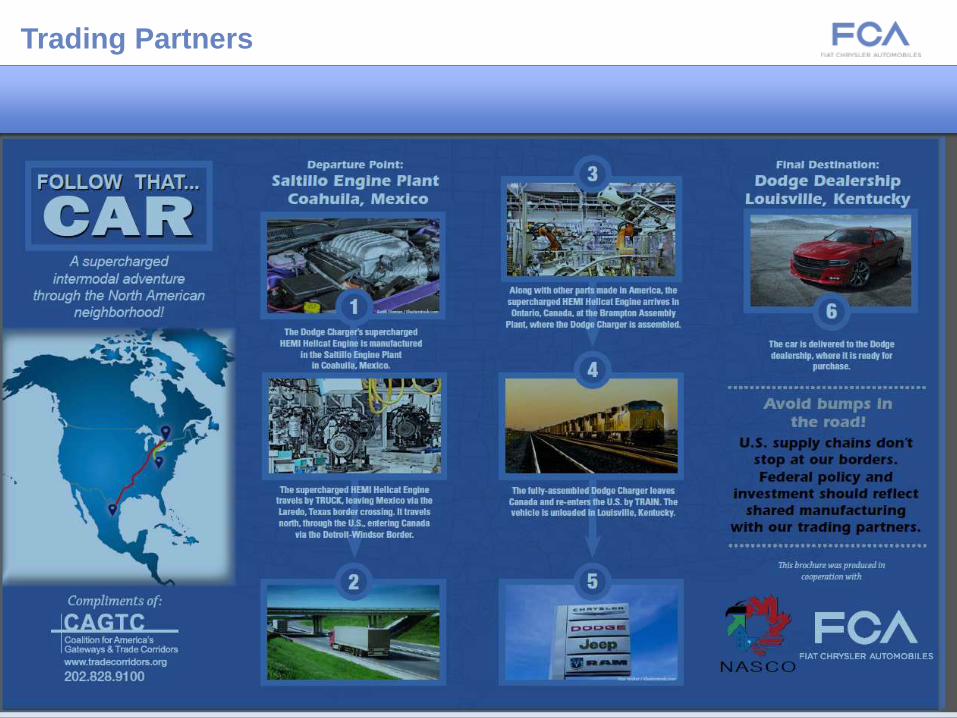
Trading Partners
Trade offs between standardization/ capital investment and supply chain cost/risk

Industry Growth
Vehicle production in Mexico increased from 2.6
million vehicles in 2011 to 3.4 million vehicles in
2015
Mexican automotive and auto parts industries have
received 23.2 billion dollars in new investments since
2013
Mexico is the 7th largest producer of vehicles in the
world and projected to be the 5th largest by 2020
Mexico Logistics
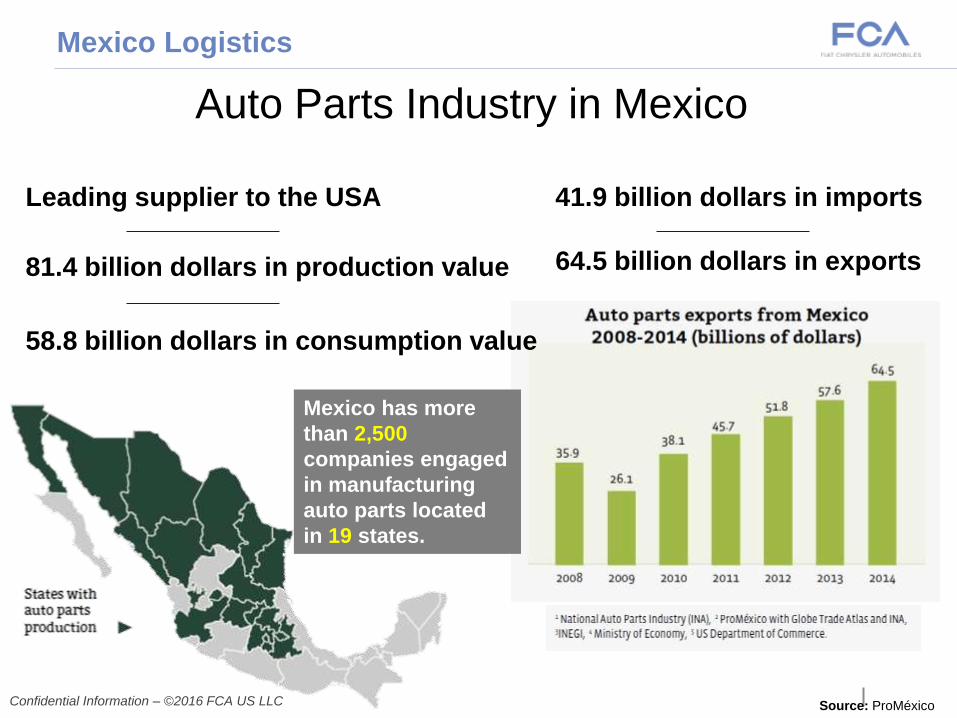
Auto Parts Industry in Mexico
Source: ProMéxico Confidential Information – ©2016 FCA US LLC
Leading supplier to the USA
81.4 billion dollars in production value
58.8 billion dollars in consumption value
41.9 billion dollars in imports
64.5 billion dollars in exports
Mexico has more
than 2,500
companies engaged
in manufacturing
auto parts located
in 19 states.
Mexico Logistics
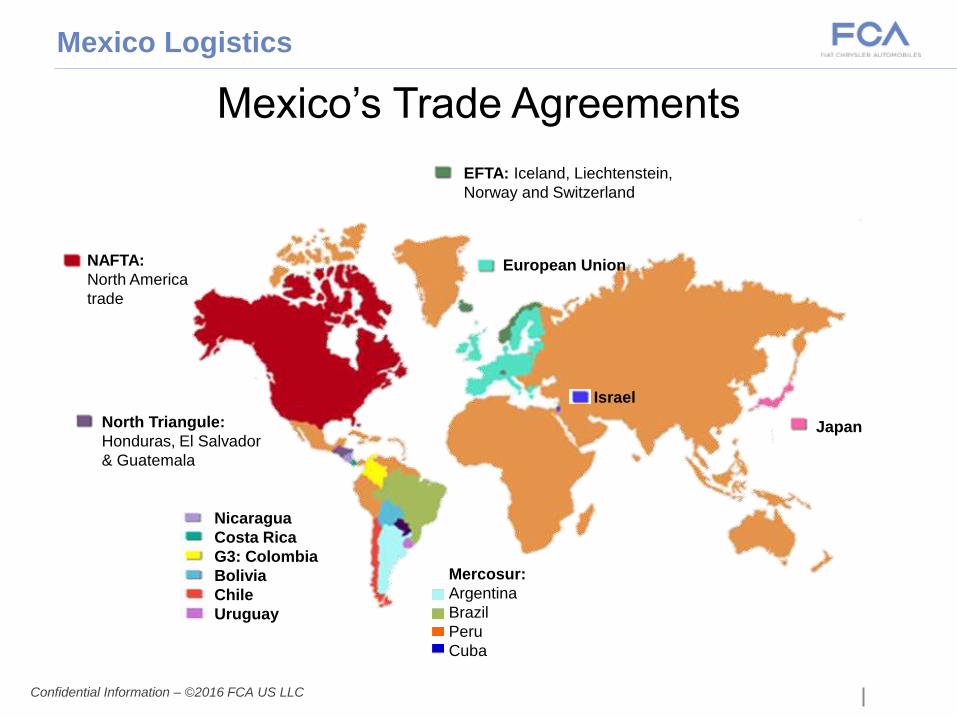
Mexico’s Trade Agreements
NAFTA:
North America
trade
EFTA: Iceland, Liechtenstein,
Norway and Switzerland
European Union
North Triangule:
Honduras, El Salvador
& Guatemala
Nicaragua
Costa Rica
G3: Colombia
Bolivia
Chile
Uruguay
Japan
Israel
Mercosur:
Argentina
Brazil
Peru
Cuba
Confidential Information – ©2016 FCA US LLC
Mexico Logistics

Security
● U.S. C-TPAT, Tier 3 - Customs - Trade Partnership Against Terrorism - Charter
member since 2002
● Canada PIP – Partners in Protection – 2003
● Mexico NEEC – Nuevo Esquema de Empresas Certificadas – January 2013
● Europe AEO – Authorized Economic Operator Security
Compliance
● U.S. – ISA – Importer Self Assessment - 2005
● Canada – PIC – Partners in Compliance – 2004
● Mexico NEEC – Nuevo Esquema de Empresas Certificadas – January 2013
● Europe AEO – Authorized Economic Operator Security
Borders- Minimizing Variability
5/25/2016 12
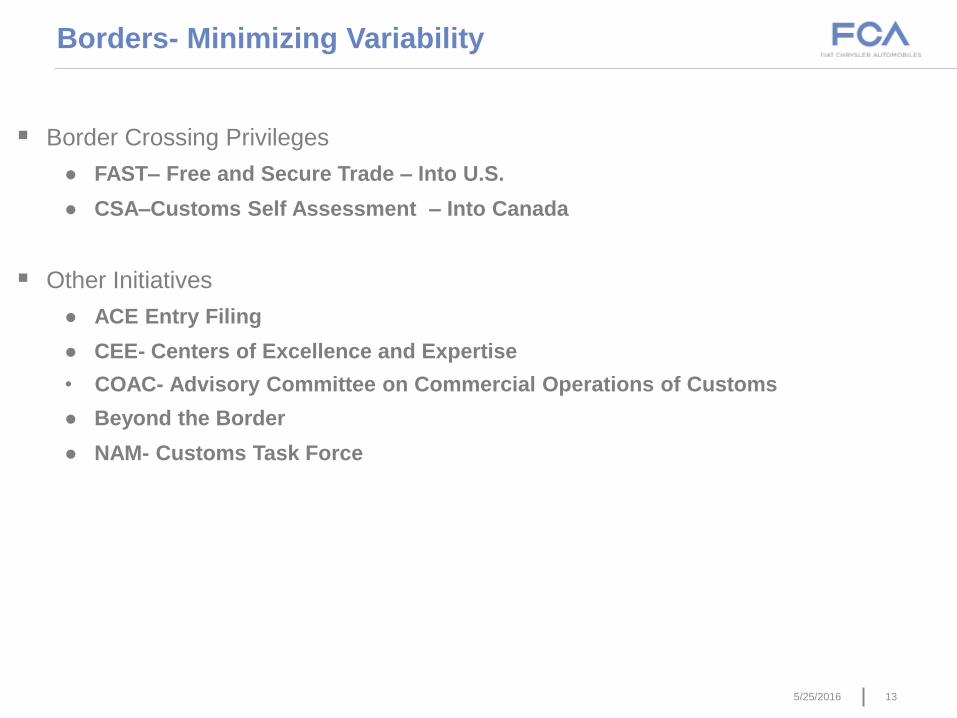
Border Crossing Privileges
● FAST– Free and Secure Trade – Into U.S.
● CSA–Customs Self Assessment – Into Canada
Other Initiatives
● ACE Entry Filing
● CEE- Centers of Excellence and Expertise
• COAC- Advisory Committee on Commercial Operations of Customs
● Beyond the Border
● NAM- Customs Task Force
Borders- Minimizing Variability
5/25/2016 13
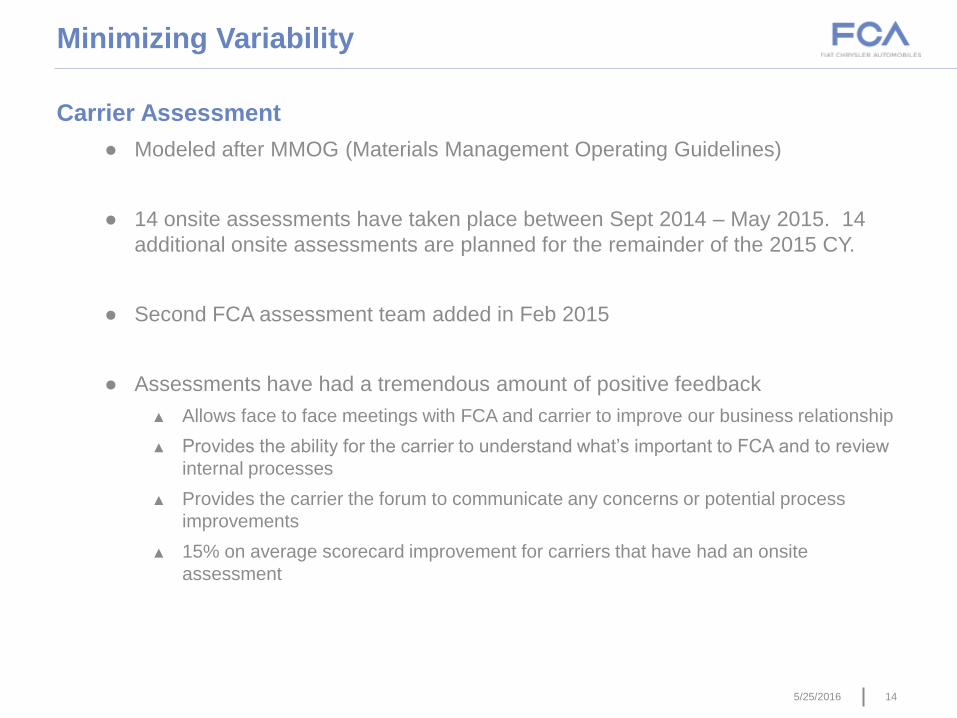
Carrier Assessment
● Modeled after MMOG (Materials Management Operating Guidelines)
● 14 onsite assessments have taken place between Sept 2014 – May 2015. 14
additional onsite assessments are planned for the remainder of the 2015 CY.
● Second FCA assessment team added in Feb 2015
● Assessments have had a tremendous amount of positive feedback
▲ Allows face to face meetings with FCA and carrier to improve our business relationship
▲ Provides the ability for the carrier to understand what’s important to FCA and to review
internal processes
▲ Provides the carrier the forum to communicate any concerns or potential process
improvements
▲ 15% on average scorecard improvement for carriers that have had an onsite
assessment
Minimizing Variability
5/25/2016 14
15
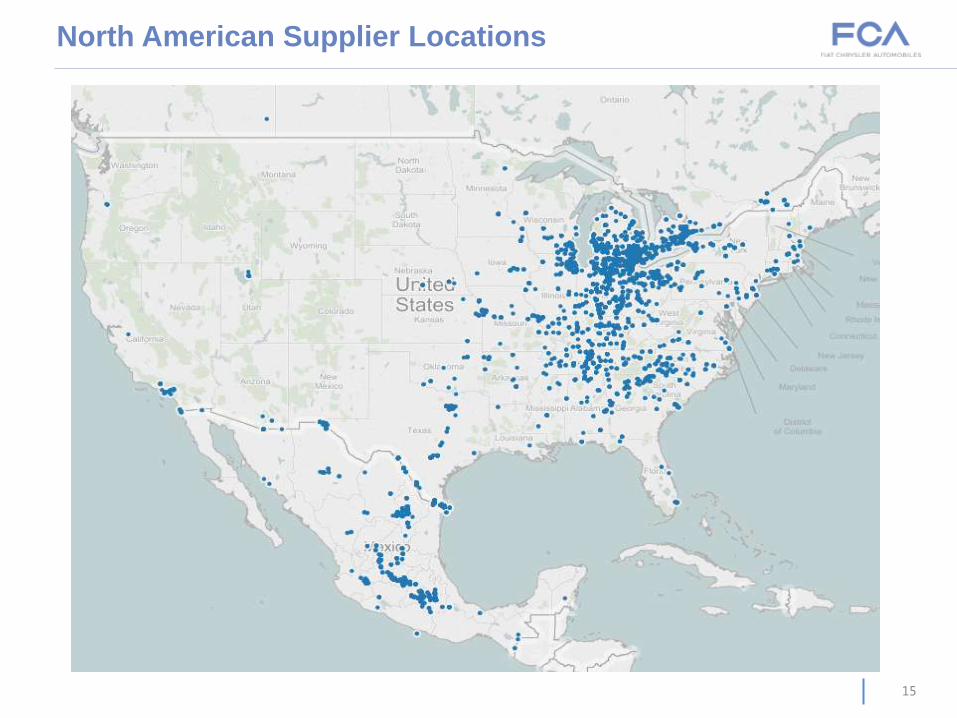
North American Supplier Locations

16
Managing Variability
Increasing variability for resulting cost efficiencies
Increased use of rail/ Intermodal
Partnership in consolidation

17
Pricing Trends

Measuring Performance- Fundamentals
5/25/2016 18
Statistics 101- Mean and Standard Deviation must be tracked

19
Sustainability Report Inbound Transportation Year-over-Year Performance
2013 2014 2015
Truck 226,000,482 280,892,435 264,994,830
Percentage 60% 61% 56%
Rail/ Intermodal 226,000,482 179,193,303 205,978,974
Percentage 40% 39% 44%
Annual Miles
Improved service levels (e.g., decreased variation)
from Railroads and Intermodal Carriers facilitate cost
savings without degradation in customer service
2016 FCA Sustainability Report

Managing Variability
5/25/2016 20
Robust Networks
Strong Partnerships
Variability cannot be eliminated
● Visibility (measurement) improves the ability to manage
● Filtering through the data for meaningful indicators
Managing Variability
5/25/2016 21

Operational exception based reporting
Data analytics for demand planning
Further integrated S&OP processes to drive the business
Enhanced scenario planning
Flexibility
Responsiveness
Managing Variability
5/25/2016 22

23
The Red Queen

Backup

25
Quotes
25
“The line between disorder and order lies in logistics…” - Sun Tzu
“My logisticians are a humorless lot … they know if my campaign
fails, they are the first ones I will slay.” - Alexander the Great
"Gentlemen, the officer who doesn't know his communications and supply
as well as his tactics is totally useless.“ - Gen. George S. Patton, USA

Proprietary and Confidential 2
6