in the Indian River Lagoon Basin Central Indian River Lagoon · Town of Grant-Valkaria - Evans...
124
BASIN MANAGEMENT ACTION PLAN for the Implementation of Total Maximum Daily Loads for Nutrients Adopted by the Florida Department of Environmental Protection in the Indian River Lagoon Basin Central Indian River Lagoon developed by the Central Indian River Lagoon Stakeholders in cooperation with the Florida Department of Environmental Protection Division of Environmental Assessment and Restoration Bureau of Watershed Restoration Tallahassee, FL 32399 January 2013
-
Upload
nguyenthien -
Category
Documents
-
view
214 -
download
0
Transcript of in the Indian River Lagoon Basin Central Indian River Lagoon · Town of Grant-Valkaria - Evans...

BASIN MANAGEMENT ACTION PLAN
for the Implementation of Total Maximum Daily Loads for Nutrients
Adopted by the Florida Department of Environmental Protection
in the
Indian River Lagoon Basin Central Indian River
Lagoon
developed by the Central Indian River Lagoon Stakeholders
in cooperation with the
Florida Department of Environmental Protection Division of Environmental Assessment and Restoration
Bureau of Watershed Restoration Tallahassee, FL 32399
January 2013

FINAL Central Indian River Lagoon Basin Management Action Plan – January 2013
ii
ACKNOWLEDGMENTS: The Central Indian River Lagoon Basin Management Action Plan was prepared as part of a statewide watershed management approach to restore and protect Florida’s water quality. It was developed by the Central Indian River Lagoon stakeholders, identified below, with participation from affected local, regional, and state governmental interests; elected officials and citizens; and private interests.
- = Empty cell
STAKEHOLDERS AGENCIES OTHER INTERESTED PARTIES
Agricultural Producers Florida Department of Agriculture and Consumer Services AECOM
Brevard County Florida Department of Environmental Protection
Algae Collection Technology, Inc.
Indian River County Florida Farm Bureau Federation Applied Technology and Management
St. Lucie County Florida Fruit and Vegetable Association BSE Consultants
City of Fellsmere Indian River Lagoon National Estuary Program Cape Canaveral Scientific, Inc.
City of Fort Pierce St. Johns River Water Management District Carroll and Associates City of Melbourne South Florida Water Management District Carter Associates, Inc. City of Palm Bay - Citizens City of Sebastian - E Sciences, Inc. City of Vero Beach - Eco Sense International City of West Melbourne - England Thims and Miller Town of Grant-Valkaria - Evans Properties Town of Indialantic - Florida Institute of Technology Town of Indian River Shores - Indian Riverkeeper Town of Malabar - Indian River Land Trust Town of Melbourne Beach - ISC Environmental Assurance
Town of Melbourne Village - Jones Edmunds and Associates
Town of Orchid - Marine Resources Council Town of St. Lucie Village - Masteller and Moler, Inc, Florida Department of Transportation District 4 - Pelican Island Audubon
Society Florida Department of Transportation District 5 - SAIC
Turnpike Enterprise - SpecPro Fellsmere Water Control District - Stormwater Solutions, Inc. Fort Pierce Farms Water Control District - Wildwood Consulting, Inc. Indian River Farms Water Control District - - Melbourne-Tillman Water Control District - - Sebastian River Improvement District - - Vero Lakes Water Control District - -

FINAL Central Indian River Lagoon Basin Management Action Plan – January 2013
iii
For additional information on Total Maximum Daily Loads and the watershed management approach in the Central Indian River Lagoon, contact: Mary Paulic, Basin Coordinator Florida Department of Environmental Protection Bureau of Watershed Restoration, Watershed Planning and Coordination Section 2600 Blair Stone Road, Mail Station 3565 Tallahassee, FL 32399-2400 Email: [email protected] Phone: (850) 245–8560

FINAL Central Indian River Lagoon Basin Management Action Plan – January 2013
iv
TABLE OF CONTENTS LIST OF ACRONYMS .................................................................................................... IX EXECUTIVE SUMMARY ............................................................................................... XI CHAPTER 1 : CONTEXT, PURPOSE, AND SCOPE OF THE PLAN ............................ 1
1.1 Water Quality Standards and Total Maximum Daily Loads ............................ 1 1.2 TMDL Implementation ....................................................................................... 4 1.3 The Central Indian River Lagoon Basin Management Action Plan ............... 4
1.3.1 Plan Scope ........................................................................................................ 4 1.3.2 Pollutant Reduction and Discharge Allocations .................................................. 8 1.3.3 TMDLs in the Central Indian River Lagoon Basin .............................................. 8 1.3.4 Seagrass Evaluation .......................................................................................... 9 1.3.5 Stakeholder Involvement ..................................................................................13 1.3.6 Plan Purpose ....................................................................................................14
1.4 Assumptions and Considerations Regarding TMDL Implementation ......... 14 1.4.1 Assumptions .....................................................................................................14 1.4.2 Considerations .................................................................................................15
1.5 Relation of the BMAP to Other Restoration Plans ........................................ 17 1.6 Future Growth in the Basin ............................................................................. 17 1.7 Economic Benefits of the IRL System ........................................................... 18
CHAPTER 2 : CENTRAL INDIAN RIVER LAGOON BASIN SETTING ....................... 19 2.1 Basin Hydrology .............................................................................................. 19 2.2 Land Use Coverage ......................................................................................... 19
CHAPTER 3 : POLLUTANT SOURCES AND ANTICIPATED OUTCOMES ............... 22 3.1 Point Source Facilities .................................................................................... 22 3.2 Municipal Separate Storm Sewer Systems ................................................... 22 3.3 Non-MS4 Stormwater Sources ....................................................................... 23 3.4 Agriculture ....................................................................................................... 24 3.5 Enforcement in Future BMAP Iterations ........................................................ 24
3.5.1 Point Source Facilities ......................................................................................24 3.5.2 MS4s ................................................................................................................25 3.5.3 Non-MS4s ........................................................................................................25 3.5.4 Agriculture ........................................................................................................26
3.6 Anticipated Outcomes of BMAP Implementation ......................................... 26 CHAPTER 4 : MANAGEMENT ACTIONS .................................................................... 27
4.1 Summary of Load Reductions in the Central IRL Subbasin ........................ 27 4.2 NPDES Facilities Projects ............................................................................... 28 4.3 MS4 Projects .................................................................................................... 28
4.3.1 MS4 TN Projects ..............................................................................................28 4.3.2 MS4 TP Projects ..............................................................................................29

FINAL Central Indian River Lagoon Basin Management Action Plan – January 2013
v
4.4 Non-MS4 Urban Stormwater Projects ............................................................ 30 4.4.1 Non-MS4 TN Projects .......................................................................................30 4.4.2 Non-MS4 TP Projects .......................................................................................30
4.5 Provisional BMPs ............................................................................................ 31 4.5.1 Floating Islands ................................................................................................31 4.5.2 Public Education and Outreach ........................................................................31 4.5.3 Muck Removal ..................................................................................................32 4.5.4 Aquatic Vegetation Harvesting .........................................................................33 4.5.5 Water Control Structures ..................................................................................33
4.6 Agriculture ....................................................................................................... 33 4.6.1 Agricultural Producers’ Responsibilities under the FWRA .................................35 4.6.2 Agricultural BMPs .............................................................................................35 4.6.3 FDACS OAWP Role in BMP Implementation and Follow-Up ............................37 4.6.4 FDEP and SJRWMD Roles in BMP Implementation .........................................38 4.6.5 BMP Enrollment Goals and Load Reduction Estimates ....................................38
4.7 Regional Projects ............................................................................................ 41 4.7.1 C-1 Rediversion Project ....................................................................................41 4.7.2 Upper St. Johns River Project and C-54 ...........................................................42
CHAPTER 5 : ASSESSING PROGRESS AND MAKING CHANGES.......................... 43 5.1 Seagrass Target Evaluation ............................................................................ 43 5.2 Tracking Implementation ................................................................................ 43 5.3 Adaptive Management Measures ................................................................... 44 5.4 Seagrass and Water Quality Monitoring ........................................................ 44
5.4.1 Objectives ........................................................................................................44 5.4.2 Monitoring Parameters, Frequency, and Network .............................................45 5.4.3 Data Management and Assessment .................................................................47 5.4.4 Quality Assurance/Quality Control ....................................................................51
5.5 Research Priorities .......................................................................................... 51 CHAPTER 6 : SOUTHERN IRL .................................................................................... 53
6.1 History of Impairments and TMDL Development .......................................... 53 6.2 Considerations................................................................................................. 53 6.3 Southern IRL Subbasin Setting ...................................................................... 55
6.3.1 Land Use Coverage ..........................................................................................55 6.3.2 Pollutant Sources .............................................................................................55
6.4 Management Actions ....................................................................................... 56 6.4.1 Agriculture ........................................................................................................56 6.4.2 Point Source Facility Projects ...........................................................................61 6.4.3 MS4 and Non-MS4 Projects .............................................................................61 6.4.4 Regional Projects .............................................................................................61
6.5 Seagrass and Water Quality Monitoring ........................................................ 61

FINAL Central Indian River Lagoon Basin Management Action Plan – January 2013
vi
CHAPTER 7 : COMMITMENT TO PLAN IMPLEMENTATION .................................... 64 APPENDICES ............................................................................................................... 76
Appendix A: TMDL Basin Rotation Schedule ........................................................ 77 Appendix B: Summary of Statutory Provisions Guiding BMAP
Development and Implementation ................................................................. 78 Appendix C: Summary of the EPA-Recommended Elements of a
Comprehensive Watershed Plan .................................................................... 81 Appendix D: Process To Conduct the Seagrass Depth Limit Compliance
Evaluation ........................................................................................................ 84 Appendix E: Projects To Achieve the TMDL .......................................................... 86 Appendix F: Glossary of Terms ............................................................................ 105 Appendix G: Bibliography of Key References and Websites ............................. 109
LIST OF FIGURES FIGURE 1: CENTRAL IRL SUBBASIN WBIDS ................................................................................. 2 FIGURE 2: STAKEHOLDERS IN THE CENTRAL A PROJECT ZONE ..................................................... 5 FIGURE 3: STAKEHOLDERS IN THE CENTRAL SEB PROJECT ZONE ................................................. 6 FIGURE 4: STAKEHOLDERS IN THE CENTRAL B PROJECT ZONE ..................................................... 7 FIGURE 5: STEP 1 COMPLIANCE EVALUATION FOR THE CENTRAL A PROJECT ZONE FOR
2003–07 .................................................................................................................10 FIGURE 6: STEP 1 COMPLIANCE EVALUATION FOR THE CENTRAL A PROJECT ZONE FOR
2005–09 .................................................................................................................10 FIGURE 7: STEP 1 COMPLIANCE EVALUATION FOR THE CENTRAL SEB PROJECT ZONE FOR
2003–07 .................................................................................................................11 FIGURE 8: STEP 1 COMPLIANCE EVALUATION FOR THE CENTRAL SEB PROJECT ZONE FOR
2005–09 .................................................................................................................11 FIGURE 9: STEP 1 COMPLIANCE EVALUATION FOR THE CENTRAL B PROJECT ZONE FOR
2003–07 .................................................................................................................12 FIGURE 10: STEP 1 COMPLIANCE EVALUATION FOR THE CENTRAL B PROJECT ZONE FOR
2005–09 .................................................................................................................12 FIGURE 11: 2000 LAND USES IN THE CENTRAL IRL SUBBASIN .....................................................21 FIGURE 12: AGRICULTURAL LANDS IN THE CENTRAL IRL SUBBASIN .............................................34 FIGURE 13: BMP ENROLLMENT IN THE CENTRAL IRL SUBBASIN AS OF MARCH 2012 ....................40 FIGURE 14: MONITORING NETWORK IN THE CENTRAL A PROJECT ZONE .......................................48 FIGURE 15: MONITORING NETWORK IN THE CENTRAL SEB PROJECT ZONE ...................................49 FIGURE 16: MONITORING NETWORK IN THE CENTRAL B PROJECT ZONE .......................................50 FIGURE 17: SOUTHERN IRL SUBBASIN ........................................................................................54 FIGURE 18: AGRICULTURAL LAND USE WITHIN THE SOUTHERN IRL SUBBASIN .............................57 FIGURE 19: AGRICULTURAL LAND USE AND INACTIVE CITRUS BLOCKS WITHIN THE
SOUTHERN IRL SUBBASIN .......................................................................................58

FINAL Central Indian River Lagoon Basin Management Action Plan – January 2013
vii
FIGURE 20: OAWP BMP ENROLLMENT AND AGRICULTURAL LAND USES WITHIN THE SOUTHERN IRL SUBBASIN .......................................................................................60
FIGURE 21: MONITORING NETWORK IN THE SOUTHERN IRL ..........................................................63
LIST OF TABLES TABLE ES-1: TMDLS IN THE CENTRAL IRL BASIN ....................................................................... XII TABLE 1: DESIGNATED USE ATTAINMENT CATEGORIES FOR FLORIDA SURFACE WATERS ............... 3 TABLE 2: PHASES OF THE WATERSHED MANAGEMENT CYCLE ....................................................... 3 TABLE 3: TMDLS IN THE CENTRAL IRL SUBBASIN ........................................................................ 9 TABLE 4: STEP 2 COMPLIANCE EVALUATION FOR THE CENTRAL IRL SUBBASIN ............................12 TABLE 5: 2000 LAND USES IN THE CENTRAL IRL SUBBASIN ........................................................20 TABLE 6: NDPES FACILITIES AND ALLOCATIONS IN THE CENTRAL IRL SUBBASIN ........................22 TABLE 7: MS4S IN THE CENTRAL IRL SUBBASIN .........................................................................23 TABLE 8: SUMMARY OF TN AND TP QUANTIFIED REDUCTIONS IN THE CENTRAL IRL
SUBBASIN ...............................................................................................................27 TABLE 9: SUMMARY OF MS4 LOAD REDUCTIONS FOR TN BY PROJECT TYPE IN CENTRAL A ..........28 TABLE 10: SUMMARY OF MS4 LOAD REDUCTIONS FOR TN BY PROJECT TYPE IN CENTRAL
SEB........................................................................................................................29 TABLE 11: SUMMARY OF MS4 LOAD REDUCTIONS FOR TN BY PROJECT TYPE IN CENTRAL B ........29 TABLE 12: SUMMARY OF MS4 LOAD REDUCTIONS FOR TP BY PROJECT TYPE IN CENTRAL A ........29 TABLE 13: SUMMARY OF MS4 LOAD REDUCTIONS FOR TP BY PROJECT TYPE IN CENTRAL
SEB........................................................................................................................29 TABLE 14: SUMMARY OF MS4 LOAD REDUCTIONS FOR TP BY PROJECT TYPE IN CENTRAL B ........30 TABLE 15: SUMMARY OF NON-MS4 LOAD REDUCTIONS FOR TN BY PROJECT TYPE IN
CENTRAL A .............................................................................................................30 TABLE 16: SUMMARY OF NON-MS4 LOAD REDUCTIONS FOR TN BY PROJECT TYPE IN
CENTRAL SEB ........................................................................................................30 TABLE 17: SUMMARY OF NON-MS4 LOAD REDUCTIONS FOR TN BY PROJECT TYPE IN
CENTRAL B .............................................................................................................30 TABLE 18: SUMMARY OF NON-MS4 LOAD REDUCTIONS FOR TP BY PROJECT TYPE IN
CENTRAL A .............................................................................................................31 TABLE 19: SUMMARY OF NON-MS4 LOAD REDUCTIONS FOR TP BY PROJECT TYPE IN
CENTRAL SEB ........................................................................................................31 TABLE 20: SUMMARY OF NON-MS4 LOAD REDUCTIONS FOR TP BY PROJECT TYPE IN
CENTRAL B .............................................................................................................31 TABLE 21: AGRICULTURAL LAND USES IN THE CENTRAL IRL BASED ON 2000 SJRWMD
LAND USE DATA ......................................................................................................33 TABLE 22: AGRICULTURAL ACREAGE, BMP ENROLLMENT, AND FUTURE ENROLLMENT
GOALS FOR THE CENTRAL IRL SUBBASIN .................................................................39 TABLE 23: AGRICULTURAL TN AND TP ESTIMATED REDUCTIONS IN THE FIRST FIVE YEARS ...........41 TABLE 24: MONITORING STATIONS IN THE CENTRAL IRL SUBBASIN ..............................................46 TABLE 25: 2000 LAND USES IN THE SOUTHERN IRL SUBBASIN ....................................................55 TABLE 26: MS4S IN THE SOUTHERN IRL SUBBASIN .....................................................................56

FINAL Central Indian River Lagoon Basin Management Action Plan – January 2013
viii
TABLE 27: AGRICULTURAL LAND USES IN THE SOUTHERN IRL SUBBASIN BASED ON 2008 SFWMD LAND USE DATA ........................................................................................56
TABLE 28: AGRICULTURAL ACREAGE, BMP ENROLLMENT, AND FUTURE ENROLLMENT GOALS FOR THE SOUTHERN IRL SUBBASIN ..............................................................59
TABLE 29: MONITORING STATIONS IN THE SOUTHERN IRL SUBBASIN ...........................................62 TABLE A-1: MAJOR HYDROLOGIC BASINS BY GROUP AND FDEP DISTRICT OFFICE .......................77 TABLE G-1: STORMWATER AND WATER QUALITY PROTECTION WEBSITES .................................. 110

FINAL Central Indian River Lagoon Basin Management Action Plan – January 2013
ix
LIST OF ACRONYMS AWT Advanced Wastewater Treatment BMAP Basin Management Action Plan BMP Best Management Practice BRL Banana River Lagoon CCMP Comprehensive Conservation Management Plan CERP Comprehensive Everglades Restoration Plan DO Dissolved Oxygen DOC Dissolved Organic Carbon EMC Event Mean Concentration EPA U. S. Environmental Protection Agency ERP Environmental Resource Permit F.A.C. Florida Administrative Code FDACS Florida Department of Agriculture and Consumer Services FDEP Florida Department of Environmental Protection FDOT Florida Department of Transportation F.S. Florida Statutes FWRA Florida Watershed Restoration Act FYN Florida Yards and Neighborhoods GIS Geographic Information Systems IRL Indian River Lagoon LA Load Allocation LID Low Impact Development MAPS Managed Aquatic Plant Systems MEP Maximum Extent Practicable MS4 Municipal Separate Storm Sewer System NELAC National Environmental Laboratory Accreditation Council NELAP National Environmental Laboratory Accreditation Program NEP National Estuary Program NOI Notice of Intent NPDES National Pollutant Discharge Elimination System NRCS Natural Resources Conservation Service O&M Operation and Maintenance OAWP Office of Agricultural Water Policy PAR Photosynthetically Active Radiation PLRG Pollutant Load Reduction Goal PLSM Pollutant Load Screening Model POTW Publicly Owned Treatment Works PSA Public Service Announcement RO Reverse Osmosis ROC Runoff Coefficient SFWMD South Florida Water Management District SJRWMD St. Johns River Water Management District SWIM Surface Water Improvement and Management SOP Standard Operating Procedure STORET STOrage and RETrieval (Database) TKN Total Kjeldahl Nitrogen TMDL Total Maximum Daily Load TN Total Nitrogen TOC Total Organic Carbon

FINAL Central Indian River Lagoon Basin Management Action Plan – January 2013
x
TP Total Phosphorus TSS Total Suspended Solids UF–IFAS University of Florida–Institute of Food and Agricultural Sciences USGS U.S. Geological Survey USJR Upper St. Johns River WBID Waterbody Identification WCD Water Control District WLA Wasteload Allocation WMA Water Management Area WTP Water Treatment Plant WWTF Wastewater Treatment Facility

FINAL Central Indian River Lagoon Basin Management Action Plan – January 2013
xi
EXECUTIVE SUMMARY This Basin Management Action Plan (BMAP) represents a long-term plan to restore deeper water seagrass habitats in the Indian River Lagoon (IRL) Basin through the reduction of watershed loadings of total nitrogen (TN) and total phosphorus (TP) (nutrients). In 2011, an algal superbloom occurred in the North IRL and Banana River Lagoon (BRL), with a separate bloom affecting part of the Central IRL. Then, a brown algal bloom affected much of the IRL during 2012. The full impact to seagrasses from these blooms will not be known for a number of years, but there are documented losses of seagrasses in the Central IRL linked to the blooms. Research is under way to understand the causes of these blooms; however, they appear to be due, in part, to legacy loads in the lagoon from past nutrient discharges. Removing the sources of nutrients from the lagoon’s watershed will help remediate the legacy load.
THE CENTRAL INDIAN RIVER LAGOON BASIN The IRL Basin is a 156-mile-long estuary located on Florida’s east coast. There are six coastal Florida counties in the IRL watershed: Volusia, Brevard, Indian River, St. Lucie, Martin, and Palm Beach. The impaired portions of the basin start just south of the Ponce De Leon Inlet in Volusia County and end just north of the Fort Pierce Inlet at the Indian River County–St. Lucie County boundary line. Due to the large geographic extent of the IRL Basin and the hydrologic differences throughout the basin, the Florida Department of Environmental Protection (FDEP) determined the best way to address the Total Maximum Daily Loads (TMDLs) for the IRL Basin was to divide it into three subbasins: (1) Central IRL, (2) North IRL, and (3) BRL. Separate BMAPs were developed for each subbasin; this document focuses solely on the Central IRL subbasin. The main stem of the Central IRL subbasin extends from the Melbourne Causeway in Brevard County to the boundary between Indian River County and St. Lucie County.
In addition to dividing the overall IRL Basin into subbasins, FDEP further divided the Central IRL into “project zones.” The project zone boundaries are based on the distinct hydrology in different areas of the basin and their corresponding annual residence times. These zones are important because the flushing times vary greatly among locations and consequently affect how nutrient reductions will impact these distinct areas. The project zones identify large areas where projects should be implemented to ensure that the load reductions achieve the desired response for each subbasin. The Central IRL subbasin was split into three project zones, as follows:
• Central A – Melbourne Causeway (U.S. Highway 192) to the north tip of Grant Farm Island;
• Central SEB – Grant Farm Island to Wabasso Causeway (County Road 510); and
• Central B – Wabasso Causeway to the boundary between Indian River County and St. Lucie County.
In addition, while developing this Central IRL BMAP, FDEP identified a potential connection with the portion of the IRL located immediately to the south of the Central IRL subbasin. This consists of the portion of the IRL from the northern St. Lucie County boundary south to Fort Pierce Inlet and includes the areas drained by the Fort Pierce Farms Canal network and the C-25 Canal. The stakeholders in this area agreed to be included in the Central IRL BMAP, as projects implemented in the southern IRL will benefit the Central IRL subbasin. FDEP has not yet developed TMDLs for the impaired waterbodies in this area.

FINAL Central Indian River Lagoon Basin Management Action Plan – January 2013
xii
TOTAL MAXIMUM DAILY LOADS TMDLs are water quality targets, based on state water quality standards, for specific pollutants (including nutrients such as nitrogen and phosphorus). FDEP adopted nutrient TMDLs for the main stem of the IRL Basin in March 2009. The TMDLs focus on the water quality conditions necessary for seagrass regrowth at water depth limits where seagrass historically grew in the basin, based on a multiyear composite of seagrass coverage. The median depth limits of seagrass coverage in the IRL Basin have decreased over the years due to decreased water quality resulting from anthropogenic influences. As polluted runoff reaches the lagoon, it creates conditions that prevent the seagrass from growing in deeper water.
To determine the amount of nutrient reductions needed to improve lagoon water quality in each subbasin, the TMDL analysis regressed 3 years of loading levels against the same years’ seagrass coverage to calculate the restoration target of 10% less than the multiyear composite of historical seagrass depth limit coverage. This target is based on 7 years of historical seagrass data from 1943 to 1999 to determine at what depths the deep edge of the seagrass beds previously grew. Since changes in the IRL Basin will likely prevent 100% restoration of seagrass at these depths, the TMDL targets allowed for a 10% reduction in the target seagrass depth. The 10% reduction was selected to be consistent with the water quality criteria in Rule 62-302, Florida Administrative Code (F.A.C.), which allows up to a 10% reduction in the photo-compensation point. This target should result in nutrient reductions that allow seagrass to grow almost to the depths previously seen in the area. Table ES-1 lists the TMDLs and pollutant load allocations adopted by rule for the Central IRL.
TABLE ES-1: TMDLS IN THE CENTRAL INDIAN RIVER LAGOON BASIN
WBID NUMBER WBID NAME PARAMETER TMDL
(LBS/YR)
WASTEWATER FACILITIES
ALLOCATION (LBS/YR)
STORMWATER ALLOCATION
(LBS/YR)
ATMOSPHERIC DEPOSITION ALLOCATION
(LBS/YR)
5003D+2963A South Indian River + Indian River Above
Sebastian Inlet TN 684,715 831 577,184 106,700
5003B+5003C South Indian River TN 278,273 25,391 217,876 35,006 TN Total Central IRL TN Total TN 962,988 26,222 795,060 141,706
5003D+2963A South Indian River + Indian River Above
Sebastian Inlet TP 111,594 122 110,187 1,285
5003B+5003C South Indian River TP 53,599 1,949 50,857 793 TP Total Central IRL TP Total TP 165,193 2,071 161,044 2,078
THE CENTRAL INDIAN RIVER LAGOON BASIN MANAGEMENT ACTION PLAN The intent of the TMDLs is to recover the deeper water seagrass habitats, with the biological response of the seagrass being the most important factor in evaluating the success of achieving TMDL targets. To assess progress in the IRL Basin towards the median seagrass depth limit target, a two-step process was used. FDEP conducted this two-step evaluation using seagrass data from 2003, 2005, 2006, 2007, and 2009, which were the latest datasets available at the time of the analysis. For the Central IRL, all three project zones were determined to be both Step 1 and Step 2 compliant. Therefore, stakeholders in the Central IRL were not required to make additional reductions at this time and were not assigned allocations in this first iteration of the BMAP. This BMAP covers a five-year period, and the purpose of the first iteration is to document the completed projects that contributed to the seagrass recovery and to identify projects that will occur in the future to continue seagrass improvement

FINAL Central Indian River Lagoon Basin Management Action Plan – January 2013
xiii
Further evaluations of the seagrass depth limits in the Central IRL will be conducted to ensure that this area continues to meet the TMDL targets. In Year 4 of the BMAP, FDEP will use the 2007, 2009, 2011, and 2013 seagrass mapping data, which will likely be the latest datasets available at that time, to reassess whether the Central IRL project zones continue to be compliant. If the project zones continue to meet the TMDL depth limit targets, there will be 7 mapping years or 11 calendar years (2003–13) indicating a trend of success. If during this assessment any of the project zones are no longer Step 1 and Step 2 compliant, FDEP will ask stakeholders in that project zone or zones to make nutrient reductions in the second iteration of the BMAP process.
MANAGEMENT ACTIONS AND BMAP ENFORCEMENT The stakeholders provided information on projects completed in the basin since 2000 and planned for the first 5-year BMAP iteration. Documenting these load reductions will further the understanding of how compliance was achieved and will be maintained. However, since additional reductions are not required in this BMAP iteration, any future projects submitted are not a requirement of the BMAP. These future projects will help to continue to improve water quality in the lagoon, which should in turn allow seagrass to grow to deeper depths to maintain compliance with the TMDL seagrass depth limit targets. Credit for submitted projects will be applied toward reductions in the next BMAP iteration, if any Central IRL project zone were no longer achieving the seagrass depth limit targets. If reductions were required, the projects conducted during this first BMAP iteration would count for reduction credit for 10 years from the adoption of this Central IRL BMAP.
If reductions are required in future BMAP iterations, FDEP does have enforcement mechanisms to ensure that the BMAP required reductions are achieved. For point sources, both wastewater treatment facilities (WWTFs) and municipal separate storm sewer systems (MS4s), the BMAP required reductions are enforceable through the National Pollutant Discharge Elimination System (NPDES) permits. For non-MS4s, the BMAP requirements are enforceable through the BMAP itself, and FDEP also has the option to designate a non-MS4 as a Phase II MS4 to ensure that the reductions occur. For agricultural sources, applicable best management practices (BMPs) must be implemented, or water quality monitoring must occur to demonstrate that the property is not having an impact on water quality.
ECONOMIC BENEFITS OF THE IRL SYSTEM The IRL is a valuable ecological and economic asset for the state of Florida and the counties that border the lagoon and its tributaries. It is considered the most biologically diverse estuary in North America and was recognized as part of the National Estuary Program (NEP) in 1990. The lagoon directly and indirectly supports a large part of the region’s and the state’s economy. A significant increase in the amount and diversity of wildlife on the lagoon and improved water quality in the entire IRL Basin would increase recreational use value by about $80 million per year. The economic value of the entire IRL Basin’s seagrass beds was estimated as $329 million per year for 72,400 acres of seagrass. Therefore, investing in projects and programs to improve the lagoon’s water quality and seagrass beds is not only important for environmental considerations but also to improve the economy.
KEY ELEMENTS OF THE BMAP This BMAP addresses key elements required by the Florida Watershed Restoration Act (FWRA), Chapter 403.067, F.S., including the following:
• Document how the public and other stakeholders were encouraged to participate or participated in developing the BMAP (Section 1.3.5);

FINAL Central Indian River Lagoon Basin Management Action Plan – January 2013
xiv
• Identify the mechanisms by which potential future increases in pollutant loading will be addressed (Section 1.5);
• Document management actions/projects to achieve the TMDLs (Chapter 4 and Appendix E);
• Document the implementation schedule, funding, responsibilities, and milestones (Appendix E); and
• Identify monitoring, evaluation, and a reporting strategy to evaluate reasonable progress over time (Section 5.3).
BMAP COSTS Costs were provided for 27.3% of the activities identified in the BMAP, with an estimated total cost of more than $41.8 million. Annual operation and maintenance (O&M) costs were also provided for 11.6% of the projects, for a total of $621,795. In addition, costs were provided for 39.1% of the projects in the southern IRL, with an estimated total cost of almost $16.0 million. It is important to note that many of the BMAP projects were built to achieve multiple objectives, not just nutrient reduction; therefore, this should be a consideration when estimating the cost per pound of nutrient removal from these projects. The funding sources range from local contributions to legislative appropriations. Stakeholders will continue to explore new sources of funding to ensure that the activities listed in this BMAP can be achieved at the necessary level of effort.
BMAP FOLLOW-UP FDEP will work with the stakeholders to monitor trends in seagrass distribution and water quality, as well as track project implementation. The results will be used to evaluate compliance with the seagrass depth limit targets. The technical stakeholders will meet at least every 12 months after BMAP adoption to follow up on plan implementation, share new information, and continue to coordinate on TMDL-related issues.
COMMITMENT TO BMAP IMPLEMENTATION The stakeholders have committed to implementing the projects and activities included in this BMAP. The entities are also providing to FDEP, as needed, letters of commitment or resolutions of support to ensure that as staff and board members change over time, the entity has documentation of its support for the BMAP and associated efforts.

FINAL Central Indian River Lagoon Basin Management Action Plan – January 2013
1
CHAPTER 1: CONTEXT, PURPOSE, AND SCOPE OF THE PLAN The Indian River Lagoon (IRL) system is a nationally renowned estuary that supports both remarkable biological diversity and recreational resources. However, the seagrass beds in the lagoon system have been impacted over time by the loss of wetlands, excessive freshwater discharges, and discharges of pollutants through stormwater and wastewater (Florida Department of Environmental Protection [FDEP] 2009). To address nutrient impacts to the seagrass beds, FDEP adopted Total Maximum Daily Loads (TMDLs) to reduce the watershed nutrient inputs to the lagoon. This Basin Management Action Plan (BMAP) focuses on the Central IRL subbasin, which extends from the Melbourne Causeway (U.S. Highway 192) to the boundary between Indian River County and St. Lucie County.
In addition, while developing this Central IRL BMAP, FDEP identified a potential connection with the portion of the IRL located immediately to the south of the Central IRL subbasin extending to the Fort Pierce Inlet. The stakeholders in this area agreed to be included in the Central IRL BMAP, as projects implemented in the southern IRL will benefit the Central IRL subbasin. Chapter 6 includes additional information about this area.
This BMAP represents a long-term plan to restore deeper water seagrass habitats in the IRL Basin through the reduction of watershed loadings of total nitrogen (TN) and total phosphorus (TP) (nutrients). In 2011, an algal superbloom occurred in the North IRL and Banana River Lagoon (BRL), with a separate bloom affecting part of the Central IRL. Then, a brown algal bloom affected much of the IRL during 2012. The full impact to seagrasses from these blooms will not be known for a number of years, but there are documented losses of seagrasses in the Central IRL linked to the blooms. Research is under way to understand the causes of the blooms; however, they appear to be due, in part, to legacy loads in the lagoon from past nutrient discharges. Removing the sources of nutrients from the lagoon’s watershed will help address the legacy loads.
This BMAP represents the joint efforts of multiple stakeholders to prepare a restoration plan for the Central IRL to ensure that seagrass coverage at deeper water depths is maintained. This BMAP includes projects that reduce watershed nutrient loading to the lagoon to improve seagrass extent, and a monitoring plan to guide effective long-term restoration efforts. The BMAP was developed as part of FDEP’s TMDL Program.
Stakeholder involvement is critical to the success of the entire TMDL Program. It is particularly essential to develop, gain support for, and secure commitments in a BMAP. FDEP invited all interested stakeholders to participate in the Central IRL BMAP development and facilitated participation to ensure that all voices were heard and opinions considered. This approach resulted in a BMAP that outlines how progress towards the seagrass restoration targets was achieved and how stakeholders plan to continue that improvement.
This chapter describes the TMDL Program, the BMAP scope, TMDLs addressed, the seagrass evaluation process, and stakeholder involvement in BMAP development.
1.1 WATER QUALITY STANDARDS AND TOTAL MAXIMUM DAILY LOADS Florida's water quality standards are designed to ensure that surface waters can be used for their designated purposes, such as drinking water, recreation, and shellfish harvesting. For assessment purposes, FDEP divided the Central IRL subbasin into water assessment polygons with a unique waterbody identification (WBID) number for each watershed or segment. Figure 1 shows the Central IRL main stem WBIDs discussed in this BMAP.

FINAL Central Indian River Lagoon Basin Management Action Plan – January 2013
2
FIGURE 1: CENTRAL IRL SUBBASIN WBIDS

FINAL Central Indian River Lagoon Basin Management Action Plan – January 2013
3
In the Central IRL, WBIDs 2963A, 5003B, and 5003D are categorized as Class II waters, which have a designated use of shellfish propagation or harvesting. WBID 5003C is categorized as Class III waters, meaning that it must be suitable for recreation and must support the propagation and maintenance of a healthy, well-balanced population of fish and wildlife. Table 1 shows other designated use categories.
TABLE 1: DESIGNATED USE ATTAINMENT CATEGORIES FOR FLORIDA SURFACE WATERS * Class I and II waters include the uses of the classifications listed below them. ** Surface water classification for waters in the IRL Basin.
CATEGORY DESCRIPTION Class I* Potable water supplies
Class II** Shellfish propagation or harvesting
Class III** Recreation, propagation, and maintenance of a healthy, well-balanced population of fish and wildlife
Class IV Agricultural water supplies
Class V Navigation, utility, and industrial use (no current Class V designations)
Under Section 303(d) of the federal Clean Water Act, every two years each state must identify its “impaired” waters, including estuaries, lakes, rivers, and streams, that do not meet their designated uses and are not expected to meet applicable water quality standards within the subsequent two years. FDEP is responsible for developing this “303(d) list” of impaired waters.
Florida's 303(d) list identifies hundreds of waterbody segments that fall short of water quality standards. The three most common water quality concerns are coliforms, nutrients, and oxygen-demanding substances. The listed waterbody segments are candidates for more detailed assessments of water quality to determine whether they are impaired according to state statutory and rule criteria. FDEP develops and adopts TMDLs for the waterbody segments it identifies as impaired. A TMDL is the maximum amount of a specific pollutant that a waterbody can assimilate while maintaining its designated uses.
The water quality evaluation and decision-making processes for listing impaired waters and establishing TMDLs are authorized by Section 403.067, Florida Statutes (F.S.), known as the Florida Watershed Restoration Act (FWRA), and contained in Florida’s Identification of Impaired Surface Waters Rule, Rule 62-303, Florida Administrative Code (F.A.C.). TMDLs have been established for these waters, identifying the amount of TN and TP they can receive and still maintain Class III designated uses.
TMDLs are developed and implemented as part of a watershed management cycle that rotates through the state’s 52 river basins every 5 years (see Appendix A) to evaluate waters, determine impairments, and develop and implement management strategies to restore impaired waters to their designated uses. Table 2 summarizes the five phases of the watershed management cycle.
TABLE 2: PHASES OF THE WATERSHED MANAGEMENT CYCLE PHASE ACTIVITY
Phase 1 Preliminary evaluation of water quality
Phase 2 Strategic monitoring and assessment to verify water quality impairments Phase 3 Development and adoption of TMDL(s) for waters verified as impaired Phase 4 Development of management strategies to achieve the TMDL(s) Phase 5 Implementation of TMDL(s), including monitoring and assessment

FINAL Central Indian River Lagoon Basin Management Action Plan – January 2013
4
1.2 TMDL IMPLEMENTATION TMDLs may be implemented through BMAPs, which contain strategies to reduce and prevent pollutant discharges through various cost-effective means. During Phase 4 of the TMDL process, FDEP and the affected stakeholders in the various basins jointly develop BMAPs or other implementation approaches. A basin may have more than one BMAP, based on practical considerations, such as hydrologic connections and stakeholder involvement. The FWRA contains provisions that guide the development of BMAPs and other TMDL implementation approaches. Appendix B summarizes the statutory provisions related to BMAP development.
Stakeholder involvement is critical to the success of the TMDL Program, and varies with each phase of implementation to achieve different purposes. The BMAP development process is structured to achieve cooperation and consensus among a broad range of interested parties. Under statute, FDEP invites stakeholders to participate in the BMAP development process and encourages public participation to the greatest extent practicable. FDEP must hold at least one noticed public meeting in the basin to discuss and receive comments during the planning process. Stakeholder involvement is essential to develop, gain support for, and secure commitments to implement the BMAP.
1.3 THE CENTRAL INDIAN RIVER LAGOON BASIN MANAGEMENT ACTION PLAN
1.3.1 PLAN SCOPE FDEP adopted nutrient TMDLs for the main stems of the IRL and the BRL in 2009. TMDLs are based on allowable nutrient loadings from the watershed that will not cause water quality impairments in the lagoon. Due to the large geographic extent of the IRL Basin and the hydrologic differences throughout the basin, FDEP determined the best way to address the TMDLs was to divide the watershed into three subbasins: (1) Central IRL, (2) North IRL, and (3) BRL. Separate BMAPs were developed for each subbasin; this document focuses solely on the Central IRL subbasin. The main stem of the Central IRL subbasin extends from the Melbourne Causeway to the boundary between Indian River County and St. Lucie County.
In addition to dividing the overall IRL Basin into subbasins, FDEP further divided the Central IRL into “project zones.” The project zone boundaries are based on the distinct hydrology in different areas of the basin and their corresponding annual residence times. These zones are important because the flushing times vary greatly among locations and consequently affect how nutrient reductions will impact these distinct areas. The project zones identify large areas where projects should be implemented to ensure that the load reductions achieve the desired response for each subbasin. The Central IRL subbasin was split into three project zones, as follows:
• Central A – Melbourne Causeway (U.S. Highway 192) to the north tip of Grant Farm Island;
• Central SEB – Grant Farm Island to Wabasso Causeway (County Road 510); and
• Central B – Wabasso Causeway to the boundary between Indian River County and St. Lucie County.
Figure 2 through Figure 4, respectively, show the stakeholders in each of these project zones.

FINAL Central Indian River Lagoon Basin Management Action Plan – January 2013
5
FIGURE 2: STAKEHOLDERS IN THE CENTRAL A PROJECT ZONE

FINAL Central Indian River Lagoon Basin Management Action Plan – January 2013
6
FIGURE 3: STAKEHOLDERS IN THE CENTRAL SEB PROJECT ZONE

FINAL Central Indian River Lagoon Basin Management Action Plan – January 2013
7
FIGURE 4: STAKEHOLDERS IN THE CENTRAL B PROJECT ZONE

FINAL Central Indian River Lagoon Basin Management Action Plan – January 2013
8
This BMAP includes a portion of the southern IRL extending to the Fort Pierce Inlet, as well as the drainage areas for the Fort Pierce Farms Canal and C-25 Canal. Chapter 6 provides additional information about this area.
1.3.2 POLLUTANT REDUCTION AND DISCHARGE ALLOCATIONS
1.3.2.1 Categories for Rule Allocations The rules adopting TMDLs must establish reasonable and equitable allocations that will alone, or in conjunction with other management and restoration activities, attain the TMDL. Allocations may be to individual sources, source categories, or basins that discharge to the impaired waterbody. The allocations in rule identify either how much pollutant discharge in pounds per year (lbs/yr) each source designation may continue to contribute (discharge allocation), or the lbs/yr or percent of its loading the source designation must reduce (reduction allocation). Currently, the TMDL allocation categories are as follows:
• Wasteload Allocation (WLA) is the allocation to point sources permitted under the National Pollutant Discharge Elimination System (NPDES) Program. It includes the following: o Wastewater Allocation is the discharge allocation to industrial and domestic
wastewater facilities.
o NPDES Stormwater Allocation is the allocation to NPDES stormwater permittees that operate municipal separate storm sewer systems (MS4s). These permittees are treated as point sources under the TMDL Program.
• Load Allocation (LA) is the allocation to nonpoint sources, including agricultural runoff and stormwater from areas that are not included in an MS4 permit.
1.3.2.2 Initial and Detailed Allocations Under the FWRA, the TMDL allocation adopted in rule may be an “initial” allocation among point and nonpoint sources. In such cases, the “detailed” allocation to specific point sources and specific categories of nonpoint sources must be established in the BMAP. The FWRA further states that the BMAP may make detailed allocations to individual “basins” (i.e., subbasins), or to all basins as a whole, as appropriate. Both initial and detailed allocations must be determined based on a number of factors listed in the FWRA, including cost-benefit, technical and environmental feasibility, implementation time frames, and others (see Appendix B).
1.3.3 TMDLS IN THE CENTRAL INDIAN RIVER LAGOON BASIN FDEP adopted the nutrient TMDLs for the main stem of the IRL Basin in March 2009. The TMDLs focus on the water quality conditions necessary for seagrass regrowth at depth limits where seagrass historically grew in the basin, based on a multiyear composite of seagrass coverage. The median depth limits of seagrass coverage in the IRL Basin decreased over the years due to decreased water quality resulting from anthropogenic influences. As polluted runoff reached the lagoon, it created conditions that prevented the seagrass from growing in deeper water.
To determine the amount of nutrient reductions needed to improve lagoon water quality in each subbasin, the TMDL analysis regressed loading estimates for nonpoint and point sources and data for seagrass depth limits for years with all available data. Years that met data requirements were 1943, 1996, 1999, and 2011. Target nutrient loadings were established by substituting a median depth limit target that was 10% less than the seagrass restoration depth

FINAL Central Indian River Lagoon Basin Management Action Plan – January 2013
9
into the established regression equations. This median depth target limit is based on 7 years of historical seagrass data from 1943 to 1999 to determine at what depths the deep edge of the seagrass beds previously grew.
Since changes in the IRL Basin will likely prevent 100% restoration of seagrass at these depths, the TMDL targets allowed for a 10% reduction in the target seagrass depth. The 10% reduction in target depths was selected to be consistent with the water quality criteria in Rule 62-302, F.A.C., which allows up to a 10% reduction in the photo-compensation point. This target should result in nutrient reductions that allow seagrass to grow almost to the depths previously seen in the area. Table 3 lists the TMDLs and pollutant load allocations adopted by rule for the Central IRL subbasin.
TABLE 3: TMDLS IN THE CENTRAL IRL SUBBASIN
WBID NUMBER WBID NAME PARAMETER TMDL
(LBS/YR)
WASTEWATER FACILITIES
ALLOCATION (LBS/YR)
STORMWATER ALLOCATION
(LBS/YR)
ATMOSPHERIC DEPOSITION ALLOCATION
(LBS/YR)
5003D+2963A
South Indian River + Indian River Above Sebastian Inlet TN 684,715 831 577,184 106,700
5003B+5003C South Indian River TN 278,273 25,391 217,876 35,006 TN Total Central IRL TN Total TN 962,988 26,222 795,060 141,706
5003D+2963A
South Indian River + Indian River Above Sebastian Inlet TP 111,594 122 110,187 1,285
5003B+5003C South Indian River TP 53,599 1,949 50,857 793 TP Total Central IRL TP Total TP 165,193 2,071 161,044 2,078
1.3.4 SEAGRASS EVALUATION The goal of the TMDLs is to recover the deeper seagrass habitats, with the biological response of the seagrass being the most important factor in evaluating the success of achieving TMDL targets. To assess progress for the IRL Basin towards the median seagrass depth limit target, a two-step process was used.
Step 1 in this process is a cumulative frequency distribution analysis. The 4 most recent mapped seagrass datasets from the St. Johns River Water Management District (SJRWMD) for each project zone are used to create a union coverage of the assessment years using a Geographic Information System (GIS). A 15.8-meter buffer zone is applied to the perimeter of the union coverage to establish the deep edge of the seagrass beds. This buffer coverage shows the deepest edge where seagrass grew at any time during the data period, and is used to create a cumulative frequency distribution curve of the depth at which seagrass exist within each project zone. This curve is then compared with the union coverage TMDL depth limit target curve. Successful seagrass compliance in Step 1 is achieved when at least 50% or more of the assessment years’ frequency distribution curve (including its 50th percentile value) lies on or to the right of the TMDL depth limit target curve.
Step 2 is conducted by calculating the median depth of seagrass growth for each year of the four most recent datasets, and then each year’s median is compared with the TMDL median depth limit target. Three of the four medians of the assessment years for a project zone must meet or exceed the median TMDL depth limit target to be Step 2 compliant. If the project zone is both Step 1 and Step 2 compliant, it is considered to be meeting the TMDL seagrass depth limit target. If the project zone fails to meet either Step 1 or Step 2, then it is not considered to

FINAL Central Indian River Lagoon Basin Management Action Plan – January 2013
10
be meeting the TMDL seagrass depth limit target for that set of assessment years. Appendix D provides additional details about the seagrass evaluation process.
FDEP conducted this two-step evaluation process using the 2003, 2005, 2006, 2007, and 2009 mapping years, which were the latest datasets available at the time of the analysis. All three Central IRL project zones were determined to be both Step 1 (Figure 5 through Figure 10) and Step 2 compliant (Table 4) for the periods 2003–07 and 2005–09. Therefore, stakeholders in the Central IRL were not required to make additional reductions at this time and were not assigned allocations in this first iteration of the BMAP.
0.0%
10.0%
20.0%
30.0%
40.0%
50.0%
60.0%
70.0%
80.0%
90.0%
100.0%
0.00 0.50 1.00 1.50 2.00 2.50 3.00 3.50
Cum
ulat
ive
Freq
uenc
y
Depth (meters)
TMDL Target 2003-2007 Central A
FIGURE 5: STEP 1 COMPLIANCE EVALUATION FOR THE CENTRAL A PROJECT ZONE FOR 2003–07
0.0%
10.0%
20.0%
30.0%
40.0%
50.0%
60.0%
70.0%
80.0%
90.0%
100.0%
0 0.5 1 1.5 2 2.5 3 3.5 4
Cum
ulat
ive
Freq
uenc
y
Depth (meters)
TMDL Target 2005-2009 Central A
FIGURE 6: STEP 1 COMPLIANCE EVALUATION FOR THE CENTRAL A PROJECT ZONE FOR 2005–09

FINAL Central Indian River Lagoon Basin Management Action Plan – January 2013
11
0.0%
10.0%
20.0%
30.0%
40.0%
50.0%
60.0%
70.0%
80.0%
90.0%
100.0%
0 0.5 1 1.5 2 2.5 3
Cum
ulat
ive
Freq
uenc
y
Depth (meters)
TMDL Target 2003-2007 Central SEB
FIGURE 7: STEP 1 COMPLIANCE EVALUATION FOR THE CENTRAL SEB PROJECT ZONE FOR 2003–07
0.0%
10.0%
20.0%
30.0%
40.0%
50.0%
60.0%
70.0%
80.0%
90.0%
100.0%
0 0.5 1 1.5 2 2.5 3
Cum
ulat
ive
Freq
uenc
y
Depth (meters)
TMDL Target 2005-2009 Central SEB
FIGURE 8: STEP 1 COMPLIANCE EVALUATION FOR THE CENTRAL SEB PROJECT ZONE FOR 2005–09

FINAL Central Indian River Lagoon Basin Management Action Plan – January 2013
12
0.0%
10.0%
20.0%
30.0%
40.0%
50.0%
60.0%
70.0%
80.0%
90.0%
100.0%
0 0.5 1 1.5 2 2.5 3 3.5
Cum
ulat
ive
Freq
uenc
y
Depth (meters)
TMDL Target 2003-2007 Central B
FIGURE 9: STEP 1 COMPLIANCE EVALUATION FOR THE CENTRAL B PROJECT ZONE FOR 2003–07
0.0%
10.0%
20.0%
30.0%
40.0%
50.0%
60.0%
70.0%
80.0%
90.0%
100.0%
0 0.5 1 1.5 2 2.5 3 3.5
Cum
ulat
ive
Freq
uenc
y
Depth (meters)
TMDL Target 2005-2009 Central B
FIGURE 10: STEP 1 COMPLIANCE EVALUATION FOR THE CENTRAL B PROJECT ZONE FOR 2005–09
TABLE 4: STEP 2 COMPLIANCE EVALUATION FOR THE CENTRAL IRL SUBBASIN * Grey highlighting and boldface type indicate years when the TMDL median depth limit target was achieved in the project zone.
YEAR CENTRAL A MEDIAN DEPTH
(METERS) CENTRAL SEB MEDIAN DEPTH
(METERS) CENTRAL B MEDIAN DEPTH
(METERS) TMDL Median 1.27 1.20 1.15
2003 1.29* 1.18 1.15* 2005 1.29* 1.21* 1.18* 2006 1.29* 1.24* 1.21* 2007 1.39* 1.27* 1.27* 2009 1.32* 1.27* 1.24*
Step 2 Compliant? Yes Yes Yes

FINAL Central Indian River Lagoon Basin Management Action Plan – January 2013
13
1.3.5 STAKEHOLDER INVOLVEMENT In June 2009, FDEP initiated BMAP technical meetings involving key stakeholders. The purpose of the technical meetings was to organize and review the technical information that is the basis of the BMAP, gather information to aid in the development of the BMAP, and identify management actions that improved water quality. Additional details about the discussions held at these meetings can be found in the meeting summaries, which are posted at http://publicfiles.dep.state.fl.us/DEAR/BMAP/IndianRiverLagoon/. The technical meetings were held regularly throughout the BMAP development process on the following dates:
• June 12, 2009;
• July 10, 2009;
• August 14, 2009;
• December 11, 2009;
• January 15, 2010;
• July 9, 2010;
• August 13, 2010;
• January 14, 2011;
• April 8, 2011;
• June 15, 2011;
• October 27, 2011;
• December 14, 2011;
• March 1, 2012;
• April 25, 2012;
• June 27, 2012;
• August 3, 2012; and
• September 20, 2012 In addition, FDEP periodically held policy briefings to obtain feedback on the BMAP process from the policy makers from each of the responsible entities. Policy briefings were held on the following dates:
• January 30, 2012;
• September 18, 2012;
• September 19, 2012;
• October 16, 2012;
• November 12, 2012;
• November 13, 2012;

FINAL Central Indian River Lagoon Basin Management Action Plan – January 2013
14
• January 3, 2013; and
• January 15, 2013. All technical meetings and policy briefings were open to the public and noticed in the Florida Administrative Weekly. Public comment was invited during the policy briefings, and the technical meetings were open to anyone interested in participating in the technical discussions. Public meetings on the proposed Verified List and the IRL Basin TMDLs were held before each was adopted. In addition, public workshops on the BMAP were held on September 29 and November 10, 2012.
Except as specifically noted in subsequent sections, this BMAP reflects the input of the technical stakeholders along with public input from workshops and meetings held to discuss key aspects of the TMDL and BMAP development.
1.3.6 PLAN PURPOSE As described in Section 1.3.4, the Central IRL project zones are currently meeting the TMDL seagrass depth limit targets. The purpose of this BMAP is, therefore, to document the completed projects that contributed to this success and to identify future projects to continue seagrass improvement. Although some of the stakeholders have identified projects in this BMAP iteration that will be constructed in the future, these projects are not a BMAP requirement since additional nutrient reductions are not required in this first BMAP phase. However, including future projects in the BMAP may help stakeholders obtain funding, since these activities are part of a restoration plan. Credit for submitted projects will be applied toward reductions required in the next BMAP iteration, if any Central IRL project zone were no longer achieving the seagrass depth limit targets. If reductions were required, the projects conducted during this first BMAP iteration would count for reduction credit for 10 years from the adoption of the Central IRL BMAP. The BMAP will also help to increase coordination between state and local governments for surface water quality restoration, and to keep the restoration of the Central IRL as a priority for local communities and the public.
1.4 ASSUMPTIONS AND CONSIDERATIONS REGARDING TMDL IMPLEMENTATION The projected water quality impacts of BMAP implementation are based on several fundamental assumptions about the parameters targeted by the TMDLs, modeling approaches, waterbody response, and natural processes. In addition, there are important considerations about the nature of the BMAP and its long-term implementation. These assumptions and considerations are discussed below.
1.4.1 ASSUMPTIONS The following assumptions were used during the BMAP process:
• The TMDL requires TN and TP reductions from the watershed to improve water quality in the Central IRL to allow seagrass to grow at greater water depths. High watershed nutrient loadings result in high chlorophyll-a concentrations in the lagoon, which reduce light availability to the seagrass and limit the depth at which seagrass can grow. Therefore, reducing nutrient loading to the Central IRL is the most important factor in improving seagrass depth limits.
• Some of the best management practices (BMPs) listed in the project tables that reduce TN and TP will also result in total suspended solids (TSS)

FINAL Central Indian River Lagoon Basin Management Action Plan – January 2013
15
reductions. TSS is another factor that limits light penetration in the lagoon. Therefore, reductions in TSS, in conjunction with reductions in nutrients, should allow seagrass to grow at deeper depths in the Central IRL and continue to meet the TMDL seagrass depth limit targets.
• Certain BMPs were assigned provisional credit for load reductions in this iteration of the BMAP while additional research is conducted to quantify their effectiveness. These estimated reductions may change as additional research results become available. Activities that qualified for provisional credit included floating islands, public education and outreach, muck removal, aquatic vegetation harvesting, and water control structures (refer to Section 4.5 for additional details).
1.4.2 CONSIDERATIONS During the BMAP process, several items were identified that should be addressed in future watershed management cycles to ensure that future BMAPs use the most accurate information:
• Land Uses – The loading estimates in the TMDL are based on land uses at a particular point in time, allowing the model to be validated and calibrated. Land uses, however, change over time and, depending on local trends, can change significantly. The loading estimates for this iteration of the TMDL and BMAP were based on 2000 land use data. Future iterations should consider more recent land use information.
• Soil Types – The Natural Resources Conservation Service (NRCS) released a new soil coverage for Florida in February 2010 that includes some significant changes in soil types throughout the IRL Basin. During the next iteration of the BMAP, FDEP will review the updated soil coverage and make adjustments to the Pollutant Load Screening Model (PLSM) as needed.
• Basin Boundaries – Since the PLSM was developed, additional and more accurate data about the topography of the IRL Basin have been collected. During the next iteration of the BMAP, FDEP will review available data and make adjustments to the drainage basins as needed.
• Areas with Stormwater Treatment – The PLSM incorporates a factor to represent areas with stormwater treatment. At the time of TMDL development, areas with Environmental Resource Permit (ERP) stormwater treatment areas were not well mapped. During the next BMAP iteration, FDEP will review available data and make adjustments to the treated areas in the model as needed.
• Event Mean Concentrations (EMCs) and Runoff Coefficients (ROCs) – Subsequent to PLSM development, more accurate and extensive EMCs for pollutant concentrations in stormwater runoff and ROCs for stormwater runoff have been added to FDEP’s database. During the next BMAP iteration, FDEP will review available data and make adjustments to the EMCs and ROCs in the model as needed.
• County Roads – Stakeholders expressed concern during the BMAP process that county roads were included as part of the loading to each municipality. GIS coverages for county roads were not available for the entire basin; therefore, these roads and associated loadings could not be defined and

FINAL Central Indian River Lagoon Basin Management Action Plan – January 2013
16
assigned to the appropriate county. If the county road coverages are available for the next BMAP iteration, FDEP will use this information in the allocations, if required, in the next iteration.
• Atmospheric Deposition – The TMDL assumed that no reduction in atmospheric deposition would occur over time. However, there are two power plants located in the North IRL subbasin, Cape Canaveral Power Plant and Reliant Energy Indian River Power Plant, and contributions from these sources could be reduced in the future. In July 2009, the Cape Canaveral Power Plant obtained a permit to dismantle the existing oil- and gas-fueled steam units and construct a natural gas–fueled combined cycle unit, and construction is under way (FDEP 2012). This upgrade should result in fewer emissions in the IRL Basin and a subsequent reduction in atmospheric deposition loads to the lagoon. For future BMAP iterations, FDEP will evaluate any changes in atmospheric deposition in the basin and adjust the estimated loading to the lagoon as appropriate.
• Ground Water Loads – The TMDL states that ground water input from the Floridan aquifer does not represent a significant portion of the water budget for the IRL system but, depending on the season, input from the surficial aquifer could be important. The nutrient loading from the surficial aquifer was implicitly included in the modeling as part of the watershed flow and loadings (FDEP 2009). The stakeholders expressed concern during the BMAP process that the ground water loads were not sufficiently accounted for in the modeling process. In future iterations, FDEP will evaluate any available ground water data and utilize this information, to the extent possible, in the modeling.
• Progress Towards Seagrass Depth Limit Targets – FDEP will continue to assess compliance with the seagrass depth limit targets for the Central IRL subbasin (refer to Section 5.1 for details). A determination as to whether nutrient reductions are needed in future BMAP iterations will be made based on seagrass response.
• Tributary Water Quality Impairments – FDEP has identified dissolved oxygen (DO) impairments for North Canal (WBID 3147), Main Canal (WBID 3153), and South Canal (WBID 3158) but has not yet developed water quality targets. FDEP has proposed DO TMDLs for North Prong St. Sebastian River (WBID 3128A) and South Prong Sebastian River Freshwater Segment (WBID 3129B2 FDEP has proposed DO and nutrient TMDLs for Crane Creek (WBID 3085A), St. Sebastian River (WBID 3129A), South Prong St. Sebastian River Estuary Segment (WBID 3129B1), and C-54 Canal at the confluence with Sebastian River (WBID 3135A). A nutrient TMDL is proposed for Goat Creek (WBID 3107A). The relation between the tributary loads and the targets set for the lagoon proper will be defined with tributary TMDLs. As a general principle, when FDEP establishes upstream TMDLs, downstream water quality targets are considered. In this case, when FDEP establishes IRL tributary TMDLs, meeting the lagoon’s seagrass depth targets will be considered. The future adoption of tributary TMDLs may allow the targeting of specific watersheds for nutrient load reductions.
• Integration of New Information – An algal superbloom occurred in the BRL and North IRL in 2011, while a secondary bloom occurred in the Central IRL. These blooms were followed by a brown algae bloom in 2012. Research is

FINAL Central Indian River Lagoon Basin Management Action Plan – January 2013
17
under way to understand the causes of these blooms as part of the Indian River Lagoon 2011 Superbloom Plan of Investigation (SJRWMD et al. 2012).. Any improved understanding of the cause of these bloom events obtained from this research and its implications for the management of the IRL should be incorporated into the BMAP during the earliest practical time frame.
1.5 RELATION OF THE BMAP TO OTHER RESTORATION PLANS The IRL is a designated Estuary of National Significance and a Surface Water Improvement and Management (SWIM) waterbody. The National Estuary Program (NEP) is a federal program and as such has a specific organizational structure and purpose. SWIM is a state program focused on the restoration of specific impaired ecosystems. These programs address broader lagoon restoration goals and issues such as habitat restoration, land acquisition, and fisheries that are not directly related to TMDLs, through a Comprehensive Conservation Management Plan (CCMP) and a SWIM plan. All three plans (CCMP, SWIM, and BMAP) identify the restoration of seagrass in deeper water habitats as their goal, but the SWIM and CCMP have a broader series of goals and objectives designed to attain and maintain a functioning macrophyte-based ecosystem that supports fish and wildlife. The focus of the BMAP is on addressing water quality impacts to seagrass from TN and TP loadings entering the lagoon, while the CCMP and SWIM plan address additional issues such as freshwater diversion to the IRL from the St. Johns River Basin. The CCMP update 2008 (IRL NEP 2008) includes three new actions to assist in TMDL development and implementation. The three plans complement and support each other. Research activities and water quality improvement projects initiated through the SWIM Program or CCMP support the implementation of IRL TMDLs. The BMAP provides specific reduction targets for nutrients to achieve seagrass success and, unlike the SWIM and CCMP, has a mechanism to enforce the actions specified in the BMAP.
1.6 FUTURE GROWTH IN THE BASIN ERP Program requirements are expected to address loading from future development in the basin. The ERP Program requires that new discharges into the basin cannot increase existing loads. All ERP applications must include documentation demonstrating compliance with state water quality standards, as well as showing that the project does not adversely affect the quality of receiving waters resulting in water quality standards violations. Since the Central IRL is listed as an impaired water, new development in the basin cannot increase nutrient loads to the Central IRL.
Starting on July 1, 2012, developers have the option of obtaining a general permit for the construction of surface water management systems serving a project area of up to 10 acres, with less than 2 acres of impervious area and no wetlands impacts. This “10/2” general permit would be in lieu of an ERP for areas up to 10 acres. To obtain the general permit, the developer must demonstrate that the project does not cause adverse impacts, including violations of state water quality standards. This evaluation must be signed by a state of Florida registered professional; however, state agency review is not required. With this new rule in place, local governments cannot require the developer to obtain a permit from a state or federal agency as a condition of issuing a permit. In addition, efforts are under way to streamline the ERP process; however, the implications of this streamlining are unknown as of the date of this report.
Since the TMDL reductions are based on decreasing loads from past development, it is important that loads from new development are well controlled. Although future development may meet state stormwater standards, the development may still contribute loading to the

FINAL Central Indian River Lagoon Basin Management Action Plan – January 2013
18
lagoon. To ensure that future growth does not cause degradation of the Central IRL, local governments must be proactive in reducing loads from future growth.
Options to address future loading include low-impact development (LID) standards and Florida-friendly landscaping to further minimize the impacts of existing development and new development through local development regulations. LID is an approach to development that employs land planning, design practices, and technologies to conserve natural resources and reduce infrastructure costs. These activities could offset loads from future growth and, therefore, may reduce the reductions needed from the entities in future BMAP iterations. FDEP will continue to research available credits that could be issued for the use of LID BMPs.
1.7 ECONOMIC BENEFITS OF THE IRL SYSTEM The IRL is a valuable ecological and economic asset for the state of Florida and the counties that border the lagoon and its tributaries. It is considered the most biologically diverse estuary in North America and was recognized as part of NEP in 1990. The lagoon directly and indirectly supports a large part of the region’s and the state’s economy. The basin supports the multimillion-dollar Indian River citrus industry and boat and marine sales industries. Finfish and shellfish harvesting from the lagoon contribute to local economies.
A 2008 economic study (Hazen and Sawyer) carried out for the IRL NEP estimated the total value of the lagoon’s benefits to residents and visitors at $3.725 billion, measured in 2007 dollars. The Impact Analysis for Planning Regional Economic Input Output Model was used to estimate the economic contribution of lagoon-related expenditures. More than $1.3 billion of economic benefit was generated from money spent on recreational activities, both from residents and visitors, including items such as boat purchases, boat repairs, and marina slip rental and dockage fees. An additional $762 million was estimated for recreational use value, which is the amount that people would be willing to pay for the opportunity to engage in a recreational activity on the lagoon. Therefore, the total value for 2007 for lagoon-related recreation was close to $2.1 billion.
A significant increase in the amount and diversity of wildlife on the lagoon and improved water quality in the basin would increase the recreational use value of the entire IRL system by about $80 million per year. Other recreational expenditures and real estate values may also increase under improved environmental conditions but were not estimated during the study. The increase in value reflects a greater willingness by residents and visitors to pay to improve the environmental quality of the lagoon (Hazen and Sawyer 2008).
The economic value of the IRL Basin’s seagrass beds was estimated at $329 million per year for 72,400 acres of seagrass. Seagrass habitats are an important component of the lagoon’s ecology and are the foundation of the food web for many of the animals that live in the IRL by providing nursery and feeding areas. This is particularly true for many of the recreational and commercial fish species. Seagrass may provide additional economic value related to water quality and aesthetics (Hazen and Sawyer 2008). Therefore, investing in projects and programs to improve the lagoon’s water quality and seagrass beds is not only important for environmental considerations but also to improve the economy.

FINAL Central Indian River Lagoon Basin Management Action Plan – January 2013
19
CHAPTER 2: CENTRAL INDIAN RIVER LAGOON BASIN SETTING Understanding the conditions in the basin is an important component of identifying an appropriate restoration and management plan. This chapter describes the hydrology and land uses in the Central IRL subbasin.
2.1 BASIN HYDROLOGY Circulation in the Central IRL subbasin is influenced by winds, freshwater inflows from tributaries, and tidal exchange via direct connections to the Atlantic Ocean. Other than stream inflows, freshwater inflows also come from direct overland runoff, drainage canals, ground water seepage, and rainfall directly on to the surface. The Central IRL lies within 17 miles of either Sebastian Inlet or Fort Pierce Inlet, a distance that is much closer to the inlets than the North IRL and BRL subbasins. Therefore, the average flushing rate in the Central IRL is 10 times higher than in the North IRL and 15 times higher than in the BRL (FDEP 2009).
From north to south, major tributaries to the Central IRL include Crane Creek (receives drainage from Melbourne and Melbourne Village), Turkey Creek (receives drainage from the C-1 and the Melbourne-Tillman Water Control District [WCD] that serves agriculture and the urbanized areas of West Melbourne and Palm Bay), Goat Creek, Kid Creek (drains Valkaria Airport and Missile Tracking Annex), Trout Creek, the North and South Prongs of the St. Sebastian River, and C-54 (flows from the Upper St. Johns River [USJR] Basin). The Central IRL also receives drainage from canals within the Sebastian River Improvement District, Fellsmere WCD, Vero Lakes WCD, Indian River Farms WCD, and various stormwater canals (FDEP 2008).
The Central IRL has been affected by excessive freshwater inputs from drainage improvements in the coastal areas and by the diversion of water from the St. Johns River floodplain (FDEP 2009). However, projects to redivert these freshwater inputs to the USJR instead of the IRL are ongoing (refer to Section 4.7) and have greatly contributed to the periods of seagrass success in the Central IRL.
2.2 LAND USE COVERAGE As shown in Table 5, the Central IRL subbasin covers a total of about 283,609 acres (not including lagoon surface areas). Based on 2000 land uses, urban areas including low-, medium-, and high-density residential; transportation, communication, and utilities; and other urban and built-up land uses comprise 34.2% of the drainage area. Agricultural lands are also important in the Central IRL, accounting for about 27% of the watershed area. The Central IRL has the highest percentage of human land use dominance in the IRL Basin, accounting for 61% of the drainage area (FDEP 2009).
The dominant natural land use in the watershed is upland forest, which accounts for 13.7% of the total drainage area. Wetlands make up 10.4% of the watershed. In addition, 11.7% of the area comprises rangeland. Figure 11 shows the distribution of land uses in the Central IRL watershed.

FINAL Central Indian River Lagoon Basin Management Action Plan – January 2013
20
TABLE 5: 2000 LAND USES IN THE CENTRAL IRL SUBBASIN LAND USE TYPE ACRES %
Agriculture 76,157 26.9% Medium-Density Residential 39,626 14.0% Upland Forest 38,793 13.7% Rangeland 33,184 11.7% Wetland 29,503 10.4% Urban and Built-Up 27,355 9.6% Low-Density Residential 15,944 5.6% High-Density Residential 7,897 2.8% Water 6,127 2.2% Transportation, Communication, Utilities 6,255 2.2% Barren Land 2,768 1.0%
TOTAL 283,609 100.0%

FINAL Central Indian River Lagoon Basin Management Action Plan – January 2013
21
FIGURE 11: 2000 LAND USES IN THE CENTRAL IRL SUBBASIN

FINAL Central Indian River Lagoon Basin Management Action Plan – January 2013
22
CHAPTER 3: POLLUTANT SOURCES AND ANTICIPATED OUTCOMES The TMDL includes estimates of TN and TP loading to the Central IRL subbasin from point source facilities, urban and agricultural stormwater sources, and atmospheric deposition. Atmospheric deposition was considered a background, uncontrollable source, and the TMDL did not require any reductions from this source. The focus in the TMDL is on load reductions from point source facilities and stormwater sources, which are described in more detail in the sections below.
3.1 POINT SOURCE FACILITIES Point sources include both domestic and industrial wastewater treatment facilities (WWTFs). Rule 62-620, F.A.C., defines domestic wastewater facilities as those facilities that are principally designed “to collect and treat sanitary wastewater or sewage from dwellings or homes, business buildings, institutions, and the like.” This rule defines industrial wastewater as “process and non-process wastewater from manufacturing, commercial, mining, and silvicultural facilities or activities, including the runoff and leachate from areas that receive pollutants associated with industrial or commercial storage, handling or processing, and all other wastewater not otherwise defined as domestic wastewater.”
The allocations for the NPDES facilities were included in the IRL Basin TMDL, and FDEP has incorporated these discharge limits into each facility’s permit. Table 6 lists the facilities located in the Central IRL subbasin and their TMDL allocations.
TABLE 6: NDPES FACILITIES AND ALLOCATIONS IN THE CENTRAL IRL SUBBASIN
NPDES FACILITY PERMIT NUMBER
TN ALLOCATION
(LBS/YR)
TP ALLOCATION
(LBS/YR) PROJECT ZONE Brevard County – South Beaches WWTF FL0040622 173 36 Central A Melbourne – Grant Street WWTF FL0041122 182 8 Central A Barefoot Bay WWTF FL0042293 476 78 Central SEB Indian River County – Hobart Reverse Osmosis (RO) FL0166511 2,759 96 Central SEB Vero Beach WWTF FL0021661 12,173 916 Central B Vero Beach RO FL0042544 2,985 487 Central B Indian River County – West Regional WWTF FL0041637 2,838 159 Central B Indian River County – South County RO FL0037940 4,636 291 Central B
3.2 MUNICIPAL SEPARATE STORM SEWER SYSTEMS Many of the municipalities across the basin are regulated by the Florida NPDES Stormwater Program because they discharge stormwater and qualify as “municipal separate storm sewer system (MS4s). MS4 means a conveyance or system of conveyances such as roads with stormwater systems, municipal streets, catch basins, curbs, gutters, ditches, constructed channels, or storm drains:
• That is owned or operated by a state, city, town, county, special district, association, or other public body (created by or under state law) having jurisdiction over management and discharge of stormwater and which discharges to surface waters of the state;
• That is designed or used for collecting or conveying stormwater;

FINAL Central Indian River Lagoon Basin Management Action Plan – January 2013
23
• That is not a combined sewer; and
• That is not part of a Publicly Owned Treatment Works (POTW). POTW means any device or system used in the treatment of municipal sewage or industrial wastes of a liquid nature which is owned by a “state” or “municipality.” This definition includes sewers, pipes, or other conveyances only if they convey wastewater to a POTW providing treatment.
The basic requirements of this program serve as a foundation for the stormwater management efforts of these communities. The U.S. Environmental Protection Agency (EPA) developed the federal NPDES stormwater permitting program in 2 phases. Phase I, which began in 1990, addresses large and medium MS4s located in incorporated areas and counties with populations of 100,000 or more, as well as specific industrial activities. Phase II, which started in 1999, addresses small MS4s that are designated according to population and other criteria established in federal and state rules. Small MS4s include MS4s that serve a population of 1,000 or more and are located within an urbanized area.
In October 2000, the EPA authorized FDEP to implement the NPDES stormwater permitting program in the state. This permitting has remained separate from state stormwater/ERP programs and local stormwater/water quality programs, which have their own regulations and permitting requirements. Florida's rules for MS4s can be found in Rules 62-4, 62-620, 62-621 and 62-624, F.A.C.
All of the MS4s in the basin are Phase II, except for the Turnpike Enterprise, which is Phase I. Table 7 lists entities currently designated as MS4s in the Central IRL subbasin.
TABLE 7: MS4S IN THE CENTRAL IRL SUBBASIN PERMITTEE PERMIT NUMBER
Brevard County FLR04E052 Indian River County FLR04E068 City of Melbourne FLR04E027 City of Palm Bay FLR04E077 City of Sebastian FLR04E124 City of Vero Beach FLR04E010 City of West Melbourne FLR04E028 Town of Indialantic FLR04E030 Town of Indian River Shores FLR04E009 Town of Malabar FLR04E050 Town of Melbourne Beach FLR04E041 Florida Department of Transportation (FDOT) District 4 FLR04E083 FDOT District 5 FLR04E024 Turnpike Enterprise FLS000016
3.3 NON-MS4 STORMWATER SOURCES Urban stormwater load reductions that are not being discharged by a permitted MS4 were established in the “load allocation” component of the TMDL. The non-MS4 entities in the Central IRL subbasin include the following:

FINAL Central Indian River Lagoon Basin Management Action Plan – January 2013
24
• City of Fellsmere
• Town of Grant-Valkaria
• Town of Melbourne Village
• Town of Orchid
• Fellsmere WCD
• Indian River Farms WCD
• Melbourne-Tillman WCD
• Sebastian River Improvement District
• Vero Lakes WCD
3.4 AGRICULTURE The primary agricultural land use in the Central IRL subbasin is citrus. Other agricultural land uses include cow-calf operations (pasture), nurseries, row/field crops, and horse farms. The majority of the horse farms are characterized as small, noncommercial hobby farms scattered throughout residential areas.
Due to urban encroachment, citrus health issues (freeze/disease), and the economic downturn, many citrus, row crop, poultry, and nursery operations either have been abandoned or have significantly lowered their production acreage. In recent years, some of this acreage may have been shifted to other commodities, but a review of the most recent aerial imagery for the basin shows a somewhat significant conversion to urban uses, as well as a large number of abandoned/out-of-production citrus acres. As it is difficult to identify out-of-production operations for most other types of agricultural land use from aerial imagery, the Florida Department of Agriculture and Consumer Services (FDACS) will consult with field staff and local contractors during the first phase of the BMAP to provide additional information on agricultural activities in the basin.
3.5 ENFORCEMENT IN FUTURE BMAP ITERATIONS If reductions are required in future BMAP iterations, FDEP does have enforcement mechanisms to ensure the BMAP-required reductions are achieved, as described in the sections below.
3.5.1 POINT SOURCE FACILITIES The allocations to point source facilities are implemented through NPDES permits, and the new discharge limits were added to each individual permit. Any changes to the project(s) needed to achieve the new discharge limits must be done with a permit revision. The load reductions required by the TMDLs are binding, and a failure to comply will lead to the appropriate enforcement actions, as outlined in Sections 403.061, 403.121, and 403.161, F.S., and Subsection 62-650.300(4), F.A.C.
3.5.1.1 Aquaculture Under the Clean Water Act, aquaculture activities are defined as a point source. Starting in 1992, FDEP and/or the water management districts regulated all aquaculture facilities through a general fish farm permit authorized by Section 403.814, F.S. In 1999, the Florida Legislature amended Chapter 597, F.S., Florida Aquaculture Policy Act, to create a program within FDACS

FINAL Central Indian River Lagoon Basin Management Action Plan – January 2013
25
that requires Floridians who sell aquatic species to annually acquire an Aquaculture Certificate of Registration and implement Rule 5L-3, F.A.C., Aquaculture Best Management Practices. This requirement is not an option for aquaculturists, and they may not sell their production unless they are certified.
In the Central IRL subbasin, 133.6 acres of aquaculture are included under 1 certification with FDACS’ Division of Aquaculture.
3.5.2 MS4S All NPDES permits, including MS4 permits, must be consistent with the requirements of adopted TMDLs. Paragraph 403.067(7)(b), F.S., prescribes the criteria for TMDL implementation. In accordance with this section, the implementation of a TMDL or BMAP for holders of NPDES MS4 permits shall be achieved to the maximum extent practicable (MEP) through the use of BMPs or other management measures. These management measures include, but are not limited to, the following:
• Nonregulatory and incentive based programs, including BMPs, cost-sharing, waste minimization, pollution prevention, and public education;
• Nonstructural BMPs;
• Water quality management and restoration activities;
• Public works including capital facilities;
• Land acquisition;
• Local ordinances; and
• Regulatory incentive programs. To comply with the MEP standard, the stormwater management program must be designed and implemented to reduce the discharge of pollutants to surface waters of the state. The implementation of BMPs consistent with the provisions of the stormwater management program required under an MS4 permit constitutes compliance with the standard of reducing pollutants to the MEP for discharges to unimpaired waters. However, MS4s must also continue to assess and adjust their list of approved projects to achieve the greatest reduction of pollutants practicable to protect receiving waters in accordance with an adopted TMDL or BMAP.
Entities that fail to implement their list of approved projects in order to reduce pollutants to the MEP standard will be subject to enforcement action in accordance with Sections 403.061, 403.121, and 403.161, F.S., and Subsection 62-650.300(4), F.A.C. In addition, both MS4 Phase I and Phase II permits include provisions for revising the effluent limitations, monitoring requirements, and stormwater management programs to meet applicable TMDL allocations that are consistent with the assumptions and requirements of the adopted BMAP.
3.5.3 NON-MS4S Paragraph 403.067(7)(b)2.f, F.S., prescribes the pollutant reduction actions required for nonagricultural pollutant sources that are not subject to NPDES permitting. These “non-MS4 sources” must also implement the pollutant reduction requirements detailed in a BMAP and are subject to enforcement action by FDEP or a water management district if they fail to implement their responsibilities under the BMAP. Load reductions, and the responsibility for meeting them, were assigned to the entity that governs the area generating these non-MS4 urban lands.

FINAL Central Indian River Lagoon Basin Management Action Plan – January 2013
26
Failure to reduce these loadings can result in enforcement action by FDEP under Paragraph 403.067(7)(b)2(h), F.S.
FDEP can seek to designate an entity as a regulated Phase II MS4 in accordance with Section 62-624.800, F.A.C. One of the primary designations applies when a TMDL is adopted. FDEP can designate an entity as a regulated Phase II MS4 if the discharges are determined to be a significant contributor of pollutants to surface waters of the state, which can occur when FDEP has adopted a TMDL for a waterbody or segment into which the Phase II MS4 discharges the pollutant(s) of concern. If an entity is designated as a regulated Phase II MS4, it will be subject to the conditions of the Phase II MS4 Generic Permit.
3.5.4 AGRICULTURE Section 0 describes agricultural enforcement mechanisms.
3.6 ANTICIPATED OUTCOMES OF BMAP IMPLEMENTATION Any projects implemented in the Central IRL to reduce watershed nutrient loading are expected to contribute to the following outcomes:
• Improved water quality trends in the Central IRL, which will continue to help improve seagrass coverage;
• Decreased loading of the target pollutants (TN and TP);
• Decreased TSS loading from some of the projects implemented to reduce TN and TP loads;
• Increased coordination between state and local governments and within divisions of local governments when solving problems for surface water quality restoration;
• Additional state and local funding secured for water quality restoration;
• Improved identification of effective projects through stakeholder decision-making and priority-setting processes;
• Enhanced public awareness of pollutant sources, pollutant impacts on water quality, and corresponding corrective actions; and
• Enhanced understanding of basin hydrology, water quality, and pollutant sources.

FINAL Central Indian River Lagoon Basin Management Action Plan – January 2013
27
CHAPTER 4: MANAGEMENT ACTIONS “Management actions” refers to the suite of activities that the Central IRL BMAP entities have completed or planned to achieve TN and TP reductions. These include both structural and nonstructural activities. As noted earlier, the entities were not required to make additional nutrient reductions in this BMAP iteration because the seagrass depth limit targets were achieved based on the results of the latest evaluation. Therefore, any future projects submitted are not a requirement of the BMAP.
The BMAP includes projects, programs, and activities that address nutrient loads (TN, TP, or both) within the Central IRL subbasin in the appropriate project zone. Credit was assigned in the BMAP for projects that met the following criteria: (1) projects completed by January 1, 2000, and later; and (2) projects that provide treatment above and beyond any permitted requirements related to the project. These criteria reflect the TMDL model land uses, which are from 2000; the benefits of management actions implemented since that date were not reflected in the TMDL model. In addition, permit conditions are established to maintain the current condition (prevent further impacts from development) and are not intended to contribute to the improvement of water quality in the Central IRL.
Not all of the projects that were submitted were quantified. Public education and outreach activities were not quantified because credit for these efforts is based on a percentage of the starting load for each entity. Since allocations were not calculated for the Central IRL, the starting loads for each entity are not currently available. In addition, some projects submitted by the WCDs and improvement districts could not be quantified because they do not fall into the typical stormwater BMP categories. FDEP is working with the districts to determine methods to quantify credit for these projects.
4.1 SUMMARY OF LOAD REDUCTIONS IN THE CENTRAL IRL SUBBASIN The entities submitted structural and nonstructural projects they completed in the Central IRL subbasin that helped to reduce nonpoint source loading from stormwater. The stakeholders also provided information on future projects that will help to maintain TMDL compliance. A number of regional projects were also completed or under construction by local and federal agencies. These provide significant load reductions by rediverting water from the IRL to the USJR Basin, restoring how water historically flowed in this area. The projects implemented by the NPDES facilities, MS4s, non-MS4s, and agriculture, as well as the regional projects, are included in the sections below. Table 8 summarizes the quantified reductions from all of these sources.
TABLE 8: SUMMARY OF TN AND TP QUANTIFIED REDUCTIONS IN THE CENTRAL IRL SUBBASIN * Nutrient reductions from the USJR Project and C-54 have not been quantified. Refer to Section 4.7.2 for details about this project.
CATEGORY
TN QUANTIFIED REDUCTIONS
(LBS/YR)
TP QUANTIFIED REDUCTIONS
(LBS/YR) NPDES Facilities Projects Total Not quantified Not quantified MS4 Projects Total 59,818 15,910.3 Non-MS4 Project Total 187.5 57.4 Agricultural 50% BMP Implementation 26,852 3,684.8 Agricultural Credit for Changes to Less Intensive/Fallow Uses 26,072 29,605.9 C-1 Re-Diversion Project (Phases 1 and 2) 179,088-195,670 20,919-22,856 USJR Basin Project and C-54* Not quantified Not quantified Total Quantified Reductions 292,018-308,600 70,177.4-72,114.4

FINAL Central Indian River Lagoon Basin Management Action Plan – January 2013
28
In addition to the stakeholder and regional projects, there has been an approximately 20% decrease in rainfall in the Central IRL in the last 10 years compared with the previous 10-year period. This decrease means that there has been less stormwater runoff to the Central IRL in the last 10 years than there was previously. Therefore, future projects implemented by the stakeholders and agencies in the basin to treat and/or reduce stormwater runoff will be important to maintain compliance with the TMDL depth limit targets for the Central IRL project zones under a variety of rainfall conditions.
4.2 NPDES FACILITIES PROJECTS The Brevard County – South Beaches and City of Melbourne – Grant Street WWTFs are both only allowed surface water discharges for 5 days within a 5-year permit cycle for the mechanical integrity test that is conducted for the underground injection well system. This loading from both of the facilities is insignificant compared with the total allowable loading; therefore, the TMDL assigned each of these facilities the 95th percentile of the TN and TP discharges for the 2001–05 period. The Brevard County – Barefoot Bay WWTF, Indian River County – Hobart RO Water Treatment Plant (WTP), Indian River County – West Regional WWTF, Indian River County – South County RO WTP, and City of Vero Beach RO WTP discharges all met equivalent advanced wastewater treatment (AWT) concentration requirements; therefore, the TMDL also assigned each of these facilities the 95th percentile of the TN and TP discharges for the 2001–05 period. The Vero Beach WWTF had concentrations that exceeded the AWT requirements, making the 95th percentile TN and TP loading for 2001–05 still significant. Therefore, the TMDL assigned this WWTF the long-term average annual discharge loads for TN and TP from the 2001–05 period (FDEP 2009). To address these additional load reductions, the city of Vero Beach constructed a deep underground injection control well that takes the flow from the WWTF, which is not directed to the city’s reuse system, and RO WTP. The deep well is designed to discharge only once every 5 years for 3 to 5 days during mechanical integrity testing of the well. This upgrade results in greater reductions from both the WWTF and RO WTP than required by their specific allocation.
4.3 MS4 PROJECTS
4.3.1 MS4 TN PROJECTS The projects completed by the MS4 stakeholders that achieved TN reductions are summarized in Table 9 through Table 11 and detailed in Appendix E.
TABLE 9: SUMMARY OF MS4 LOAD REDUCTIONS FOR TN BY PROJECT TYPE IN CENTRAL A
ENTITY
STRUCTURAL STORMWATER
(LBS/YR)
NONSTRUCTURAL STORMWATER
(LBS/YR) PUBLIC EDUCATION
(LBS/YR)
STREET SWEEPING (LBS/YR)
TN TOTAL (LBS/YR)
Brevard County 858 Not applicable Not quantified 60 918 City of Melbourne 37 Not applicable Not applicable Not applicable 37 City of Palm Bay 7,618 Not quantified Not quantified 23 7,641 City of West Melbourne 572 5 Not applicable Not applicable 577 FDOT District 5 434 1,586 Not quantified Not applicable 2,020 Town of Indialantic Not applicable Not applicable Not quantified Not applicable Not quantified Town of Melbourne Beach 792 Not applicable Not applicable 405 1,197
Total 10,311 1,592 Not quantified 488 12,390
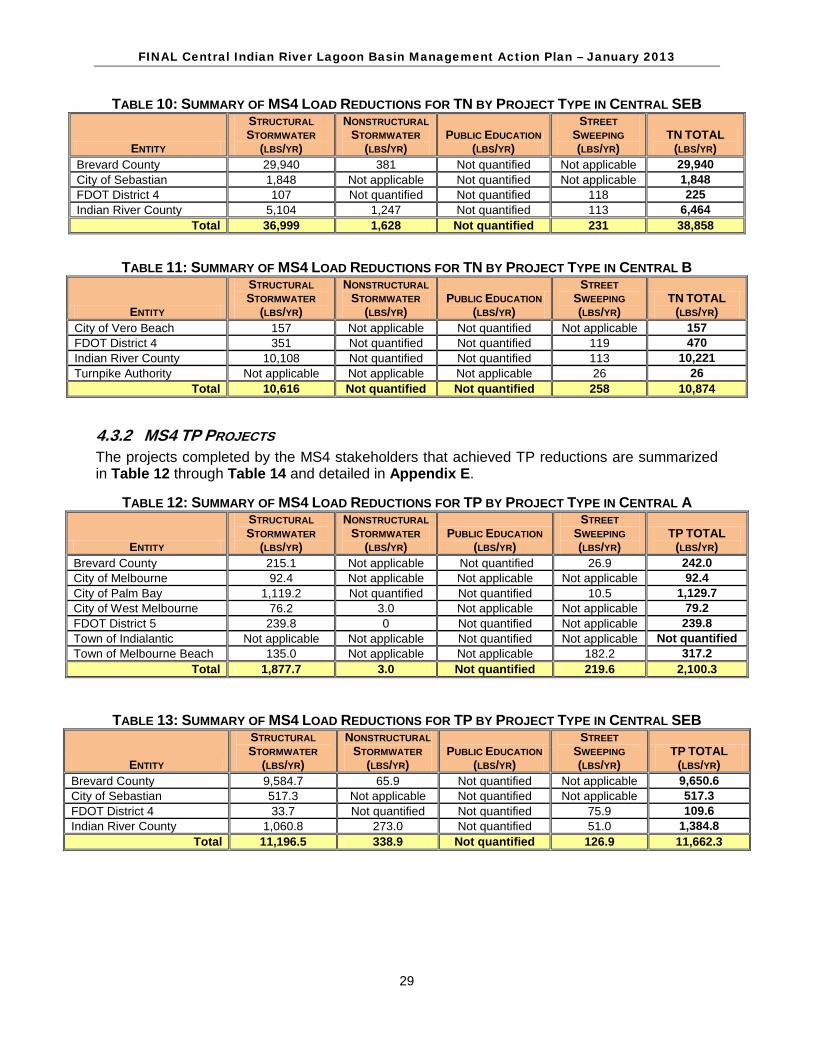
FINAL Central Indian River Lagoon Basin Management Action Plan – January 2013
29
TABLE 10: SUMMARY OF MS4 LOAD REDUCTIONS FOR TN BY PROJECT TYPE IN CENTRAL SEB
ENTITY
STRUCTURAL STORMWATER
(LBS/YR)
NONSTRUCTURAL STORMWATER
(LBS/YR) PUBLIC EDUCATION
(LBS/YR)
STREET SWEEPING (LBS/YR)
TN TOTAL (LBS/YR)
Brevard County 29,940 381 Not quantified Not applicable 29,940 City of Sebastian 1,848 Not applicable Not quantified Not applicable 1,848 FDOT District 4 107 Not quantified Not quantified 118 225 Indian River County 5,104 1,247 Not quantified 113 6,464
Total 36,999 1,628 Not quantified 231 38,858
TABLE 11: SUMMARY OF MS4 LOAD REDUCTIONS FOR TN BY PROJECT TYPE IN CENTRAL B
ENTITY
STRUCTURAL STORMWATER
(LBS/YR)
NONSTRUCTURAL STORMWATER
(LBS/YR) PUBLIC EDUCATION
(LBS/YR)
STREET SWEEPING (LBS/YR)
TN TOTAL (LBS/YR)
City of Vero Beach 157 Not applicable Not quantified Not applicable 157 FDOT District 4 351 Not quantified Not quantified 119 470 Indian River County 10,108 Not quantified Not quantified 113 10,221 Turnpike Authority Not applicable Not applicable Not applicable 26 26
Total 10,616 Not quantified Not quantified 258 10,874
4.3.2 MS4 TP PROJECTS The projects completed by the MS4 stakeholders that achieved TP reductions are summarized in Table 12 through Table 14 and detailed in Appendix E.
TABLE 12: SUMMARY OF MS4 LOAD REDUCTIONS FOR TP BY PROJECT TYPE IN CENTRAL A
ENTITY
STRUCTURAL STORMWATER
(LBS/YR)
NONSTRUCTURAL STORMWATER
(LBS/YR) PUBLIC EDUCATION
(LBS/YR)
STREET SWEEPING (LBS/YR)
TP TOTAL (LBS/YR)
Brevard County 215.1 Not applicable Not quantified 26.9 242.0 City of Melbourne 92.4 Not applicable Not applicable Not applicable 92.4 City of Palm Bay 1,119.2 Not quantified Not quantified 10.5 1,129.7 City of West Melbourne 76.2 3.0 Not applicable Not applicable 79.2 FDOT District 5 239.8 0 Not quantified Not applicable 239.8 Town of Indialantic Not applicable Not applicable Not quantified Not applicable Not quantified Town of Melbourne Beach 135.0 Not applicable Not applicable 182.2 317.2
Total 1,877.7 3.0 Not quantified 219.6 2,100.3
TABLE 13: SUMMARY OF MS4 LOAD REDUCTIONS FOR TP BY PROJECT TYPE IN CENTRAL SEB
ENTITY
STRUCTURAL STORMWATER
(LBS/YR)
NONSTRUCTURAL STORMWATER
(LBS/YR) PUBLIC EDUCATION
(LBS/YR)
STREET SWEEPING (LBS/YR)
TP TOTAL (LBS/YR)
Brevard County 9,584.7 65.9 Not quantified Not applicable 9,650.6 City of Sebastian 517.3 Not applicable Not quantified Not applicable 517.3 FDOT District 4 33.7 Not quantified Not quantified 75.9 109.6 Indian River County 1,060.8 273.0 Not quantified 51.0 1,384.8
Total 11,196.5 338.9 Not quantified 126.9 11,662.3

FINAL Central Indian River Lagoon Basin Management Action Plan – January 2013
30
TABLE 14: SUMMARY OF MS4 LOAD REDUCTIONS FOR TP BY PROJECT TYPE IN CENTRAL B
ENTITY
STRUCTURAL STORMWATER
(LBS/YR)
NONSTRUCTURAL STORMWATER
(LBS/YR) PUBLIC EDUCATION
(LBS/YR)
STREET SWEEPING (LBS/YR)
TP TOTAL (LBS/YR)
City of Vero Beach 20.9 Not applicable Not quantified Not applicable 20.9 FDOT District 4 180.9 Not quantified Not quantified 75.9 256.8 Indian River County 3,950.1 Not quantified Not quantified 51.0 4,001.1 Turnpike Authority Not applicable Not applicable Not applicable 17.3 17.3
Total 4,151.9 Not quantified Not quantified 144.2 4,296.1
4.4 NON-MS4 URBAN STORMWATER PROJECTS
4.4.1 NON-MS4 TN PROJECTS The projects completed by the non-MS4 stakeholders that achieved TN reductions are summarized in Table 15 through Table 17 and detailed in Appendix E.
TABLE 15: SUMMARY OF NON-MS4 LOAD REDUCTIONS FOR TN BY PROJECT TYPE IN CENTRAL A
ENTITY
STRUCTURAL STORMWATER
(LBS/YR) TN TOTAL
(LBS/YR) Melbourne-Tillman WCD Not quantified Not quantified Town of Melbourne Village 1 1
Total 1 1
TABLE 16: SUMMARY OF NON-MS4 LOAD REDUCTIONS FOR TN BY PROJECT TYPE IN CENTRAL SEB
ENTITY
STRUCTURAL STORMWATER
(LBS/YR)
NONSTRUCTURAL STORMWATER
(LBS/YR)
PUBLIC EDUCATION
(LBS/YR) TN TOTAL
(LBS/YR) City of Fellsmere 104.0 Not applicable Not applicable 104.0 Fellsmere WCD 82.5 Not quantified Not applicable 82.5 Indian River Farms WCD Not quantified Not quantified Not applicable Not quantified Sebastian River Improvement District Not quantified Not quantified Not quantified Not quantified Town of Orchid Not applicable Not applicable Not quantified Not quantified
Total 186.5 Not quantified Not quantified 186.5
TABLE 17: SUMMARY OF NON-MS4 LOAD REDUCTIONS FOR TN BY PROJECT TYPE IN CENTRAL B
ENTITY
STRUCTURAL STORMWATER
(LBS/YR)
NONSTRUCTURAL STORMWATER
(LBS/YR)
PUBLIC EDUCATION
(LBS/YR) TN TOTAL
(LBS/YR) Indian River Farms WCD Not quantified Not applicable Not applicable Not quantified Sebastian River Improvement District Not quantified Not quantified Not quantified Not quantified
Total Not quantified Not quantified Not quantified Not quantified
4.4.2 NON-MS4 TP PROJECTS The projects completed by the non-MS4 stakeholders that achieved TP reductions are summarized in Table 18 through Table 20 and detailed in Appendix E.

FINAL Central Indian River Lagoon Basin Management Action Plan – January 2013
31
TABLE 18: SUMMARY OF NON-MS4 LOAD REDUCTIONS FOR TP BY PROJECT TYPE IN CENTRAL A
ENTITY
STRUCTURAL STORMWATER
(LBS/YR) TP TOTAL
(LBS/YR) Melbourne-Tillman WCD Not quantified Not quantified Town of Melbourne Village 0.8 0.8
Total 0.8 0.8
TABLE 19: SUMMARY OF NON-MS4 LOAD REDUCTIONS FOR TP BY PROJECT TYPE IN CENTRAL SEB
ENTITY
STRUCTURAL STORMWATER
(LBS/YR)
NONSTRUCTURAL STORMWATER
(LBS/YR)
PUBLIC EDUCATION
(LBS/YR) TP TOTAL
(LBS/YR) City of Fellsmere 31.8 Not applicable Not applicable 31.8 Fellsmere WCD 24.8 Not quantified Not applicable 24.8 Indian River Farms WCD Not quantified Not quantified Not applicable Not quantified Sebastian River Improvement District Not quantified Not quantified Not quantified Not quantified Town of Orchid Not applicable Not applicable Not quantified Not quantified
Total 56.6 Not quantified Not quantified 56.6
TABLE 20: SUMMARY OF NON-MS4 LOAD REDUCTIONS FOR TP BY PROJECT TYPE IN CENTRAL B
ENTITY
STRUCTURAL STORMWATER
(LBS/YR)
NONSTRUCTURAL STORMWATER
(LBS/YR)
PUBLIC EDUCATION
(LBS/YR) TP TOTAL
(LBS/YR) Indian River Farms WCD Not quantified Not applicable Not applicable Not quantified Sebastian River Improvement District Not quantified Not quantified Not quantified Not quantified
Total Not quantified Not quantified Not quantified Not quantified
4.5 PROVISIONAL BMPS Several of the BMP activities included in the project lists were assigned provisional reduction estimates for the purposes of this first iteration of the BMAP. These provisional BMPs are floating islands, public education and outreach efforts, muck removal, aquatic vegetation harvesting, and water control structures. Studies to estimate the efficiencies of these BMPs are currently being conducted across the state, and the results will provide better information on the expected reductions from these BMPs.
4.5.1 FLOATING ISLANDS Credit for floating islands or managed aquatic plant systems (MAPS) was assigned as a 20% reduction in both the TN and TP load remaining after treatment by a stormwater pond. Appendix E shows the entities that included floating islands in their project tables.
4.5.2 PUBLIC EDUCATION AND OUTREACH Allocations were not assigned to individual entities, and so public education reductions cannot be calculated. However, the method for calculating public education credits is a percentage based on the types of activities implemented. Up to a 6% reduction in the anthropogenic baseline load for both TN and TP can be assigned based on the education and outreach efforts conducted by each entity. The 6% load reduction estimate was determined from the Center for Watershed Protection Watershed Treatment Model. Credit was given for the following applicable educational activities:

FINAL Central Indian River Lagoon Basin Management Action Plan – January 2013
32
• Local funding to implement the Florida Yards and Neighborhoods (FYN) program within the city or county.
• Local land development codes or ordinances that require Florida-friendly landscaping on all new developments; require commercial landscapers to obtain training and certification through the Green Industry BMP program; require irrigation systems per Sections 125.568, 166.048, and 373.185, F.S.; and that specify fertilizer application rates and types; and control pet waste and require that residents pick up and properly dispose of pet waste.
• Implementation of public service announcements (PSAs) on local cable or commercial television and radio stations.
• Informational pamphlets on pollution prevention, fertilizer application, Florida-friendly landscaping, water conservation, septic tank maintenance, etc. Presentations on these topics to civic groups, local businesses, students, and the general public.
• Websites to provide information on reducing nutrient pollution for homeowners and businesses.
• Inspection program and public call-in number to address illicit discharges. Credit was assigned to the entities for the above efforts as follows:
• If an entity conducted all 6 types of activities, then the full 6% reduction was assigned.
• An entity that only had FYN received a 3% reduction credit.
• An entity that only had Florida-friendly ordinances (irrigation, landscaping, fertilizer, and pet waste management) received a 2% reduction.
• An entity that only had the PSAs, websites, brochures, and the inspection program received a 1% reduction credit.
• Other combinations of efforts were analyzed on a case-by-case basis for credit.
Appendix E summarizes the public education activities conducted by each entity.
4.5.3 MUCK REMOVAL A guidance document provided to the stakeholders details the requirements to receive muck removal project credit. In summary, it is recommended that the muck deposit average minimum thickness must be 30 centimeters, the muck must be removed to the natural substrate, and the muck material must be stored away from surface waters so that the material cannot be washed back into the waterbody. The credit for muck removal is calculated by multiplying the area of muck removed by the difference in the nutrient flux rate of the muck and natural substrate. Stakeholders that receive credit for muck removal must measure post-project muck deposition rates every 5 years and report this information to FDEP. Project credit will be assigned for a period of up to 10 years after an area is dredged. If there are not adequate source controls in place in the watershed, muck will reaccumulate at a faster rate than if the watershed loads are being controlled. Appendix E shows the entities that included muck removal projects in their project tables.

FINAL Central Indian River Lagoon Basin Management Action Plan – January 2013
33
4.5.4 AQUATIC VEGETATION HARVESTING A guidance document provided to the stakeholders details the requirements to receive credit for aquatic vegetation harvesting. In summary, credit is assigned based on the type of vegetation removed, the nutrient content for that type of plant, the amount of plant material removed, and the percent dry weight of material collected. Stakeholders that harvest aquatic vegetation will determine an annual average TN and TP load removal, to be included in the BMAP as credit. Appendix E shows the entities that included aquatic vegetation projects in their project tables.
4.5.5 WATER CONTROL STRUCTURES Certain water control structures, such as tilting weir gates, were assigned a 5% TN credit based on the load that drains to the canal containing the control structure. Available data did not show that reductions in TP occurred with the tilting weir gates. Appendix E shows the entities that included water control structures in their project tables.
4.6 AGRICULTURE Table 21 gives a breakdown of agricultural land uses in the Central IRL subbasin, according to 2000 SJRWMD land use data. Figure 12 shows the approximate location of these agricultural lands in the basin.
TABLE 21: AGRICULTURAL LAND USES IN THE CENTRAL IRL BASED ON 2000 SJRWMD LAND USE DATA
LAND USE LAND COVER CODE CODE DESCRIPTION TOTAL ACRES 2120 Unimproved Pasture 4,338.6 2130 Woodland Pasture 2,353.5 2110 Improved Pasture 20,718.1 2140 Row Crop 229.1 2150 Field Crops 495.6 2200 Tree Crops 5.3 2210 Citrus 43,747.7 2240 Abandoned Tree Crops 1,153.0 2310 Poultry Feeding Operations 4.5 2410 Tree Nurseries 2.9 2430 Ornamentals 238.3 2500 Specialty Farms 93.4 2510 Horse Farms 62.7 2520 Other Open Land 94.2 2610 Fallow Cropland 2,429.4 Total Total in Central IRL 75,966.3
Land use data are helpful as a starting point for estimating agricultural acreage and developing BMP implementation strategies; however, there are inherent limitations. The time of year when these data are collected (through aerial photography) affects the accuracy of photo interpretation. This can result in the inappropriate analysis of the data and can hamper decision making. Another limitation is that the specific agricultural activity being conducted is not always apparent. For example, some acreage under the improved pasture classification may be used for cattle grazing, some may consist of forage grass that is periodically harvested and sold for hay, and/or some may comprise a fallow vegetable field awaiting planting. Operations that
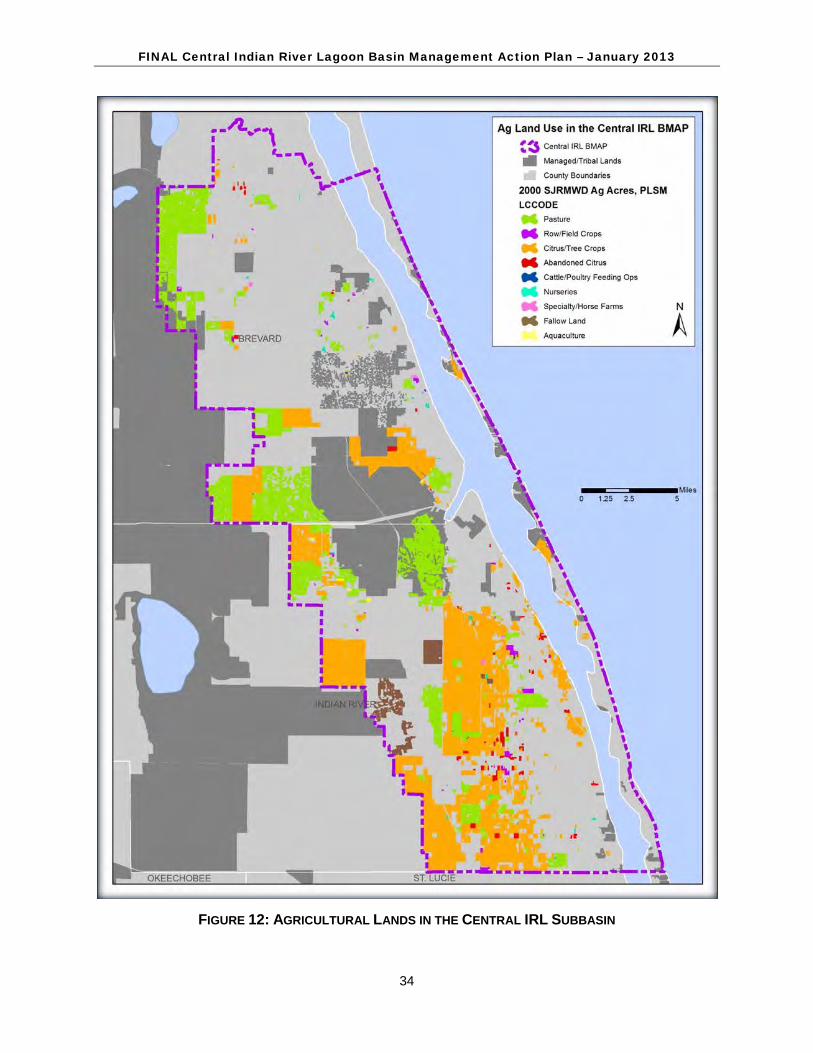
FINAL Central Indian River Lagoon Basin Management Action Plan – January 2013
34
FIGURE 12: AGRICULTURAL LANDS IN THE CENTRAL IRL SUBBASIN

FINAL Central Indian River Lagoon Basin Management Action Plan – January 2013
35
may fall into this land use category fertilize at different rates (e.g., hay operations and some other commodities typically fertilize at or below rates recommended by the University of Florida–Institute of Food and Agricultural Sciences [UF–IFAS]); therefore, it is meaningful for the purposes of evaluating potential nutrient impacts to know specific land uses.
Because of error in the collection and characterization of land use data and changes in land use over time, land use acreage estimates are subject to adjustment, as discussed later in this section.
4.6.1 AGRICULTURAL PRODUCERS’ RESPONSIBILITIES UNDER THE FWRA Paragraph 403.067(7)(b), F.S., requires that nonpoint pollutant sources (such as agriculture) included in a BMAP demonstrate compliance with pollutant reductions needed to meet a TMDL, either by implementing appropriate BMPs (adopted by FDACS or FDEP, as applicable), or conducting water quality monitoring prescribed by FDEP or the applicable water management district. If these pollutant sources do not either implement BMPs or conduct monitoring, they may be subject to enforcement by FDEP or the applicable water management district.
Under Paragraph 403.067(7)(c), F.S., the implementation of FDACS-adopted, FDEP-verified BMPs in accordance with FDACS rule provides a presumption of compliance with state water quality standards. In addition, growers who implement BMPs may be eligible for cost-share from FDACS, the water management district, or others. Through the Office of Agricultural Water Policy (OAWP) and the Florida Forest Service, FDACS develops, adopts, and assists producers in implementing agricultural BMPs to improve water quality and water conservation.
4.6.2 AGRICULTURAL BMPS BMPs are individual or combined practices determined through research, field testing, and expert review to be the most effective and practicable means for improving water quality, taking into account economic and technological considerations. Two categories of FDACS-adopted BMPs are nutrient management and irrigation management. Nutrient management includes practices related to the amount, timing, placement, and type of fertilizer. Irrigation management involves the maintenance, scheduling, and overall efficiency of irrigation systems. In several areas of the state, FDACS-funded Mobile Irrigation Labs identify and demonstrate irrigation efficiency techniques to growers. Nutrient and irrigation management are closely linked because efficient irrigation scheduling and uniform water distribution help keep nutrients in the root zone where crops can take them up, thus reducing nutrient runoff and leaching to surface and ground water. Therefore, the Mobile Irrigation Labs play an important role in both water conservation and water quality.
By definition, BMPs are technically and economically feasible. However, FDACS BMP manuals contain some BMPs that may only be affordable with financial assistance. The BMP checklists allow producers to indicate whether a BMP is not economically feasible, on a case-by-case basis. As BMP cost-share becomes available, FDACS will work with producers in the basin to implement applicable key BMPs that otherwise are not affordable. The key nutrient and irrigation management BMPs most likely to apply to agricultural operations in the basin are as follows:
• Determining Nutrient Needs o Soil and Tissue Testing: Used to base fertilizer applications on plant
needs and available nutrients in the soil; helps prevent overapplication of fertilizer.

FINAL Central Indian River Lagoon Basin Management Action Plan – January 2013
36
o Nutrient Budgeting: Adjustment of fertilizer regime to account for other nutrient sources, such as biosolids, legumes, manure, and nutrient-laden irrigation water; helps prevent overapplication of fertilizer.
• Managing Nutrient Application o Precision Application of Nutrients: Use of specialized equipment for
precise placement of nutrients on targeted areas at specified rates; reduces total amount used and prevents stray applications.
o Equipment Calibration/Maintenance: Ensures proper functioning of equipment; prevents misapplication or overapplication of fertilizer.
o Split Fertilizer Applications: Multiple applications timed with optimal growth stages; allows plants to assimilate nutrients more efficiently; reduces nutrient loss in leaching and runoff.
o Fertigation: Application of fertilizer through irrigation water; allows for direct nutrient application to the crop root zone and more efficient assimilation by plants, reducing nutrient loss in leaching and runoff.
o Controlled-Release Fertilizer: Use of fertilizer formulations that have a controlled nutrient release curve; reduces nutrient loss to leaching and runoff.
o Fertilizer Application Setbacks from Waterbodies (wetlands, watercourses, sinks, springs, etc.): Establishes a zone where no fertilizer will be applied; reduces nutrient loadings to waterbodies.
• Managing Irrigation o Irrigation Scheduling: Planning when to irrigate to reduce water and
nutrient losses, based on available soil moisture content, evapotranspiration levels, recent rainfall, and time of day.
o Monitoring Soil Moisture and Water Table: Use of devices that measure the water table level and the amount of water in the soil; is a key component of proper irrigation scheduling.
o Tailwater Recovery: Use of downgradient catchment ponds to trap irrigation tailwater to be reused on cropland; reduces offsite transport of nutrients and conserves water.
• Treatment and Erosion Control o Filter Strips: Vegetated strips of land designed to reduce nutrients and
sediments in surface water runoff from fields, pastures, and livestock high-intensity areas before they reach downstream waterbodies.
o Vegetative Buffers: Establishment of riparian and/or wetland buffers to attenuate and assimilate nutrient- or sediment-laden surface flows coming from cropped/grazed areas.
o Ditch Maintenance and Retrofits: Use of rip-rap, sediment traps, staging structures, and permanent vegetative bank cover to minimize erosion and transport of nutrient-laden sediments.
• Livestock Management (applicable to cow/calf and equine operations) o Alternative Water Sources: Use of upland livestock watering ponds
and/or water troughs; minimizes manure deposition in waterbodies.

FINAL Central Indian River Lagoon Basin Management Action Plan – January 2013
37
o Rotational Grazing: Movement of cattle to different grazing areas on a planned basis; prevents concentrated waste accumulations and denuding of pasture areas. May involve fencing.
o High-Intensity Areas Location: Siting of cowpens, supplemental feed areas, etc., away from waterbodies to minimize nutrient loadings.
• Operations Management: o Fertilizer Storage: Proper location/storage of bulk fertilizer products to
prevent nutrient loadings.
o Fertilizer Mix/Load: Use of appropriate dedicated or temporary mix/load areas located away from waterbodies to prevent nutrient loading.
o Employee Training: Training provided to farm workers on how to implement BMPs.
o Record Keeping: Proper record keeping provides accountability in the implementation of BMPs and assists the producer in making nutrient and irrigation management decisions.
OAWP BMPs and staff contact information are available at http://www.floridaagwaterpolicy.com. Printed BMP manuals can be obtained in the local extension office at county agricultural extension centers, or by contacting OAWP field staff.
4.6.3 FDACS OAWP ROLE IN BMP IMPLEMENTATION AND FOLLOW-UP
4.6.3.1 BMP Implementation The OAWP assists agricultural producers enrolled in its programs in implementing BMPs. The OAWP employs field staff and has contracts with service providers to work with producers to submit notices of intent (NOIs) to implement the BMPs appropriate for their operations. Depending on the region of the state, these providers include the soil and water conservation districts, UF–IFAS, and natural resource development and conservation councils. They also give technical assistance to producers and, as funding allows, help implement cost-share programs that leverage regional, state, and federal funds.
The OAWP will recruit producers within the Central IRL subbasin to enroll in adopted BMP programs applicable to their operations. OAWP staff and contractors will identify existing growers, to the extent possible, with the help of grower associations, information on county agricultural exemptions, field staff knowledge, and other means. Staff/contractors will assist producers in selecting the appropriate BMPs, with emphasis on nutrient management, irrigation management, sediment/erosion control, stormwater management, and record keeping.
4.6.3.2 Follow-up and Reporting on BMP Enrollment and Implementation In addition to enrolling targeted operations in the relevant BMP programs, the OAWP will do the following:
• Document the submitted NOIs, which will include a list of the BMPs to be implemented.
• Document the amount of total agricultural acreage covered by the NOIs.
• Assist growers in understanding and implementing BMPs properly.

FINAL Central Indian River Lagoon Basin Management Action Plan – January 2013
38
• On a rotating basis by program, survey enrolled operations to evaluate the level of BMP implementation and update information on ownership, land use, acreage, etc.
• Through regional field staff and contractors, follow up on identified areas/ operations of particular concern.
• Participate in annual BMAP reporting on enrollment efforts and estimated load reductions, new manuals adopted, and any new efforts planned.
The FWRA requires that, where water quality problems are demonstrated despite the proper implementation of adopted agricultural BMPs, FDACS must re-evaluate the practices, in consultation with FDEP, and modify them if necessary. Continuing water quality problems will be detected through the BMAP monitoring component and other FDEP and SJRWMD activities. If a re-evaluation of the BMPs is needed, FDACS will also include SJRWMD and other partners in the process.
4.6.4 FDEP AND SJRWMD ROLES IN BMP IMPLEMENTATION The FWRA states that nonpoint source dischargers who fail either to implement the appropriate BMPs or to conduct water quality monitoring prescribed by FDEP or a water management district may be subject to enforcement action by either of those agencies.
4.6.5 BMP ENROLLMENT GOALS AND LOAD REDUCTION ESTIMATES
4.6.5.1 BMP Enrollment Goals Table 22 summarizes the land use data figures for agriculture in the BMAP area, the acres addressed by BMP manuals, the acres enrolled in BMP programs, and the goal for enrolling additional acres in the basin. The agricultural acreage reported in this document is based on 2000 land use information from the SJRWMD.
It is important to understand that, even if all targeted agricultural operations are enrolled, not all of the acreage listed as agriculture in Table 22 will be included in enrollment figures. The NOIs will document the estimated total number of acres on which applicable BMPs are implemented, not the entire parcel acreage. This is because land use data can contain nonproduction acres (such as buildings, parking lots, and fallow acres) that will not be counted on the NOIs submitted to FDACS. There also may be significant amounts of acreage that do not need to be enrolled, such as lands that are not actively involved in commercial agriculture (operations conducted as a business). These areas are often low-density residential uses on large parcels of grassed land, or land that was but is no longer in commercial agricultural production. This information frequently is impossible to discern in the photo interpretation process used to generate land use data. Local government or FDEP BMPs may address these noncommercial sources.

FINAL Central Indian River Lagoon Basin Management Action Plan – January 2013
39
TABLE 22: AGRICULTURAL ACREAGE, BMP ENROLLMENT, AND FUTURE ENROLLMENT GOALS FOR THE CENTRAL IRL SUBBASIN
N/A = Not applicable TBD = To be determined 1 FDACS staff-adjusted acreage for the purposes of enrollment is based on a review of more recent aerial imagery in the basin and local staff observations. 2 FDACS staff have observed no active poultry operations in the BMAP area, but will confirm this. 3 See the discussion in Section 4.6.5.1.
2000 SJRWMD LAND USE 2000
ACRES
FDACS ADJUSTED ACRES FOR
ENROLLMENT1 RELATED FDACS BMP
PROGRAMS ACREAGE ENROLLED
RELATED NOIS
Pasture 27,410.2 24,691.9 Cow/Calf; Future (hay) 89.5 1 Row/Field/Mixed Crops 724.7 515.5 Vegetable/Agronomic Crops 0.0 N/A Fallow Cropland 2,429.4 N/A TBD N/A N/A Horse Farm2 62.7 57.9 Equine 0.0 N/A Citrus 43,747.7 30,670.8 Ridge Citrus; Flatwoods Citrus 23,207.1 86 Abandoned Citrus 1,153.0 N/A No Enrollment Needed N/A N/A Tree Crops 5.3 0.0 Specialty Fruit & Nut 0.0 N/A Nurseries and Vineyards 2.9 2.9 Future Nursery N/A N/A Ornamentals 238.8 200.9 Container Nursery 213.1 8 Specialty Farms 93.4 81.0 Conservation Plan Rule 0.0 N/A Cattle Feeding 4.5 4.5 Conservation Plan Rule 0.0 N/A Other Open Lands – Rural 94.2 N/A No enrollment needed N/A N/A
Total 75,966.8 56,225.4 N/A 23,509.7 95 5-Year Enrollment Goal (50%) N/A 28,112.7 N/A N/A N/A
Acreage Enrolled as of March 31, 2012 N/A 23,509.7 N/A N/A N/A
Remaining Acres to Enroll3 N/A 4,603.0 N/A N/A N/A As of March 2012, approximately 95 producers within the Central IRL subbasin had submitted NOIs covering about 23,510 acres to implement FDACS-adopted BMPs. This represents 86 citrus groves, 8 container nurseries, and 1 cow/calf operation. No producers are conducting water quality monitoring in lieu of implementing BMPs at this time. Figure 13 shows the acres enrolled in BMPs as of March 2012.
FDACS field staff will focus on enrolling the remaining citrus and cow/calf operations in the first phase of the BMAP. As resources allow, staff also will work to enroll other commercial agricultural operations within the basin, including row/field crops and equine operations.
4.6.5.2 Agricultural Load Estimates Due to inaccuracies in the 2000 land use data and changes in land use since 2000, agricultural loadings may be less than perceived. However, there are no detailed allocations in this BMAP, and so the total estimated load or required reductions for agriculture are not defined. An estimated average load reduction percentage was derived for agriculture in the basin based on methods developed for the Lake Okeechobee watershed, because methods specific to the IRL Basin have not been developed. The percentages represent the relative amount of TN and TP reduction expected for “typical” agricultural BMP implementation, which includes nutrient management, stormwater retention, limited wetland retention/restoration, and rotational livestock grazing practices, as applicable to the commodity and operation. For the Central IRL subbasin, the implementation of BMPs should reduce agricultural loadings of TN and TP by approximately 30%. Table 23 summarizes the expected reductions from 50% BMP implementation and reductions associated with changes in agricultural land uses since the 2000 land use coverage from the TMDL.

FINAL Central Indian River Lagoon Basin Management Action Plan – January 2013
40
FIGURE 13: BMP ENROLLMENT IN THE CENTRAL IRL SUBBASIN AS OF MARCH 2012

FINAL Central Indian River Lagoon Basin Management Action Plan – January 2013
41
TABLE 23: AGRICULTURAL TN AND TP ESTIMATED REDUCTIONS IN THE FIRST FIVE YEARS
CENTRAL IRL ESTIMATED LOADS TN
(LBS/YR) TP
(LBS/YR) Load Reductions via BMPs, 50% Target Enrollment 26,852 3,684.8 Credit for Changes to Urban Land Use 94,996 22,033.5 Credit for Changes to Less Intensive/Fallow Agricultural Land Use 26,072 29,605.9 Total Estimated Reductions 147,920 55,324.2
The region is expected to continue the shift from agricultural to residential land uses, further reducing the agricultural load. More precise information will be incorporated into the next iteration of the TMDL and/or the BMAP. If FDEP needs an estimate of agricultural loadings in the future, the refinement of a basin- and commodity-specific agricultural loading/reduction model should be considered.
4.6.5.3 Beyond BMPs Under the FWRA, when FDEP adopts a BMAP that includes agriculture, it is the agricultural producer’s responsibility to implement BMPs adopted by FDACS and verified as effective by FDEP in helping to achieve load reductions. If acreage adjustments and BMP implementation do not fully account for the current agricultural load reduction allocation, it may be necessary to develop and implement cost-assisted field- and/or regional-level treatment options that remove nutrients from farm discharges. In that case, FDACS will work with FDEP and the SJRWMD to identify appropriate options for achieving further agricultural load reductions.
4.7 REGIONAL PROJECTS In addition to the projects completed by the stakeholders in the Central IRL subbasin, several regional projects built with state and federal funding have also improved water quality in the subbasin. Future components of these projects will change the watershed loading from the Central IRL stakeholders in these areas because some of the water will be rediverted from the IRL Basin to the USJR Basin. These projects are described in the subsections below.
4.7.1 C-1 REDIVERSION PROJECT The Central IRL is largely affected by the C-1 Canal, which is part of the Melbourne-Tillman WCD. The purpose of this canal is to provide flood protection to approximately 80,000 people in a 98 square-mile area, encompassing a large portion of Palm Bay and West Melbourne. However, discharges from the C-1 are responsible for up to 80% of Turkey Creek’s annual loading of nutrients to the Central IRL; this affects the lagoon’s water quality, adds to the muck deposition in both the lagoon and Turkey Creek, and limits seagrass coverage along a 10- to 20mile portion of the lagoon. Large discharges from C-1 have also caused dramatic declines in salinity, affecting the lagoon’s ecosystem (SJRWMD 2008). To address these issues, the SJRWMD and Melbourne-Tillman WCD are implementing the C-1 rediversion project.
The first phase of the project, completed in 2011, rediverts runoff from the Melbourne-Tillman WCD that currently drains to the IRL back into the USJR Basin, which is how the water historically drained. Phase 1 of the project consisted of replacing the MS-1 structure gates on the C-1, creating the C-1 Retention Area to store stormwater runoff, and creating the Sawgrass Lake Water Management Area (WMA) to receive pumped discharge from the Melbourne-Tillman WCD canals so that the water can be treated before it is released to the USJR Basin. The first phase of the project is estimated to reduce annual discharge volume by 28%. For the C-1 basin, this equates to a 28% reduction in annual loading, achieving approximately 50% of

FINAL Central Indian River Lagoon Basin Management Action Plan – January 2013
42
the TN reduction required by the TMDL and 100% of the required TP reduction. The expected reductions from the first phase of the project are 92,860 lbs/yr of TN and 10,847 lbs/yr of TP.
A proposed second phase of the project includes the creation of the C-10 Retention Area. This area will receive pumped discharge from the Melbourne-Tillman WCD canals for treatment before the water is released to the Three Forks Marsh Conservation Area. Five design alternatives for Phase 2 are under evaluation as of the date of this report (SJRWMD 2011).
With both phases of the C-1 rediversion project in place, there would be an estimated reduction in average annual discharge volume of 41% to 46% (SJRWMD 2011). This equates to a 54% to 59% reduction in the current annual loading. The current C-1 basin loads, based on 2000 land uses, are estimated to be 331,644 lbs/yr of TN and 38,739 lbs/yr of TP. Therefore, the expected reductions from both phases of the rediversion project are 179,088 to 195,670 lbs/yr of TN and 20,919 to 22,856 lbs/yr of TP. These reductions would achieve 70% to 80% of the TN reductions required by the TMDL for the C-1 basin and would exceed the TP reductions required by the TMDL for this area (SJRWMD 2012a).
4.7.2 UPPER ST. JOHNS RIVER PROJECT AND C-54 In the 1950s, the U.S. Army Corps of Engineers (USACE) began planning a flood control project in the USJR Basin. The original project involved a series of flood storage reservoirs and a network of canals to divert excess floodwaters from the USJR to the IRL. Portions of this project, including C-54, were constructed by 1973, when construction was stopped by President Richard Nixon because of an Environmental Impact Statement, which found that the project had unacceptable impacts on the environment. One of these environmental impacts was the harm that freshwater diversion caused to the IRL (SJRWMD 2010a).
C-54 is located along the Brevard County and Indian River County line and was originally designed to divert up to 6,000 cubic feet per second of water from the St. Johns River to the IRL through the Sebastian River. Environmental studies found that this freshwater diversion would significantly reduce the shellfish population in the IRL and would cause swings in the salinity of the lagoon, impacting other fish and wildlife resources.
In 1977, the SJRWMD took over the project area and designed a plan with the USACE to revitalize the St. Johns River’s flow by reclaiming drained marshlands, plugging canals, and building reservoirs. As part of this project, C-54 is no longer directly connected to the St. Johns River. The components of the USJR project that reduced discharges through the C-54 to the IRL were completed by 1996.
The C-54 now only serves as an emergency overflow for the St. Johns WMA to ensure that extreme flood events do not overtop the flood protection levees (SJRWMD 2010a). However, discussions on the C-54 operations are ongoing, and flows through the canal could be changed in the future. Since 1996, discharges through C-54 have only occurred during three major storm events: (1) an unidentified storm in 1999, (2) hurricanes in 2004, and (3) Tropical Storm Fay in 2008.
The SJRWMD is currently working on the Fellsmere WMA, which is located adjacent to the USJR Basin project and will provide the means to reconnect large areas of the floodplain in this area. One of the anticipated benefits of the project is that the frequency of discharges through the C-54 to the IRL will decrease to less than a 1-in-100-year storm event (SJRWMD 2010b). The IRL seagrass beds should benefit from decreases in the interbasin discharge of agricultural stormwater runoff from the farming areas in the USJR into the adjacent coastal lagoon system (SJRWMD 2012b). The Fellsmere WMA should be completed in 2015 (SJRWMD 2010b).

FINAL Central Indian River Lagoon Basin Management Action Plan – January 2013
43
CHAPTER 5: ASSESSING PROGRESS AND MAKING CHANGES Successful BMAP implementation requires commitment and follow-up. In the Commitment to Plan Implementation (see Chapter 6), stakeholders have expressed their intention to carry out the plan, monitor its effect, and continue to coordinate within and across jurisdictions to achieve seagrass targets. The FWRA requires that an assessment be conducted every 5 years to determine whether there is reasonable progress in implementing the BMAP and achieving seagrass depth limit targets. This chapter contains details on future seagrass evaluations, tracking implementation of efforts, adaptive management of the BMAP, water quality monitoring, and research priorities that will provide information sufficient to assess progress and make the necessary changes.
5.1 SEAGRASS TARGET EVALUATION In Year 4 of the BMAP, FDEP will use the 2007, 2009, 2011, and 2013 seagrass mapping data, which will likely be the latest data at that time, in the 2-step approach for compliance (see Section 0) to reassess whether the Central IRL project zones continue to be compliant. If the project zones continue to meet the TMDL depth limit targets, there will be 7 mapping years or 11 calendar years (2003–13) indicating a trend of success, and a second BMAP would not be needed. If during this assessment any of the project zones no longer meet Step 1 and Step 2 compliance, FDEP would ask for stakeholders in that project zone or zones to make nutrient reductions in the second iteration of the BMAP process. It should be noted that even if a second BMAP is not needed after the first 5-year iteration, future assessments of the Central IRL could identify a nutrient impairment (rather than a seagrass impairment) that would need to be addressed through a future BMAP.
5.2 TRACKING IMPLEMENTATION FDEP will work with the stakeholders to organize the monitoring data and track project implementation. This information will be presented to the stakeholders in an annual report. The stakeholders will meet at least every 12 months after BMAP adoption to follow up on plan implementation, share new information, and continue to coordinate on TMDL-related issues. The following types of activities may occur at annual meetings:
• Implementation Data and Reporting o Review project implementation information from the stakeholders.
o Discuss the data collection process, including any concerns and possible improvements to the process.
o Review the monitoring plan implementation, as detailed in Section 5.3.
• Sharing New Information o Report on seagrass depth limit evaluation results compared with the TMDL
seagrass depth limit targets, using the Step 1 and Step 2 evaluations for compliance.
o Report on results from water quality monitoring and trend information.
o Provide updates on new projects and programs in the basin that will help reduce nutrient loading.
FINAL Central Indian River Lagoon Basin Management Action Plan – January 2013
44
o Identify and review new scientific developments on addressing nutrient loading and incorporate any new information into annual progress reports.
• Coordinating TMDL-Related Issues
o Provide updates from FDEP on the basin cycle and activities related to any impairments, TMDLs, and BMAPs.
o Obtain reports from other basins where tools or other information may be applicable to the Central IRL TMDLs.
Covering all of these topics at the annual meetings is not required, but the list provides examples of the types of information that should be considered for the agenda to assist with BMAP implementation and improve coordination among the agencies and stakeholders. Updates on project implementation, seagrass depth limit target evaluations, and water quality data should be presented, as information becomes available.
5.3 ADAPTIVE MANAGEMENT MEASURES Adaptive management involves setting up a mechanism for making adjustments in the BMAP when circumstances change or feedback indicates the need for a more effective strategy. Adaptive management measures include the following:
• Procedures to determine whether additional cooperative strategies are needed;
• Criteria/processes for determining whether and when plan components need revision due to changes in costs, environmental impacts, social effects, watershed conditions, or other factors; and
• Descriptions of the stakeholders’ role after BMAP completion. Key components of adaptive management include sharing information and expertise, tracking plan implementation, monitoring water quality and pollutant loads, and holding periodic meetings. FDEP and the stakeholders will track implementation efforts and monitor water quality. The stakeholders will meet at least every 12 months to discuss compliance with the seagrass targets and to consider new information.
5.4 SEAGRASS AND WATER QUALITY MONITORING This monitoring plan is designed to track seagrass distribution and identify long-term water quality trends in response to BMAP project implementation. Sampling stations, parameters, frequency, and other elements of this strategy may be modified as appropriate to match changing environmental conditions, funding resources, and understanding of the IRL system. However, any modifications made will not affect the ability of the monitoring network to fulfill the objectives noted below.
5.4.1 OBJECTIVES Focused objectives are critical for a monitoring strategy to provide the information needed to evaluate implementation success. The purpose of the primary monitoring is to assess progress towards the TMDL seagrass depth limit targets through the seagrass flyover mapping and aerial photography interpretation; this is the only required component of the monitoring plan. This information is required to determine compliance with the TMDLs. The purpose of the secondary monitoring is to assess water quality trends in the Central IRL to determine if watershed nutrient

FINAL Central Indian River Lagoon Basin Management Action Plan – January 2013
45
loading is decreasing, resulting in improved lagoon water quality, which will allow seagrass to grow to target depths. The water quality data are used to support the seagrass evaluations, but are not required to assess compliance with the TMDL and are, therefore, not a required component of this BMAP monitoring plan.
5.4.2 MONITORING PARAMETERS, FREQUENCY, AND NETWORK To achieve the primary monitoring objective, the main parameter that will be tracked is the seagrass depth limits by project zone, which are identified through the flyover mapping and aerial photography interpretation. FDEP, in conjunction with the SJRWMD, is taking the lead on funding and conducting the flyovers and mapping. In the past, SJRWMD has typically conducted seagrass mapping every two years, and FDEP will try to maintain this frequency for the BMAP monitoring plan. The aerial photography is taken in spring to mid-summer, which is during the seagrass growing season. Ground truthing efforts are conducted after the flyovers to verify the aerial images. Using the aerial photography, a map is created showing seagrass extent in the lagoon. These maps will be used in future evaluations to assess progress towards the TMDL seagrass depth limit targets for the Central IRL subbasin.
To achieve the secondary objective above, the existing SJRWMD monthly stations in the Central IRL subbasin will be monitored. There are also 2 tributary stations that SJRWMD is proposing to resume sampling, if funding becomes available. At these stations, SJRWMD analyzes the following parameters:
• Total Kjeldahl Nitrogen (TKN)
• Nitrite/Nitrate
• Ammonia
• TP
• Orthophosphate
• Chlorophyll-a (corrected)
• Photosynthetically active radiation (PAR)
• True Color
• Turbidity
• TSS
• Dissolved Oxygen (DO)
• Specific Conductivity
• pH
• Salinity
• Secchi Depth
• Depth of Collection
• Total Depth of Sample Site
• Water Temperature
• Field Conditions
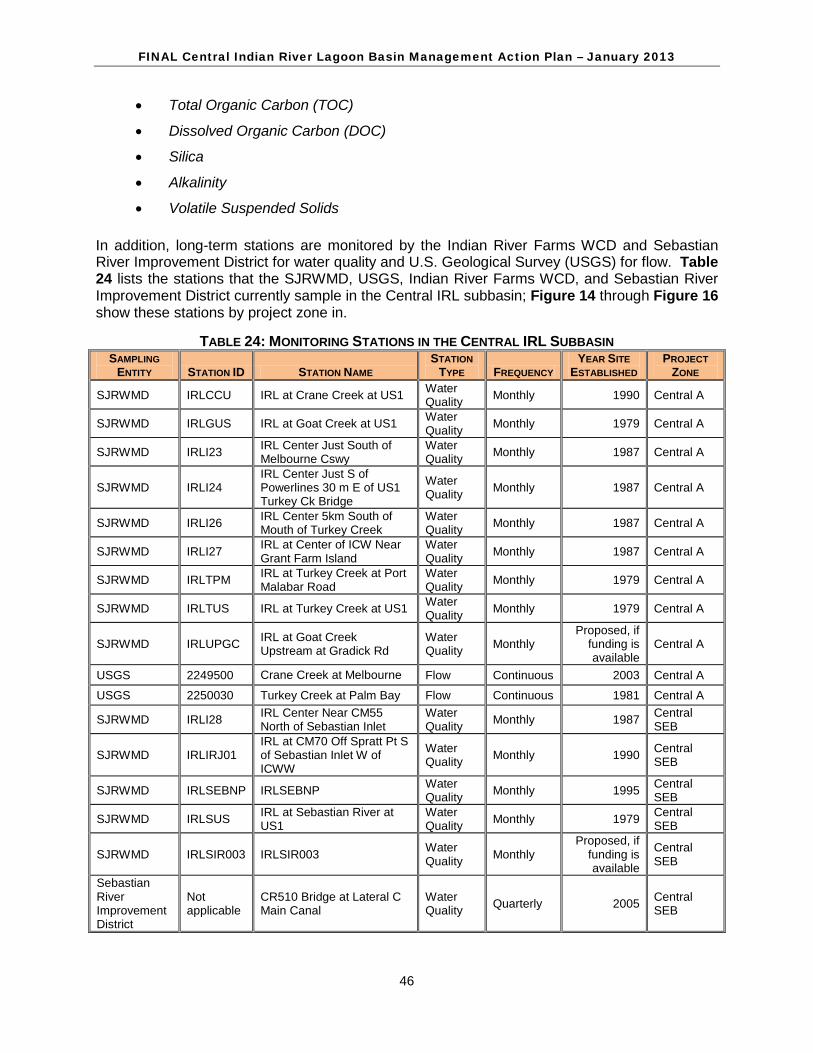
FINAL Central Indian River Lagoon Basin Management Action Plan – January 2013
46
• Total Organic Carbon (TOC)
• Dissolved Organic Carbon (DOC)
• Silica
• Alkalinity
• Volatile Suspended Solids In addition, long-term stations are monitored by the Indian River Farms WCD and Sebastian River Improvement District for water quality and U.S. Geological Survey (USGS) for flow. Table 24 lists the stations that the SJRWMD, USGS, Indian River Farms WCD, and Sebastian River Improvement District currently sample in the Central IRL subbasin; Figure 14 through Figure 16 show these stations by project zone in.
TABLE 24: MONITORING STATIONS IN THE CENTRAL IRL SUBBASIN SAMPLING
ENTITY STATION ID STATION NAME STATION
TYPE FREQUENCY YEAR SITE
ESTABLISHED PROJECT
ZONE
SJRWMD IRLCCU IRL at Crane Creek at US1 Water Quality Monthly 1990 Central A
SJRWMD IRLGUS IRL at Goat Creek at US1 Water Quality Monthly 1979 Central A
SJRWMD IRLI23 IRL Center Just South of Melbourne Cswy
Water Quality Monthly 1987 Central A
SJRWMD IRLI24 IRL Center Just S of Powerlines 30 m E of US1 Turkey Ck Bridge
Water Quality Monthly 1987 Central A
SJRWMD IRLI26 IRL Center 5km South of Mouth of Turkey Creek
Water Quality Monthly 1987 Central A
SJRWMD IRLI27 IRL at Center of ICW Near Grant Farm Island
Water Quality Monthly 1987 Central A
SJRWMD IRLTPM IRL at Turkey Creek at Port Malabar Road
Water Quality Monthly 1979 Central A
SJRWMD IRLTUS IRL at Turkey Creek at US1 Water Quality Monthly 1979 Central A
SJRWMD IRLUPGC IRL at Goat Creek Upstream at Gradick Rd
Water Quality Monthly
Proposed, if funding is available
Central A
USGS 2249500 Crane Creek at Melbourne Flow Continuous 2003 Central A
USGS 2250030 Turkey Creek at Palm Bay Flow Continuous 1981 Central A
SJRWMD IRLI28 IRL Center Near CM55 North of Sebastian Inlet
Water Quality Monthly 1987 Central
SEB
SJRWMD IRLIRJ01 IRL at CM70 Off Spratt Pt S of Sebastian Inlet W of ICWW
Water Quality Monthly 1990 Central
SEB
SJRWMD IRLSEBNP IRLSEBNP Water Quality Monthly 1995 Central
SEB SJRWMD IRLSUS IRL at Sebastian River at
US1 Water Quality Monthly 1979 Central
SEB
SJRWMD IRLSIR003 IRLSIR003 Water Quality Monthly
Proposed, if funding is available
Central SEB
Sebastian River Improvement District
Not applicable
CR510 Bridge at Lateral C Main Canal
Water Quality Quarterly 2005 Central
SEB

FINAL Central Indian River Lagoon Basin Management Action Plan – January 2013
47
SAMPLING ENTITY STATION ID STATION NAME
STATION TYPE FREQUENCY
YEAR SITE ESTABLISHED
PROJECT ZONE
USGS 2251500 N. Prong St Sebastian River nr Micco Flow Continuous 1987 Central
SEB USGS 2251000 South Prong St. Sebastian
River nr Sebastian Flow Continuous 1993 Central SEB
SJRWMD IRLIRJ04 IRL at CM123 East of ICWW
Water Quality Monthly 1990 Central B
SJRWMD IRLIRJ05 IRL at CM135 East of ICWW
Water Quality Monthly 1990 Central B
SJRWMD IRLIRJ07 IRL at CM150 West of ICWW
Water Quality Monthly 1990 Central B
SJRWMD IRLIRJ08 IRL at CM158 West of ICWW
Water Quality Monthly 1990 Central B
SJRWMD IRLVMC IRL at Vero Main Canal at US1
Water Quality Monthly 1989 Central B
SJRWMD IRLVNC IRL at Vero North Canal at US1
Water Quality Monthly 1989 Central B
SJRWMD IRLVSC IRL at Vero South Canal at US1
Water Quality Monthly 1989 Central B
USGS 2251767 Fellsmere Canal nr Micco Flow Continuous 1991 Central B USGS 2252500 North Canal nr Vero Beach Flow Continuous 1950 Central B USGS 2253000 Main Canal at Vero Beach Flow Continuous 1949 Central B USGS 2253500 South Canal nr Vero Beach Flow Continuous 1950 Central B Indian River Farms WCD
Not applicable North Relief Sample Point Water
Quality Quarterly 1996 Central B
Indian River Farms WCD
Not applicable Main Canal Sample Point Water
Quality Quarterly 1996 Central B
Indian River Farms WCD
Not applicable South Relief Sample Point Water
Quality Quarterly 1996 Central B
5.4.3 DATA MANAGEMENT AND ASSESSMENT The Florida STORET database serves as the primary repository of ambient water quality data for the state of Florida. FDEP pulls water quality data used for impaired water evaluations and TMDL development directly from the STORET database. Ambient water quality data collected as part of the BMAP will be uploaded into STORET for long-term storage and availability. SJRWMD, FDEP, and some local stakeholders currently upload water quality data into STORET. All BMAP data providers have agreed to upload ambient water quality data to STORET at least once every six months, upon completion of the appropriate quality assurance/quality control checks.
Other data, such as biological and storm event, may also be collected, but the STORET database is not equipped to store these types of data. Stakeholders agree to provide these data to other BMAP partners upon request, and when appropriate, for inclusion in BMAP data analyses and adaptive management evaluations.

FINAL Central Indian River Lagoon Basin Management Action Plan – January 2013
48
FIGURE 14: MONITORING NETWORK IN THE CENTRAL A PROJECT ZONE

FINAL Central Indian River Lagoon Basin Management Action Plan – January 2013
49
FIGURE 15: MONITORING NETWORK IN THE CENTRAL SEB PROJECT ZONE

FINAL Central Indian River Lagoon Basin Management Action Plan – January 2013
50
FIGURE 16: MONITORING NETWORK IN THE CENTRAL B PROJECT ZONE

FINAL Central Indian River Lagoon Basin Management Action Plan – January 2013
51
The water quality data will be analyzed after four years of BMAP implementation to determine trends in water quality in the lagoon. A wide variety of statistical methods are available for trend analyses. The selection of an appropriate data analysis method depends on the frequency, spatial distribution, and period of record available from existing data. Specific statistical analyses were not identified during BMAP development; however, commonly accepted methods of data analysis will be used that are consistent with the TMDL model.
5.4.4 QUALITY ASSURANCE/QUALITY CONTROL Stakeholders participating in the monitoring plan must collect water quality data in a manner consistent with FDEP’s standard operating procedures (SOPs) for quality assurance/quality control. The most current version of these procedures can be downloaded from http://www.dep.state.fl.us/water/sas/sop/sops.htm. For BMAP-related data analyses, entities should use National Environmental Laboratory Accreditation Council (NELAC) National Environmental Laboratory Accreditation Program (NELAP) certified laboratories (http://www.dep.state.fl.us/labs/cgi-bin/aams/index.asp) or other labs that meet the certification and other requirements outlined in the SOPs. SJRWMD staff and contractors collect, process, and preserve samples according to the SJRWMD’s Standard Operating Procedures for the Collection of Surface Water Quality Samples and Field Data–Feb. 13, 2004. Where SJRWMD and FDEP SOPs do not correspond to one another, SJRWMD staff and contractors defer to FDEP’s SOPs.
5.5 RESEARCH PRIORITIES During the BMAP process, the stakeholders identified several research priorities they would like to pursue, if funding becomes available. The Indian River Lagoon 2011 Superbloom Plan of Investigation (SJRWMD et al. 2012) addresses or complements a number of the listed priorities. These research topics include the following:
• Collecting data to update the bathymetry for the IRL Basin that would be used in the seagrass depth limit evaluations.
• Continuing and increasing the frequency of the monitoring along the existing seagrass transects to track seagrass composition, density, and extent.
• Implementing phytoplankton, drift algae, and macroalgae monitoring in the basin.
• Implementing storm event monitoring at the major outfalls.
• Tracking watershed loads by monitoring inflow and outflow nutrient concentrations for each jurisdiction.
• Verifying the BMP effectiveness values used in the BMAP, as needed.
• Collecting data on the nutrient load reduction that results from WCD staging/ retaining stormwater runoff.
• Collecting data on ground water nutrient concentrations and volume reaching the tributaries and IRL.
• Collecting data on nutrient flux/internal recycling of legacy nutrient loads held within the IRL sediments and exchanged with the water column.

FINAL Central Indian River Lagoon Basin Management Action Plan – January 2013
52
During the first iteration of the BMAP, the stakeholders will work with FDEP and IRL NEP to identify other research needs, prioritize these needs, and develop scopes of work to address each research priority. This information will be organized in a more detailed research plan that would be used to guide future efforts, as funding becomes available. These research projects are not BMAP requirements, but would provide valuable information for future assessments of the health of the Central IRL.

FINAL Central Indian River Lagoon Basin Management Action Plan – January 2013
53
CHAPTER 6: SOUTHERN IRL While developing this Central IRL BMAP, FDEP identified a potential connection with the portion of the IRL located immediately to the south of the Central IRL subbasin. This is WBID 3190, and drainage from the C-25 west and east segments (WBIDs 3160 and 3163B) and Fort Pierce Farm Canal (WBID 3163) drain to this segment of the IRL (refer to Figure 17). It appears that there is a hydrologic connection between WBID 3190 and WBID 5003B, which is the southernmost WBID in the Central IRL subbasin. Based on this connection, FDEP and the stakeholders in the southern IRL area agreed to include projects in the BMAP, as projects implemented in the southern IRL subbasin will benefit the Central IRL subbasin. However, any projects provided by the southern IRL stakeholders are not a BMAP requirement, and the project schedule does not represent a compliance plan.
6.1 HISTORY OF IMPAIRMENTS AND TMDL DEVELOPMENT FDEP listed WBID 3190 as impaired in 2004 for chlorophyll-a, with TN and TP as the causative pollutants. In 2009, this WBID was also found to be impaired for dissolved oxygen (DO), with TP as the causative pollutant. As of the time of this report, FDEP has not drafted TMDLs for these impairments. However, FDEP has been working with the South Florida Water Management District (SFWMD) to determine an appropriate seagrass or water quality target for this WBID.
The Fort Pierce Farm Canal was listed as impaired in 2004 for DO caused by nutrients (TN and TP), and in 2009 for chlorophyll-a, also caused by nutrients. The C-25 east segment was listed as impaired in 2004 for chlorophyll-a and DO, both caused by nutrients (TN and TP). In addition, the C-25 west segment was found to be impaired in 2009 for DO caused by biochemical oxygen demand. These waterbodies were also included in the 1998 Consent Decree as part of the EPA’s commitment to develop TMDLs. In June 2012, the EPA proposed draft TMDLs for the C-25 and Fort Pierce Farm Canal as part of the Consent Decree, and FDEP, in the future, may also consider establishing TMDLs for these waterbodies.
6.2 CONSIDERATIONS There are several unknowns about the southern IRL subbasin that should be addressed during this BMAP iteration to help with state TMDL development and to ensure future watershed management cycles use the most accurate information possible:
• Connection to the Central IRL – Further investigation into the connection between WBID 3190 in the southern IRL subbasin and WBID 5003B in the Central B project zone is needed. A preliminary review of data for these WBIDs found a similarity in water quality that could indicate a hydrological connection. Additional review of the water quality data, hydrological data, and depths of the lagoon in each WBID should be made to determine the extent of the connection. Based on this review, a determination can then be made as to whether WBID 3190 should be part of the Central B project zone in the future or if it should continue to be evaluated separately.

FINAL Central Indian River Lagoon Basin Management Action Plan – January 2013
54
FIGURE 17: SOUTHERN INDIAN RIVER LAGOON PORTION

FINAL Central Indian River Lagoon Basin Management Action Plan – January 2013
55
• Basin Boundary – During the BMAP process, the stakeholders noted that the current basin boundary is incorrect. The area south of the C-25 drains to the south instead of to the IRL, and a small area in the northwestern part of the basin near the Turnpike is pumped to the north, outside of the IRL Basin. FDEP and SFWMD staff are reviewing the hydrology of the area and will update the basin boundaries, as needed.
• Changes in Water Flows – Several regional projects (see Section 6.4.4) are planned in the southern IRL subbasin, which will reduce the amount of watershed runoff to the IRL. In addition, the feasibility of reconnecting infrastructure between the SFWMD and SJRWMD is being examined, which would further reduce the amount of water going to the lagoon from this area. Depending on the extent of the projects implemented, the amount of flow and loading from this area to the IRL could be greatly reduced in the future.
• Development of TMDLs – As noted above in Section 6.1, none of the impaired waterbodies in the southern IRL subbasin have adopted TMDLs. FDEP will work with the stakeholders as they develop targets and TMDLs for this area. Once TMDLs are adopted, a determination will be made about whether to continue to include this area in the Central IRL BMAP or if a separate BMAP will be needed to assign any necessary reductions.
6.3 SOUTHERN IRL SUBBASIN SETTING
6.3.1 LAND USE COVERAGE Based on the 2000 land use coverage, the predominant land use in the southern IRL subbasin is agriculture, which accounts for 67.7% of the total 155,144 acres (see Table 25). Urban and built-up; barren land; and transportation, communication, and utilities make up 7.9% of the total area. The remaining 24.4% of the subbasin is natural lands, including upland forests, upland nonforested, water, and wetlands.
TABLE 25: 2000 LAND USES IN THE SOUTHERN IRL SUBBASIN LAND USE TYPE ACRES %
Agriculture 105,055 67.7% Wetlands 15,993 10.3% Water 10,079 6.5% Urban and Built-Up 8,238 5.3% Upland Forests 7,385 4.8% Upland Nonforested 4,354 2.8% Transportation, Communication, and Utilities 2,817 1.8% Barren Land 1,223 0.8%
TOTAL 155,144 100.0%
6.3.2 POLLUTANT SOURCES The primary source of nutrient loading in the basin is agriculture. There are also four MS4s in the southern IRL subbasin, as listed in Table 26. In addition, Fort Pierce Farms WCD, North St. Lucie River WCD, and the town of St. Lucie Village are non-MS4s in the subbasin.

FINAL Central Indian River Lagoon Basin Management Action Plan – January 2013
56
TABLE 26: MS4S IN THE SOUTHERN IRL SUBBASIN PERMITTEE PERMIT NUMBER PHASE
St. Lucie County FLR04E029 II City of Fort Pierce FLR04E065 II FDOT District 4 FLR04E083 II Turnpike Enterprise FLS000016 I
6.4 MANAGEMENT ACTIONS
6.4.1 AGRICULTURE The primary agricultural land use in the southern IRL subbasin is citrus. Other agricultural land uses include cow-calf operations (pasture), nurseries, row/field crops, and dairies. Due to urban encroachment, citrus health issues (freeze/disease), and the extended economic downturn, many citrus, row crop, and nursery operations either have been abandoned or have significantly lowered their production acreage. In recent years, some of this acreage may have been shifted to other commodities. A review of the most recent aerial imagery for the basin was not conclusive with regard to abandoned or converted acreage, as there has not been as much urban conversion in this basin as in the other IRL subbasins. According to records from the Division of Plant Industry within FDACS, there may be as many as 19,000 acres of abandoned citrus in the southern IRL (see Figure 19), but some of these acres may be used for cattle grazing or may have been recently replanted. FDACS will consult with field staff and local contractors during the first phase of the BMAP to provide additional information on the extent of remaining agriculture in this basin
Table 27 gives a breakdown of agricultural land uses in the southern IRL subbasin, according to 2008 SFWMD land use data. Since this area does not have an established TMDL, FDACS chose to review the most recent land use data rather than the period of record data referenced in the IRL TMDLs. Figure 18 shows the approximate location of these agricultural lands in the subbasin, and Figure 19 includes the location of inactive citrus blocks.
TABLE 27: AGRICULTURAL LAND USES IN THE SOUTHERN IRL SUBBASIN BASED ON 2008 SFWMD LAND USE DATA
LAND USE LAND COVER CODE CODE DESCRIPTION TOTAL ACRES 2120 Unimproved Pasture 4,811.1 2130 Woodland Pasture 4,330.9 2110 Improved Pasture 23,327.4 2140 Row Crop 2,788.4 2150 Field Crops 970.5 2200 Tree Crops 223.7 2210 Citrus 63,383.8 2240 Abandoned Tree Crops 4,003.6 2430 Ornamentals 299.6 2500 Specialty Farms 14.8 2510 Horse Farms 86.7 2520 Dairies 751.7 Total Total in Southern IRL 104,992.2

FINAL Central Indian River Lagoon Basin Management Action Plan – January 2013
57
FIGURE 18: AGRICULTURAL LAND USE WITHIN THE SOUTHERN IRL SUBBASIN

FINAL Central Indian River Lagoon Basin Management Action Plan – January 2013
58
FIGURE 19: AGRICULTURAL LAND USE AND INACTIVE CITRUS BLOCKS WITHIN THE SOUTHERN IRL SUBBASIN

FINAL Central Indian River Lagoon Basin Management Action Plan – January 2013
59
6.4.1.1 BMP Enrollment Goals Table 28 summarizes the land use data figures for agriculture in the southern IRL area, acres addressed by BMP manuals, acres enrolled in BMP programs, and goal for enrolling additional acres in the subbasin. The agricultural acreage reported in this document is based on 2008 land use information from the SFWMD. It is important to understand that, even if all targeted agricultural operations are enrolled, not all of the acreage listed as agriculture in Table 28 will be included in enrollment figures. The NOIs will document the estimated total number of acres on which applicable BMPs are implemented, not the entire parcel acreage. This is because land use data can contain nonproduction acres (such as buildings, parking lots, and fallow acres) that will not be counted on the NOIs submitted to FDACS. There also may be significant amounts of acreage that do not need to be enrolled, such as lands that are not actively involved in commercial agriculture (operations conducted as a business). These areas are often low-density residential uses on large parcels of grassed land, or land that was but is no longer in commercial agricultural production. This information frequently is impossible to discern in the photo interpretation process used to generate land use data. Local government or FDEP BMPs may address these noncommercial sources.
As of March 2012, approximately 57 producers within the southern IRL subbasin had submitted 206 NOIs covering about 90,718 acres to implement FDACS-adopted BMPs. This represents 185 citrus groves, 7 container nurseries, 9 cow/calf operations, and 5 dairies under the Lake Okeechobee Protection Program (conservation plan). No producers are conducting water quality monitoring in lieu of implementing BMPs at this time. Figure 20 is a map of the acres enrolled in BMPs as of March 2012. FDACS field staff will focus on enrolling the remaining citrus and cow/calf operations in the first phase of the BMAP. As resources allow, staff also will work to enroll other commercial agricultural operations within the basin, including row/field crops and equine operations.
TABLE 28: AGRICULTURAL ACREAGE, BMP ENROLLMENT, AND FUTURE ENROLLMENT GOALS FOR THE SOUTHERN IRL SUBBASIN
N/A = Not applicable 1 FDACS staff-adjusted acreage for purposes of enrollment is based on a review of more recent aerial imagery in the basin and local staff observations. 2 The land use acres for dairies represent only the high intensity areas, whereas the NOIs also typically include all associated grazed pasture land. However, since it impossible for OAWP staff to accurately break down the high-intensity acreage and pasture acreage in every dairy conservation plan, the enrolled dairy acres are all shown here. 3 Please see discussion in Section 6.4.1.1.
2008 SFWMD LAND USE 2008
ACRES
FDACS ADJUSTED ACRES FOR ENROLLMENT1
RELATED FDACS BMP PROGRAMS
ACREAGE ENROLLED
RELATED NOIS
Pasture 32,469.4 32,469.4 Cow/Calf; Future (hay) 24,118.5 9 Row/Field/Mixed Crops 3,758.8 3,758.8 Vegetable/Agronomic Crops 0.0 N/A Horse Farm 86.7 86.7 Equine 0.0 N/A Citrus 63,383.8 63,383.8 Ridge Citrus; Flatwoods Citrus 46,574.1 185 Abandoned Citrus 4,003.6 N/A No enrollment needed N/A N/A Tree Crops 223.7 223.7 Specialty Fruit & Nut 0.0 N/A Ornamentals 299.6 299.6 Container Nursery 690.1 7 Specialty Farms 14.8 14.8 Conservation Plan Rule 0.0 N/A Dairies2 751.7 751.7 Conservation Plan Rule 19,335.1 5
Total 104,992.1 100,988.5 N/A 90,717.8 206 5-Year Enrollment Goal (90%) N/A 90,889.7 N/A N/A N/A
Acreage Enrolled as of March 2012 N/A 90,717.7 N/A N/A N/A Remaining Acres to Enroll3 N/A 170.0 N/A N/A N/A

FINAL Central Indian River Lagoon Basin Management Action Plan – January 2013
60
FIGURE 20: OAWP BMP ENROLLMENT AND AGRICULTURAL LAND USES WITHIN THE SOUTHERN IRL SUBBASIN

FINAL Central Indian River Lagoon Basin Management Action Plan – January 2013
61
6.4.2 POINT SOURCE FACILITY PROJECTS The Fort Pierce Utility Authority’s Mainland Water Reclamation facility was upgraded in 2008. The upgrade included constructing a deep-well injection system for the facility to eliminate the previously permitted discharges of secondary effluent to the IRL. The discharge was located south of the Fort Pierce Inlet. The facility now only discharges to the IRL during Mechanical Integrity Testing of the injection well, which occurs once every five years.
6.4.2.1 Aquaculture In the southern IRL, 19.2 acres of aquaculture are included under 1 certification with FDACS’ Division of Aquaculture.
6.4.3 MS4 AND NON-MS4 PROJECTS The stakeholders in the southern IRL subbasin provided information on their projects completed since January 1, 2000 and planned during the five-year BMAP period. Since the southern IRL subbasin is located outside the existing IRL Basin model, the TN and TP reduction credit could not be calculated for the majority of the projects submitted. Credit for street sweeping and inlet/catch basin clean out could be estimated because the reductions for these management actions are calculated based on the weight of material collected each year. The projects provided by the southern IRL stakeholders are included in Appendix E. As noted earlier, the projects planned during the five -year BMAP period are not a BMAP requirement since TMDLs for this area have not been established. Credit for these projects could apply towards reduction requirements in any future BMAPs to address the impairments in this area.
6.4.4 REGIONAL PROJECTS In addition to the stakeholder projects in this area, regional projects are also planned. These regional projects will likely not occur during this BMAP period; however, once they are implemented, the projects will reduce the amount of water discharged to the IRL and provide some treatment. One of the regional projects planned in the southern IRL subbasin is the Indian River Lagoon–South project, which is part of the Comprehensive Everglades Restoration Plan (CERP). Components of this project include the C-25 and C-23/24 reservoirs and stormwater treatment areas, which will increase water storage in the basin and reduce the amount of nutrients and sediments discharged to the IRL. Another planned regional project is large-scale water retention areas or “water farms.” The purpose of these areas will be to capture and store water that is currently running off into the lagoon. This water can then be used for irrigation in the agricultural portions of the basin. Capturing the stormwater runoff in the water retention areas will reduce the amount of freshwater flows to the IRL, as well as reduce the amount of nutrient loading from watershed runoff. These water farms will serve as the precursor to the potential reconnection of SFWMD and SJRWMD infrastructure.
6.5 SEAGRASS AND WATER QUALITY MONITORING The seagrass mapping described in Section 5.4 also includes the southern IRL subbasin. Therefore, if seagrass targets are set for this portion of the lagoon, data will be available to assess compliance with seagrass depth limit targets. In addition to the seagrass mapping, Fort Pierce Farms WCD, North St. Lucie River WCD, and SFWMD collect water quality data and SFWMD also collects flow data in the subbasin. This monitoring is not a BMAP requirement; however, it provides useful data to assess water quality trends in the lagoon. Table 29 lists the Fort Pierce Farms, North St. Lucie River WCD, and SFWMD stations, frequency, and sampling parameters, and Figure 21 shows the locations of these stations.

FINAL Central Indian River Lagoon Basin Management Action Plan – January 2013
62
TABLE 29: MONITORING STATIONS IN THE SOUTHERN IRL SUBBASIN SAMPLING
ENTITY STATION
ID STATION NAME STATION
TYPE FREQUENCY PARAMETERS
Fort Pierce Farms WCD 1 Station 1 Water
Quality Quarterly DO, TKN, TP, pH, Turbidity, Nitrate, Nitrite, Transparency, Chlorophyll, TSS
Fort Pierce Farms WCD 2 Station 2 Water
Quality Quarterly DO, TKN, TP, pH, Turbidity, Nitrate, Nitrite, Transparency, Chlorophyll, TSS
Fort Pierce Farms WCD 3 Station 3 Water
Quality Quarterly DO, TKN, TP, pH, Turbidity, Nitrate, Nitrite, Transparency, Chlorophyll, TSS
Fort Pierce Farms WCD 4 Station 4 Water
Quality Quarterly DO, TKN, TP, pH, Turbidity, Nitrate, Nitrite, Transparency, Chlorophyll, TSS
Fort Pierce Farms WCD 5 Station 5 Water
Quality Quarterly DO, TKN, TP, pH, Turbidity, Nitrate, Nitrite, Transparency, Chlorophyll, TSS
North St. Lucie River WCD
5 Station #5 Water Quality Quarterly
Chlorophyll, TSS, Transparency, Turbidity, pH, DO, TP, Nitrite, Nitrate, TKN
SFWMD IRL34B Mouth of Taylor Creek Water Quality 7 times/yr
Ammonia, Color, DO, TKN, Nitrate + Nitrite, Nitrate, Nitrite, pH, Orthophosphate, TP, Secchi, Conductivity, Temperature, TSS, Turbidity, Volatile Suspended Solids
SFWMD C25S50 Upstream of weir S50 on C-25 about 3000 ft upstream of US Hwy #1
Water Quality
Monthly; Biweekly
Ammonia, DO, Nitrate, Nitrite, pH, Orthophosphate, Conductivity, Temperature, Turbidity, TSS; TKN, Nitrate + Nitrite, TP
SFWMD SLT24 Taylor Creek-Basin 1 Outfall, Sample in Ft. Pierce Farms
Water Quality Biweekly
Ammonia, DO, TKN, Nitrate + Nitrite, Nitrate, pH, Orthophosphate, TP, Conductivity, Temperature, TSS, Turbidity, Carotenoids, Chlorophyll-a, Chlorophyll-a Corrected
SFWMD IRL36 ICWW at Channel Marker #176
Water Quality 7 times/yr
Color, DO, TKN, Nitrate + Nitrite, Nitrate, Nitrite, pH, Orthophosphate, TP, Secchi, Conductivity, Temperature, TSS, Turbidity, Volatile Suspended Solids, Ammonia, Salinity
SFWMD IRL39 ICWW West of Channel Marker #169 in Line with Spoil Piles
Water Quality 7 times/yr
Color, DO, TKN, Nitrate + Nitrite, Nitrate, Nitrite, pH, Orthophosphate, TP, Secchi, Conductivity, Temperature, TSS, Turbidity, Volatile Suspended Solids, Ammonia, Salinity
SFWMD S50 S50 Weir Flow Hourly to daily Stage, flow
SFWMD S99 S-99 Spillway on Canal C-25 Near Florida Turnpike Flow Hourly to
daily Stage, flow
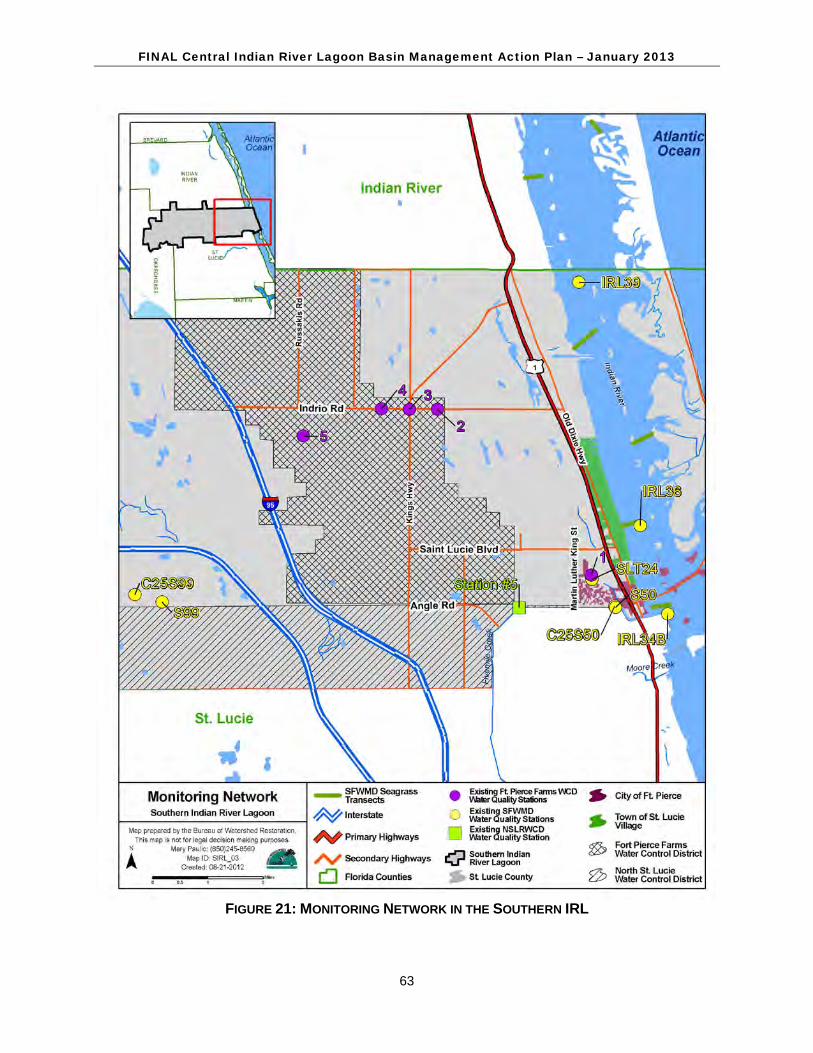
FINAL Central Indian River Lagoon Basin Management Action Plan – January 2013
63
FIGURE 21: MONITORING NETWORK IN THE SOUTHERN IRL

FINAL Central Indian River Lagoon Basin Management Action Plan – January 2013
64
CHAPTER 7: COMMITMENT TO PLAN IMPLEMENTATION Section 403.067(7), F.S., lays out the mechanisms for BMAP implementation (see Appendix B). Successful implementation requires that local stakeholders willingly and consistently work together to attain adopted TMDLs. This collaboration fosters the sharing of ideas, information, and resources. The stakeholders have demonstrated their willingness to confer with and support each other in their efforts.
FDEP will ask for letters of commitment or resolutions of support for the BMAP from the entities to ensure that as staff and board members change over time, the entity has documentation of its support for the BMAP and the associated efforts. This process will occur concurrently with BMAP adoption, and the written statements of commitment will be added to this chapter of the BMAP as they are received.
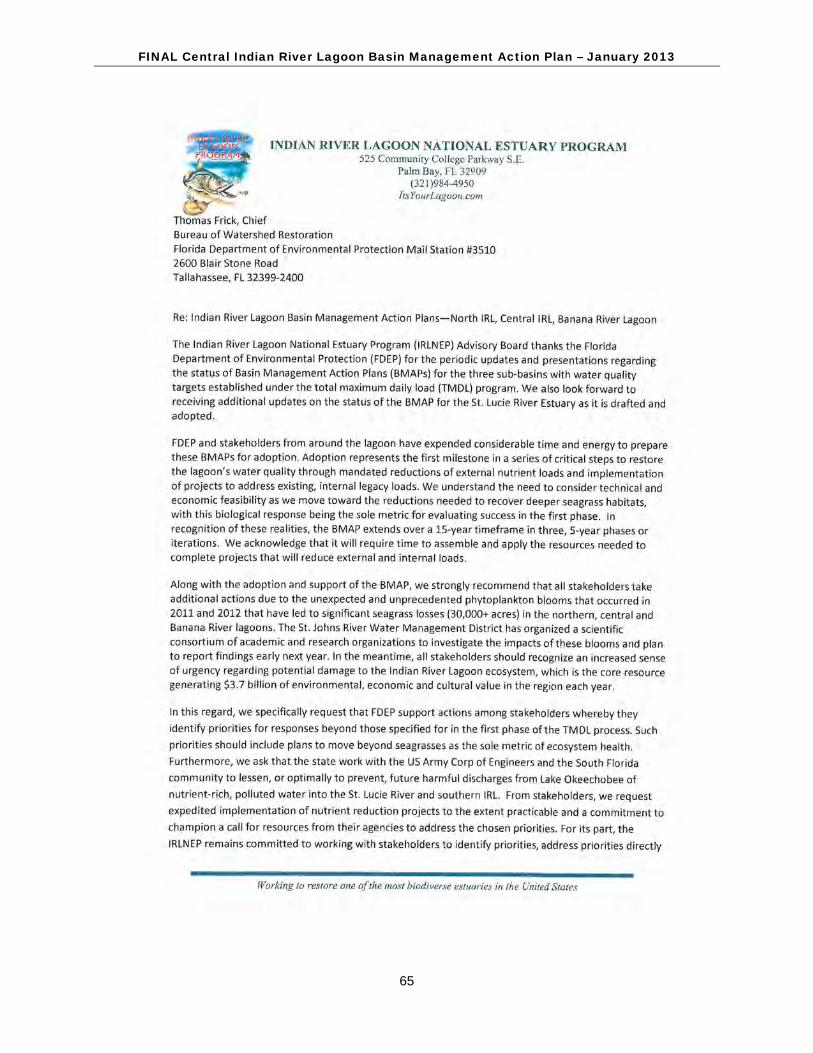
FINAL Central Indian River Lagoon Basin Management Action Plan – January 2013
65

FINAL Central Indian River Lagoon Basin Management Action Plan – January 2013
66

FINAL Central Indian River Lagoon Basin Management Action Plan – January 2013
67
INDIAN RIVER LAGOON NATIONAL ESTUARY PROGRAM
525 Community College Parkway, S.E. Palm Bay, FL 32909
(321)984-4950 ItsYourLagoon.com
Thomas Frick, Chief Bureau of Watershed Restoration Florida Department of Environmental Protection Mail Station #3510 2600 Blair Stone Road Tallahassee, FL 32399-2400 Re: Indian River Lagoon Basin Management Action Plans – North IRL, Central IRL, Banana River Lagoon The Indian River Lagoon Nation Estuary Program (IRLNEP) Advisory Board thanks the Florida Department of Environmental Protection (FDEP) for the periodic updates and presentations regarding the status of Basin Management Action Plans (BMAPs) for the three sub-basins with water quality targets established under the total maximum daily load (TMDL) program. We also look forward to receiving additional updates on the status of the BMAP for the St. Lucie River Estuary as it is drafted and adopted. FDEP and stakeholders from around the lagoon have expended considerable time and energy to prepare these BMAPs for adoption. Adoption represents the first milestone in a series of critical steps to restore the lagoon’s water quality through mandated reductions of external nutrient loads and implementation of projects to address existing, internal legacy loads. We understand the need to consider technical and economic feasibility as we move toward the reductions needed to recover deeper seagrass habitats, with this biological response being the sole metric for evaluating success in the first phase. In recognition of these realities, the BMAP extends over a 15-year timeframe in three, 5-year phases or iterations. We acknowledge that it will require time to assemble and apply the resources needed to complete projects that will reduce external and internal loads. Along with the adoption and support of the BMAP, we strongly recommend that all stakeholders take additional actions due to the unexpected and unprecedented phytoplankton blooms that occurred in 2011 and 2012 that have led to significant seagrass losses (30,00+ acres) in the northern, central and Banana River lagoons. The St. Johns River Water Management District has organized a scientific consortium of academic and research organizations to investigate the impacts of these blooms and plan to report findings early next year. In the meantime, all stakeholders should recognize an increased sense of urgency regarding potential damage to the Indian River Lagoon ecosystem, which is the core resource generating $3.7 billion of environmental, economic, and cultural value in the region each year. In this regard, we specifically request that FDEP support actions among stakeholders whereby they identify priorities for responses beyond those specified for in the first phase of the TMDL process. Such priorities should include plans to move beyond seagrasses as the sole metric of ecosystem health. Furthermore, we ask that the state work with the US Army Corp of Engineers and the South Florida community to lessen, or optimally to prevent, future harmful discharges

FINAL Central Indian River Lagoon Basin Management Action Plan – January 2013
68
from Lake Okeechobee of nutrient-rich, polluted water into the St. Lucie Rive and southern IRL. From stakeholders, we request expedited implementation of nutrient reduction projects to the extent practicable and a commitment to champion a call for resources from their agencies to address the chosen priorities. For its part, the IRLNEP remains committed to working with stakeholders to identify priorities, address priorities directly by funding rigorous and relevant technical and educational projects, and collaborate with stakeholders to obtain the financial and logistical resources needed to address their chosen priority actions. Again, we thank the FDEP for their efforts to keep us informed, and we look forward to approval and implementation of the BMAPs, along with auxiliary efforts to create and implement sustainable management for the nation’s most bio-diverse estuary, the Indian River Lagoon. This letter does not represent the individual views of the member agencies or organizations, but the collective assessment of the program, and simply lists the member organizations of the Advisory Board. The member organizations of the Indian River Lagoon national Estuary Program Advisory Board are: U.S. Environmental Protection Agency U.S. Fish and Wildlife Service U.S. Department of Agriculture/NRCS U.S. Army Corps of Engineers National Aeronautics and Space Administration The Nature Conservancy Bill Kerr (member emeritus) Citizens Action Committee Technical Advisory Committee St. Johns River Water Management District South Florida Water Management District Volusia County Brevard County Indian River County St. Lucie County Martin County Florida Department of Agriculture and Consumer Services Florida Fish and Wildlife Conservation Commission Florida Inland Navigation District

FINAL Central Indian River Lagoon Basin Management Action Plan – January 2013
69
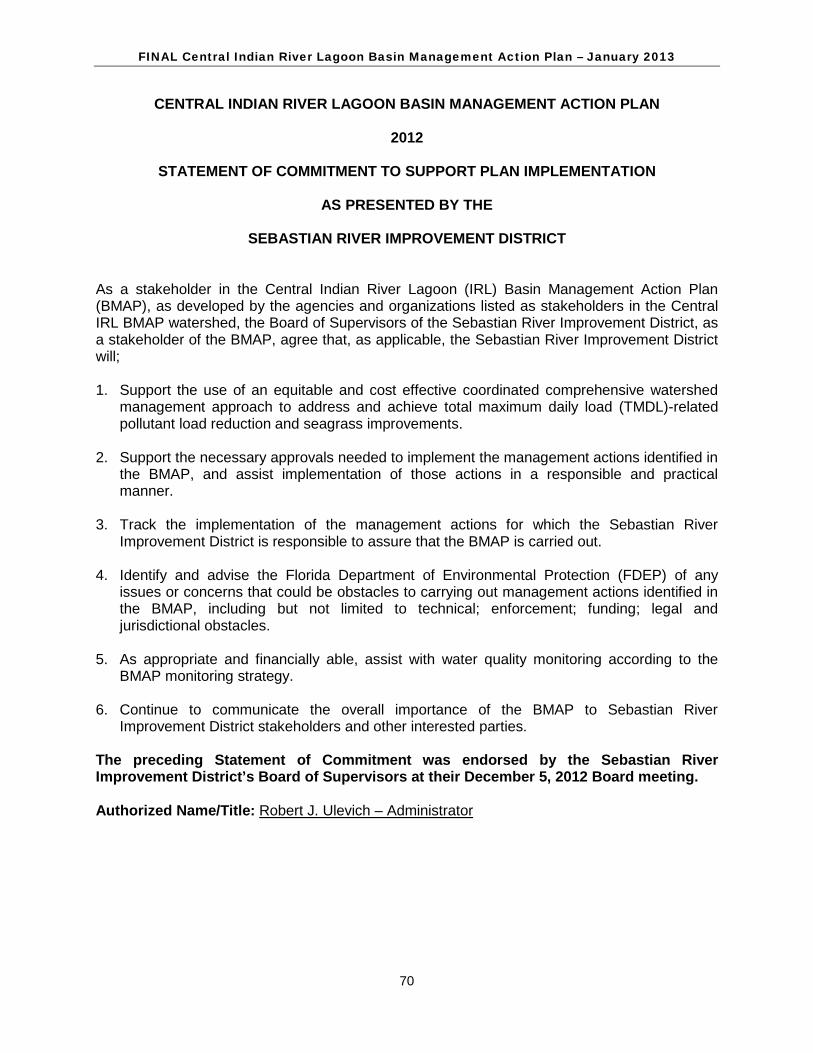
FINAL Central Indian River Lagoon Basin Management Action Plan – January 2013
70
CENTRAL INDIAN RIVER LAGOON BASIN MANAGEMENT ACTION PLAN
2012
STATEMENT OF COMMITMENT TO SUPPORT PLAN IMPLEMENTATION
AS PRESENTED BY THE
SEBASTIAN RIVER IMPROVEMENT DISTRICT As a stakeholder in the Central Indian River Lagoon (IRL) Basin Management Action Plan (BMAP), as developed by the agencies and organizations listed as stakeholders in the Central IRL BMAP watershed, the Board of Supervisors of the Sebastian River Improvement District, as a stakeholder of the BMAP, agree that, as applicable, the Sebastian River Improvement District will; 1. Support the use of an equitable and cost effective coordinated comprehensive watershed
management approach to address and achieve total maximum daily load (TMDL)-related pollutant load reduction and seagrass improvements.
2. Support the necessary approvals needed to implement the management actions identified in
the BMAP, and assist implementation of those actions in a responsible and practical manner.
3. Track the implementation of the management actions for which the Sebastian River
Improvement District is responsible to assure that the BMAP is carried out.
4. Identify and advise the Florida Department of Environmental Protection (FDEP) of any issues or concerns that could be obstacles to carrying out management actions identified in the BMAP, including but not limited to technical; enforcement; funding; legal and jurisdictional obstacles.
5. As appropriate and financially able, assist with water quality monitoring according to the
BMAP monitoring strategy.
6. Continue to communicate the overall importance of the BMAP to Sebastian River Improvement District stakeholders and other interested parties.
The preceding Statement of Commitment was endorsed by the Sebastian River Improvement District’s Board of Supervisors at their December 5, 2012 Board meeting. Authorized Name/Title: Robert J. Ulevich – Administrator

FINAL Central Indian River Lagoon Basin Management Action Plan – January 2013
71

FINAL Central Indian River Lagoon Basin Management Action Plan – January 2013
72

FINAL Central Indian River Lagoon Basin Management Action Plan – January 2013
73
FINAL Central Indian River Lagoon Basin Management Action Plan – January 2013
74
RESOLUTION NO. 2013-01
A RESOLUTION OF THE CITY OF PALM BAY, BREVARD COUNTY, FLORIDA, ENDORSING A COORDINATED AND COMPREHENSIVE WATERSHED MANAGEMENT APPROACH, INCLUDING THE DEVELOPMENT OF A BASIN MANAGEMENT ACTION PLAN, TO ACHIEVING NUTRIENT LOAD REDUCTIONS IN ORDER TO SUPPORT A HEALTHY, SUSTAINABLE, AND PRODUCTIVE ESTUARINE ECOSYSTEM FOR THE CENTRAL INDIAN RIVER LAGOON BASIN; PROVIDING FOR AN EFFECTIVE DATE
WHEREAS, in an effort to improve water quality, 33 U.S.C., Section 1313(d), known as Section 303(d) of the Federal Clean Water Act, requires the adoption of Total Maximum Daily Loads (TMDLs) of pollutants that may be discharged into impaired surface water bodies of the United States, and WHEREAS, the Florida Department of Environmental Protection (FDEP) has identified waters in the Central Indian River Lagoon Basin that are impaired due to nutrient loading under Rule 62-303, Florida Administrative Code, and WHEREAS, the Florida Department of Environmental Protection established a TMDL for certain nutrients for the Indian River Lagoon in March 2009, and WHEREAS, a clean and healthy, sustainable and productive Lagoon is of utmost importance to the ecological, economic, aesthetic, and recreational welfare of all residents, businesses, and visitors, and WHEREAS, it is the goal of the community to find cost effective and efficient measures for implementing water quality improvements for the Indian River Lagoon, and WHEREAS, local, regional and state entities have worked together over a multiyear period with the FDEP to develop a Basin Management Action Plan (BMAP) with a goal of reducing nutrient discharges to the Indian River Lagoon, and WHEREAS, the Central Indian River Lagoon BMAP was completed in September 2012, and WHEREAS, the BMAP stakeholders and FDEP acknowledge technical uncertainties in the model data used to develop the 2009 TMDL allocations, and WHEREAS, the partners involved in the development of the BMAP are continuing to work together to update and refine the model data, and WHEREAS, the update and refinement of the model is anticipated to result in revisions to the TMDL requirements and BMAP. NOW, THEREFORE, BE IT RESOLVED BY THE CITY COUNCIL OF THE CITY OF PALM BAY, BREVARD COUNTY, FLORIDA, as follows:

FINAL Central Indian River Lagoon Basin Management Action Plan – January 2013
75
SECTION 1. The City of Palm Bay supports implementation of the BMAP and will pursue its responsibilities to the extent feasible within resource constraints. SECTION 2. The City of Palm Bay supports continued refinement of the TMDL modeling and revisions to the BMAP to ensure management actions are effective in achieving a clean and healthy Indian River Lagoon. SECTION 3. The City of Palm Bay endorses a coordinated and comprehensive watershed management approach to address and achieve nutrient load reductions. SECTION 4. The City of Palm Bay will identify and advise FDEP of any issues or concerns that could be obstacles (including technical, funding, and legal difficulties) to implementing management actions identified in the BMAP. SECTION 5. The City of Palm Bay will continue to communicate and coordinate actions and funding across community organizations, agencies, and programs with regard to BMAP implementation. SECTION 6. This resolution shall take effect immediately upon the enactment date. This resolution was duly enacted at Meeting No. 2013-01, of the City Council of the City of Palm Bay, Brevard County, Florida, held on January 3, 2013. William Capote, MAYOR ATTEST: Alice Passmore, CITY CLERK

FINAL Central Indian River Lagoon Basin Management Action Plan – January 2013
76
APPENDICES
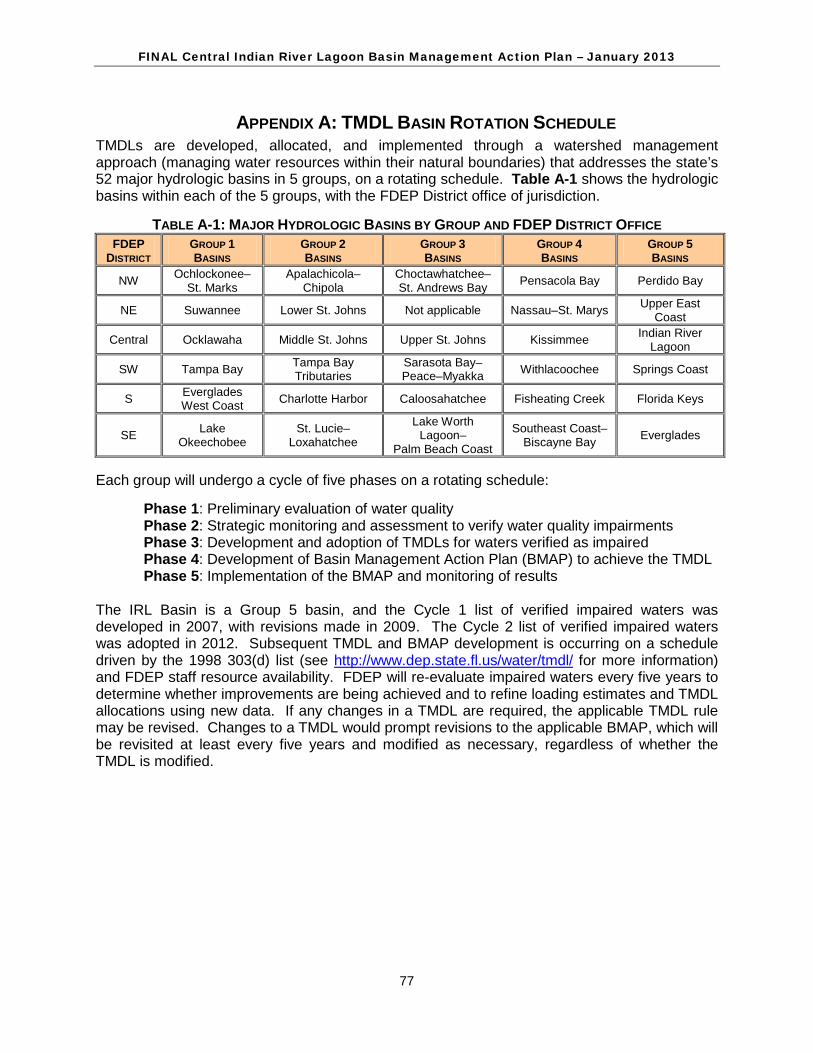
FINAL Central Indian River Lagoon Basin Management Action Plan – January 2013
77
APPENDIX A: TMDL BASIN ROTATION SCHEDULE TMDLs are developed, allocated, and implemented through a watershed management approach (managing water resources within their natural boundaries) that addresses the state’s 52 major hydrologic basins in 5 groups, on a rotating schedule. Table A-1 shows the hydrologic basins within each of the 5 groups, with the FDEP District office of jurisdiction.
TABLE A-1: MAJOR HYDROLOGIC BASINS BY GROUP AND FDEP DISTRICT OFFICE FDEP
DISTRICT GROUP 1 BASINS
GROUP 2 BASINS
GROUP 3 BASINS
GROUP 4 BASINS
GROUP 5 BASINS
NW Ochlockonee– St. Marks
Apalachicola– Chipola
Choctawhatchee– St. Andrews Bay Pensacola Bay Perdido Bay
NE Suwannee Lower St. Johns Not applicable Nassau–St. Marys Upper East Coast
Central Ocklawaha Middle St. Johns Upper St. Johns Kissimmee Indian River Lagoon
SW Tampa Bay Tampa Bay Tributaries
Sarasota Bay– Peace–Myakka Withlacoochee Springs Coast
S Everglades West Coast Charlotte Harbor Caloosahatchee Fisheating Creek Florida Keys
SE Lake Okeechobee
St. Lucie– Loxahatchee
Lake Worth Lagoon–
Palm Beach Coast
Southeast Coast–Biscayne Bay Everglades
Each group will undergo a cycle of five phases on a rotating schedule:
Phase 1: Preliminary evaluation of water quality Phase 2: Strategic monitoring and assessment to verify water quality impairments Phase 3: Development and adoption of TMDLs for waters verified as impaired Phase 4: Development of Basin Management Action Plan (BMAP) to achieve the TMDL Phase 5: Implementation of the BMAP and monitoring of results
The IRL Basin is a Group 5 basin, and the Cycle 1 list of verified impaired waters was developed in 2007, with revisions made in 2009. The Cycle 2 list of verified impaired waters was adopted in 2012. Subsequent TMDL and BMAP development is occurring on a schedule driven by the 1998 303(d) list (see http://www.dep.state.fl.us/water/tmdl/ for more information) and FDEP staff resource availability. FDEP will re-evaluate impaired waters every five years to determine whether improvements are being achieved and to refine loading estimates and TMDL allocations using new data. If any changes in a TMDL are required, the applicable TMDL rule may be revised. Changes to a TMDL would prompt revisions to the applicable BMAP, which will be revisited at least every five years and modified as necessary, regardless of whether the TMDL is modified.

FINAL Central Indian River Lagoon Basin Management Action Plan – January 2013
78
APPENDIX B: SUMMARY OF STATUTORY PROVISIONS GUIDING BMAP DEVELOPMENT AND IMPLEMENTATION
SECTIONS 403.067(6) AND (7), FLORIDA STATUTES - Summary of Excerpts
ALLOCATIONS • The TMDL shall include reasonable and equitable allocations of the TMDL between or among
point and nonpoint sources that will alone, or in conjunction with other management and restoration activities, provide for the attainment of pollutant reductions established pursuant to paragraph (a) to achieve applicable water quality standards.
• The allocations may establish the maximum amount of the pollutant that may be discharged or released in combination with other discharges or releases.
• Allocations may also be made to individual basins and sources or as a whole to all basins and sources or categories of sources of inflow to the water body or water body segments.
• An initial allocation of allowable pollutant loads may be developed as part of the TMDL; in such cases detailed allocations to specific point sources and categories of nonpoint sources shall be established in the basin management action plan.
• The initial and detailed allocations shall be designed to attain pollutant reductions established pursuant to paragraph 403.067(6)(a) (calculation of total maximum daily load) and shall be based on consideration of:
1. Existing treatment levels and management practices; 2. Best management practices established and implemented pursuant to paragraph (7)(c); 3. Enforceable treatment levels established pursuant to state or local law or permit; 4. Differing impacts pollutant sources may have on water quality; 5. The availability of treatment technologies, management practices, or other pollutant reduction measures; 6. Environmental, economic, and technological feasibility of achieving the allocation; 7. The cost benefit associated with achieving the allocation; 8. Reasonable timeframes for implementation; 9. Potential applicability of any moderating provisions such as variances, exemptions, and mixing zones; and 10. The extent to which non-attainment of water quality standards is caused by pollution sources outside of Florida, discharges that have ceased, or alterations to water bodies prior to the date of this act.
GENERAL IMPLEMENTATION DEP is the lead agency in coordinating TMDL implementation, through existing water quality
protection programs. Application of a TMDL by a water management district does not require WMD
adoption of the TMDL. TMDL implementation may include, but is not limited to:
o Permitting and other existing regulatory programs o Non-regulatory and incentive-based programs o Other water quality management and restoration activities, such as Surface Water
Improvement and Management (SWIM) plans or basin management action plans
o Pollutant trading or other equitable economically based agreements o Public works o Land acquisition

FINAL Central Indian River Lagoon Basin Management Action Plan – January 2013
79
BASIN MANAGEMENT ACTION PLAN DEVELOPMENT DEP may develop a basin management action plan that addresses some or all of the
watersheds and basins tributary to a TMDL waterbody. A basin management action plan shall:
o Integrate appropriate management strategies available to the state through existing water quality protection programs.
o Equitably allocate pollutant reductions to individual basins, all basins, each identified point source, or category of nonpoint sources, as appropriate.
o Identify the mechanisms by which potential future increases in pollutant loading will be addressed.
o Specify that for nonpoint sources for which BMPs have been adopted, the initial requirement shall be BMPs developed pursuant to paragraph (c).
o Establish an implementation schedule. o Establish a basis for evaluating plan effectiveness. o Identify feasible funding strategies. o Identify milestones for implementation and water quality improvement, and an
associated water quality monitoring component to evaluate reasonable progress over time.
o Be adopted in whole or in part by DEP Secretarial Order, subject to chapter 120. A basin management action plan may:
o Give load reduction credits to dischargers that have implemented load reduction strategies (including BMPs) prior to the development of the BMAP. (Note: this assumes the related reductions were not factored into the applicable TMDL.)
o Include regional treatment systems or other public works as management strategies.
o Provide for phased implementation to promote timely, cost-effective actions. An assessment of progress in achieving milestones shall be conducted every 5 years
and the basin management action plan revised, as appropriate, in cooperation with basin stakeholders, and adopted by secretarial order.
DEP shall assure that key stakeholders are invited to participate in the basin management action plan development process, holding at least one noticed public meeting in the basin to receive comments, and otherwise encouraging public participation to the greatest practicable extent.
A basin management action plan shall not supplant or alter any water quality assessment, TMDL calculation, or initial allocation.
BASIN MANAGEMENT ACTION PLAN IMPLEMENTATION NPDES Permits
o Management strategies related to a discharger subject to NPDES permitting shall be included in subsequent applicable NPDES permits or permit modifications when the permit expires (is renewed), the discharge is modified (revised), or the permit is reopened pursuant to an adopted BMAP.
o Absent a detailed allocation, TMDLs shall be implemented through NPDES permit conditions that include a compliance schedule. The permit shall allow for issuance of an order adopting the BMAP within five years. (Note: Intended to apply to individual wastewater permits – not MS4s)
o Once the BMAP is adopted, the permit shall be reopened, as necessary, and permit conditions consistent with the BMAP shall be established.
o Upon request by a NPDES permittee, DEP may establish individual allocations prior to the adoption of a BMAP, as part of a permit issuance, renewal, or modification (revision).
o To the maximum extent practicable, MS4s shall implement a TMDL or BMAP through the use of BMPs or other management measures.
o A BMAP does not take the place of NPDES permits or permit requirements. o Management strategies to be implemented by a DEP permittee shall be completed

FINAL Central Indian River Lagoon Basin Management Action Plan – January 2013
80
according to the BMAP schedule, which may extend beyond the 5-year term of an NPDES permit.
o Management strategies are not subject to challenge under chapter 120 when they are incorporated in identical form into a NPDES permit or permit modification (revision).
Management strategies assigned to nonagricultural, non-NPDES permittees (state, regional, or local) shall be implemented as part of the applicable permitting programs.
Nonpoint source dischargers (e.g., agriculture) included in a BMAP shall demonstrate compliance with the applicable TMDLs by either implementing appropriate BMPs established under paragraph 7(c), or conducting water quality monitoring prescribed by DEP or a WMD. (Note: this is not applicable to MS4s, as they are considered point sources under the federal Clean Water Act and TMDL Program.) o Failure to implement BMPs or prescribed water quality monitoring may be subject
to DEP or WMD enforcement action. Responsible parties who are implementing applicable BMAP strategies shall not be
required to implement additional pollutant load reduction strategies, and shall be deemed in compliance with this section. However, this does not limit DEP’s authority to amend a BMAP.
BEST MANAGEMENT PRACTICES DEP, in cooperation with WMDs and other interested parties, may develop interim
measures, BMPs, or other measures for non-agricultural nonpoint sources to achieve their load reduction allocations. o These measures may be adopted by DEP or WMD rule. If adopted, they shall be
implemented by those responsible for non-agricultural nonpoint source pollution. DACS may develop and adopt by rule interim measure, BMPs, or other measures necessary
for agricultural pollutant sources to achieve their load reduction allocations. o These measures may be implemented by those responsible for agricultural pollutant
sources. DEP, the WMDs, and DACS shall assist with implementation. o In developing and adopting these measures, DACS shall consult with DEP, DOH, the
WMDs, representatives of affected farming groups, and environmental group representatives.
o The rules shall provide for a notice of intent to implement the practices and a system to ensure implementation, including recordkeeping.
Verification of Effectiveness and Presumption of Compliance - o DEP shall, at representative sites, verify the effectiveness of BMPs and other measures
adopted by rule in achieving load reduction allocations. o DEP shall use best professional judgment in making the initial verification of
effectiveness, and shall notify DACS and the appropriate WMD of the initial verification prior to the adoption of a rule proposed pursuant to this paragraph.
o Implementation of rule-adopted BMPs or other measures initially verified by DEP to be effective, or verified to be effective by monitoring at representative sites, provides a presumption of compliance with state water quality standards for those pollutants addressed by the practices.
Reevaluation – o Where water quality problems are demonstrated despite implementation,
operation, and maintenance of rule-adopted BMPs and other measures, DEP, a WMD, or DACS, in consultation with DEP, shall reevaluate the measures. If the practices require modification, the revised rule shall specify a reasonable time period for implementation.

FINAL Central Indian River Lagoon Basin Management Action Plan – January 2013
81
APPENDIX C: SUMMARY OF THE EPA-RECOMMENDED ELEMENTS OF A COMPREHENSIVE WATERSHED PLAN
The following is an excerpt on the nine elements of a watershed plan from the EPA’s “Draft Handbook for Developing Watershed Plans to Restore and Protect Our Waters.” Additional information regarding these elements can be found in the full version of the handbook located online at: http://www.epa.gov/owow/nps/watershed_handbook/. NINE MINIMUM ELEMENTS TO BE INCLUDED IN A WATERSHED PLAN FOR IMPAIRED WATERS FUNDED USING INCREMENTAL SECTION 319 FUNDS Although many different components may be included in a watershed plan, EPA has identified a minimum of nine elements that are critical for achieving improvements in water quality. EPA requires that these nine elements be addressed for watershed plans funded using incremental section 319 funds and strongly recommends that they be included in all other watershed plans that are intended to remediate water quality impairments. The nine elements are provided below, listed in the order in which they appear in the guidelines. Although they are listed as a through i, they do not necessarily take place sequentially. For example, element d asks for a description of the technical and financial assistance that will be needed to implement the watershed plan, but this can be done only after you have addressed elements e and i. Explanations are provided with each element to show you what to include in your watershed plan. NINE ELEMENTS a. Identification of causes of impairment and pollutant sources or groups of similar sources that need to be controlled to achieve needed load reductions, and any other goals identified in the watershed plan. Sources that need to be controlled should be identified at the significant subcategory level along with estimates of the extent to which they are present in the watershed (e.g., X number of dairy cattle feedlots needing upgrading, including a rough estimate of the number of cattle per facility; Y acres of row crops needing improved nutrient management or sediment control; or Z linear miles of eroded streambank needing remediation). What does this mean? Your watershed plan should include a map of the watershed that locates the major sources and causes of impairment. Based on these impairments, you will set goals that will include (at a minimum) meeting the appropriate water quality standards for pollutants that threaten or impair the physical, chemical, or biological integrity of the watershed covered in the plan. b. An estimate of the load reductions expected from management measures. What does this mean? You will first quantify the pollutant loads for the watershed. Based on these pollutant loads, you’ll determine the reductions needed to meet the water quality standards.

FINAL Central Indian River Lagoon Basin Management Action Plan – January 2013
82
You will then identify various management measures (see element c below) that will help to reduce the pollutant loads and estimate the load reductions expected as a result of these management measures to be implemented, recognizing the difficulty in precisely predicting the performance of management measures over time. Estimates should be provided at the same level as that required in the scale and scope component in paragraph a (e.g., the total load reduction expected for dairy cattle feedlots, row crops, or eroded streambanks). For waters for which EPA has approved or established TMDLs, the plan should identify and incorporate the TMDLs. Applicable loads for downstream waters should be included so that water delivered to a downstream or adjacent segment does not exceed the water quality standards for the pollutant of concern at the water segment boundary. The estimate should account for reductions in pollutant loads from point and nonpoint sources identified in the TMDL as necessary to attain the applicable water quality standards. c. A description of the nonpoint source management measures that will need to be implemented to achieve load reductions in paragraph 2, and a description of the critical areas in which those measures will be needed to implement this plan. What does this mean? The plan should describe the management measures that need to be implemented to achieve the load reductions estimated under element b, as well as to achieve any additional pollution prevention goals called out in the watershed plan. It should also identify the critical areas in which those measures will be needed to implement the plan. This can be done by using a map or a description. d. Estimate of the amounts of technical and financial assistance needed, associated costs, and/or the sources and authorities that will be relied upon to implement this plan. What does this mean? You should estimate the financial and technical assistance needed to implement the entire plan. This includes implementation and long-term operation and maintenance of management measures, I/E activities, monitoring, and evaluation activities. You should also document which relevant authorities might play a role in implementing the plan. Plan sponsors should consider the use of federal, state, local, and private funds or resources that might be available to assist in implementing the plan. Shortfalls between needs and available resources should be identified and addressed in the plan. e. An information and education component used to enhance public understanding of the project and encourage their early and continued participation in selecting, designing, and implementing the nonpoint source management measures that will be implemented. What does this mean? The plan should include an I/E component that identifies the education and outreach activities or actions that will be used to implement the plan. These I/E activities may support the adoption and long-term operation and maintenance of management practices and support stakeholder involvement efforts. f. Schedule for implementing the nonpoint source management measures identified in this plan that is reasonably expeditious.
FINAL Central Indian River Lagoon Basin Management Action Plan – January 2013
83
What does this mean? You need to include a schedule for implementing the management measures outlined in your watershed plan. The schedule should reflect the milestones you develop in g. g. A description of interim measurable milestones for determining whether nonpoint source management measures or other control actions are being implemented. What does this mean? You’ll develop interim, measurable milestones to measure progress in implementing the management measures for your watershed plan. These milestones will measure the implementation of the management measures, such as whether they are being implemented on schedule, whereas element h (see below) will measure the effectiveness of the management measures, for example, by documenting improvements in water quality. h. A set of criteria that can be used to determine whether loading reductions are being achieved over time and substantial progress is being made toward attaining water quality standards. What does this mean? Using the milestones you developed above, you’ll develop a set of criteria (or indicators) with interim target values to be used to determine whether progress is being made toward reducing pollutant loads. These interim targets can be direct measurements (e.g., fecal coliform concentrations) or indirect indicators of load reduction (e.g., number of beach closings). You must also indicate how you’ll determine whether the watershed plan needs to be revised if interim targets are not met and what process will be used to revise the existing management approach. Where a nonpoint source TMDL has been established, interim targets are also needed to determine whether the TMDL needs to be revised. i. A monitoring component to evaluate the effectiveness of the implementation efforts over time, measured against the criteria established under item h immediately above. What does this mean? The watershed plan must include a monitoring component to determine whether progress is being made toward attainment or maintenance of the applicable water quality standards. The monitoring program must be fully integrated with the established schedule and interim milestone criteria identified above. The monitoring component should be designed to determine whether loading reductions are being achieved over time and substantial progress in meeting water quality standards is being made. Watershed-scale monitoring can be used to measure the effects of multiple programs, projects, and trends over time. Instream monitoring does not have to be conducted for individual BMPs unless that type of monitoring is particularly relevant to the project.

FINAL Central Indian River Lagoon Basin Management Action Plan – January 2013
84
APPENDIX D: PROCESS TO CONDUCT THE SEAGRASS DEPTH LIMIT COMPLIANCE EVALUATION
The goal of the IRL Basin TMDLs is to recover the deeper seagrass habitats. The seagrass response is the most important factor in evaluatin the success of the TMDLs. Even if the relationship among nutrient loads and seagrass recovery is not as predicted by the regression model, the load reduction requirements themselves will not determine TMDL success. The assessment of success is based on whether the seagrass grow at sufficient depths.
The TMDL seagrass depth limit targets are based on a union coverage of the seagrass mapping data from 1943, 1986, 1989, 1992, 1994, 1996, and 1999. The SJRWMD created this union coverage when it set Pollutant Load Reduction Goals (PLRGs) for the IRL Basin. The TMDL targets are not based on the full restoration of seagrass depths represented by this union coverage; instead, the TMDL targets were set at 10% less than full restoration. These targets allow for seagrass growth almost to the depths previously seen in the lagoon, while accounting for the fact that changes have been made to the lagoon system that may limit seagrass growth in some areas.
Compliance with the TMDL seagrass depth limit targets is assessed on a project zone scale using the latest four years of seagrass mapping data. For the BMAP, two separate four-year assessment periods were used in the evaluation: (1) seagrass mapping years 2003, 2005, 2006, and 2007; and (2) seagrass mapping years 2005, 2006, 2007, and 2009. For the assessment years to be compliant with the TMDL seagrass depth limit targets, the data must meet the requirements of the two-step evaluation process. The first step is a comparison of the TMDL union coverage cumulative frequency distribution curve to the assessment years’ union cumulative frequency distribution curve. The cumulative distribution curves show what percentage of the seagrass deep edge is located at different depths. To be compliant, at least 50% of the assessment years’ curve, including the median, must be on or to the right of the TMDL curve. The second step in the evaluation process is a comparison of the TMDL union coverage median value to each assessment year’s median value. To be compliant in the second step, at least three of the four assessment year medians must be equal to or greater than the TMDL median. If the seagrass data from the four assessment years are compliant with both steps of the test, the project zone is achieving the TMDL depth limit target.
A series of GIS steps must be conducted to obtain the data necessary to complete the two-step evaluation process. These steps are as follows:
• Start with the seagrass GIS shapefiles for the four latest assessment years and edit these files to include only Categories 9113 and 9116, which represent seagrass. Other categories in the GIS shapefiles represent algae cover, which should not be included in this assessment. The seagrass shapefiles only represent the location of the seagrass beds.
• Use the dissolve function in GIS to create the union file of the assessment years. This union file results in a coverage of where seagrass beds were located during all four assessment years.
• Transform the polygons to a polyline in the assessment years’ union file. This polyline represents the edges of the seagrass beds.

FINAL Central Indian River Lagoon Basin Management Action Plan – January 2013
85
• Use the erase function to remove points within dredged areas from the bathymetry shapefile, which provides the depth information for the lagoon system. The dredged areas are removed from this coverage because seagrass are not expected to grow in areas that have been dredged.
• Intersect the updated bathymetry shapefile with the seagrass coverage file that was transformed into a polyline. This intersection correlates the depth data with the seagrass locations so that depths along the seagrass bed edge can be determined.
• Draw a 15.8-meter buffer around the seagrass polyline that is 7.9 meters inside and 7.9 meters outside the seagrass bed. The bathymetry layer was created by the SJRWMD in 1996, and the bathymetry was measured every 15.2 meters. The 15.8-meter buffer around the seagrass polyline ensures that 1 bathymetry point will be captured in the GIS analysis.
• Remove points that fall below 0.5 meters and above 3.5 meters from the coverage. This step is needed because seagrass growing at depths less than 0.5 meters are likely not light-limited, and seagrass are not expected to grow at depths greater than 3.5 meters.
• Remove points from the intersections of holes or bare areas, which do not represent the deep edge of the seagrass bed.
• Clip the resulting deep edge file to each project zone (BRL A, BRL B, North A, North B, Central A, Central SEB, and Central B).
These steps are also followed separately for each assessment year so that the median value can be calculated.
The final points that represent the seagrass deep edge boundary for the assessment years’ union coverage are then exported from GIS into Excel to conduct the two-step evaluation. The depths points are sorted from highest to lowest, and the count of the number of points at each depth is determined. The cumulative count is determined by taking the count for the shallowest depth and adding it to the count for the next shallowest point until the counts for all the depths are added together to yield the total number of depth points. The cumulative count at each depth is divided by the total points to determine the percentage of the seagrass points at each depth. These points are then plotted as a curve on a graph for comparison with the TMDL cumulative distribution curve. For the Step 2 evaluation, the median depth point is calculated for each assessment year using Excel. These medians are then compared with the TMDL median to determine compliance.
As noted in Chapter 1, the three Central IRL project zones were compliant for the Step 1 and Step 2 evaluations. Therefore, the TMDL seagrass depth limit targets are being achieved based on the latest four seagrass mapping years, and the stakeholders were not required to make reductions in this first iteration of the Central IRL BMAP.

FINAL Central Indian River Lagoon Basin Management Action Plan – January 2013
86
APPENDIX E: PROJECTS TO ACHIEVE THE TMDL The projects completed by the stakeholders that helped to achieve the TMDL targets in the Central IRL subbasin are included below. Any future projects listed in the tables are not a BMAP requirement because the seagrass depth limit targets for the Central IRL have been achieved based on the latest seagrass evaluation. The tables provide information on the nutrient reduction attributed to each individual project, shown in pounds per year (lbs/yr).
N/A = Not applicable - = Empty cell/no data

FINAL Central Indian River Lagoon Basin Management Action Plan – January 2013
87
BREVARD COUNTY
PROJECT NUMBER PROJECT NAME PROJECT TYPE
PROJECT ZONE
TREATMENT ACRES
PROJECT COST
ANNUAL O&M
END DATE STATUS
TN REDUCTION
(LBS/YR)
TP REDUCTION
(LBS/YR)
BC-1 Tadlock and Goat Creek Baffle Box Baffle box Central A 22.1 $43,811 N/A 2000 Completed 1 0.4
BC-2 Oak Street Drainage Improvements Swale, baffle box Central A 0.3 $660,285 N/A 2003 Completed 1 0.2
BC-3 Melbourne Shores Ponds Pond Central A 135.9 $939,543 N/A 2004 Completed 156 48.4
BC-4 Church Street Pond Cleanout Cleanout
Central SEB 172.1 Unknown N/A Ongoing Ongoing 137 25.5
BC-5 Education Efforts
FYN, fertilizer and pet waste ordinances, PSAs, pamphlets, website, illicit discharge program
County wide N/A Unknown N/A Ongoing Ongoing
Not quantified
Not quantified
BC-6 Street Sweeping Street sweeping Central A N/A Unknown N/A Ongoing Ongoing 60 26.9 BC-7 Valkaria Lakes Wet detention pond Central A 457.7 $234,000 N/A 2012 Started 700 166.1
BC-8 Wheeler Properties Wet detention pond Central SEB 16,403.5 $3,500,000 $2,000 2012
Planned, funded 28,760 9,259.6
BC-9 Micco I Exfiltration Central SEB 7.6 $175,599 $1,000 2014
Planned, funded 31 4.4
BC-10 Micco B Dry detention Central SEB 44.7 $846,176 $1,000 N/A
Planned, funded 23 4.2
BC-11 Mockingbird Pond MAPS Central SEB 26.7 $12,401 $5,565 N/A Funded 27 3.3
BC-12 Church Street Pond MAPS MAPS
Central SEB 172.1 $4,212 $2,106 2010 Completed 217 37.1
BC-13 Wheeler Flemming Grant Wet detention pond
Central SEB 134.4 $245,000 Unknown 2014 Funded 745 316.5
N/A Total Project Reductions N/A N/A N/A N/A N/A N/A N/A 30,858 9,892.6
CITY OF FELLSMERE
PROJECT NUMBER PROJECT NAME PROJECT TYPE
PROJECT ZONE PROJECT DETAIL
TREATMENT ACRES END DATE STATUS
TN REDUCTION
(LBS/YR)
TP REDUCTION
(LBS/YR)
F-1 State Street Improvements and Stormwater Lake Project
Wet detention pond Central SEB
Swale and wet retention pond 49.6 Unknown Completed 71.5 19.9
F-2 Senior League Field Park Improvements
Wet detention pond Central SEB
Swale and wet retention pond 11.5 2008 Completed 1 0.1

FINAL Central Indian River Lagoon Basin Management Action Plan – January 2013
88
F-3 City Hall/Orange St. Project Wet detention pond Central SEB
Swale and wet retention pond 7.6 Unknown
Envisioned, not funded 8 2.6
F-4 Sonrise Apartments Phase 1 & 2
Wet detention pond Central SEB
Swale and wet retention ponds 36.2 2009 Completed 18 7.4
F-5 Grace Meadows Subdivision Wet detention pond Central SEB Wet pond 18.3 2009 Completed 4.5 1.5
F-7 Solid Waste Transfer Station Wet detention pond Central SEB Wet pond 5.1 2008 Completed 1 0.3
N/A Total Project Reductions N/A N/A N/A N/A N/A N/A 104 31.8 CITY OF MELBOURNE
PROJECT NUMBER PROJECT NAME PROJECT TYPE
PROJECT ZONE PROJECT DETAIL
TREATMENT ACRES
PROJECT COST
END DATE STATUS
TN REDUCTION
(LBS/YR)
TP REDUCTION
(LBS/YR)
MEL-1 Fee & Apollo Drainage Improvements
Wet detention pond
Central A
Retrofit of wet detention pond; no treatment provided within existing development 77.0 $525,161 2011 Completed 37 92.4
N/A Total Project Reductions N/A N/A N/A N/A N/A N/A N/A 37 92.4

FINAL Central Indian River Lagoon Basin Management Action Plan – January 2013
89
CITY OF PALM BAY
PROJECT NUMBER PROJECT NAME
PROJECT TYPE PROJECT ZONE PROJECT DETAIL
TREATMENT ACRES
PROJECT COST END DATE STATUS
TN REDUCTION
(LBS/YR)
TP REDUCTION
(LBS/YR)
PB-1 Basin 11 Dredging Central A
Dredging 8,100 ft. of canal and retention pond, culvert replacements (7) N/A $1,866,695 2009 Completed
Not quantified
Not quantified
PB-2 Chace Lane Pond Modifications
Dry detention pond Central A
Work will include repair of existing outfall structures and washout, installation of large concrete weir 91.2 $20,290 2001 Completed 62 8.3
PB-3
Glenham Drive Sidewalks Improvements
Dry detention pond Central A
Replacement of sidewalk and addition of dry pond 12.2 Unknown Unknown Completed 9 1.4
PB-4
Basin 7 Stormwater Improvements Phase II
Wet detention pond Central A
Pond will be constructed on eight-acre site 146.5 $79,109 2009 Completed 387 124
PB-5 Boundary Canal Trail Phase 3 Baffle box Central A Addition of baffle box 365.9 Unknown Unknown Completed 609 73.4
PB-6
Boundary Canal Phase II, stormwater improvement Retention Central A
Installation of berm and pipe in canal for additional treatment 632.7 Unknown Unknown Completed 1,633 176.1
PB-7
Boundary Canal Phase I Baffle Box Installation Baffle Box Central A
Three chambered baffle box prior to discharge to Turkey Creek 632.7 Unknown Unknown Completed 395 31.2
PB-8
Norwood Street Baffle Box Installation Baffle Box Central A
Installation of baffle boxes to minimize sediment introduction to C-1 Canal 17.4 Unknown Unknown Completed 1,001 148.7
PB-9
Basin 1 Drainage Improvements (East of US 1)
Wet detention pond Central A
Pond will be constructed on 1.5 acres of site 136.5 $22,247 2007 Completed 33 5.9
PB-10
Basin 13 Stormwater Improvements
Wet detention pond Central A
Construction of wet detention pond off Hardin Lane, west of Sandy Lane 42.4 $200,419 2006 Completed 65 12.2
PB-11
Powell's Subdivision Paving & Drainage Improvements
Wet detention pond Central A
Create pond to manage stormwater 123.6 $147,478 2000 Completed 124 53.9
PB-12
Port Malabar Unit 40 Drainage Improvements
Wet detention pond Central A
Construction of three retention ponds 224.3 $23,778 2007 Completed 468 109.6

FINAL Central Indian River Lagoon Basin Management Action Plan – January 2013
90
PROJECT NUMBER PROJECT NAME
PROJECT TYPE PROJECT ZONE PROJECT DETAIL
TREATMENT ACRES
PROJECT COST END DATE STATUS
TN REDUCTION
(LBS/YR)
TP REDUCTION
(LBS/YR)
PB-13 Mandarin Ditch (South) Swales Central A
Removal of deleterious material from existing swale, replacement with clean fill stabilized with turf reinforcement mat and sod 73.0 $308,797 2006 Completed 285 39.6
PB-14 Basin 3 Main Street Parking Lot
Pervious pavement Central A
Install parking lot within Main Street right-of-way utilizing porous concrete pavement 358.6 $4,845 2008 Completed 984 128.6
PB-15
Basin 3 Main Street Improvements Channel Alignment
Other structural BMP Central A
Installation of weirs for treatment and attenuation with slopes being stabilized with turf reinforcement mat 358.6 $403,561 2010 Completed 1,475 192.8
PB-16 Street Sweeping Street sweeping Central A Street sweeping N/A
$8,900 per year Ongoing Ongoing 23 10.5
PB-17
Turkey Creek Maintenance Dredging Dredging Central A Dredging N/A $255,241 2007 Completed
Not quantified
Not quantified
PB-18
Turkey Creek Maintenance Dredging – Sump Dredging Central A Dredging N/A Unknown Unknown Completed
Not quantified
Not quantified
PB-19 Anglers Drive Baffle box Central A Baffle box 19.1 $85,000 2008 Completed 19 2.1
PB-20 Worth Court Inlet inserts Central A Inlet inserts N/A Part of PB-19 Unknown Completed 1 0
PB-21 Basin 9 (Harris Pond)
Wet detention pond Central A Wet pond 73.0 $294,519 2011 Completed 4 0.6
PB-22 Wild Rose BMP Baffle box Central A Baffle box 4.6 Unknown Unknown Completed 5 0.5
PB-23 C-1 Canal Rediversion Rediversion Central A Canal rediversion N/A Unknown Unknown Completed
Not quantified
Not quantified
PB-24 Pt Malabar Inlet Inserts Inlet inserts Central A Inlet inserts N/A $19,518 2010 Completed 2 1
PB-25 Kent Street Baffle Box Baffle box Central A Baffle box 20.8 $50,000 2009 Completed 31 3.4
PB-26 Florin Pond
Dry detention pond Central A Dry pond 25.9 $150,000 2000 Completed 26 5.9

FINAL Central Indian River Lagoon Basin Management Action Plan – January 2013
91
PROJECT NUMBER PROJECT NAME
PROJECT TYPE PROJECT ZONE PROJECT DETAIL
TREATMENT ACRES
PROJECT COST END DATE STATUS
TN REDUCTION
(LBS/YR)
TP REDUCTION
(LBS/YR)
PB-27
FYN, ordinances, pamphlets, PSAs, website, illicit discharge program
Education efforts Central A Education N/A $1,866,695 Ongoing Ongoing
Not quantified
Not quantified
N/A Total Project Reductions N/A N/A N/A N/A N/A N/A N/A 7,641 1,129.7
CITY OF SEBASTIAN
PROJECT NUMBER PROJECT NAME PROJECT TYPE PROJECT ZONE
TREATMENT ACRES
END DATE STATUS
TN REDUCTION
(LBS/YR)
TP REDUCTION
(LBS/YR) SEB-1 Main Street/Indian River Drive Improvements Dry retention pond Central SEB 4.19 2009 Completed 66 17.3 SEB-2 Main Street 4 Dry detention pond Central SEB 4.19 Unknown Planned, funded 0 0.0 SEB-3 T-Hangar Development/Access Roads Dry detention pond Central SEB 11.56 2004 Completed 1 0.1 SEB-4 Louisiana Avenue Improvements Projects Dry retention pond Central SEB 3.08 2004 Completed 0 0.1 SEB-5 Twin Ditches Stormwater Retrofit Wet detention pond Central SEB 39 2007 Completed 209 105.5 SEB-6 Indian River Drive & Davis Street Baffle Baffle box Central SEB 96 2009 Completed 38 5.7
SEB-7 Periwinkle Drive Stormwater – City of Sebastian Wet detention pond Central SEB 67.6 2008 Completed
4 0.7
SEB-8 Collier Canal Stormwater Retrofit Wet detention pond Central SEB 531.6 2010 Completed 1,529 387.8 SEB-9 Schumann Park Improvements Dry detention pond Central SEB 3.8 2009 Completed 1 0.1
SEB-10 Fertilizer Ordinance Education Central SEB N/A Ongoing Ongoing Not
quantified Not
quantified N/A Total Project Reductions N/A N/A N/A N/A N/A 1,848 517.3
CITY OF VERO BEACH
PROJECT NUMBER PROJECT NAME
PROJECT TYPE
PROJECT ZONE
TREATMENT ACRES
PROJECT COST
ANNUAL O&M
END DATE STATUS
TN REDUCTION (LBS/YR)
TP REDUCTION (LBS/YR)
VB-1 Date Palm Baffle Box Baffle box Central B 6.7 $186,396 $1,000 2010 Completed 9 1.0
VB-2 10th and 12th Avenue Baffle Boxes Baffle box Central B 69.9 $97,800 $2,000 2011 Completed 127 17.5
VB-3 Greytwig Baffle Box Baffle box Central B 9.8 $75,000 $1,000 2011 Completed 21 2.4 VB-4 Fertilizer Ordinance Education Central B N/A Unknown Unknown Ongoing Ongoing Not quantified Not quantified
N/A Total Project Reductions N/A N/A N/A N/A N/A N/A N/A 157 20.9

FINAL Central Indian River Lagoon Basin Management Action Plan – January 2013
92
CITY OF WEST MELBOURNE
PROJECT NUMBER PROJECT NAME PROJECT TYPE PROJECT ZONE
TREATMENT ACRES END DATE STATUS
TN REDUCTION
(LBS/YR)
TP REDUCTION
(LBS/YR) WM-1 Westbrooke Wet detention pond Central A 169.0 2004 Completed 41 4.3 WM-2 Saddlebrook Wet detention pond Central A 40.2 2004 Completed 1 0.2 WM-3 Stratford Point Wet detention pond Central A 83.7 2004 Completed 25 3.1 WM-4 Oak Grove Wet detention pond Central A 91.4 2010 Completed 22 2.2 WM-5 Manchester Lakes Wet detention pond Central A 133.3 2007 Completed 16 1.1 WM-6 Havens @ Riviera Wet detention pond Central A 22.9 2009 Completed 6 0.6 WM-7 Cypress/Creek Imagine Schools Wet detention pond Central A 72.0 2009 Completed 15 1.7 WM-8 Lynnwood Wet detention pond Central A 28.3 2006 Completed 2 0.6 WM-9 Coastal Commerce Wet detention pond Central A 59.9 2009 Completed 18 2.7
WM-10 Hammock Landing Wet detention pond Central A 76.1 2009 Completed 11 0.8 WM-11 Crystal Lakes Wet detention pond Central A 91.0 2009 Completed 17 6.4 WM-12 Orange View Drive 2nd generation baffle box Central A 49.1 Unknown Completed 69 8 WM-13 Stephenson Drive 2nd generation baffle box Central A 14.1 Unknown Completed 21 2.6 WM-14 Parker Road 2nd generation baffle box Central A 13.1 Unknown Completed 17 1.9 WM-15 Laila Drive 2nd generation baffle box Central A 21.9 Unknown Completed 31 3.5 WM-16 Doherty Drive 2nd generation baffle box Central A 66.0 Unknown Completed 107 16.5 WM-17 Trend Road 2nd generation baffle box Central A 8.8 Unknown Completed 12 1.4 WM-18 San Paolo 2nd generation baffle box Central A 2.7 Unknown Completed 8 1.5 WM-19 San Paolo West 2nd generation baffle box Central A 7.7 Unknown Completed 24 4.8 WM-20 John Carrol 2nd generation baffle box Central A 74.9 Unknown Completed 109 12.3 WM-21 Street Sweeping Street sweeping Central A N/A Ongoing Ongoing 405 182.2 WM-22 Inlet Cleaning Inlet cleaning Central A N/A Ongoing Ongoing 5 3
N/A Total Project Reductions N/A N/A N/A N/A N/A 982 261.4

FINAL Central Indian River Lagoon Basin Management Action Plan – January 2013
93
FDOT DISTRICT 4
PROJECT NUMBER PROJECT NAME PROJECT TYPE PROJECT ZONE
TREATMENT ACRES
END DATE STATUS
TN REDUCTION (LBS/YR)
TP REDUCTION
(LBS/YR) FDOT4-1 FM# 228595-1 (Basin 4B) Wet detention pond Central SEB 57.6 2007 Completed 83 30.3 FDOT4-2 FM# 228620-1 100% on-site retention Central SEB 2.2 2005 Completed 24 3.4 FDOT4-3 FM# 228615-1 2nd generation baffle box Central B 59.8 2007 Completed 117 33.2 FDOT4-4 FDOT4 Street Sweeping Street sweeping Central SEB and B N/A Ongoing Ongoing 237 151.8 FDOT4-5 FM# 228583-5 (Pond 1) Wet detention pond Central B 22.4 2010 Completed 65 41.6 FDOT4-6 FM# 228583-5 (Pond 2) Wet detention pond Central B 11.9 2010 Completed 25 15.8 FDOT4-7 FM# 228627-1 (Pond 1) Wet detention pond Central B 28.9 2010 Completed 83 51.7 FDOT4-8 FM# 228627-1 (Pond 2) Wet detention pond Central B 21.6 2010 Completed 61 38.6
FDOT4-9 Education Efforts Pamphlets and illicit discharge program Central SEB and B N/A Ongoing Ongoing Not quantified Not quantified
FDOT4-10 Fertilizer Cessation Fertilizer cessation Central SEB and B N/A Unknown Completed Not quantified Not quantified N/A Total Project Reductions N/A N/A N/A N/A N/A 695 366.5

FINAL Central Indian River Lagoon Basin Management Action Plan – January 2013
94
FDOT DISTRICT 5
PROJECT NUMBER PROJECT NAME PROJECT TYPE
PROJECT ZONE PROJECT DETAIL
TREATMENT ACRES END DATE STATUS
TN REDUCTION
(LBS/YR)
TP REDUCTION
(LBS/YR)
FDOTD5-1 D5_70010-3528-01 Wet detention pond Central A
Add lanes/reconstruct SR 5 from Conlan Blvd. to University Blvd. 15.6 2002 Completed 44.4 22.85
FDOTD5-2 D5_70010-3528-02 Wet detention pond Central A
Add lanes/reconstruct SR 5 from Conlan Blvd. to University Blvd. 8.4 2002 Completed 14.4 6.7
FDOTD5-3 D5_70012-3503-01 (Missing from model)
Wet detention pond Central A
Add lanes/reconstruction of SR 507 (Babcock Street) from south of SR 514 to Port Malabar Blvd. 21.7 1989 Completed 56.7 25.75
FDOTD5-4 D5_70012-3503-02 (Missing from model)
Wet detention pond Central A
Add lanes/reconstruction of SR 507 (Babcock Street) from south of SR 514 to Port Malabar Blvd . 9.1 1989 Completed 22.5 12.45
FDOTD5-5 D5_70012-3503-03 (Missing from model)
Dry detention pond Central A
Add lanes/reconstruction of SR 507 (Babcock Street) from south of SR 514 to Port Malabar Blvd. 7.3 1989 Completed 14.1 7.85
FDOTD5-6 D5_70050-3544-03 Wet detention pond Central A
Add lanes and reconstruct from 3.8 miles east of Osceola C/L to I-95 5.1 2004 Completed 11.7 3.8
FDOTD5-7 D5_70100-3517-01 (Missing from model)
100% on-site retention Central A
French drain system along SR 5 from University Blvd. to Aurora Road 3.4 1996 Completed 12 6.7
FDOTD5-8 D5_70220-3433-01 Wet detention pond Central A
Interchange work at SR 514 and I-95 9.3 2000 Completed 33.3 13.65
FDOTD5-9 D5_70220-3429-01 (Missing from model)
Wet detention pond Central A
I-95 and Palm Bay Road interchange 20.0 1995 Completed 49.2 32.35
FDOTD5-10 D5_70220-3429-02 (Missing from model)
Wet detention pond Central A
I-95 and Palm Bay Road interchange 25.6 1995 Completed 62.4 39.3
FDOTD5-11 D5_70220-3429-03 (Missing from model)
Wet detention pond Central A
I-95 and Palm Bay Road interchange 26.1 1995 Completed 60.6 37
FDOTD5-12 D5_70220-3429-04 (Missing from model)
Wet detention pond Central A
I-95 and Palm Bay Road interchange 21.7 1995 Completed 51.3 30.55
FDOTD5-13 D5_409034-01 100% on-site retention Central A
Drainage improvements at SR A1A; French drain located on southwest corner of US 192 and Miramar Ave (A1A) 0.4 2005 Completed 1.2 0.85
FDOTD5-14 Education Education Project Central A
Illicit discharge program, pamphlets, flyers N/A Ongoing Ongoing
Not quantified
Not quantified
FDOTD5-15 Fertilizer Cessation Fertilizer cessation Central A
Elimination of fertilizer use on rights-of-way N/A 2005 Completed 1,586 0.0
N/A Total Project Reductions N/A N/A N/A N/A N/A N/A 2,020 239.8

FINAL Central Indian River Lagoon Basin Management Action Plan – January 2013
95
FELLSMERE WCD
PROJECT NUMBER PROJECT NAME PROJECT TYPE PROJECT ZONE
TREATMENT ACRES
ANNUAL O&M COST END DATE STATUS
TN REDUCTION
(LBS/YR)
TP REDUCTION
(LBS/YR) FWCD-1 Sonrise Villas Wet detention pond Central SEB 13.6 Unknown 2003 Completed 11 4.5
FWCD-2 St. Johns Land Purchase
Change from agricultural to natural land use Central SEB 2,390.6 Unknown Ongoing Ongoing
Not quantified
Not quantified
FWCD-3
Fellsmere Stormwater Lake and State Street Improvements Wet detention pond Central SEB 48.1 Unknown 2003 Completed 69 19.2
FWCD-4 Grace Meadows Wet detention pond Central SEB 7.7 Unknown 2009 Completed 2.5 1.1
FWCD-5 2" Limitation Discharges Retention BMPs Central SEB - Unknown Ongoing Ongoing Not
quantified Not
quantified
FWCD-6 FWCD Mechanical Canal Maintenance Retention BMPs Central SEB - $54,872 Ongoing
Planned, funded
Not quantified
Not quantified
N/A Total Project Reductions N/A N/A N/A N/A N/A N/A 83 24.8

FINAL Central Indian River Lagoon Basin Management Action Plan – January 2013
96
INDIAN RIVER COUNTY PROJECT NUMBER PROJECT NAME
PROJECT TYPE
PROJECT ZONE PROJECT DETAIL
TREATMENT ACRES
PROJECT COST
ANNUAL O&M
END DATE STATUS
TN REDUCTION (LBS/YR)
TP REDUCTION (LBS/YR)
IRC-1
Vero Lake Estates Stormwater Improvements – Phase 1
Wet detention pond Central SEB
Subregional stormwater treatment facility for old subdivision constructed that had no stormwater treatment 2,441.5 $1,572,829 Unknown 2002 Completed 4,936 1,022.5
IRC-2
East Roseland Stormwater Improvements
Wet detention pond Central SEB
Stormwater detention lake and associated stormwater conveyance systems to provide flood control and stormwater quality treatment for watershed in Roseland that had no treatment 73.7 $433,134 $2,176 2005 Completed 168 38.3
IRC-3
East Gifford Stormwater Improvements
Wet detention pond Central B
Stormwater detention lake and associated swale and piped stormwater conveyance systems to provide stormwater quality treatment for residential community that had no treatment 44.1 $686,136 $2,471 2004 Completed 169 71.1
IRC-4
PC Main (formerly Main Relief Canal Pollution Control Facility) – nutrient removal from measured data
Other structural BMP Central B
Mechanical pollution control system using self-cleaning screens in series to remove solids from Main Relief Canal 21,941.1 $5,240,931 $100,000 2009 Completed 2,018 517.0
IRC-5
Egret Marsh Stormwater Park – nutrient removal from measured data
Other structural BMP Central B
Algal turf scrubber system; initial, intermediate, and final polishing ponds; and wood stork habitat area; treats 10 million gallons per day 8,949.3 $5,580,000 $338,000 2010 Completed 2,494 546.0

FINAL Central Indian River Lagoon Basin Management Action Plan – January 2013
97
PROJECT NUMBER PROJECT NAME
PROJECT TYPE
PROJECT ZONE PROJECT DETAIL
TREATMENT ACRES
PROJECT COST
ANNUAL O&M
END DATE STATUS
TN REDUCTION (LBS/YR)
TP REDUCTION (LBS/YR)
IRC-6
PC South Algal Nutrient Removal Facility – estimated nutrient removal
Other structural BMP Central B
Algae-based nutrient removal system treating approximately 10 million gallons per day 17,163 $7,000,000 Unknown 2012
Envisioned, not funded 2,494 546.0
IRC-7
PC North Aquatic Plant Based Nutrient Removal System (Proposed) – estimated nutrient removal
Other structural BMP
Central SEB and B
Aquatic plant–based nutrient removal system treating approximately 10 million gallons per day 12,651.6 $6,000,000 Unknown 2014
Envisioned, not funded 2,494 546.0
IRC-8
PSAs, Website, Pamphlets, Illicit Discharge Program, Signs Along IRFWCD Canals
Education project
Central SEB and B
Prepare and distribute educational information related to stormwater runoff, collect information on illicit discharges, and investigate reports N/A N/A $52,000 Ongoing Ongoing Not quantified Not quantified
IRC-9 Street Sweeping Street sweeping
Central SEB and B
Swept approximately 670 curb miles N/A N/A $22,050 Ongoing Ongoing 226 101.9
IRC-10
Storm Drain Cleaning with Vacuum Trucks
Other structural BMP
Central SEB and B
Cleaned 1,065 storm drains N/A N/A $19,067 Ongoing Ongoing Not quantified Not quantified
IRC-11
Floating Aquatic Plant Islands in County Stormwater Ponds and Lakes
Floating islands
Central SEB and B
Floating aquatic plant islands will be installed in county golf course and stormwater ponds N/A Unknown Unknown Unknown
Envisioned, not funded Not quantified Not quantified
IRC-12 Spoonbill Marsh Project
Other structural BMP Central B
Removes nutrients by drawing water from IRL and mixing with RO concentrate disposal, then distributing it through 67-acre man-made saltwater marsh system before returning it to IRL N/A Unknown Unknown 2010 Completed 1,686 1,997.0
N/A Total Project Reductions N/A N/A N/A N/A N/A N/A N/A N/A 16,685 5,385.8

FINAL Central Indian River Lagoon Basin Management Action Plan – January 2013
98
INDIAN RIVER FARMS WCD
PROJECT NUMBER PROJECT NAME PROJECT TYPE
PROJECT ZONE PROJECT DETAIL STATUS
TN REDUCTION
(LBS/YR)
TP REDUCTION
(LBS/YR)
IRF-1 Tilting Weir Gates Other structural BMP
Central SEB and B
Installed 4 tilting weir gates to reduce velocity and timing of discharges; “cleaner” water spills off top of gates and leaves organic sediments on bottom of canal system; sediments are mechanically cleaned annually Completed
Not quantified
Not quantified
IRF-2 Mechanical Removal of Floating Vegetation
Other nonstructural BMP
Central SEB and B
Removed 40,000 cubic yards of water lettuce in 2009, and 25,000 cubic yards through October 2010; material is placed on bank to biodegrade; berms are sloped away from top of bank so nutrients do not reenter canal Ongoing
Not quantified
Not quantified
IRF-3 Establishment of 2” Discharge Rule
Other nonstructural BMP
Central SEB and B 2” discharge rule within WCD Ongoing
Not quantified
Not quantified
N/A Total Project Reductions N/A N/A N/A N/A
Not quantified
Not quantified
MELBOURNE-TILLMAN WCD
PROJECT NUMBER PROJECT NAME
PROJECT TYPE
PROJECT ZONE PROJECT DETAIL END DATE STATUS
TN REDUCTION
(LBS/YR)
TP REDUCTION
(LBS/YR)
MT-1 C-1 Rediversion Project
Canal rediversion Central A
Redirect flows to USJR from IRL during certain storm conditions; replacement of control gates in WCD's structure at east end of C-1 2011 Completed
Not quantified
Not quantified
N/A Total Project Reductions N/A N/A N/A N/A N/A
Not quantified
Not quantified
SEBASTIAN RIVER IMPROVEMENT DISTRICT
PROJECT NUMBER PROJECT NAME PROJECT TYPE PROJECT ZONE STATUS
TN REDUCTION (LBS/YR)
TP REDUCTION (LBS/YR)
SRID-1 Establishment of 2” Discharge Rule Other nonstructural BMP Central SEB and B Ongoing Not quantified Not quantified
SRID-2 Radial Arm Control Gates Other structural BMP Central SEB and B Envisioned, not funded Not quantified Not quantified
SRID-3 Vegetation and Sediment/Muck Removal from Canals
Other nonstructural BMP Central SEB and B Ongoing Not quantified Not quantified
SRID-4 Education – Website Education Central SEB and B Ongoing Not quantified Not quantified
SRID-5 Large Regional Water Conservation/Storage Areas
Other nonstructural BMP Central SEB and B Envisioned, not funded Not quantified Not quantified
N/A Total Project Reductions N/A N/A N/A Not quantified Not quantified

FINAL Central Indian River Lagoon Basin Management Action Plan – January 2013
99
TOWN OF INDIALANTIC PROJECT NUMBER PROJECT NAME
PROJECT TYPE PROJECT ZONE STATUS
TN REDUCTION (LBS/YR)
TP REDUCTION (LBS/YR)
TI-1 Pamphlets, website Education Central A Ongoing Not quantified Not quantified N/A Total Project Reductions N/A N/A N/A Not quantified Not quantified
TOWN OF MELBOURNE BEACH
PROJECT NUMBER PROJECT NAME
PROJECT TYPE
PROJECT ZONE PROJECT DETAIL
TREATMENT ACRES
PROJECT COST END DATE STATUS
TN REDUCTION
(LBS/YR)
TP REDUCTION
(LBS/YR)
MB-1 Basin 9 – Oak Street Pedway
Exfiltration trench Central A
580 linear feet of exfiltration pipe 13.1 $146,000 2007 Completed 127 21.0
MB-2
Basin 9 – Oak Street Pedway – Improvement Project
2nd generation baffle box Central A
Baffle box at end of 6th Avenue in Basin 9 85.7 $146,000 2007 Completed 42 4.6
MB-3
Basin 8, 9 & 11 Oak Street Pedway –Improvement Project Swales Central A
780 linear feet of swales along Oak Street from First to Driftwood 45.1 $146,000 2007 Completed 403 68.9
MB-4
Basin 1 – HMGP Flood Water Improvements Project
2nd generation baffle box Central A
Baffle box at end of Harland Ave. on Riverside Drive in Basin 9 83.7 $500,000 2010 Completed 146 16.9
MB-5
Basin 1 – HMGP Flood Water Improvements Project Swales Central A
180 linear feet of swale along Harland Avenue from Jasmine to Shannon 0.9 $500,000 2010 Completed 8 1.1
MB-6
Basin 9 – HMGP Flood Water Improvements Project Swales Central A
150 linear feet of swales along Oak Street from 5th to 6th Ave. 1.0 $500,000 2010 Completed 9 1.3
MB-7
Anchor Key Drainage Improvements – Basin 16 Baffle box Central A
Baffle box and 81 linear feet of exfiltration trench 3.3 Unknown 2002 Completed 0 0.1
MB-8
Pelican Key Drainage Improvements – Basin 14 Baffle box Central A
Baffle box and 48 linear feet of exfiltration trench 1.8 Unknown 2002 Completed 0 0.0
MB-9 Basin 5 – Ocean Ave Baffle Box Baffle box Central A
Baffle box at Ocean Ave. outfall 58.3 Unknown 2000 Completed 3 2.9
MB-10 Basin 10 – Cherry Dr Baffle Box Baffle box Central A Baffle box at Cherry Dr. outfall 87.4 Unknown 2000 Completed 3 2.6
MB-11 Basin 15 – Neptune Dr Baffle Box Baffle box Central A
Baffle box at Neptune Dr. outfall 5.8 Unknown 2000 Completed 0 0.1
MB-12 Basin 17 – Riverview Lane Baffle Box Baffle box Central A
Baffle box at Riverview Lane outfall 1.1 Unknown 2000 Completed 0 0.0

FINAL Central Indian River Lagoon Basin Management Action Plan – January 2013
100
PROJECT NUMBER PROJECT NAME
PROJECT TYPE
PROJECT ZONE PROJECT DETAIL
TREATMENT ACRES
PROJECT COST END DATE STATUS
TN REDUCTION
(LBS/YR)
TP REDUCTION
(LBS/YR)
MB-13 Basin 18 – Riverview Lane Baffle Box Baffle box Central A
Baffle box at Riverview Lane outfall 5.9 Unknown 2000 Completed 0 0.1
MB-14 Curb Inlet Baskets – Basins 4, 6, 10 & 15
Curb inlet baskets Central A
26 curb inlet baskets installed in Basins 4, 6, 10, and 15 118.1 Unknown 2000 Completed 5 3.5
MB-15 Melbourne Beach Chevron
100% on-site retention Central A
Redevelopment of entire existing site formerly paved with no treatment; constructed stormwater retention 0.6 Unknown 2010 Completed 11 2.9
MB-16 Melbourne Beach Library
Dry detention Central A
Demolition of existing 5 structures and paved parking and construction of new library with parking and stormwater management system 1.5 Unknown 2001 Completed 3 0.6
MB-17 Melbourne Beach Town Hall
100% on-site retention Central A
Demolishing existing buildings and parking and constructing new buildings with retention area provides for treatment and attenuation 1.8 Unknown 2005 Completed 32 8.4
N/A Total Project Reductions N/A N/A N/A N/A N/A N/A N/A 792 135.0
TOWN OF MELBOURNE VILLAGE
PROJECT NUMBER PROJECT NAME
PROJECT TYPE PROJECT ZONE
TREATMENT ACRES
PROJECT COST
ANNUAL O&M END DATE STATUS
TN REDUCTION
(LBS/YR)
TP REDUCTION
(LBS/YR) MV-1 Platt Circle Baffle box Central A 31.1 $124,000 $2,500 2005 Completed 1 0.8
N/A Total Project Reductions N/A N/A N/A N/A N/A N/A N/A 1 0.8 TOWN OF ORCHID
PROJECT NUMBER PROJECT NAME
PROJECT TYPE PROJECT ZONE PROJECT DETAIL STATUS
TN REDUCTION (LBS/YR)
TP REDUCTION (LBS/YR)
TO-1 Education Efforts Education Central SEB Landscaping and irrigation ordinances Ongoing Not quantified Not quantified
N/A Total Project Reductions N/A N/A N/A N/A Not quantified Not quantified

FINAL Central Indian River Lagoon Basin Management Action Plan – January 2013
101
TURNPIKE AUTHORITY
PROJECT NUMBER PROJECT NAME PROJECT TYPE PROJECT ZONE PROJECT DETAIL STATUS
TN REDUCTION
(LBS/YR)
TP REDUCTION
(LBS/YR) T-1 Street Sweeping Street sweeping Central B 144 miles swept per year Ongoing 26 17.3
N/A Total Project Reductions N/A N/A N/A N/A 26 17.3

FINAL Central Indian River Lagoon Basin Management Action Plan – January 2013
102
SOUTHERN IRL CITY OF FORT PIERCE
PROJECT NUMBER PROJECT NAME PROJECT TYPE PROJECT DETAIL
TREATMENT ACRES
PROJECT COST
END DATE STATUS
TN REDUCTION (LBS/YR)
TP REDUCTION (LBS/YR)
FP-1 Heathcote Botanical Gardens Treatment train
Treatment train in Virginia Avenue Canal drainage basin, which outfalls to IRL 1,242
$1,050,000 (Phase I) 2014
Planned, funded Not quantified Not quantified
FP-2 Moore's Creek Retrofit Phases 3 & 4
Wet detention pond
Increased detention and littoral shelves 2,382 $825,000 2008 Completed Not quantified Not quantified
FP-3 South Beach Baffle Boxes Baffle box
Trap sediment in baffle boxes and increase volume of runoff treated in grassed swales 128 $573,121 2006 Completed Not quantified Not quantified
FP-4 Moore's Creek Retrofit Phase 2 Baffle box
Increased detention and trap sediment in baffle boxes 1,680 $1,480,437 2003 Completed Not quantified Not quantified
FP-5 Street Sweeping Street sweeping Street sweeping N/A Unknown Ongoing Ongoing 571 257.2
FP-6 Inlet Cleaning Inlet cleaning Inlet cleaning N/A Unknown Ongoing Ongoing 336 110.0
FP-7 Education and Outreach Efforts Education
Illicit discharge ordinance; stormwater educational shows; pamphlets, posters, mailings; industry/business educational pamphlets; storm drain inlet stencil program; and stormwater pollution hotline N/A Unknown Ongoing Ongoing Not quantified Not quantified
N/A Total Project Reductions N/A N/A N/A N/A N/A N/A 907 367.3
FDOT DISTRICT 4
PROJECT NUMBER PROJECT NAME PROJECT TYPE
TREATMENT ACRES
END DATE STATUS
TN REDUCTION (LBS/YR)
TP REDUCTION (LBS/YR)
FDOT4-11 FM# 230132-1 (System 1) Dry detention pond Unknown 2001 Completed Not quantified Not quantified FDOT4-12 FM# 230132-1 (System 2) Dry detention pond Unknown 2001 Completed Not quantified Not quantified FDOT4-13 FM# 230132-1 (System 3) Dry detention pond Unknown 2001 Completed Not quantified Not quantified FDOT4-14 FM# 230132-1 (System 4) Dry detention pond Unknown 2001 Completed Not quantified Not quantified FDOT4-15 FM# 230132-1 (System 5) Wet detention pond Unknown 2001 Completed Not quantified Not quantified FDOT4-16 FM# 230132-1 (System 6) Wet detention pond Unknown 2001 Completed Not quantified Not quantified FDOT4-17 FM# 230132-1 (System 7) 100% on-site retention Unknown 2001 Completed Not quantified Not quantified N/A Total Project Reductions N/A N/A N/A N/A Not quantified Not quantified

FINAL Central Indian River Lagoon Basin Management Action Plan – January 2013
103
FORT PIERCE FARMS WCD PROJECT NUMBER PROJECT NAME
PROJECT TYPE PROJECT DETAIL
TREATMENT ACRES
PROJECT COST
END DATE STATUS
TN REDUCTION (LBS/YR)
TP REDUCTION (LBS/YR)
FPF-1 Canal 1 Top of Bank Swale Swales
Collect stormwater runoff and provide some water quality benefit 0.19 $13,040 2007 Completed Not quantified Not quantified
FPF-2 Canal 1 Top of Bank Dry Detention
Dry detention pond
Address stormwater runoff issues and canal bank erosion immediately upstream of IRL 2.58 $37,770 2009 Completed Not quantified Not quantified
FPF-3 Discharge Criteria
Ordinance/ rule change
More stringent than standard pre vs. post; allows for approximately 11% more volume per development to be detained by stormwater system 1 to 460 N/A Ongoing Ongoing Not quantified Not quantified
N/A Total Project Reductions N/A N/A N/A N/A N/A N/A Not quantified Not quantified
NORTH ST. LUCIE RIVER WCD
PROJECT NUMBER PROJECT NAME
PROJECT TYPE PROJECT DETAIL
PROJECT COST
ANNUAL O&M COST
END DATE STATUS
TN REDUCTION (LBS/YR)
TP REDUCTION (LBS/YR)
NSLR-1 C-25 Diversion Structure
Control structure
Replace previous pump structure with gravity flow control structure $179,150 N/A 2003 Completed Not quantified Not quantified
NSLR-2
Invasive Vegetation Removal at Canals 33 and 42
Vegetation harvesting
Mechanical removal of invasive vegetation in canals and surrounding banks $16,315 $4,088 2010 Completed Not quantified Not quantified
NSLR-3 Canal Maintenance Program
Vegetation harvesting
Ongoing maintenance primarily by mechanical means to keep canals free of exotic and decaying vegetation N/A $9,40 Ongoing Ongoing Not quantified Not quantified
N/A Total Project Reductions N/A N/A N/A
N/A N/A Not quantified Not quantified

FINAL Central Indian River Lagoon Basin Management Action Plan – January 2013
104
ST. LUCIE COUNTY
PROJECT NUMBER PROJECT NAME
PROJECT TYPE PROJECT DETAIL
TREATMENT ACRES
PROJECT COST
END DATE STATUS
TN REDUCTION
(LBS/YR)
TP REDUCTION
(LBS/YR)
SLC-1 Education Efforts Education
FYN; landscaping, irrigation, fertilizer, and pet waste ordinances; PSAs, pamphlets, website, and illicit discharge program N/A Unknown Ongoing Ongoing Not quantified Not quantified
SLC-2 Street Sweeping Street sweeping 470 tons/yr collected N/A Unknown Ongoing Ongoing 664 299.1
SLC-3
Paradise Park Stormwater Improvement Retention
Construction of drainage system providing 75% treatment of first 1" runoff (excluding storage via swales) and detention capacity at 10-yr/24-hr event 168.1 $1,500,000 2014 Planned Not quantified Not quantified
SLC-4
Harmony Heights Stormwater Improvement Retention
Construction of drainage system providing 75% treatment of first 1" runoff (excluding storage via swales) and detention capacity at 10-yr/24-hr event 300 $3,000,000 2015 Planned Not quantified Not quantified
SLC-5 Taylor Creek Dredging Dredging
Three-phase sediment/muck removal project totaling approximately 200,000 cubic yards 41 $7,500,000 2015 Ongoing Not quantified Not quantified
SLC-6 Stan Blum Memorial Park
Wet detention pond Wet detention pond 4 Unknown Unknown Completed Not quantified Not quantified
N/A Total Project Reductions N/A N/A N/A N/A N/A 664 299.1
ST. LUCIE VILLAGE
PROJECT NUMBER PROJECT NAME
PROJECT TYPE PROJECT DETAIL
END DATE STATUS
TN REDUCTION
(LBS/YR)
TP REDUCTION
(LBS/YR)
SLV-1 Peninsula Drive Detention 0.75” detention storage for western half of Peninsula Drive where there was no previous treatment 2011 Completed Not quantified Not quantified
N/A Total Project Reductions N/A N/A N/A 664 299.1

FINAL Central Indian River Lagoon Basin Management Action Plan – January 2013
105
APPENDIX F: GLOSSARY OF TERMS 303(d) List: The list of Florida's waterbodies that do not meet or are not expected to meet applicable water quality standards with technology-based controls alone. 305(b) Report: Section 305(b) of the federal Clean Water Act requires states to report biennially to the EPA on the quality of the waters in the state. Background: The condition of waters in the absence of human-induced alterations. Baffle box: An underground stormwater management device that uses barriers (or baffles) to slow the flow of untreated stormwater, allowing particulates to settle out in the box before the stormwater is released into the environment. Baseline loading: The quantity of pollutants in a waterbody, used as a basis for later comparison. Basin Management Action Plan (BMAP): The document that describes how a specific TMDL will be implemented; the plan describes the specific load and wasteload allocations as well as the stakeholder efforts that will be undertaken to achieve an adopted TMDL. Basin Status Report: For the IRL Basin, this document was published in 2006 by FDEP. The report documents the water quality issues, list of water segments under consideration for a TMDL and data needs in the basin. Best Available Technology (BAT) Economically Achievable: As defined by 40 CFR, §125.3, outlines technology-based treatment requirements in permits. Best Management Practices (BMPs): Methods that have been determined to be the most effective, practical means of preventing or reducing pollution from nonpoint sources. Clean Water Act (CWA): The Clean Water Act is a 1977 amendment to the Federal Water Pollution Control Act of 1972, which set the basic structure for regulating discharges of pollutants to waters of the United States. Continuous deflective separation (CDS) Unit: A patented stormwater management device that uses the available energy of the storm flow to create a vortex to cause a separation of solids from fluids. Pollutants are captured inside the separation chamber, while the water passes out through the separation screen. Designated use: Uses specified in water quality standards for each waterbody or segment (such as drinking water, swimmable, fishable). Detention Pond: A stormwater system that delays the downstream progress of stormwater runoff in a controlled manner, typically by using temporary storage areas and a metered outlet device. Domestic Wastewater: Wastewater derived principally from dwellings, business buildings, institutions and the like; sanitary wastewater; sewage.

FINAL Central Indian River Lagoon Basin Management Action Plan – January 2013
106
Effluent: Wastewater that flows into a receiving stream by way of a domestic or industrial discharge point. Environmental Protection Agency (EPA): The agency was created in December 1970 to address the nation's environmental problems and to protect the public health. The majority of FDEP’s regulatory programs has counterparts at the EPA or is delegated from the EPA. Event mean concentration: The flow-weighted mean concentration of an urban runoff pollutant measured during a storm event. Exfiltration: Loss of water from a drainage system as the result of percolation or absorption into the surrounding soil. External loading: Pollutants originating from outside a waterbody that contribute to the pollutant load of the waterbody. Florida Department of Environmental Protection (FDEP): FDEP is Florida's principal environmental and natural resources agency. The Florida Department of Natural Resources and the Florida Department of Environmental Regulation were merged together to create FDEP effective July 1, 1993. Ground Water or Groundwater: Water below the land surface in the zone of saturation where water is at or above atmospheric pressure. Impairment: The condition of a waterbody that does not achieve water quality standards (designated use) due to pollutants or an unknown cause. Load Allocations (LA): The portions of a receiving water's loading capacity that are allocated to one of its existing or future nonpoint sources of pollution. Load Capacity: The greatest amount of loading that a waterbody can receive without violating water quality standards. Loading: The total quantity of pollutants in stormwater runoff that contributes to the water quality impairment. Margin of safety (MOS): An explicit or implicit assumption used in the calculation of a TMDL, which takes into account any lack of knowledge concerning the relationship between effluent limitations and water quality. An explicit MOS is typically a percentage of the assimilative capacity or some other specific amount of pollutant loading (e.g., the loading from an out-of-state source). Most FDEP-adopted TMDLs include an implicit MOS based on the fact that the predictive model runs incorporate a variety of conservative assumptions (they examine worst-case ambient flow conditions, worst-case temperature, and assume that all permitted point sources discharge at their maximum permittable amount). National Pollutant Discharge Elimination System (NPDES): The permitting process by which technology based and water quality–based controls are implemented. Nonpoint Source (NPS): Diffuse runoff without a single point of origin that flows over the surface of the ground by stormwater and is then introduced to surface or ground water. NPS

FINAL Central Indian River Lagoon Basin Management Action Plan – January 2013
107
includes atmospheric deposition and runoff or leaching from agricultural lands, urban areas, unvegetated lands, OSTDS, and construction sites. Nonpoint Source Pollution: Nonpoint source pollution is created by the flushing of pollutants from the landscape by rainfall and the resulting stormwater runoff, or by the leaching of pollutants through the soils into the ground water. Outfall (general): The place where a sewer, drain, or stream discharges. Outfall (MS4): A point source at the location where a MS4 discharges to water of the state and does not include open conveyances connecting two municipal separate storm sewers, or pipes, tunnels, or other conveyances which connect segments of the same stream or other waters of the state and are used to convey waters of the state. Particulate: A minute separate particle, as of a granular substance or powder. Pollutant Load Reduction Goals (PLRGs): PLRGs are defined as the estimated numeric reductions in pollutant loadings needed to preserve or restore designated uses of receiving waterbodies and maintain water quality consistent with applicable state water quality standards. PLRGs are developed by the water management districts. Point Source: An identifiable and confined discharge point for one or more water pollutants, such as a pipe, channel, vessel, or ditch. Pollutant: Generally any substance, such as a chemical or waste product, introduced into the environment that adversely affects the usefulness of a resource. Pollution: An undesirable change in the physical, chemical, or biological characteristics of air, water, soil, or food that can adversely affect the health, survival, or activities of humans or other living organisms. Removal efficiency: A description of how much of a given substance (metals, sediment, etc.) has been extracted from another substance. Retention Pond: A stormwater management structure whose primary purpose is to permanently store a given volume of stormwater runoff, releasing it by infiltration and /or evaporation. Reuse: The deliberate application of reclaimed water for a beneficial purpose. Criteria used to classify projects as “reuse” or “effluent disposal” are contained in Subsection 62-610.810, F.A.C. Quality Assurance (QA): An integrated system of management activities involving planning, implementation, documentation, assessment, reporting, and quality improvement to ensure that a process, product, or service meets defined standards of quality. Quality Control (QC): The overall system of technical activities that measures the attributes and performance of a process, product, or service against defined standards to verify that they meet the established data quality objectives. Septic Tank: A watertight receptacle constructed to promote the separation of solid and liquid components of wastewater, to provide the limited digestion of organic matter, to store solids,

FINAL Central Indian River Lagoon Basin Management Action Plan – January 2013
108
and to allow clarified liquid to discharge for further treatment and disposal in a soil absorption system. STORET: The EPA's STOrage and RETrieval database, used nationally for water quality data storage. Stormwater runoff: The portion of rainfall that hits the ground and is not evaporated, percolated, or transpired into vegetation, but rather flows over the ground surface seeking a receiving water body. Surface Water: Water on the surface of the earth, whether contained in bounds created naturally or artificially or diffused. Water from natural springs is classified as surface water when it exits the spring onto the earth’s surface. Surface Water Improvement and Management (SWIM) Waterbody: A waterbody designated by statute or by a water management district for priority management to restore and maintain water quality, habitat, and other natural features of the waterbody. The IRL Basin has this special designation. Total Maximum Daily Load (TMDL): The sum of the individual wasteload allocations for point sources and the load allocations for nonpoint sources and natural background. Prior to determining individual wasteload allocations and load allocations, the maximum amount of a pollutant that a waterbody or waterbody segment can assimilate from all sources while still maintaining its designated use must first be calculated. TMDLs are based on the relationship between pollutants and in stream water quality conditions. Wasteload Allocations (WLAs): Pollutant loads allotted to existing and future point sources, such as discharges from industry and sewage facilities. Wastewater: The combination of liquid and pollutants from residences, commercial buildings, industrial plants, and institutions, together with any ground water, surface runoff, or leachate that may be present. Waterbody Identification (WBID) Numbers: WBIDs are numbers assigned to hydrologically based drainage areas in a river basin. Water Quality Standards (WQSs): (1) Standards that comprise the designated most beneficial uses (classification of water), the numeric and narrative criteria applied to the specific water use or classification, the Florida Anti-degradation Policy, and the moderating provisions contained in Rules 62-302 and 62-4, F.A.C. (2) State-adopted and EPA-approved ambient standards for waterbodies. The standards prescribe the use of the waterbody (such as drinking, fishing and swimming, and shellfish harvesting) and establish the water quality criteria that must be met to protect designated uses. Watershed: Topographic area that contributes or may contribute runoff to specific surface waters or an area of recharge. Watershed management approach: The process of addressing water quality concerns within their natural boundaries, rather than political or regulatory boundaries. The process draws together all the participants and stakeholders in each basin to decide what problems affect the water quality in the basin, which are most important, and how they will be addressed.

FINAL Central Indian River Lagoon Basin Management Action Plan – January 2013
109
APPENDIX G: BIBLIOGRAPHY OF KEY REFERENCES AND WEBSITES REFERENCES: Florida Department of Environmental Protection:
• 2006. Water quality status report: Indian River Lagoon. • 2008. Water quality assessment report: Indian River Lagoon. • 2009. TMDL Report: Nutrient and Dissolved Oxygen TMDLs for the Indian River Lagoon
and Banana River Lagoon. • 2012. Emission Sources: NSR/PSD Construction Permits – FPL Cape Canaveral,
Brevard County. Web. May 15, 2012. Available: http://www.dep.state.fl.us/Air/emission/construction/fplcanaveral.htm
Hazen and Sawyer, P.C. 2008. Indian River Lagoon economic assessment and analysis update. Prepared for the Indian River Lagoon National Estuary Program in cooperation with the St. Johns River Water Management District and South Florida Water Management District.
Indian River Lagoon National Estuary Program. 2008. Indian River Lagoon Comprehensive Conservation and Management Plan update 2008. Palm Bay, FL.
St. Johns River Water Management District: • 2008. The Turkey Creek C-1 Rediversion Project. • 2010a. Upper St. Johns River Basin. Web. May 8, 2012. Available:
http://floridaswater.com/upperstjohnsriver/. • 2010b. Fellsmere Water Management Area. Web. May 8, 2012. Available:
http://floridaswater.com/upperstjohnsriver/fellsmereWMA.html. • 2011. Adkins, M. The C-1 Re-Diversion Final Plan: Evaluation of the C-10 Retention
Area. Draft technical memorandum, 2/4/2011. Division of Engineering, St. Johns River Water Management District, Palatka, FL.
• 2012a. Steward, J. An assessment of the nutrient TMDL benefit of the C-1 Re-Diversion Project. Draft technical memorandum 5/24/2012. St. Johns River Water Management District, Palatka, FL.
• 2012b. Fellsmere Farms Restoration Project fact sheet. St. Johns River Water Management District et al. June 2012. Indian River Lagoon 2011
superbloom plan of investigation.

FINAL Central Indian River Lagoon Basin Management Action Plan – January 2013
110
WEBSITES: TABLE G-1: STORMWATER AND WATER QUALITY PROTECTION WEBSITES
- = Empty cell
WEBSITE URL LOCAL AND REGIONAL SITES - SJRWMD IRL Basin http://floridaswater.com/itsyourlagoon/ IRL CCMP, originally published in 1996 http://floridaswater.com/itsyourlagoon/pdfs/IRL_CCMP.pdf IRL CCMP Update, published in 2008 http://floridaswater.com/itsyourlagoon/pdfs/CCMP_Update_2008_Final.pdf IRL SWIM Plan 2002 update http://www.floridaswater.com/SWIMplans/2002_IRL_SWIM_Plan_Update.pdf STATE SITES - General Portal for Florida http://www.myflorida.com FDEP http://www.dep.state.fl.us/ Watershed management http://www.dep.state.fl.us/water/watersheds/index.htm TMDL Program http://www.dep.state.fl.us/water/tmdl/index.htm BMPs, public information http://www.dep.state.fl.us/water/nonpoint/pubs.htm NPDES Stormwater Program http://www.dep.state.fl.us/water/stormwater/npdes/index.htm NPS funding assistance http://www.dep.state.fl.us/water/nonpoint/319h.htm IRL Basin Water Quality Assessment Report http://www.dep.state.fl.us/water/basin411/indianriver/assessment.htm Adopted BMAPs http://www.dep.state.fl.us/water/watersheds/bmap.htm IRL FTP site http://publicfiles.dep.state.fl.us/DEAR/BMAP/IndianRiverLagoon/ FDACS Office of Agricultural Water Policy http://www.floridaagwaterpolicy.com/ NATIONAL SITES - Center for Watershed Protection http://www.cwp.org/ EPA Office of Water EPA Region 4 (Southeast US) Clean Water Act history
http://www.epa.gov/water http://www.epa.gov/region4 http://www.epa.gov/lawsregs/laws/cwahistory.html
U.S. Geological Survey: Florida Waters http://sofia.usgs.gov/publications/reports/floridawaters/#options