In-Sink Food Waste Disposers As Organics Management Toolwastewater into three products: clean water,...
50
*This document and the information it contains are the property of InSinkErator®. By viewing it or accepting it into your possession, you agree that: (1) all right, title and interest in and to this document, and all information contained herein, are reserved by and to InSinkErator; (2) you will keep this document, and all information contained herein, in strictest confidence, and will not disclose, copy, retransmit, use (except for InSinkErator’s benefit), sell, lend or otherwise dispose of the same, directly or indirectly, without the express written permission of InSinkErator; (3) you will include this legend on any such authorized copy, retransmission or disclosure; and (4) this document shall be returned to InSinkErator (along with any and all copies, expressly authorized or otherwise) immediately upon request. This information is being provided "AS IS" and "WITH ALL FAULTS." While the information contained herein is believed to be accurate, no warranty or representation is provided of any kind, express or implied. The information contained in this document may also be protected by trade secret laws and other forms of intellectual property protection. © 2014 – InSinkErator® – Confidential & Proprietary – All Rights Reserved* In - Sink Food Waste Disposers As Organics Management Tool Comments and Recommendations Re Regional Position on Food Waste Grinders and Similar Technologies Presentation to Zero Waste Committee Metro Vancouver 10 September, 2015 Kendall Christiansen, Gaia Strategies, Senior Consultant
Transcript of In-Sink Food Waste Disposers As Organics Management Toolwastewater into three products: clean water,...
© 2014 – InSinkErator®
Confidential & Proprietary – All Rights Reserved*
*This document and the information it contains are the property of InSinkErator®. By viewing it or accepting it into your
possession, you agree that: (1) all right, title and interest in and to this document, and all information contained herein, are
reserved by and to InSinkErator; (2) you will keep this document, and all information contained herein, in strictest confidence, and
will not disclose, copy, retransmit, use (except for InSinkErator’s benefit), sell, lend or otherwise dispose of the same, directly or
indirectly, without the express written permission of InSinkErator; (3) you will include this legend on any such authorized copy,
retransmission or disclosure; and (4) this document shall be returned to InSinkErator (along with any and all copies, expressly
authorized or otherwise) immediately upon request. This information is being provided "AS IS" and "WITH ALL FAULTS." While
the information contained herein is believed to be accurate, no warranty or representation is provided of any kind, express or
implied. The information contained in this document may also be protected by trade secret laws and other forms of intellectual
property protection.
© 2014 – InSinkErator® – Confidential & Proprietary – All Rights Reserved*
In-Sink Food Waste DisposersAs Organics Management Tool
Comments and Recommendations ReRegional Position on Food Waste Grinders and Similar Technologies
Presentation to Zero Waste Committee
Metro Vancouver
10 September, 2015
Kendall Christiansen, Gaia Strategies, Senior Consultant
2InSinkErator Confidential
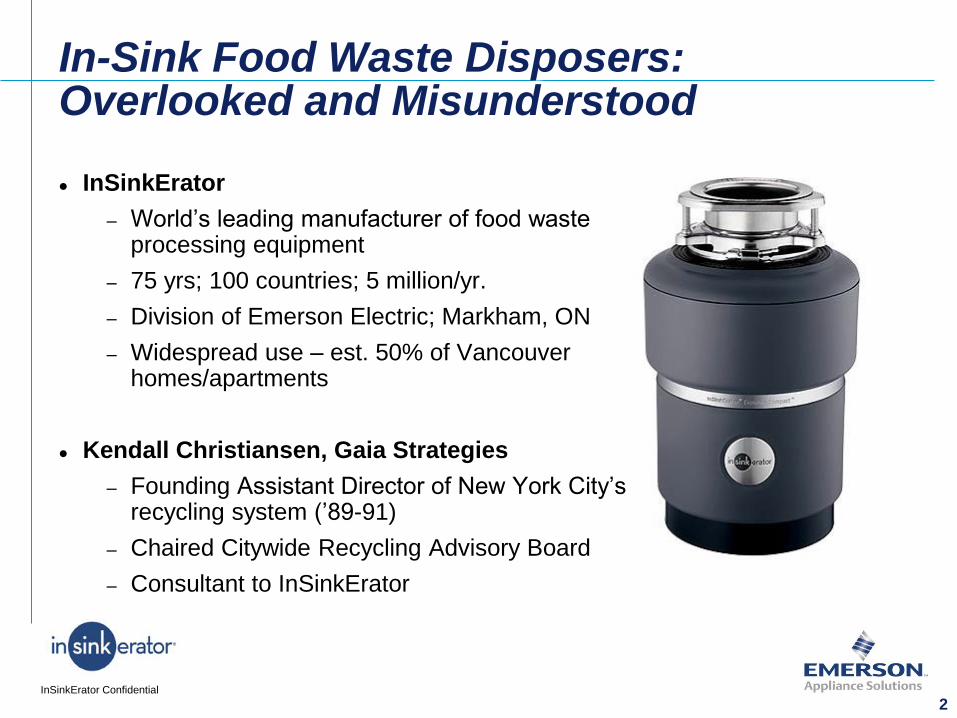
In-Sink Food Waste Disposers:Overlooked and Misunderstood
InSinkErator
– World’s leading manufacturer of food waste processing equipment
– 75 yrs; 100 countries; 5 million/yr.
– Division of Emerson Electric; Markham, ON
– Widespread use – est. 50% of Vancouver homes/apartments
Kendall Christiansen, Gaia Strategies
– Founding Assistant Director of New York City’s recycling system (’89-91)
– Chaired Citywide Recycling Advisory Board
– Consultant to InSinkErator
3InSinkErator Confidential
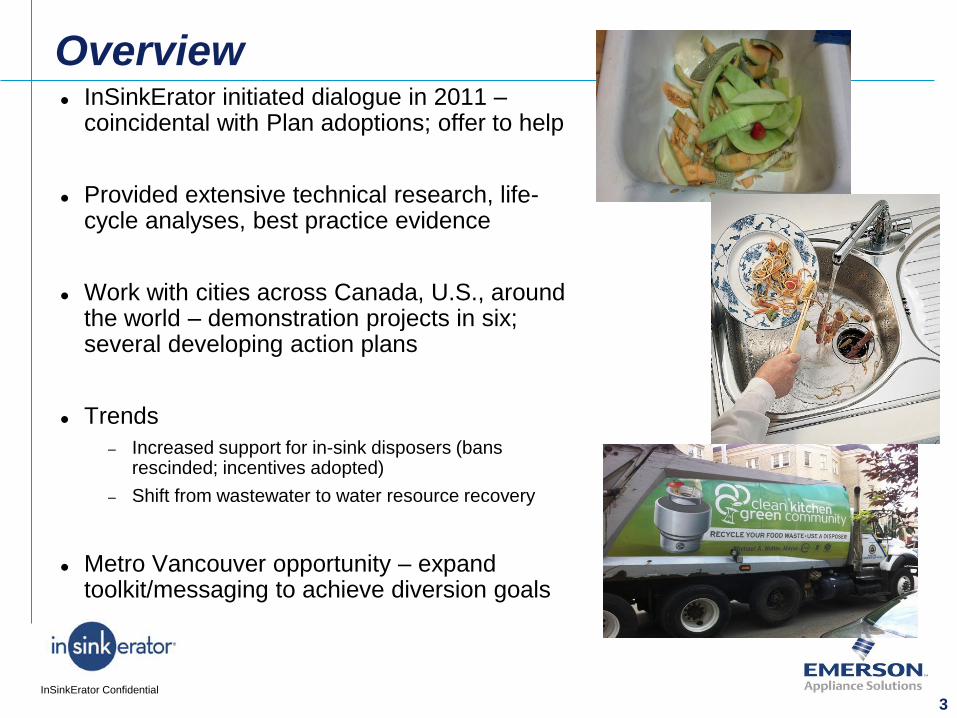
Overview InSinkErator initiated dialogue in 2011 –
coincidental with Plan adoptions; offer to help
Provided extensive technical research, life-cycle analyses, best practice evidence
Work with cities across Canada, U.S., around the world – demonstration projects in six; several developing action plans
Trends
– Increased support for in-sink disposers (bans rescinded; incentives adopted)
– Shift from wastewater to water resource recovery
Metro Vancouver opportunity – expand toolkit/messaging to achieve diversion goals
4InSinkErator Confidential
Report Comments - 1
Definition of “disposal”
Sending food scraps through sewers is not disposal equivalent to landfilling
Current theory and practice in what is now the water resource recovery sector; philosophy reflected in Metro’s own Integrated Liquid Waste and Resource Waste Management Plan
Annacis Island and the planned Lion’s Gate plant are zero-waste resource recovery facilities - process wastewater into three products: clean water, renewable energy, and fertilizer products – energy-neutral operations
Water Environment Research Foundation report confirmed the potential of that sector to help solve the organics management challenges faced by municipalities
Major cities considering disposer-based initiatives – following on demonstration projects in six major cities
5InSinkErator Confidential
Report Comments - 2
Highest and best use: More complex – in both concept and execution
Water is principal component (70%+)
Produce energy (biogas) before composting
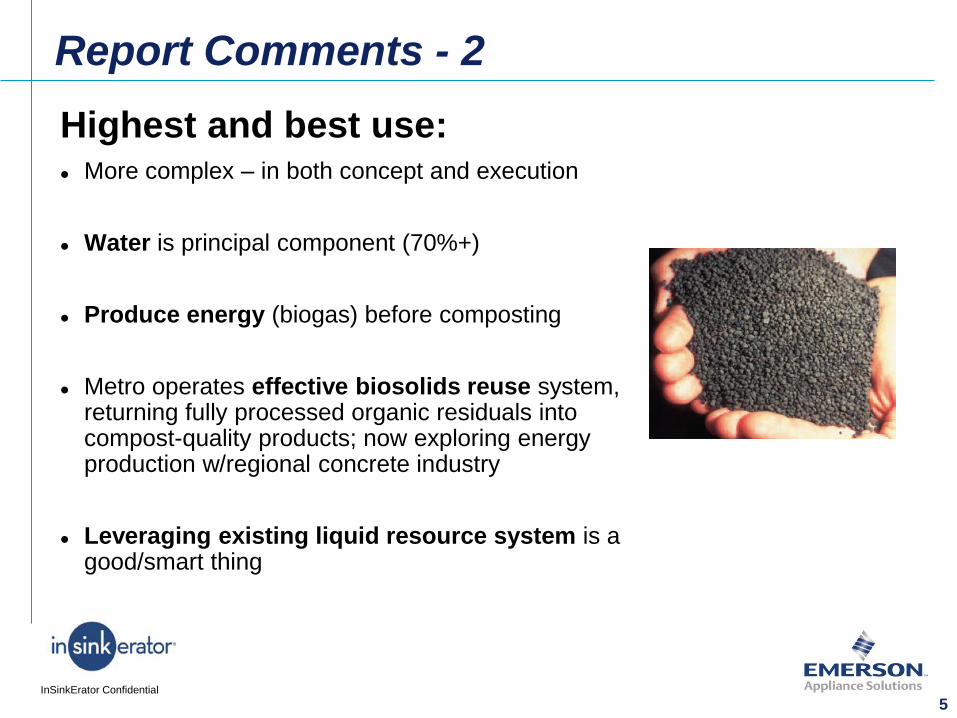
Metro operates effective biosolids reuse system, returning fully processed organic residuals into compost-quality products; now exploring energy production w/regional concrete industry
Leveraging existing liquid resource system is a good/smart thing
6InSinkErator Confidential
Report Comments - 3
Cost of processing:
Flawed comparison: processing one ton of BOD & TSS via the wastewater system is pegged at $1,800/ton, contrasted with just $70 when a ton of food waste is delivered to a compost facility
The reason: they don’t measure the same thing
A ton of food waste contains 17% TSS (approx. same percentage of BOD)
Food scraps are mostly water (75%)
Comparative-costs analyses conducted for London (ON) and York Region
– Wastewater processing cost was about two-thirds of the regional compost facility
– Without considering the costs of municipal truck-based collection

7InSinkErator Confidential
For Your Consideration
Take report under advisement– Don’t rush into a particular course of action
– Don’t ignore/discourage use of in-sink disposers
– Strong consumer interest in ongoing use
Consider food waste disposers as “and” - not “or”– Communicate to residents re all options for managing their food scraps
– Appropriate tool for multi-residential buildings – biggest challenge
Reconsider joint committee of the Utilities and Zero Waste Committees
– An unusual cross-sectoral challenge – silo-busting
– Charge: full, fair consideration of all relevant information
RCBC Hotline and Metro Vancouver
Brock Macdonaldwww.rcbc.ca
@RecyclingBC
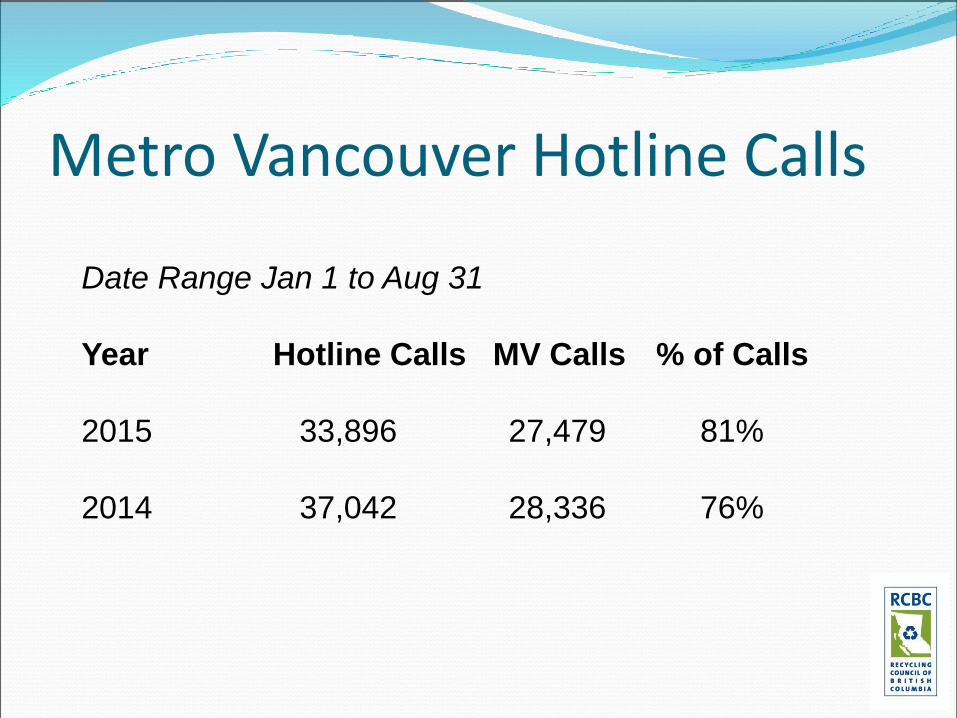
Metro Vancouver Hotline Calls
Date Range Jan 1 to Aug 31
Year Hotline Calls MV Calls % of Calls
2015 33,896 27,479 81%
2014 37,042 28,336 76%
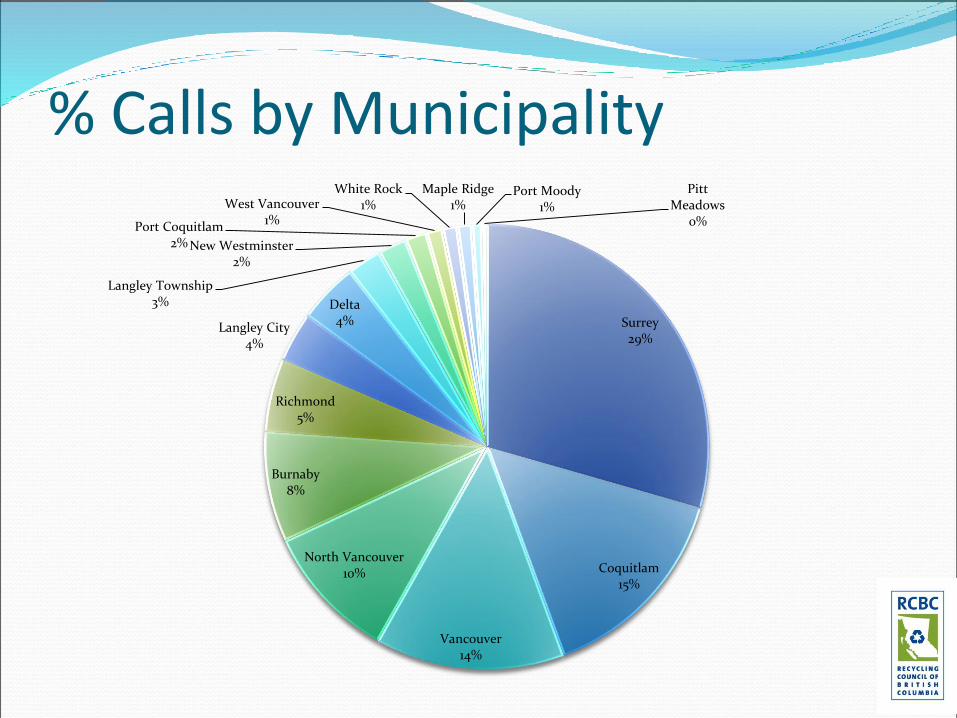
% Calls by Municipality
Surrey29%
Coquitlam15%
Vancouver14%
North Vancouver10%
Burnaby8%
Richmond5%
Langley City4%
Delta4%
Langley Township3%
New Westminster2%
Port Coquitlam2%
West Vancouver1%
White Rock1%
Maple Ridge1%
Port Moody1%
Pitt Meadows
0%
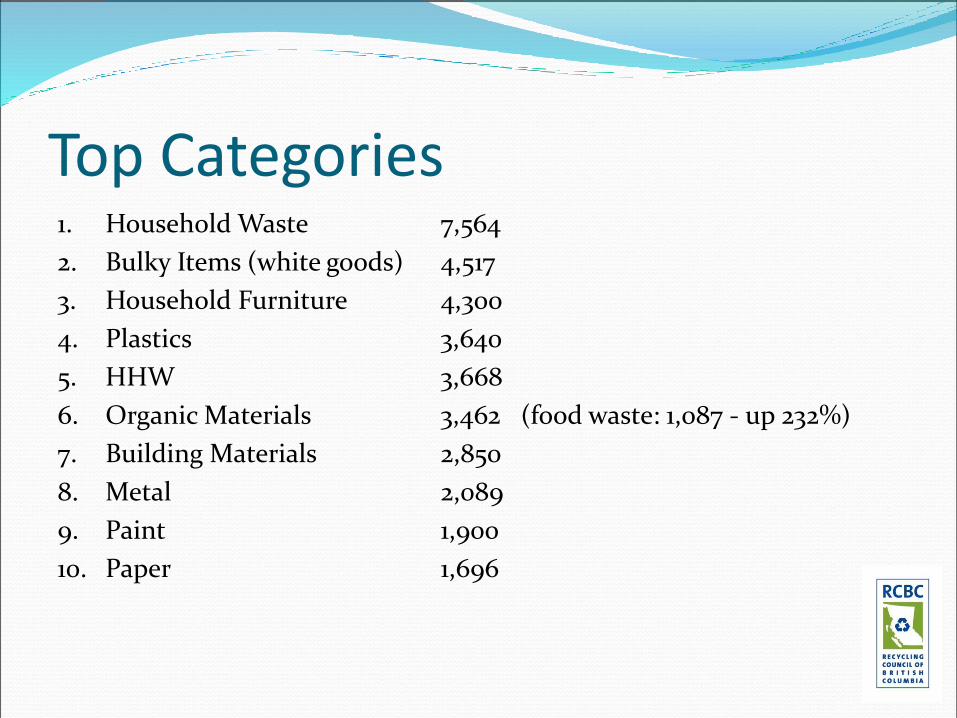
Top Categories1. Household Waste 7,564
2. Bulky Items (white goods) 4,517
3. Household Furniture 4,300
4. Plastics 3,640
5. HHW 3,668
6. Organic Materials 3,462 (food waste: 1,087 - up 232%)
7. Building Materials 2,850
8. Metal 2,089
9. Paint 1,900
10. Paper 1,696

Regional Position on the Use of Food Grinders and Similar Technologies
Zero Waste Committee
Fred Nenninger
Director,
Policy, Planning & Analysis, Liquid Waste Services
September 10, 2015

Drivers for Position on Food Grinders
Residential
Integrated Liquid Waste & Resource Management Plan
• Commitment to investigate the implications of the use of domestic food grinders.
Commercial
• Potential option for businesses to manage organic wastes as a part of the solid waste organics ban
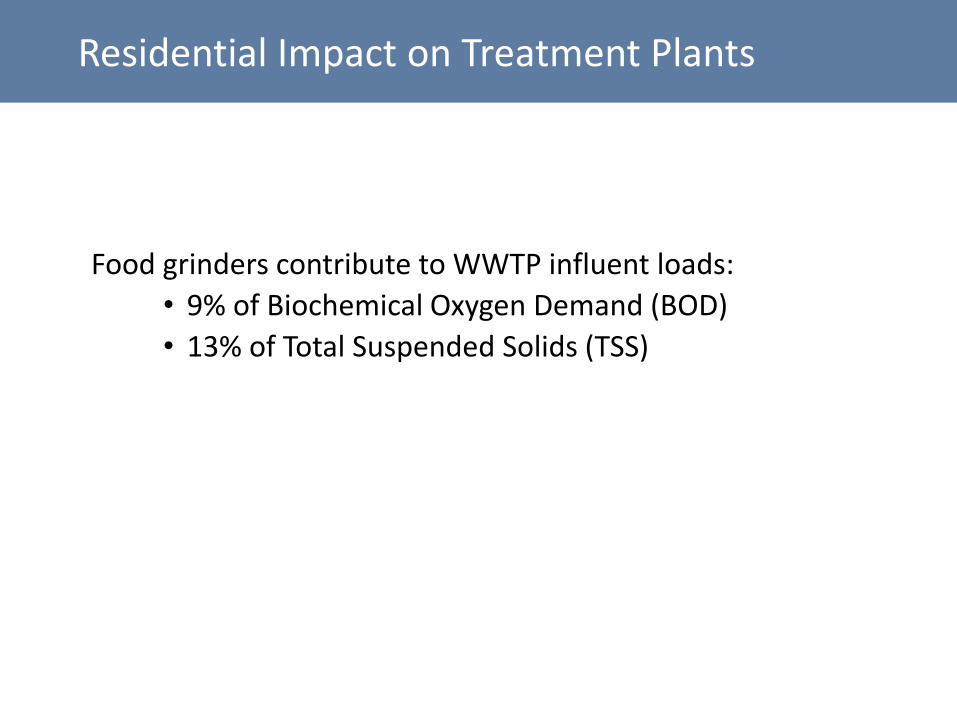
Residential Impact on Treatment Plants
Food grinders contribute to WWTP influent loads:
• 9% of Biochemical Oxygen Demand (BOD)
• 13% of Total Suspended Solids (TSS)
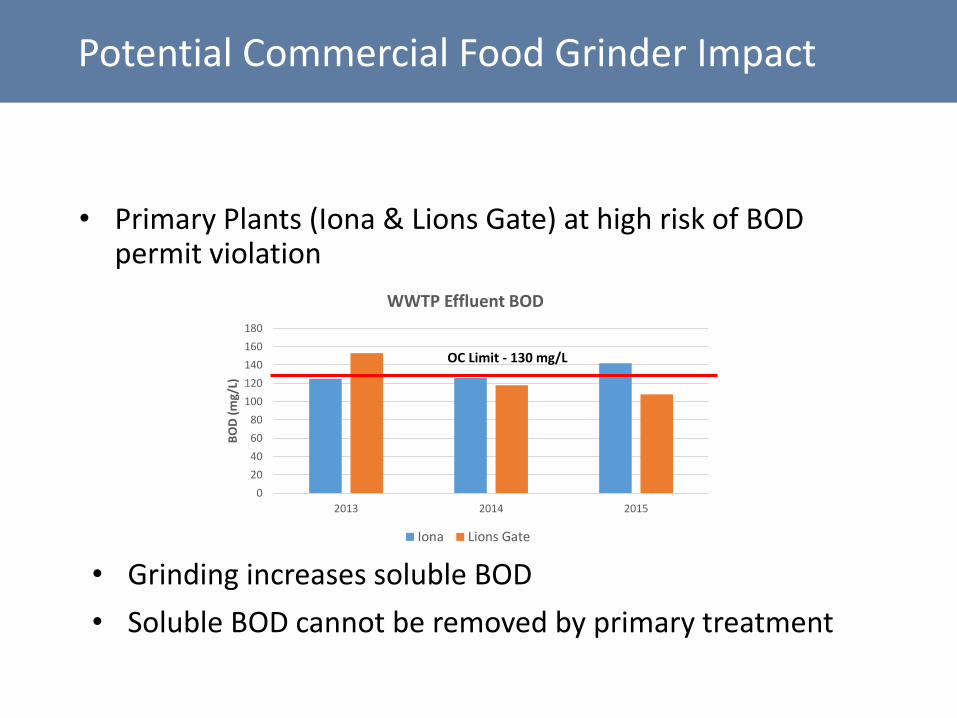
Potential Commercial Food Grinder Impact
• Primary Plants (Iona & Lions Gate) at high risk of BOD permit violation
• Grinding increases soluble BOD
• Soluble BOD cannot be removed by primary treatment
0
20
40
60
80
100
120
140
160
180
2013 2014 2015
BO
D (
mg/
L)
WWTP Effluent BOD
Iona Lions Gate
OC Limit - 130 mg/L
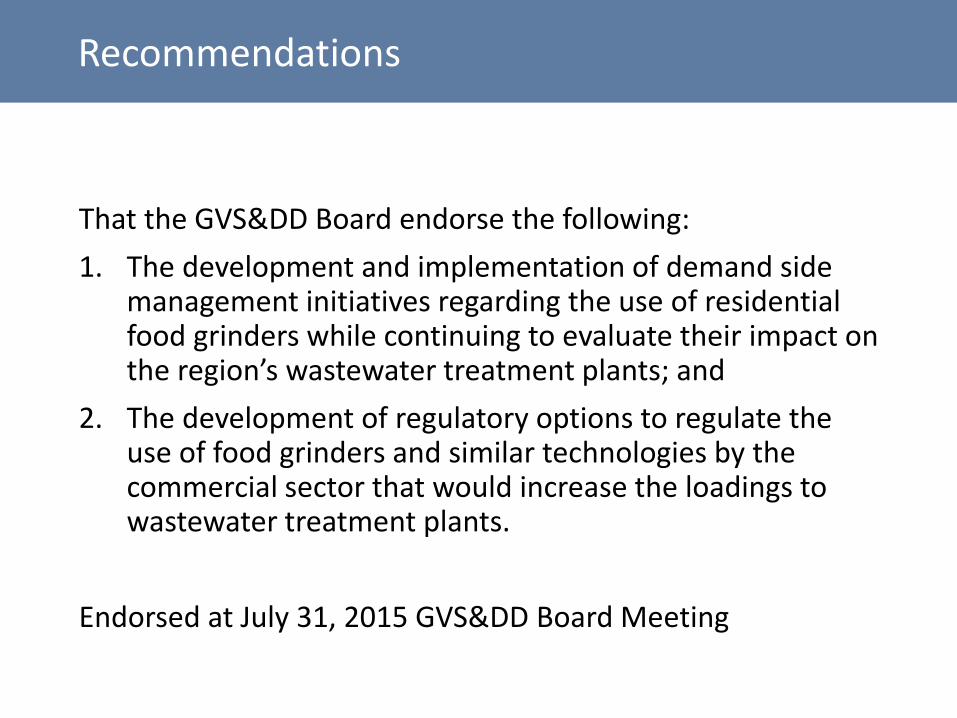
Recommendations
That the GVS&DD Board endorse the following:
1. The development and implementation of demand side management initiatives regarding the use of residential food grinders while continuing to evaluate their impact on the region’s wastewater treatment plants; and
2. The development of regulatory options to regulate the use of food grinders and similar technologies by the commercial sector that would increase the loadings to wastewater treatment plants.
Endorsed at July 31, 2015 GVS&DD Board Meeting

Organics Recycling Update
Food isn’t garbage!
Zero Waste Committee, September 10, 2015
Marian Kim, Solid Waste Services
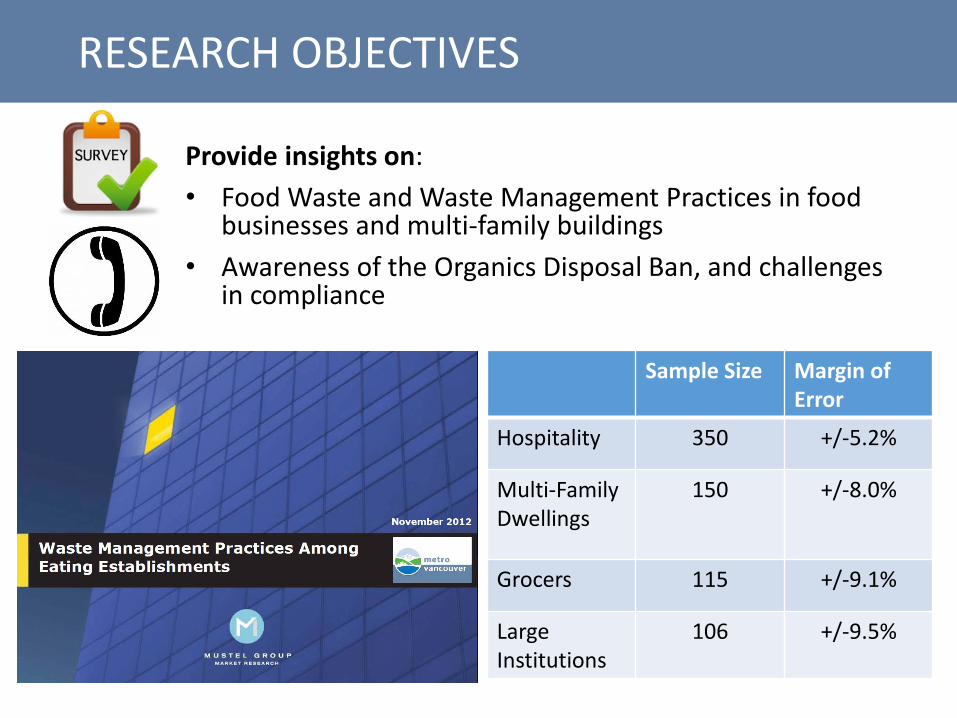
RESEARCH OBJECTIVES
Provide insights on:
• Food Waste and Waste Management Practices in food businesses and multi-family buildings
• Awareness of the Organics Disposal Ban, and challenges in compliance
Sample Size Margin of Error
Hospitality 350 +/-5.2%
Multi-Family Dwellings
150 +/-8.0%
Grocers 115 +/-9.1%
Large Institutions
106 +/-9.5%

ACCESS TO FOOD SCRAPS RECYCLING
2012 Results
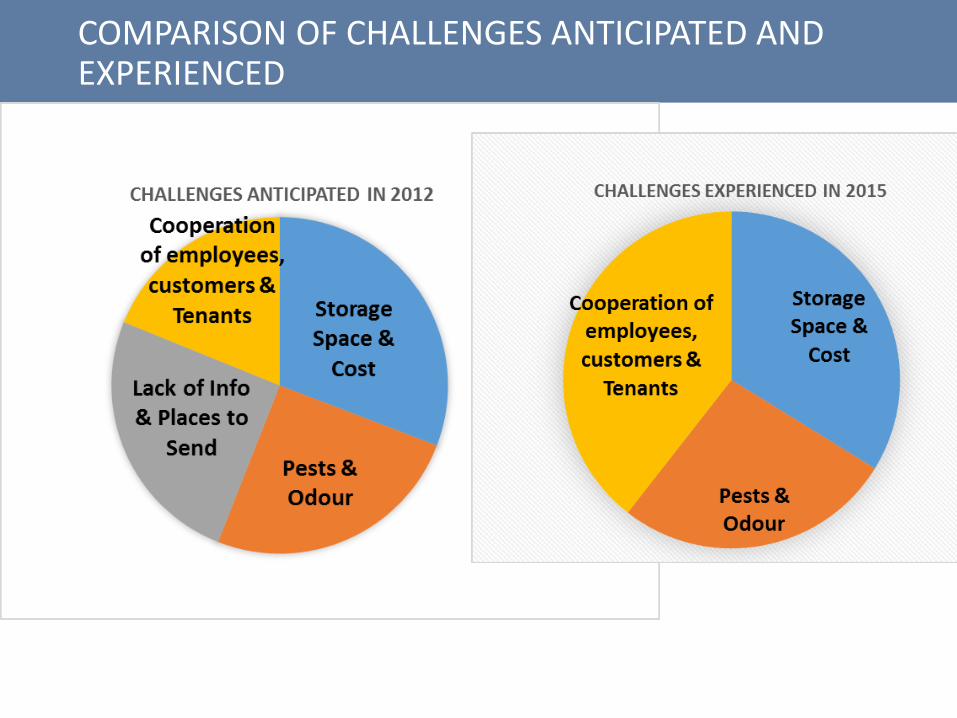
COMPARISON OF CHALLENGES ANTICIPATED AND EXPERIENCED

INSPECTION OF GARBAGE LOADS CONTAINING FOOD WASTE AT REGIONAL FACILITIES
Low Number of Loads Containing Food Waste and Clean Wood Waste
Education NoticeMonthly Average(Jan – Jun 2015)
DedicatedInspectionJun 2015
Surcharges
July 2015
Food Waste>25%
15 12 27
CWW>10%
63 50 33
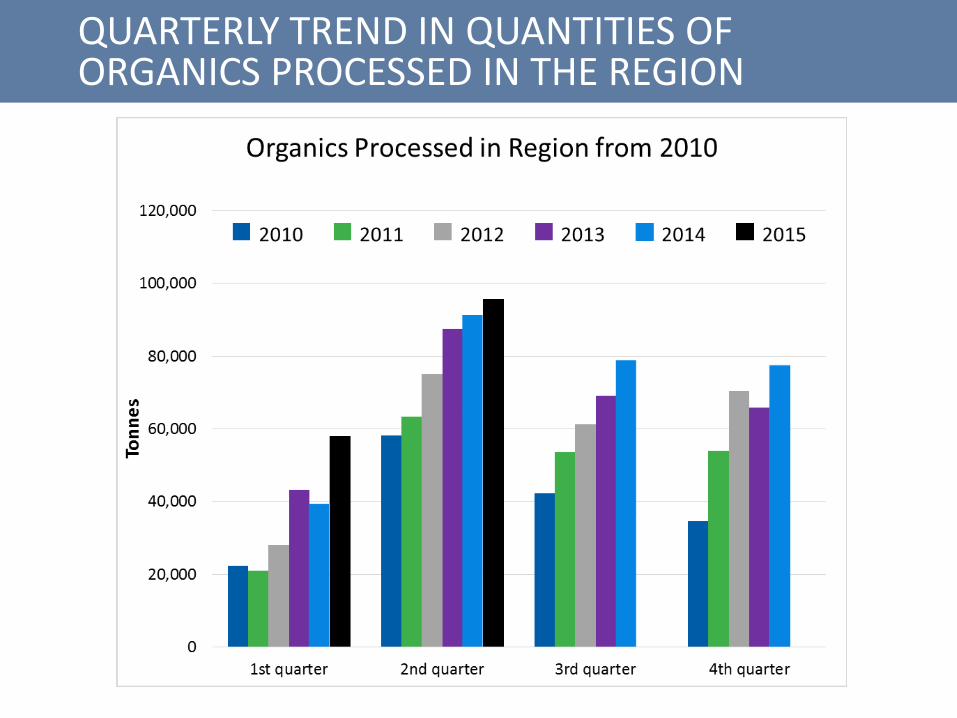
QUARTERLY TREND IN QUANTITIES OF ORGANICS PROCESSED IN THE REGION
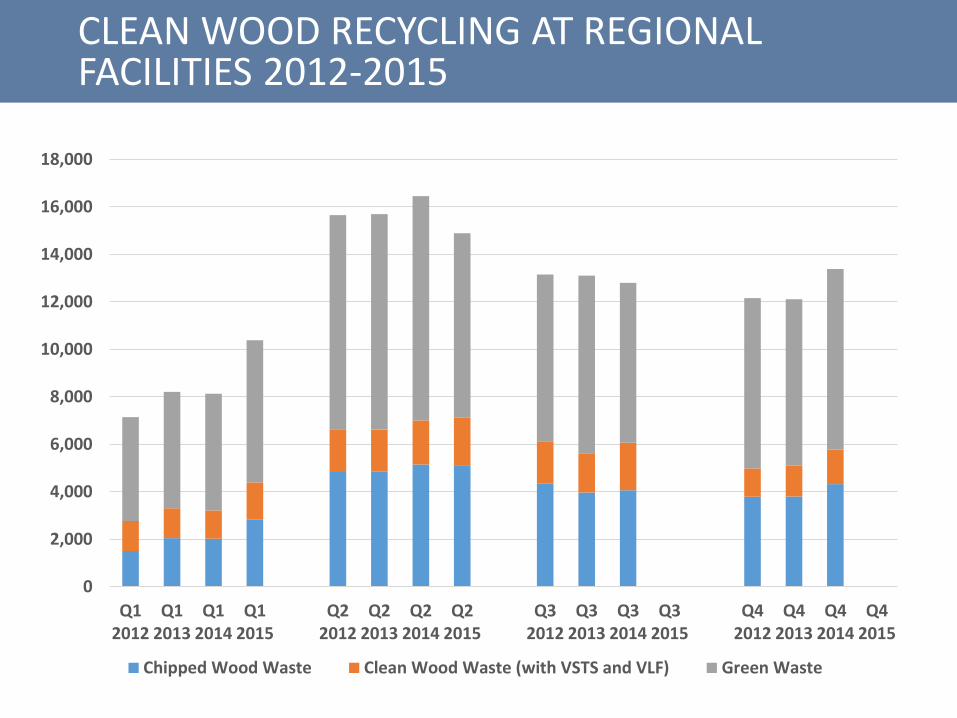
CLEAN WOOD RECYCLING AT REGIONAL FACILITIES 2012-2015
0
2,000
4,000
6,000
8,000
10,000
12,000
14,000
16,000
18,000
Q12012
Q12013
Q12014
Q12015
Q22012
Q22013
Q22014
Q22015
Q32012
Q32013
Q32014
Q32015
Q42012
Q42013
Q42014
Q42015
Chipped Wood Waste Clean Wood Waste (with VSTS and VLF) Green Waste
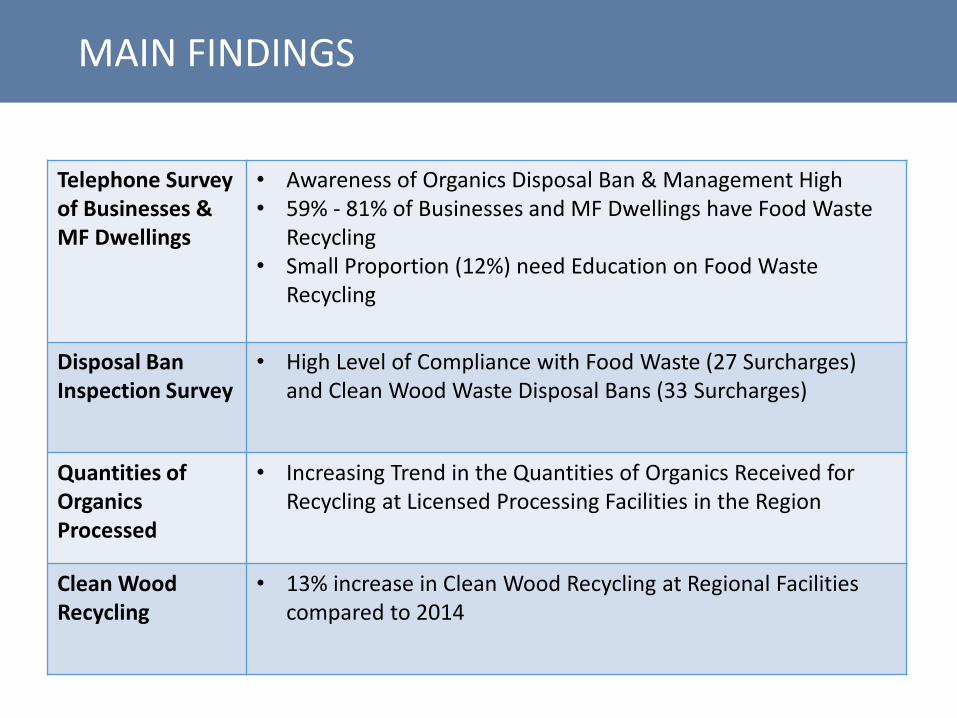
MAIN FINDINGS
Telephone Survey of Businesses & MF Dwellings
• Awareness of Organics Disposal Ban & Management High• 59% - 81% of Businesses and MF Dwellings have Food Waste
Recycling• Small Proportion (12%) need Education on Food Waste
Recycling
Disposal Ban Inspection Survey
• High Level of Compliance with Food Waste (27 Surcharges) and Clean Wood Waste Disposal Bans (33 Surcharges)
Quantities of Organics Processed
• Increasing Trend in the Quantities of Organics Received for Recycling at Licensed Processing Facilities in the Region
Clean Wood Recycling
• 13% increase in Clean Wood Recycling at Regional Facilities compared to 2014
THANK YOU
Solid Waste Strategy Update
Zero Waste CommitteeSeptember 10, 2015
PAUL HENDERSON, P. Eng.General Manager, Solid Waste Services, Metro Vancouver
2
OUTLINE
• Solid Waste Strategy Background
• Update on:
Transfer Station Strategy
Solid Waste System Interim Funding Strategy
2016 Tipping Fee Bylaw Proposed Provisions

3
SOLID WASTE DISPOSAL SYSTEM
Legend
MV Transfer Station
MV Residential Drop-off
City of Vancouver Facility
Waste To Energy Facility
Cache Creek Landfill
North Shore
Coquitlam
Maple RidgeSurrey
Langley
Matsqui
Vancouver Transfer Station
WTE
Vancouver Landfill
Cache Creek Landfill

4
SOLID WASTE STRATEGY - FINANCIAL UPDATE
• Tipping Fee structure changed to variable rate structure effective April 2015
• Small projected 2015 surplus (2015 Budget $4.5 million deficit)
• Additional measures required to achieve financial stability beyond 2015
• Key financial drivers
• Waste flows
• Landfill operating and closure costs

5
0
2,000
4,000
6,000
8,000
10,000
12,000
14,000
16,000
18,000
20,000
Jan Feb Mar Apr May Jun Jul Aug Sep Oct Nov Dec
Ton
ne
s
Month
2011 2012 2013 2014 2015 Includes transport by rail and estimated transport by truck
FLOWS ACROSS ABBOTSFORD BORDER DECREASED
Estimates only

6
0
10,000
20,000
30,000
40,000
50,000
60,000
70,000
80,000
90,000
100,000
110,000
Jan Feb Mar Apr May Jun Jul Aug Sep Oct Nov Dec
Ton
ne
s
2013
2014
2015
REGIONAL WASTE FLOWS STABILIZED
- Includes Metro Vancouver and City of Vancouver ICI and Residential Garbage- Estimates only; flows finalized year-end.
201320142015

7
ILLEGAL DUMPING
DATA SHOWS NO IMPACT OF TIPPING FEE CHANGES ON ILLEGAL DUMPING
• Municipalities respond to an estimated 40,000 to 50,000 illegal dumping incidents per year, growing over time
• Estimated municipal cost: $3,000,000 per year
• Numerous factors affect illegal dumping
• Municipal data shows no observed increase in illegal dumping due to change in tipping fee structure
• Average cost for small load: $31 (up from $22)
• Will continue to work with municipalities to monitor illegal dumping

8
TRANSFER STATION STRATEGY
9
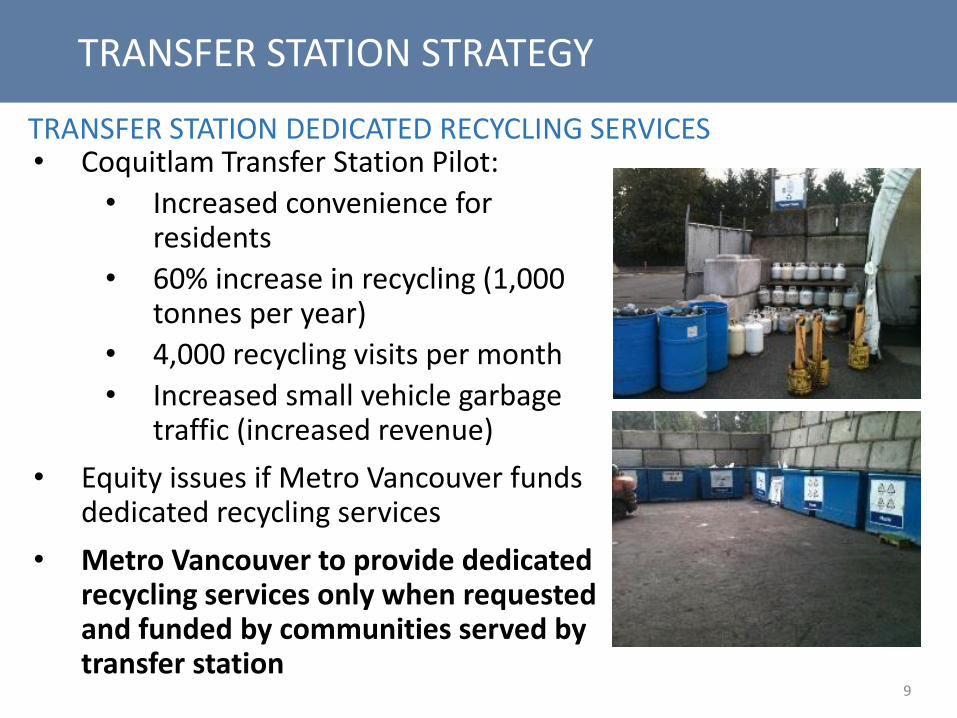
TRANSFER STATION STRATEGY
TRANSFER STATION DEDICATED RECYCLING SERVICES• Coquitlam Transfer Station Pilot:
• Increased convenience for residents
• 60% increase in recycling (1,000 tonnes per year)
• 4,000 recycling visits per month
• Increased small vehicle garbage traffic (increased revenue)
• Equity issues if Metro Vancouver funds dedicated recycling services
• Metro Vancouver to provide dedicated recycling services only when requested and funded by communities served by transfer station

10
TRANSFER STATION STRATEGY
COQUITLAM TRANSFER STATION
• Continue development of replacement options at Coquitlam Landfill:• Full service transfer
station• Residential drop-off
only
• Work with Coquitlam to determine closure date for existing facility• Work with Tri-Cities on continuity of service (temporary facility if
required)
Current Coquitlam Transfer Station
Proposed site

11
TRANSFER STATION STRATEGY
• Proceed with reconfiguration of North Shore Transfer Station
• Timing on decision dictated by Second Narrows Water Supply project
NORTH SHORE TRANSFER STATION
Current Layout
Queuingyard
North Shore Recycling
Scales
Green waste
Transfer building
Beachyard
Queuing lanes
Recycling
Scales
Drilling Location
Green waste
Transfer building
Beach Yard temporary location
Proposed Reconfiguration
Former tenant site
12
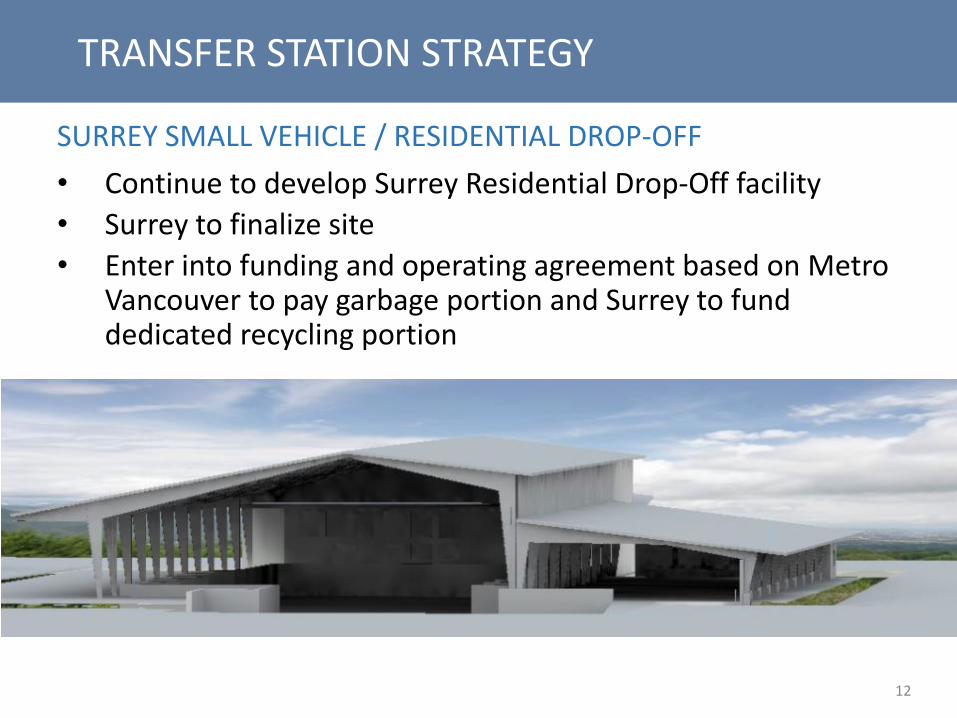
TRANSFER STATION STRATEGY
• Continue to develop Surrey Residential Drop-Off facility
• Surrey to finalize site
• Enter into funding and operating agreement based on Metro Vancouver to pay garbage portion and Surrey to fund dedicated recycling portion
SURREY SMALL VEHICLE / RESIDENTIAL DROP-OFF
13
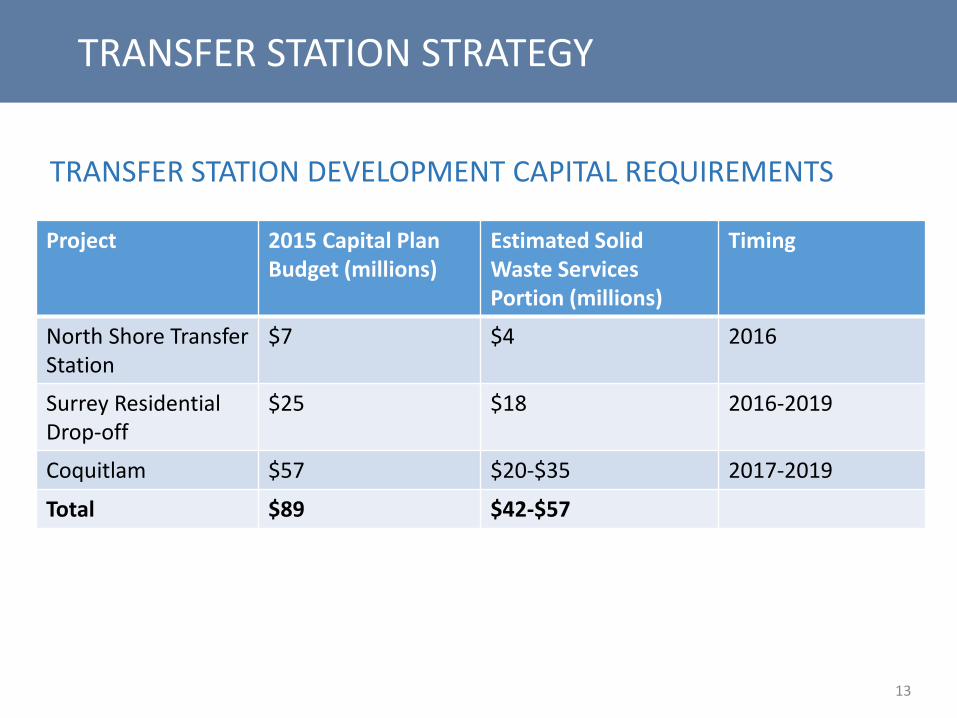
TRANSFER STATION STRATEGY
TRANSFER STATION DEVELOPMENT CAPITAL REQUIREMENTS
Project 2015 Capital Plan Budget (millions)
Estimated Solid Waste ServicesPortion (millions)
Timing
North Shore TransferStation
$7 $4 2016
Surrey Residential Drop-off
$25 $18 2016-2019
Coquitlam $57 $20-$35 2017-2019
Total $89 $42-$57
14
SOLID WASTE SYSTEMINTERIM FUNDING STRATEGY

15
SOLID WASTE SYSTEM FUNDING: ZERO WASTE EDUCATION, COMMUNICATIONS and PLANNING
HISTORICALLY BUDGETED APPROX $6 MILLION/YEAR ON ZERO WASTE INITIATIVES.
Options explored Challenges
Increase tipping fee to cover costs
• Unsustainable• May encourage waste to bypass regional
facilities
Introduce a new GVS&DD Municipal User Fee
• Need to reduce costs • Some GVRD members would not contribute• Complex Regional Services Rate
New solution required?
16
PROPOSED INTERIM FUNDING STRATEGY
COST SAVINGS
• Identified $2 million/year cost savings on $90 million budget
• Staffing and consulting – reduced departmental staffing by eight positions compared to 2015 budget
• Waste flow and landfill operating and closure costs are key budget drivers
17
MUNICIPAL TIPPING FEE
Weight based fees lead to a range of “effective” municipal tipping fees:
• $84 - $111/tonne
• Average $94/tonne
Overall average: $108 per tonne
Top commercial haulers: $95 per tonne
Proposed Municipal Tipping Fee: $100 in 2016, $109 in 2017
• Applies to all municipal single family and public works waste
• Does not apply to municipal “front-end” trucks
• $5 transaction fee applies to all loads

18
REGIONAL SERVICES RATE
• Regional Services Rate is embedded in the tipping fee
• Proposed municipal tipping fee in 2016: $100/tonne
Local governments other than
Vancouver and Delta
• Pay the Regional Services Rate separately – currently $6/tonne
Vancouver and Delta
• Regional Services Rate set at 6% of Municipal Tipping FeeProposed
Funding for: Zero Waste education, planning,
regulation, and material ban enforcement

19
PROPOSED INTERIM FUNDING STRATEGY ANNUAL IMPACT
Cost Savings $2 million
Municipal Tipping Fee $1 million
Vancouver/Delta Regional Services Rate $1.3 million
Tipping Fee Changes $0.7 million
GVRD Funding of Communications $1 million
Total $6 million

20
2016 TIPPING FEE BYLAWPROPOSED PROVISIONS

21
PROPOSED 2016 TIPPING FEE
2015 AND PROPOSED 2016 TIPPING FEES
Load size 2015 tipping fee (as of April 6)
2016 Proposed tipping fees (January 1)
Loads < 1t $130/t ($109 max) $133/t ($112 max)
Loads 1-9t $109/t ($720 max) $112/t ($720 max)
Large Loads > 9t $80/t $80/t
Municipal Tipping Fee - $100/t
Transaction Fee $5/load $5/load

22
TIPPING FEE BYLAW OTHER PROPOSED CHANGES
• No change in Organics and Clean Wood Disposal Ban Surcharge thresholds (25% and 10% respectively)
• $1/tonne increase in organics drop-off rate at all transfer stations except North Shore (new rate $67/t)
• $250 per tonne Special Handle Waste fee (was $200 in 2015)
• Gypsum rates harmonized with garbage

23
STAKEHOLDER FEEDBACK
• Inviting stakeholder feedback on proposed tipping fee changes
• Will consider, summarize and report with final proposed Tipping Fee Bylaw for October 30 Board (October 8 Zero Waste Committee)
24