Magnetic Equipments, Drum Separator, Vibratory Equipments, Magnetic Roll Separator

IN-PLANT TESTING OF THE HYDROFLOAT SEPARATOR FOR COARSE PHOSPHATE RECOVERY
FINAL REPORT
Michael J. Mankosa Jaisen N. Kohmuench
Principal Investigators
ERIEZ MAGNETICS
Erie, Pennsylvania
with
Gerald Luttrell Virginia Tech
Glenn Gruber
Jacobs Engineering
Joe Shoniker PCS Phosphate
Prepared for
FLORIDA INSTITUTE OF PHOSPHATE RESEARCH 1855 West Main Street Bartow, Florida 33830
Project Manager: Patrick Zhang
FIPR Project Number: 99-02-137
July 2002
DISCLAIMER The contents of this report are reproduced herein as received from the contractor. The report may have been edited as to format in conformance with the FIPR Style Manual. The opinions, findings and conclusions expressed herein are not necessarily those of the Florida Institute of Phosphate Research, nor does mention of company names or products constitute endorsement by the Florida Institute of Phosphate Research.
iii
PERSPECTIVE
Patrick Zhang, Research Director - Beneficiation & Mining In the case of phosphate production from Florida, the phosphate rock, after mining and transport, is pulped to a washer in the plant. One of the washer products (-1 mm +150 mesh material) is processed by flotation. This stream is further classified for coarse phosphate flotation (16×35 mesh) and fine phosphate flotation (35×150 mesh). The efficient recovery of phosphate from the coarse flotation feed presents a major problem. Separate flotation of this coarse feed in large mechanical cells results in a recovery of only about 60% of the phosphate values. It was estimated that Florida phosphate miners generate about 45 million tons of flotation tails annually. These tailings contain approximately 4% of the phosphate in the original matrix. About half of the tailings P2O5 are concentrated in the plus 28-mesh fraction.
Efforts have been made to improve phosphate recovery from the coarse particle size fraction. The Florida phosphate industry has developed the agglomeration-skin flotation process and the high solids conditioning process for coarse particle flotation at a reduced level of reagent simply by trial and error. The agglomeration-skin flotation followed by single-stage scavenger flotation with conventional mechanical cells has been employed in certain central Florida plants with some success. The high solids condi-tioning process has improved the phosphate recovery and reduced collector consumption. Some research has been carried out to investigate the phenomena involved and to optimize the conditioning parameters. Notwithstanding these efforts, the efficiency of coarse phosphate flotation frequently remains unsatisfactory. More research is needed for further improvement in coarse phosphate flotation.
The Eriez HydroFloat technology was specifically developed to upgrade minerals too coarse to be efficiently recovered by existing flotation methods. In this novel process, classified feed is suspended in a fluidized-bed and aerated using an external sparging system. Air bubbles selectively attach to particles that have been made hydrophobic through the addition of a flotation collector. The teetering effect of the fluidized-bed forces the low-density bubble-particle aggregates into the overflow, while hydrophilic particles are rejected as a high solids content underflow. Since the HydroFloat is essentially a density separator, the process can treat much coarser particles than traditional flotation systems. In addition, the high solids content of the teeter-bed promotes bubble-particle attachment and reduces the cell volume required to achieve a given capacity.
Encouraged by preliminary testing in the lab, which achieved coarse phosphate recovery of 93% or higher, the FIPR Board approved funding for the current in-plant testing project. The test results indicate that the HydroFloat can produce a high-grade phosphate product in a single stage of separation. Product quality ranged between 70-72% BPL and 5-10% insols. BPL recoveries exceeded 98% at feed rates greater than 2.0 tph per ft2 of separator cross-sectional area. These results are so promising that we may well see some commercial installations of the HydroFloat cell in the near future.
v
ABSTRACT
The HydroFloat technology was specifically developed to upgrade phosphate sands that are too coarse to be efficiently recovered by conventional flotation methods. In this novel process, classified feed is suspended in a fluidized-bed and then aerated. The reagentized phosphate particles become buoyant and report to the product launder after encountering and attaching to the rising air bubbles. Simultaneously, the hydrophilic particles are rejected as a high solids content (65-70%) underflow. The fluidized bed acts as a “resistant” layer through which no bubble/particle aggregates can penetrate. The HydroFloat can treat much coarser particles as compared to traditional flotation processes since it is actually a density separator. In addition, the high solids content of the teeter bed promotes bubble-particle attachment and reduces the cell volume required to achieve a given capacity. To verify the advantages of the HydroFloat technology, a 5-tph circuit was installed and evaluated at PCS Phosphate’s Swift Creek beneficiation plant. Feed to the test circuit was continuously classified, conditioned, and upgraded in the HydroFloat separator. The test results indicate that the HydroFloat can produce a high-grade phosphate product in a single stage of separation. Product quality ranged between 70-72% BPL and 5-10% insols. BPL recoveries exceeded 98% at feed rates greater than 2.0 tph per ft2 of separator cross-sectional area.
vi
ACKNOWLEDGEMENTS
Eriez Magnetics (prime investigator) would like to acknowledge the assistance provided by Virginia Tech, PCS Phosphate, and Jacobs Engineering. Special recognition is given to Joe Shoniker and James Blanton at PCS Phosphate, Dr. Gerald H. Luttrell and Chris Barbee at Virginia Tech, and Glenn Gruber at Jacobs Engineering. Appreciation is also expressed to the Florida Institute of Phosphate Research for their support of this new technology.
vii
TABLE OF CONTENTS PERSPECTIVE.................................................................................................................. iii ABSTRACT.........................................................................................................................v ACKNOWLEDGMENTS ................................................................................................. vi EXECUTIVE SUMMARY .................................................................................................1 INTRODUCTION ...............................................................................................................3 General.....................................................................................................................3 Literature Review.....................................................................................................4 Flotation Background...................................................................................4 Phosphate Flotation......................................................................................6 Project Justification......................................................................................9 PROJECT TASKS.............................................................................................................11 Work Plan Preparation...........................................................................................11 HydroFloat Testing ................................................................................................12 Equipment Setup........................................................................................12 Shakedown Testing....................................................................................14 Detailed Testing (Stirred-Tank Conditioning)...........................................14 Feed Injection Depth..................................................................................15 Water Injection Spacing.............................................................................16 Fluidization Water Rate .................................................................16 Teeter-Bed Depth...........................................................................17 Mass Feed Rate ..............................................................................17 Feed Solids Content .......................................................................19 Aeration Rate .................................................................................20 Frother Dosage...............................................................................21 Collector Dosage............................................................................21 Column Comparison Tests.........................................................................22 Rotary Conditioner Testing....................................................................................24 Equipment Setup........................................................................................24 Shakedown Testing....................................................................................25 Detailed Testing .........................................................................................27
viii
TABLE OF CONTENTS (CONT.) Long Duration Testing...........................................................................................30 Process Evaluation .................................................................................................31 Simulation and Technical Evaluation ........................................................31 Ore 1...............................................................................................32 Ore 2...............................................................................................34 SUMMARY.......................................................................................................................37 REFERENCES ..................................................................................................................39 APPENDICES A COST SIMULATION DATA .......................................................... A-1 B JACOBS ENGINEERING ON-SITE TEST NOTES........................B-1
ix
LIST OF FIGURES Figure Page 1 Conceptual Illustration of the HydroFloat Separator.........................................4 2 BPL Recovery Versus Size Data .......................................................................7 3 Project Tasks and Schedule .............................................................................11 4 Pilot-Scale Test Circuit Used to Evaluate the HydroFloat Separator ..............12 5 Photograph of the 5 Ft. x 5 Ft. CrossFlow Classifier.......................................13 6 Photograph of the Pilot-Scale HydroFloat Separator.......................................13 7 Photograph of the Stirred-Tank Conditioner ...................................................14 8 Effect of Feed Injection Point on HydroFloat Performance ............................15 9 Effect of Water Pipe Spacing on HydroFloat Performance.............................16 10 Effect of Fluidization Water Rate on HydroFloat Performance ......................17 11 Effect of Teeter-Bed Level on HydroFloat Performance ................................18 12 Effect of Dry Feed Rate on HydroFloat Performance .....................................18 13 Effect of Feed Solids Content on HydroFloat Performance ............................19 14 Effect of Air Rate on HydroFloat Performance...............................................20 15 Effect of Frother Dosage on HydroFloat Performance....................................21 16 Effect of Fatty Acid to Fuel Oil Dosage on Performance................................22 17 BPL Recovery Comparison for the Column and HydroFloat Systems ...........23 18 Feed Rate Comparison for the Column and HydroFloat Systems...................24 19 30-Inch Diameter Drum Conditioner...............................................................25 20 Effect of Conditioner Type on HydroFloat Performance ................................26 21 Slimes Generation by Stirred and Rotary Conditioners...................................27 22 Recovery vs. Grade Curve—Stirred-Tank and Rotary Conditioners ..............28 23 Recovery vs. Rejection Curve—Stirred-Tank and Rotary Conditioners.........29 24 Size-by-Size BPL Recovery and Insols Rejection...........................................29 25 BPL Recovery as a Function of Collector Addition Rate................................30 26 BPL and Insols Grade and BPL Recovery for Long Duration Testing ...........31
xi
LIST OF TABLES Table Page 1 Ore 1 and Ore 2 Size Characteristics ...............................................................32 2 Annual Product Statistics for Ore 1 .................................................................32 3 Summary of Results for Ore 1 .........................................................................33 4 Tabulated Values of Recovery Scenarios for Ore 1.........................................34 5 Annual Production Statistics for Ore 2 ............................................................34 6 Summary of Results for Ore 2 .........................................................................35 7 Tabulated Values of Recovery Scenarios for Ore 2.........................................35 8 Summary of HydroFloat Operating Conditions...............................................37 9 HydroFloat/Column Metallurgical Comparison..............................................38 10 Conditioner Comparison Test Results .............................................................38
1
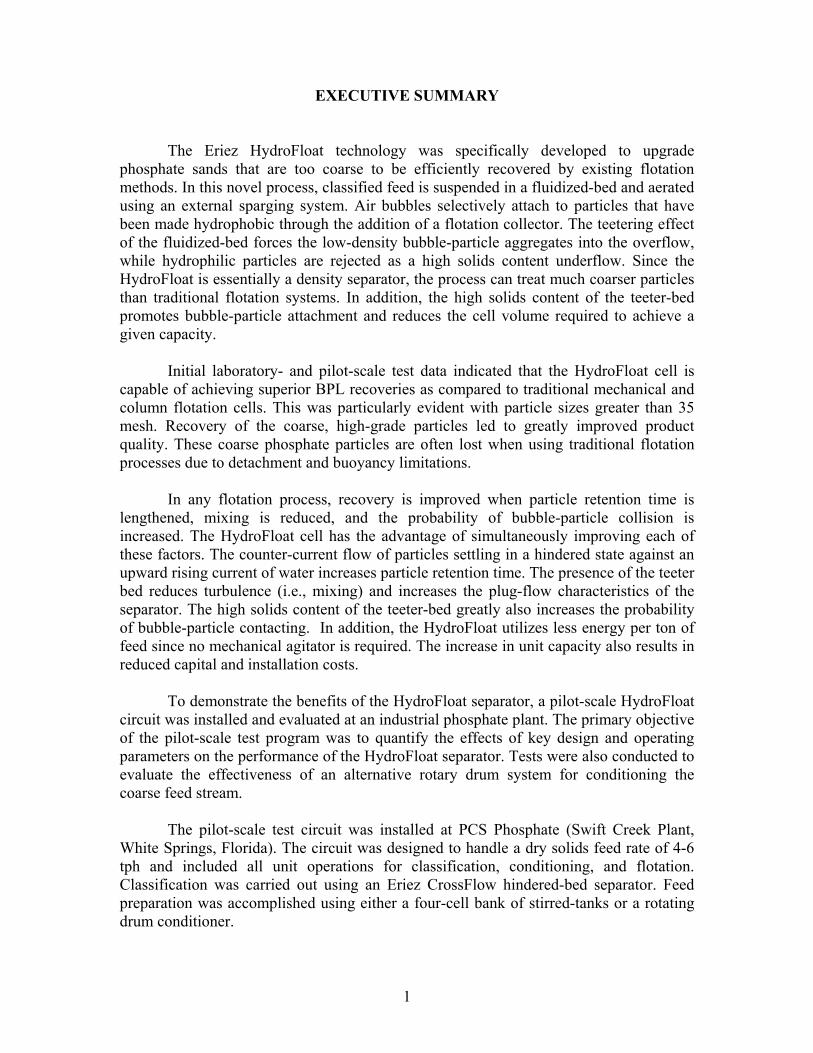
EXECUTIVE SUMMARY
The Eriez HydroFloat technology was specifically developed to upgrade phosphate sands that are too coarse to be efficiently recovered by existing flotation methods. In this novel process, classified feed is suspended in a fluidized-bed and aerated using an external sparging system. Air bubbles selectively attach to particles that have been made hydrophobic through the addition of a flotation collector. The teetering effect of the fluidized-bed forces the low-density bubble-particle aggregates into the overflow, while hydrophilic particles are rejected as a high solids content underflow. Since the HydroFloat is essentially a density separator, the process can treat much coarser particles than traditional flotation systems. In addition, the high solids content of the teeter-bed promotes bubble-particle attachment and reduces the cell volume required to achieve a given capacity.
Initial laboratory- and pilot-scale test data indicated that the HydroFloat cell is capable of achieving superior BPL recoveries as compared to traditional mechanical and column flotation cells. This was particularly evident with particle sizes greater than 35 mesh. Recovery of the coarse, high-grade particles led to greatly improved product quality. These coarse phosphate particles are often lost when using traditional flotation processes due to detachment and buoyancy limitations.
In any flotation process, recovery is improved when particle retention time is lengthened, mixing is reduced, and the probability of bubble-particle collision is increased. The HydroFloat cell has the advantage of simultaneously improving each of these factors. The counter-current flow of particles settling in a hindered state against an upward rising current of water increases particle retention time. The presence of the teeter bed reduces turbulence (i.e., mixing) and increases the plug-flow characteristics of the separator. The high solids content of the teeter-bed greatly also increases the probability of bubble-particle contacting. In addition, the HydroFloat utilizes less energy per ton of feed since no mechanical agitator is required. The increase in unit capacity also results in reduced capital and installation costs.
To demonstrate the benefits of the HydroFloat separator, a pilot-scale HydroFloat circuit was installed and evaluated at an industrial phosphate plant. The primary objective of the pilot-scale test program was to quantify the effects of key design and operating parameters on the performance of the HydroFloat separator. Tests were also conducted to evaluate the effectiveness of an alternative rotary drum system for conditioning the coarse feed stream.
The pilot-scale test circuit was installed at PCS Phosphate (Swift Creek Plant, White Springs, Florida). The circuit was designed to handle a dry solids feed rate of 4-6 tph and included all unit operations for classification, conditioning, and flotation. Classification was carried out using an Eriez CrossFlow hindered-bed separator. Feed preparation was accomplished using either a four-cell bank of stirred-tanks or a rotating drum conditioner.
2
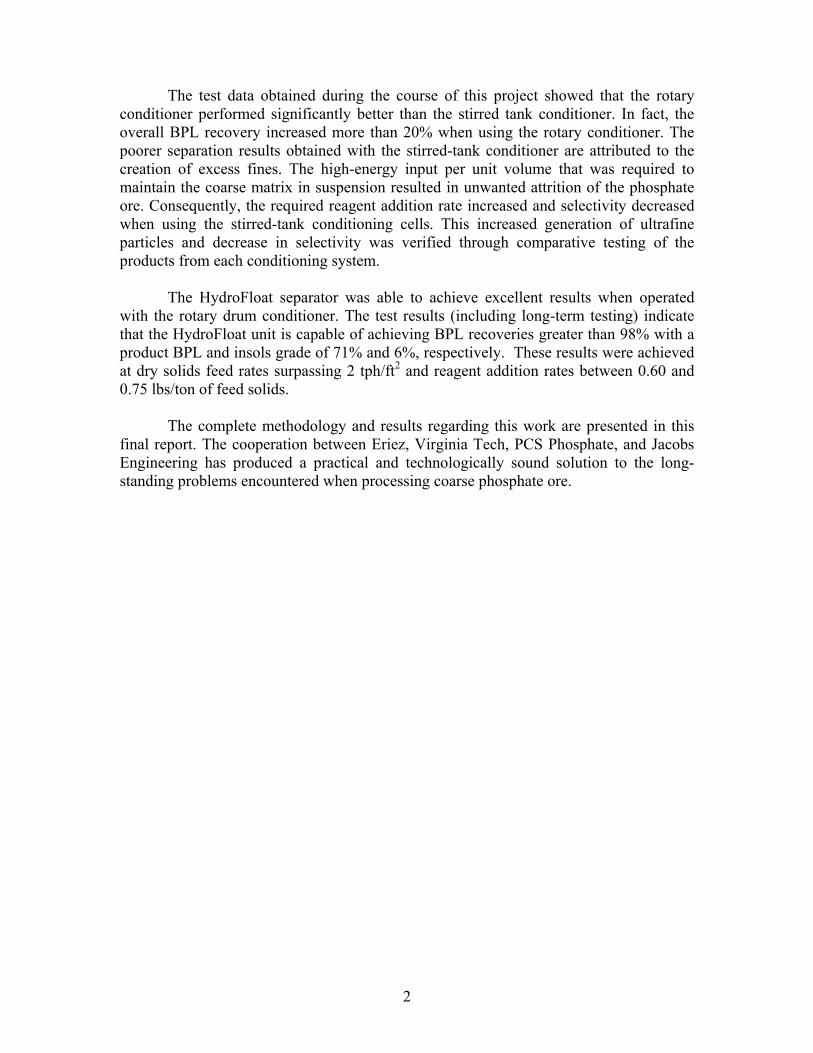
The test data obtained during the course of this project showed that the rotary conditioner performed significantly better than the stirred tank conditioner. In fact, the overall BPL recovery increased more than 20% when using the rotary conditioner. The poorer separation results obtained with the stirred-tank conditioner are attributed to the creation of excess fines. The high-energy input per unit volume that was required to maintain the coarse matrix in suspension resulted in unwanted attrition of the phosphate ore. Consequently, the required reagent addition rate increased and selectivity decreased when using the stirred-tank conditioning cells. This increased generation of ultrafine particles and decrease in selectivity was verified through comparative testing of the products from each conditioning system.
The HydroFloat separator was able to achieve excellent results when operated with the rotary drum conditioner. The test results (including long-term testing) indicate that the HydroFloat unit is capable of achieving BPL recoveries greater than 98% with a product BPL and insols grade of 71% and 6%, respectively. These results were achieved at dry solids feed rates surpassing 2 tph/ft2 and reagent addition rates between 0.60 and 0.75 lbs/ton of feed solids.
The complete methodology and results regarding this work are presented in this final report. The cooperation between Eriez, Virginia Tech, PCS Phosphate, and Jacobs Engineering has produced a practical and technologically sound solution to the long-standing problems encountered when processing coarse phosphate ore.

3
INTRODUCTION GENERAL
Hindered-bed separators are commonly used in the minerals industry as gravity concentration devices. These units can be used for mineral concentration if the particle size range and density difference between mineral types are within acceptable limits. However, these separators often suffer from misplacement of low-density, coarse particles to the high-density underflow. This shortcoming is due to the accumulation of coarse, low-density particles at the top of the teeter-bed. These particles are too light to penetrate the teeter-bed, but are too heavy to be carried by the rising water into the overflow launder. Ultimately, these particles are forced to the underflow by mass action as more particles accumulate at the top of the teeter-bed. This inherent inefficiency can be partially corrected by increasing the teeter-water velocity to convey the coarse, low-density solids to the overflow. Unfortunately, the higher water rates will cause fine, high-density solids to be misplaced to the overflow, thereby reducing the separation efficiency.
To overcome the shortcomings of traditional hindered-bed separators, a novel device known as the HydroFloat was developed. As shown in figure 1, the HydroFloat consists of a tank subdivided into an upper separation chamber and a lower dewatering cone. The device operates much like a traditional hindered-bed separator with the feed settling against an upward current of fluidization water. The fluidization (teeter) water is supplied through a network of pipes that extend across the bottom of the separator. However, in the case of the HydroFloat separator, the teeter-bed is continuously aerated by injecting compressed air and a small amount of frothing agent into the fluidization water. The air bubbles become attached to the hydrophobic particles within the teeter-bed, thereby reducing their effective density. The lighter bubble-particle aggregates rise to the top of the denser teeter-bed and overflow the top of the separation chamber.
Unlike flotation, the bubble-particle aggregates do not need to have sufficient buoyancy to rise to the top of the cell. Instead, the teetering effect of the hindered-bed forces the low-density agglomerates to overflow into the product launder. Hydrophilic particles that do not attach to the air bubbles continue to move down through the teeter-bed and eventually settle into the dewatering cone. These particles are discharged as a high solids stream (e.g., 75% solids) through a control valve at the bottom of the separator. The valve is actuated in response to a control signal provided by a pressure transducer mounted on the side of the separation chamber. This configuration allows a constant effective density to be maintained within the teeter-bed.
The HydroFloat can be theoretically applied to any system where differences in apparent density can be created by the selective attachment of air bubbles. Although not a requirement, the preferred mode of operation would be to make the low-density component hydrophobic so that the greatest difference in specific gravity is achieved. Compared to traditional flotation processes, the HydroFloat offers important advantages for treating coarser material including enhanced bubble-particle contacting, increased residence time, lower axial mixing/cell turbulence, and reduced air consumption.

4
High Density
Low Density
Bubbles
Teeter Bed
Interf ace
FloatProduct
WaterAddition
FloatReject
Dewater ingCone
Separ ationChamber
Feed
CirculationLoop
ElutriationNetwork
Figure 1. Conceptual Illustration of the HydroFloat Separator. LITERATURE REVIEW
The improved recovery of coarse particles has long been a goal in the minerals processing industry. Several studies have been conducted in an effort to overcome the inefficiencies associated with existing processes and equipment. The studies range in scope from fundamental investigations of bubble-particle interactions to the development of novel equipment. Advancements in chemistry and conditioning practices have also been employed at a number of industrial installations. Flotation Background
Research on the relationship between particle size and floatability began as early as 1931 with work conducted by Gaudin and others (1931) showing that coarse and extremely fine particles are more difficult to recover as compared to intermediate size particles. Twenty years after this original work, Morris (1952) arrived at the same conclusion that particle size is one of the most important factors in the recovery of ores by flotation. Generally, recovery is low for the finest particles (dp<10µm) and is at a maximum for intermediate size particles. A sharp decrease in recovery occurs as the
5
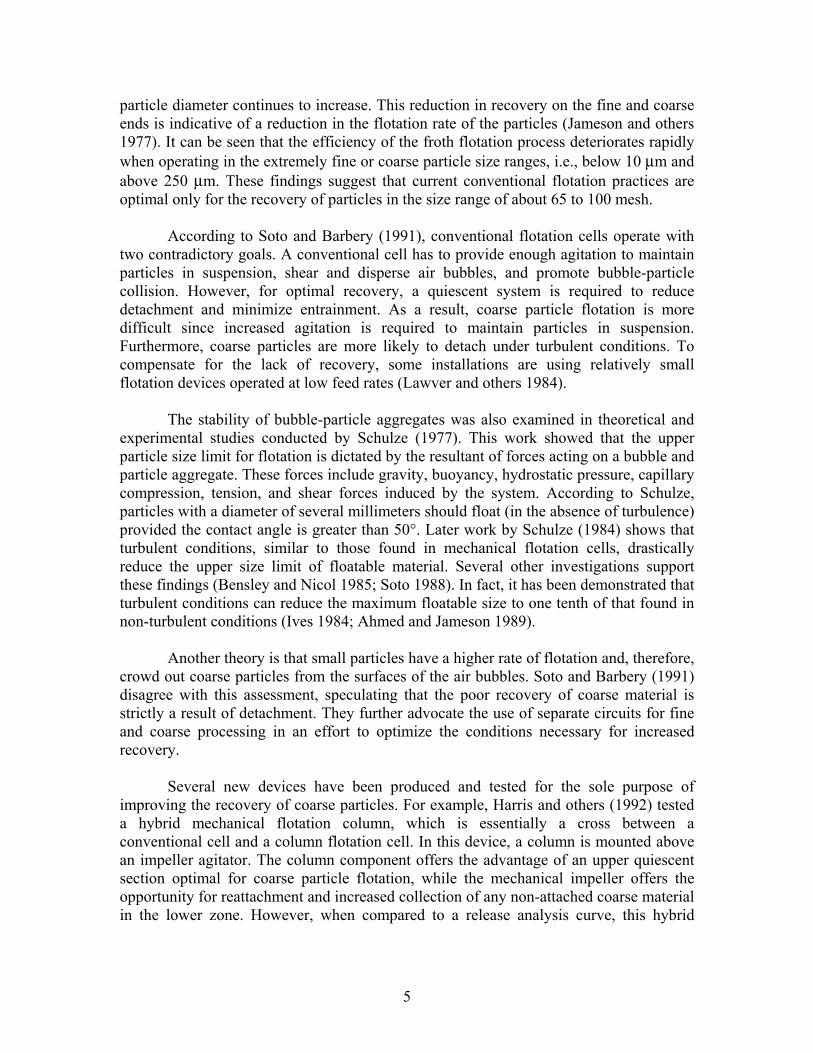
particle diameter continues to increase. This reduction in recovery on the fine and coarse ends is indicative of a reduction in the flotation rate of the particles (Jameson and others 1977). It can be seen that the efficiency of the froth flotation process deteriorates rapidly when operating in the extremely fine or coarse particle size ranges, i.e., below 10 µm and above 250 µm. These findings suggest that current conventional flotation practices are optimal only for the recovery of particles in the size range of about 65 to 100 mesh.
According to Soto and Barbery (1991), conventional flotation cells operate with two contradictory goals. A conventional cell has to provide enough agitation to maintain particles in suspension, shear and disperse air bubbles, and promote bubble-particle collision. However, for optimal recovery, a quiescent system is required to reduce detachment and minimize entrainment. As a result, coarse particle flotation is more difficult since increased agitation is required to maintain particles in suspension. Furthermore, coarse particles are more likely to detach under turbulent conditions. To compensate for the lack of recovery, some installations are using relatively small flotation devices operated at low feed rates (Lawver and others 1984).
The stability of bubble-particle aggregates was also examined in theoretical and experimental studies conducted by Schulze (1977). This work showed that the upper particle size limit for flotation is dictated by the resultant of forces acting on a bubble and particle aggregate. These forces include gravity, buoyancy, hydrostatic pressure, capillary compression, tension, and shear forces induced by the system. According to Schulze, particles with a diameter of several millimeters should float (in the absence of turbulence) provided the contact angle is greater than 50°. Later work by Schulze (1984) shows that turbulent conditions, similar to those found in mechanical flotation cells, drastically reduce the upper size limit of floatable material. Several other investigations support these findings (Bensley and Nicol 1985; Soto 1988). In fact, it has been demonstrated that turbulent conditions can reduce the maximum floatable size to one tenth of that found in non-turbulent conditions (Ives 1984; Ahmed and Jameson 1989).
Another theory is that small particles have a higher rate of flotation and, therefore, crowd out coarse particles from the surfaces of the air bubbles. Soto and Barbery (1991) disagree with this assessment, speculating that the poor recovery of coarse material is strictly a result of detachment. They further advocate the use of separate circuits for fine and coarse processing in an effort to optimize the conditions necessary for increased recovery.
Several new devices have been produced and tested for the sole purpose of improving the recovery of coarse particles. For example, Harris and others (1992) tested a hybrid mechanical flotation column, which is essentially a cross between a conventional cell and a column flotation cell. In this device, a column is mounted above an impeller agitator. The column component offers the advantage of an upper quiescent section optimal for coarse particle flotation, while the mechanical impeller offers the opportunity for reattachment and increased collection of any non-attached coarse material in the lower zone. However, when compared to a release analysis curve, this hybrid
6
mechanical column out-performed a conventional flotation cell, but was equivalent to a traditional flotation column.
Improvements in coarse particle recovery have also been seen with the advent of non-mechanical flotation cells. For example, success in floating coarser particles has been reported when using column flotation cells, Lang launders, skin flotation systems, and the negative-bias flotation columns. Column flotation offers several advantages that can be useful in any application. Barbery (1984) advocates that columns have no mechanical parts, are easy automate and control, and provide a high throughput capacity. In addition, columns are low turbulence machines that have well-defined hydrodynamic conditions. These advantages translate to ease of maintenance, scale-up, modeling, and a reduction of short-circuiting usually observed in conventional flotation machines. Phosphate Flotation
The United States is the world’s largest producer of phosphate rock. In 1999, this industry accounted for approximately 45 million tons of marketable product valued at more than $1.1 billion annually (United States Geological Survey 1999). Approximately 83% of this production can be attributed to mines located in Florida and North Carolina.
Prior to marketing, the run-of-mine phosphate matrix must be upgraded to separate the valuable phosphate grains from other impurities. The first stage of processing involves screening to recover a coarse (plus 14 mesh) high-grade pebble product. The screen underflow is subsequently deslimed at 150 mesh to remove fine clays. Although 20-30% of the phosphate contained in the matrix is present in the fine fraction, technologies currently do not exist that permit this material to be recovered in a cost-effective manner. The remaining 14 x 150 mesh fraction is classified into coarse (e.g., 14 x 35 mesh) and fine (e.g., 35 x 150 mesh) fractions that are upgraded using conventional flotation machines, column flotation cells, or other novel techniques such as belt flotation (Moudgil and Gupta 1989). The fine fraction (35 x 150 mesh) generally responds well to froth flotation. In most cases, conventional (mechanical) flotation cells can be used to produce acceptable concentrate grades with recoveries in excess of 90%. On the other hand, high recoveries are often difficult to maintain for the coarser (14 x 35 mesh) fraction.
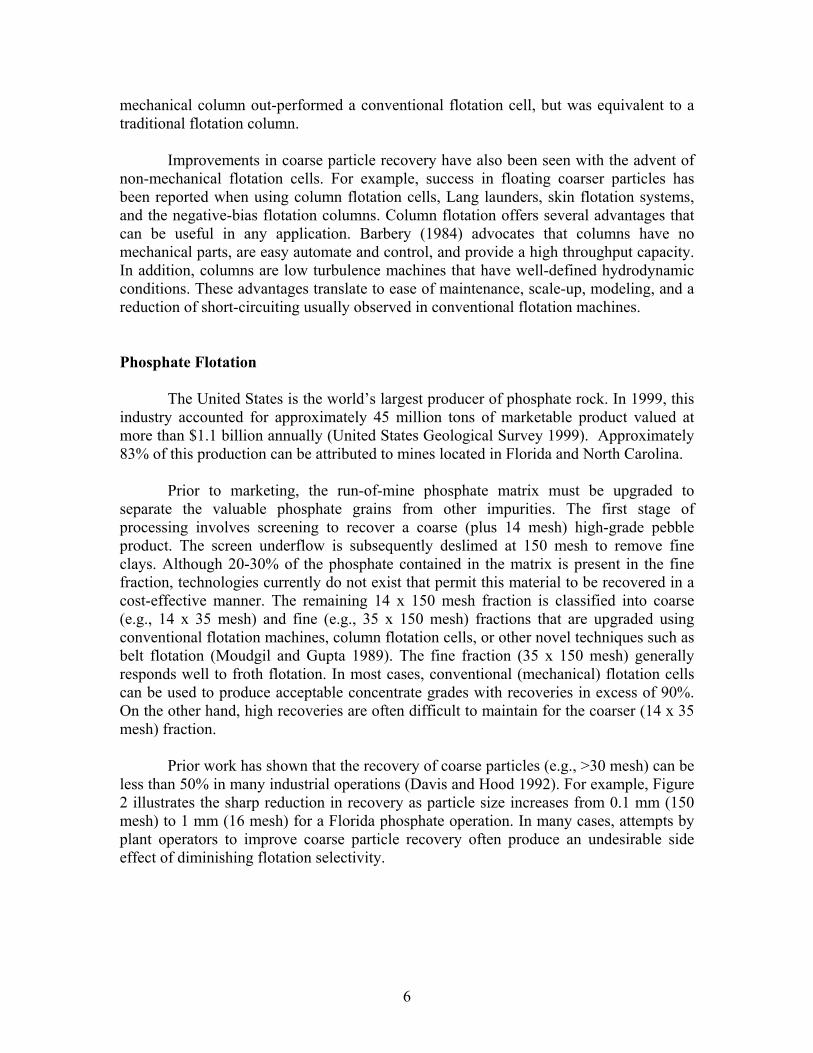
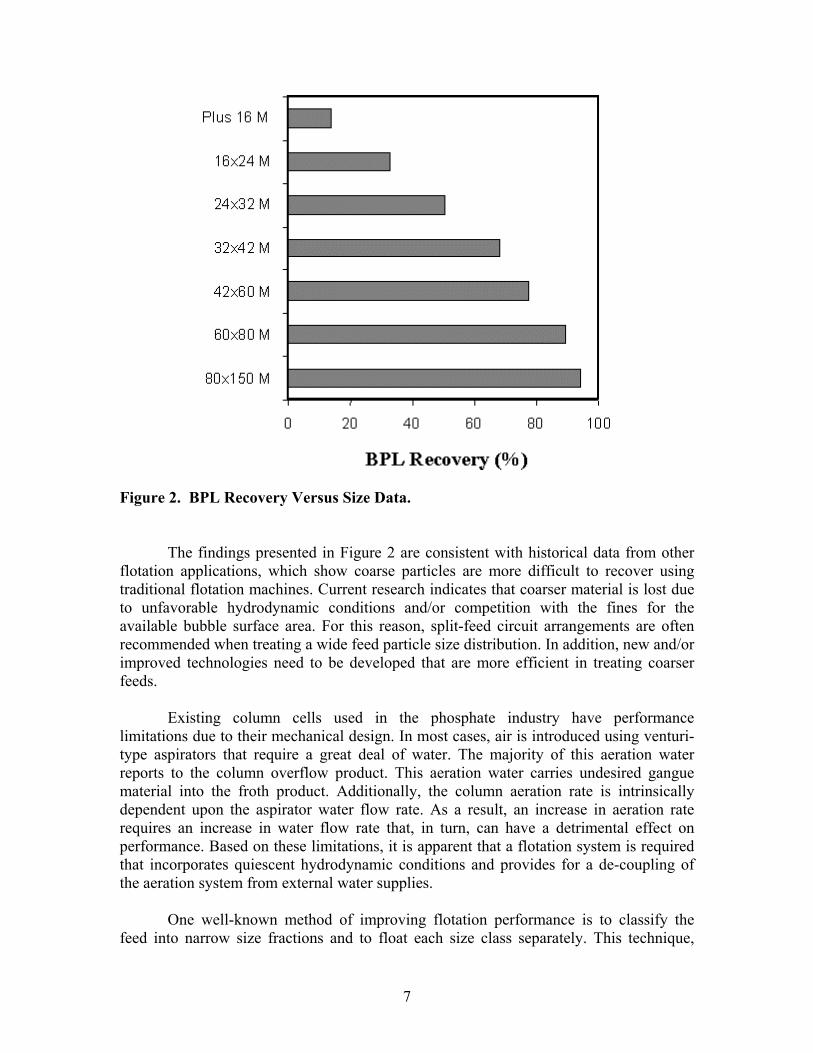
Prior work has shown that the recovery of coarse particles (e.g., >30 mesh) can be less than 50% in many industrial operations (Davis and Hood 1992). For example, Figure 2 illustrates the sharp reduction in recovery as particle size increases from 0.1 mm (150 mesh) to 1 mm (16 mesh) for a Florida phosphate operation. In many cases, attempts by plant operators to improve coarse particle recovery often produce an undesirable side effect of diminishing flotation selectivity.
7
Figure 2. BPL Recovery Versus Size Data.
The findings presented in Figure 2 are consistent with historical data from other
flotation applications, which show coarse particles are more difficult to recover using traditional flotation machines. Current research indicates that coarser material is lost due to unfavorable hydrodynamic conditions and/or competition with the fines for the available bubble surface area. For this reason, split-feed circuit arrangements are often recommended when treating a wide feed particle size distribution. In addition, new and/or improved technologies need to be developed that are more efficient in treating coarser feeds.
Existing column cells used in the phosphate industry have performance limitations due to their mechanical design. In most cases, air is introduced using venturi-type aspirators that require a great deal of water. The majority of this aeration water reports to the column overflow product. This aeration water carries undesired gangue material into the froth product. Additionally, the column aeration rate is intrinsically dependent upon the aspirator water flow rate. As a result, an increase in aeration rate requires an increase in water flow rate that, in turn, can have a detrimental effect on performance. Based on these limitations, it is apparent that a flotation system is required that incorporates quiescent hydrodynamic conditions and provides for a de-coupling of the aeration system from external water supplies.
One well-known method of improving flotation performance is to classify the feed into narrow size fractions and to float each size class separately. This technique,
8
which is commonly referred to as split-feed flotation, has several potential advantages such as higher throughput capacity, lower reagent requirements, and improved separation efficiency. Split-feed flotation has been successfully applied to a wide variety of flotation systems including coal, phosphate, potash, and industrial minerals (Soto and Barbery 1991).
The United States Bureau of Mines (USBM) conducted one of the most comprehensive studies of the coarse particle recovery problem in the phosphate industry (Davis and Hood 1993). This investigation involved the sampling of seven Florida phosphate operations to identify sources of phosphate losses that occur during beneficiation. According to this field survey, approximately 50 million tons of flotation tailings are discarded each year in the phosphate industry. Although the tailings contain only 4% of the matrix phosphate, more than half of the potentially recoverable phosphate in the tailings is concentrated in the plus 28 mesh fraction. In all seven plants, the coarse fraction was higher in grade than overall feed to the flotation circuits. In some cases, the grade of the plus 28 mesh fraction in the tailings approached 20% P2O5. The USBM study indicated that the flotation recovery of the plus 35 mesh fraction averaged only 60% for the seven sites included in the survey. Furthermore, the study concluded that of the seven phosphate operations, none have been successful in efficiently recovering the coarse phosphate particles.
There have been several attempts to improve the poor recovery of coarse (16 x 35 mesh) phosphate grains using improved flotation reagents. The University of Florida, under the sponsorship of the Florida Institute of Phosphate Research (FIPR Project 02-067-099), completed one such investigation in early 1992. This study showed that the flotation of coarse phosphate is very difficult and recoveries of only 60% or less are normally achievable. The goal of the FIPR study was to determine whether the recovery of coarse phosphate particles could be enhanced via collector emulsification and froth modification achieved by frothers and fines addition. Plant tests conducted as part of this project showed that the appropriate selection of reagents could improve the recovery of coarse phosphate (16 x 35 mesh) by up to 6 percentage points. Furthermore, plant tests conducted with emulsified collector provided recovery gains as large as 10 percent in select cases. Unfortunately, reports of follow-up work by industry that support these findings are not available.
In 1988, FIPR also provided financial support (FIPR Project 02-070-098) to Laval University to determine the mechanisms involved in coarse particle flotation and to explain the low recoveries of such particles when treated by conventional froth flotation. In light of this study, these investigators proposed the development of a modified low turbulence device for the flotation of coarse phosphate particles. Laboratory tests indicated that this approach was capable of achieving recoveries of greater than 99% for coarse phosphate feeds. In addition, the investigators noted that this approach did not suffer from high reagent costs associated with other strategies designed to overcome the coarse particle recovery problem. Although the preliminary data was extremely promising, this work was never carried through to industrial plant trials due to problems with the sparging and tailings discharge systems.
9
Building on these early findings, Soto and Barbery (1991) developed a negative bias flotation column that improved coarse particle recovery. It was surmised that the only factors preventing conventional columns from being ideally suited for coarse particle recovery were wash water flow and a thick froth layer. Wash water is used in column flotation to “wash” fine gangue (i.e., clays) from the product froth. However, wash water also forced some of the coarser particles back into the pulp resulting in a loss of recovery. Soto and Barbery removed the wash water, which resulted in a net upward flow through the column (i.e., negative bias flow). In addition, they added an upward flow of elutriation water to assist in the transport of coarse particles-bubble aggregates into the overflow launder. As a result of these modifications, Barbery and others (1989) were able to achieve a four-fold improvement in coarse particle recovery when utilizing this negative bias column. Essentially, this device is operated in a flooded manner and in the absence of a froth zone. Several similar devices have also been introduced that make use of this same principle to improve coarse particle flotation (i.e., Laskowski 1995).
Several other alternative processes have been used by industry in an attempt to improve the recovery of the coarser particles. These techniques include gravity-based devices such as heavy media cyclones, tables, and spirals, as well as belt conveyors that have been modified to perform skin-flotation (Moudgil and Barnett 1979). Although some of these units have been successfully used in industry, they normally must be supplemented with scavenging flotation cells to maintain acceptable levels of performance (Moudgil and Barnett 1979; Lawver and others 1984). Furthermore, these units typically require excessive maintenance, have low throughput capacities, and suffer from high operating costs. Project Justification
One of the most obvious advantages of improved coarse particle recovery is the increased production of phosphate rock from reserves currently being mined. For example, a survey of one Florida plant indicated that 7-15% of the plant feed was present in the plus 35 mesh fraction. At a 2,000 tph feed rate, this fraction represents 140-300 tph of flotation feed. An improvement in coarse particle recovery from 60% to 90% would represent an additional 50-100 tph of phosphate concentrate. This tonnage corresponds to an additional $7.5-15 million of revenues. This incremental tonnage and income could be produced without additional mining or reserve depletion.
Past attempts to improve the recovery of coarse phosphate particles have been unsuccessful for technical or cost reasons. In addition, many of the proposed solutions could not be transferred to a plant scale operation. As a result, it is apparent that a new low-cost technology is needed to improve the recovery of coarse phosphate particles (>35 mesh). To this end, the following report presents the results from an in-plant, pilot-scale evaluation of a new flotation system developed specifically for the recovery of coarse phosphate particles. The findings of this study indicate that this new technology, known as the HydroFloat, is capable of achieving the desired product quality and recovery at a high process throughput. Furthermore, an independent economic evaluation indicates a very favorable return on investment for the implementation of this technology in the Florida phosphate industry.
11
PROJECT TASKS WORK PLAN PREPARATION
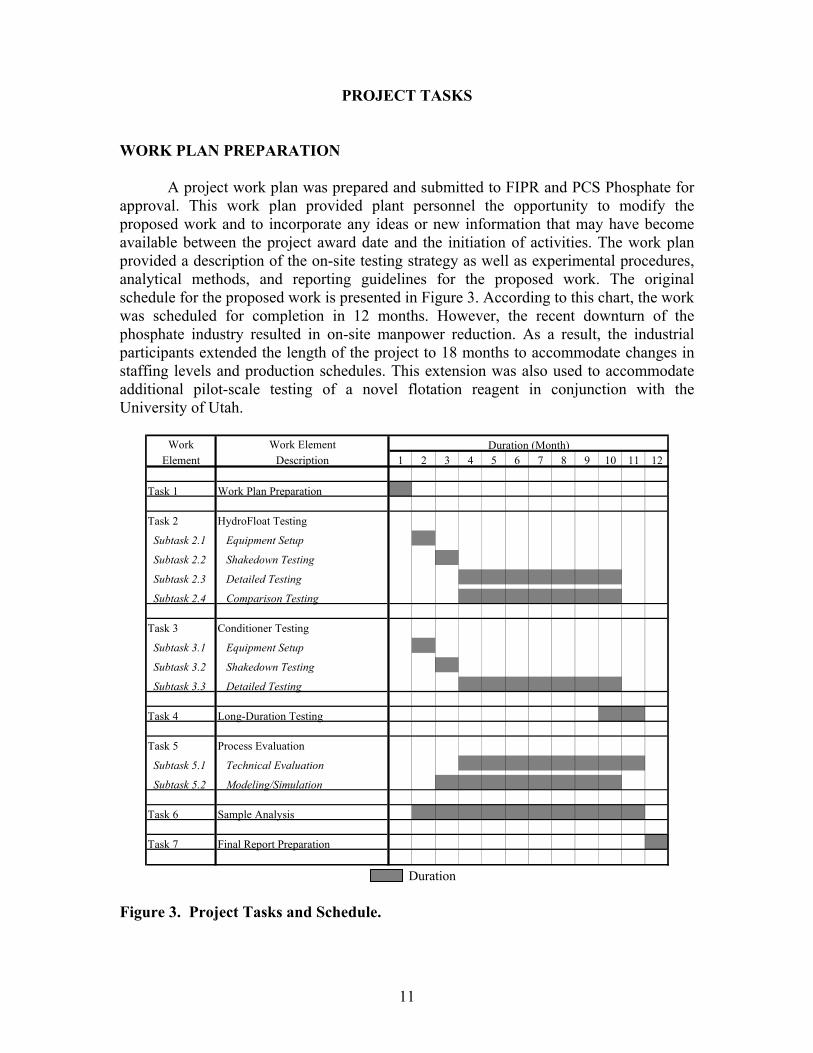
A project work plan was prepared and submitted to FIPR and PCS Phosphate for approval. This work plan provided plant personnel the opportunity to modify the proposed work and to incorporate any ideas or new information that may have become available between the project award date and the initiation of activities. The work plan provided a description of the on-site testing strategy as well as experimental procedures, analytical methods, and reporting guidelines for the proposed work. The original schedule for the proposed work is presented in Figure 3. According to this chart, the work was scheduled for completion in 12 months. However, the recent downturn of the phosphate industry resulted in on-site manpower reduction. As a result, the industrial participants extended the length of the project to 18 months to accommodate changes in staffing levels and production schedules. This extension was also used to accommodate additional pilot-scale testing of a novel flotation reagent in conjunction with the University of Utah.
Work Work ElementElement Description 1 2 3 4 5 6 7 8 9 10 11 12
Task 1 Work Plan Preparation
Task 2 HydroFloat Testing
Subtask 2.1 Equipment Setup
Subtask 2.2 Shakedown Testing
Subtask 2.3 Detailed Testing
Subtask 2.4 Comparison Testing
Task 3 Conditioner Testing
Subtask 3.1 Equipment Setup
Subtask 3.2 Shakedown Testing
Subtask 3.3 Detailed Testing
Task 4 Long-Duration Testing
Task 5 Process Evaluation
Subtask 5.1 Technical Evaluation
Subtask 5.2 Modeling/Simulation
Task 6 Sample Analysis
Task 7 Final Report Preparation
Duration (Month)
Figure 3. Project Tasks and Schedule.
Duration
12
HYDROFLOAT TESTING Equipment Setup
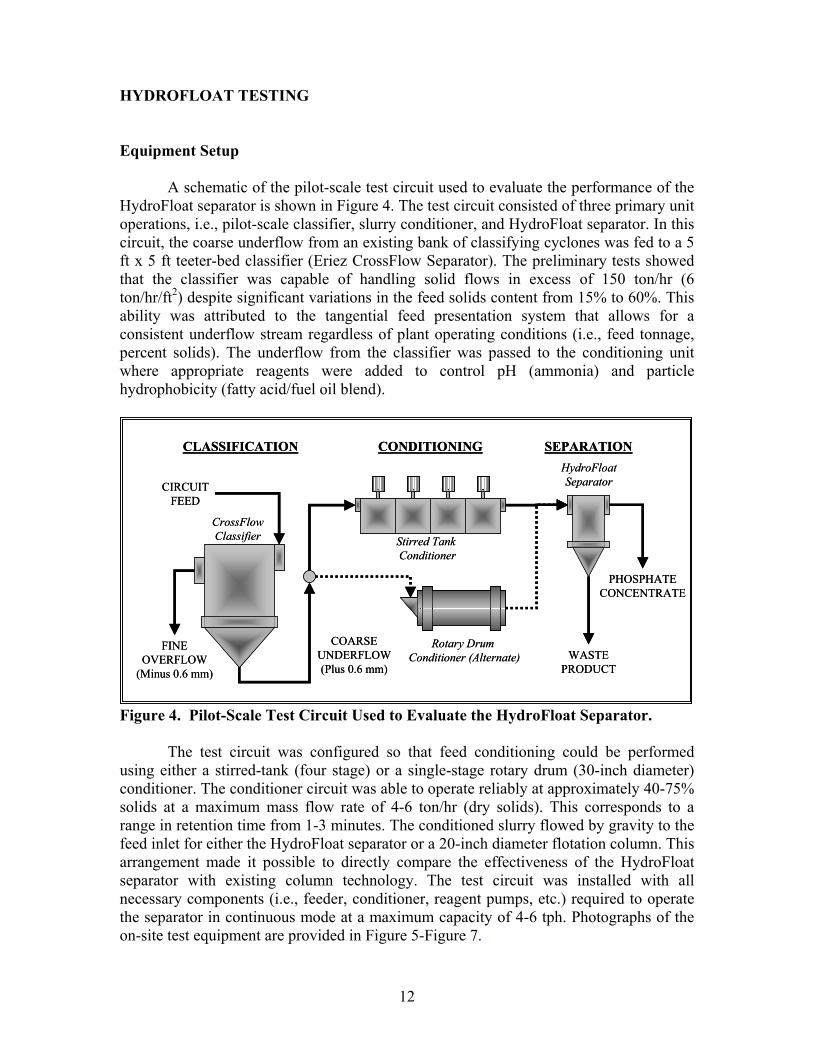
A schematic of the pilot-scale test circuit used to evaluate the performance of the HydroFloat separator is shown in Figure 4. The test circuit consisted of three primary unit operations, i.e., pilot-scale classifier, slurry conditioner, and HydroFloat separator. In this circuit, the coarse underflow from an existing bank of classifying cyclones was fed to a 5 ft x 5 ft teeter-bed classifier (Eriez CrossFlow Separator). The preliminary tests showed that the classifier was capable of handling solid flows in excess of 150 ton/hr (6 ton/hr/ft2) despite significant variations in the feed solids content from 15% to 60%. This ability was attributed to the tangential feed presentation system that allows for a consistent underflow stream regardless of plant operating conditions (i.e., feed tonnage, percent solids). The underflow from the classifier was passed to the conditioning unit where appropriate reagents were added to control pH (ammonia) and particle hydrophobicity (fatty acid/fuel oil blend).
PHOSPHATECONCENTRATE
WASTEPRODUCT
FINEOVERFLOW
(Minus 0.6 mm)
CIRCUITFEED
Stirred Tank Conditioner
Rotary Drum Conditioner (Alternate)
COARSEUNDERFLOW(Plus 0.6 mm)
CrossFlowClassifier
HydroFloatSeparator
CLASSIFICATION CONDITIONING SEPARATION
PHOSPHATECONCENTRATE
WASTEPRODUCT
FINEOVERFLOW
(Minus 0.6 mm)
CIRCUITFEED
Stirred Tank Conditioner
Rotary Drum Conditioner (Alternate)
COARSEUNDERFLOW(Plus 0.6 mm)
CrossFlowClassifier
HydroFloatSeparator
CLASSIFICATION CONDITIONING SEPARATION
Figure 4. Pilot-Scale Test Circuit Used to Evaluate the HydroFloat Separator.
The test circuit was configured so that feed conditioning could be performed using either a stirred-tank (four stage) or a single-stage rotary drum (30-inch diameter) conditioner. The conditioner circuit was able to operate reliably at approximately 40-75% solids at a maximum mass flow rate of 4-6 ton/hr (dry solids). This corresponds to a range in retention time from 1-3 minutes. The conditioned slurry flowed by gravity to the feed inlet for either the HydroFloat separator or a 20-inch diameter flotation column. This arrangement made it possible to directly compare the effectiveness of the HydroFloat separator with existing column technology. The test circuit was installed with all necessary components (i.e., feeder, conditioner, reagent pumps, etc.) required to operate the separator in continuous mode at a maximum capacity of 4-6 tph. Photographs of the on-site test equipment are provided in Figure 5-Figure 7.
13
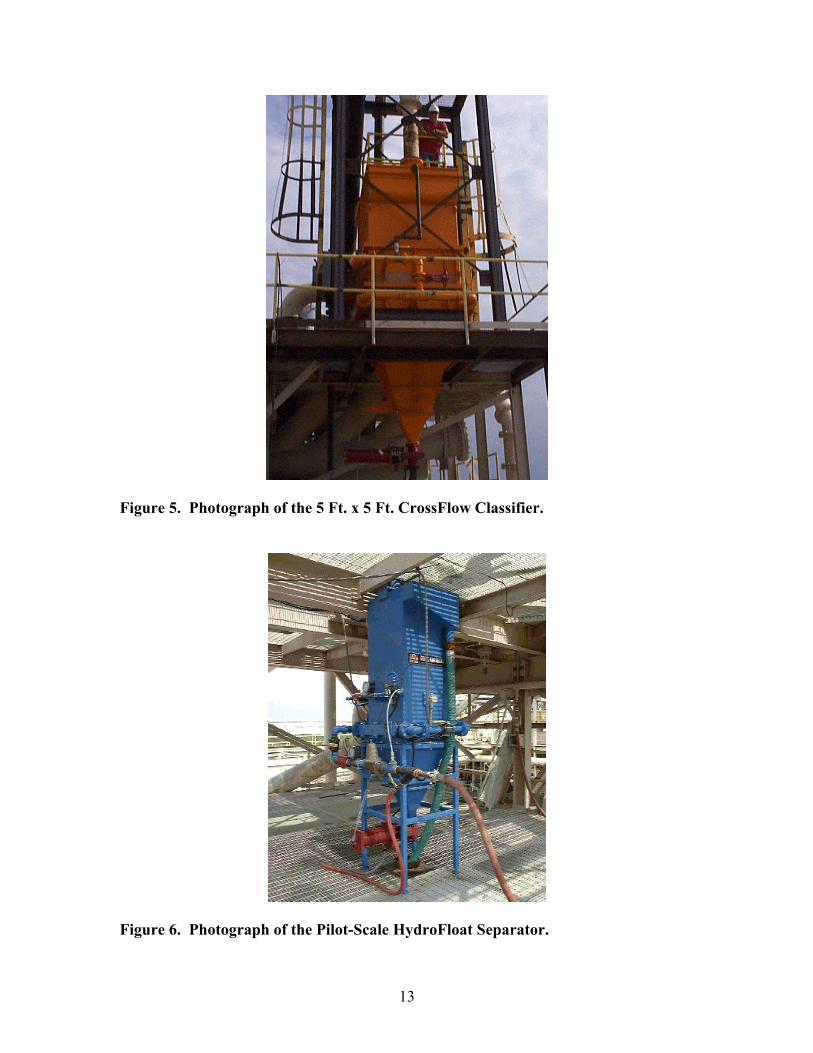
Figure 5. Photograph of the 5 Ft. x 5 Ft. CrossFlow Classifier.
Figure 6. Photograph of the Pilot-Scale HydroFloat Separator.
14
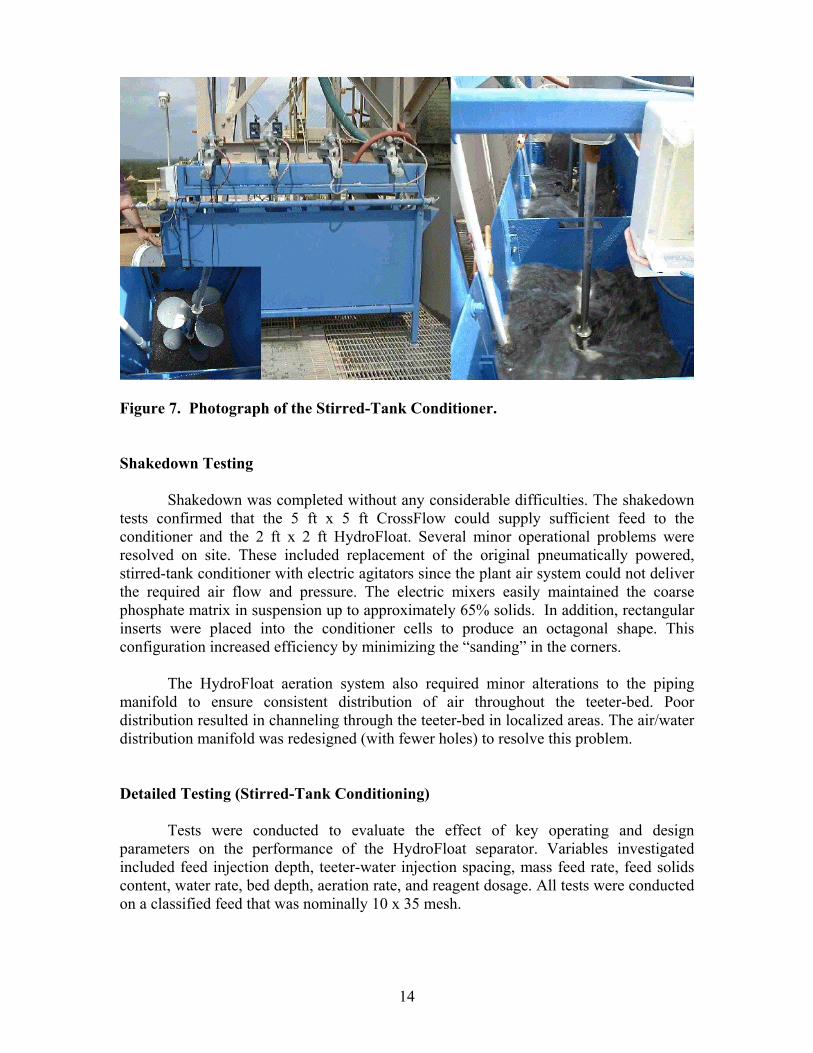
Figure 7. Photograph of the Stirred-Tank Conditioner. Shakedown Testing
Shakedown was completed without any considerable difficulties. The shakedown tests confirmed that the 5 ft x 5 ft CrossFlow could supply sufficient feed to the conditioner and the 2 ft x 2 ft HydroFloat. Several minor operational problems were resolved on site. These included replacement of the original pneumatically powered, stirred-tank conditioner with electric agitators since the plant air system could not deliver the required air flow and pressure. The electric mixers easily maintained the coarse phosphate matrix in suspension up to approximately 65% solids. In addition, rectangular inserts were placed into the conditioner cells to produce an octagonal shape. This configuration increased efficiency by minimizing the “sanding” in the corners.
The HydroFloat aeration system also required minor alterations to the piping manifold to ensure consistent distribution of air throughout the teeter-bed. Poor distribution resulted in channeling through the teeter-bed in localized areas. The air/water distribution manifold was redesigned (with fewer holes) to resolve this problem. Detailed Testing (Stirred-Tank Conditioning)
Tests were conducted to evaluate the effect of key operating and design parameters on the performance of the HydroFloat separator. Variables investigated included feed injection depth, teeter-water injection spacing, mass feed rate, feed solids content, water rate, bed depth, aeration rate, and reagent dosage. All tests were conducted on a classified feed that was nominally 10 x 35 mesh.
15
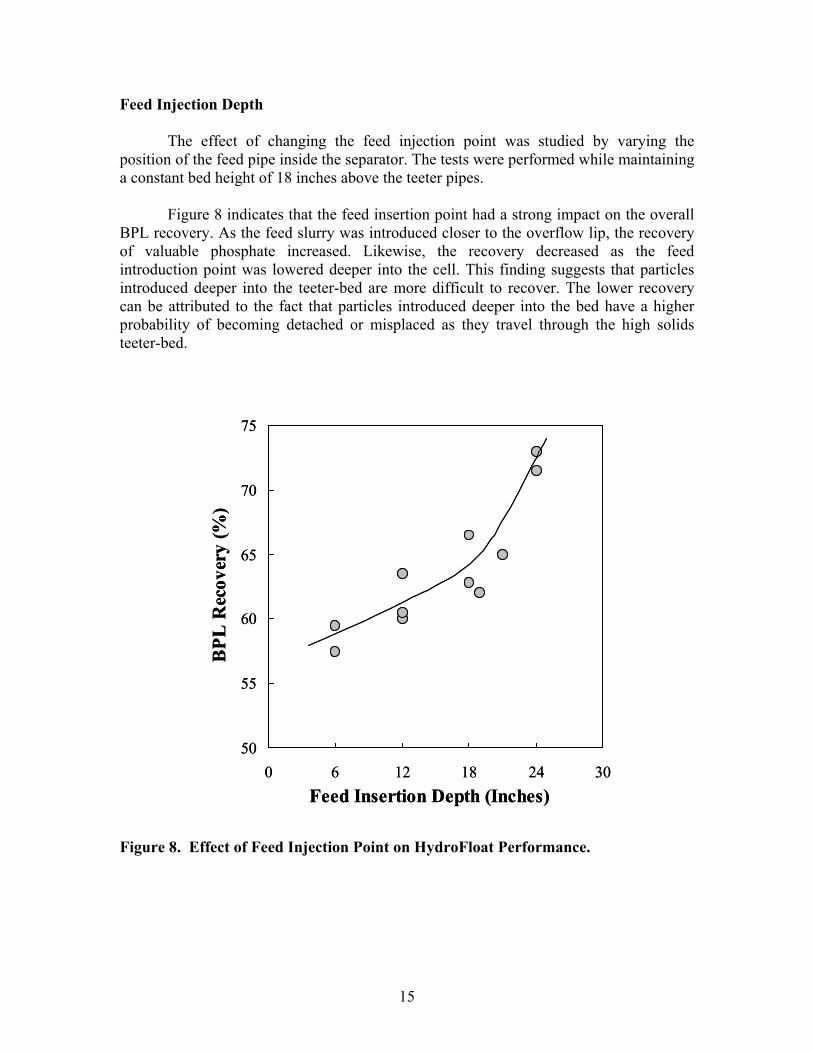
Feed Injection Depth
The effect of changing the feed injection point was studied by varying the position of the feed pipe inside the separator. The tests were performed while maintaining a constant bed height of 18 inches above the teeter pipes.
Figure 8 indicates that the feed insertion point had a strong impact on the overall BPL recovery. As the feed slurry was introduced closer to the overflow lip, the recovery of valuable phosphate increased. Likewise, the recovery decreased as the feed introduction point was lowered deeper into the cell. This finding suggests that particles introduced deeper into the teeter-bed are more difficult to recover. The lower recovery can be attributed to the fact that particles introduced deeper into the bed have a higher probability of becoming detached or misplaced as they travel through the high solids teeter-bed.
50
55
60
65
70
75
0 6 12 18 24 30Feed Insertion Depth (Inches)
BPL
Rec
over
y (%
)
50
55
60
65
70
75
0 6 12 18 24 30Feed Insertion Depth (Inches)
BPL
Rec
over
y (%
)
Figure 8. Effect of Feed Injection Point on HydroFloat Performance.
16
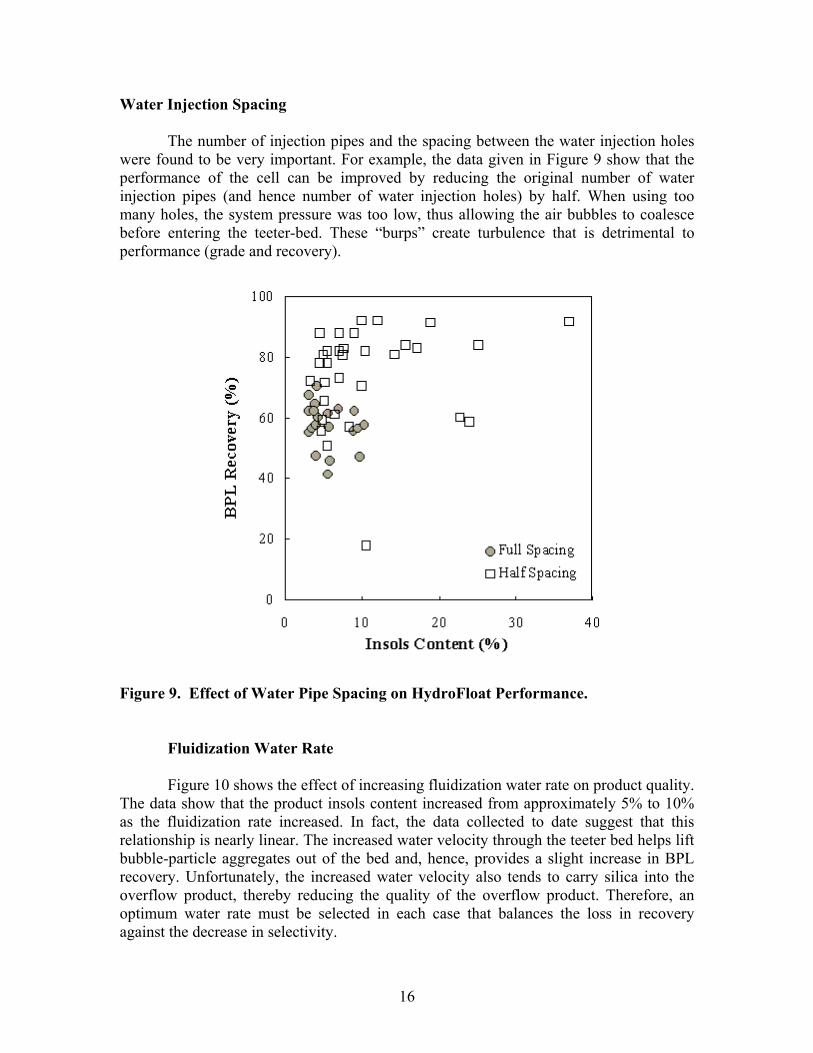
Water Injection Spacing
The number of injection pipes and the spacing between the water injection holes were found to be very important. For example, the data given in Figure 9 show that the performance of the cell can be improved by reducing the original number of water injection pipes (and hence number of water injection holes) by half. When using too many holes, the system pressure was too low, thus allowing the air bubbles to coalesce before entering the teeter-bed. These “burps” create turbulence that is detrimental to performance (grade and recovery).
Figure 9. Effect of Water Pipe Spacing on HydroFloat Performance.
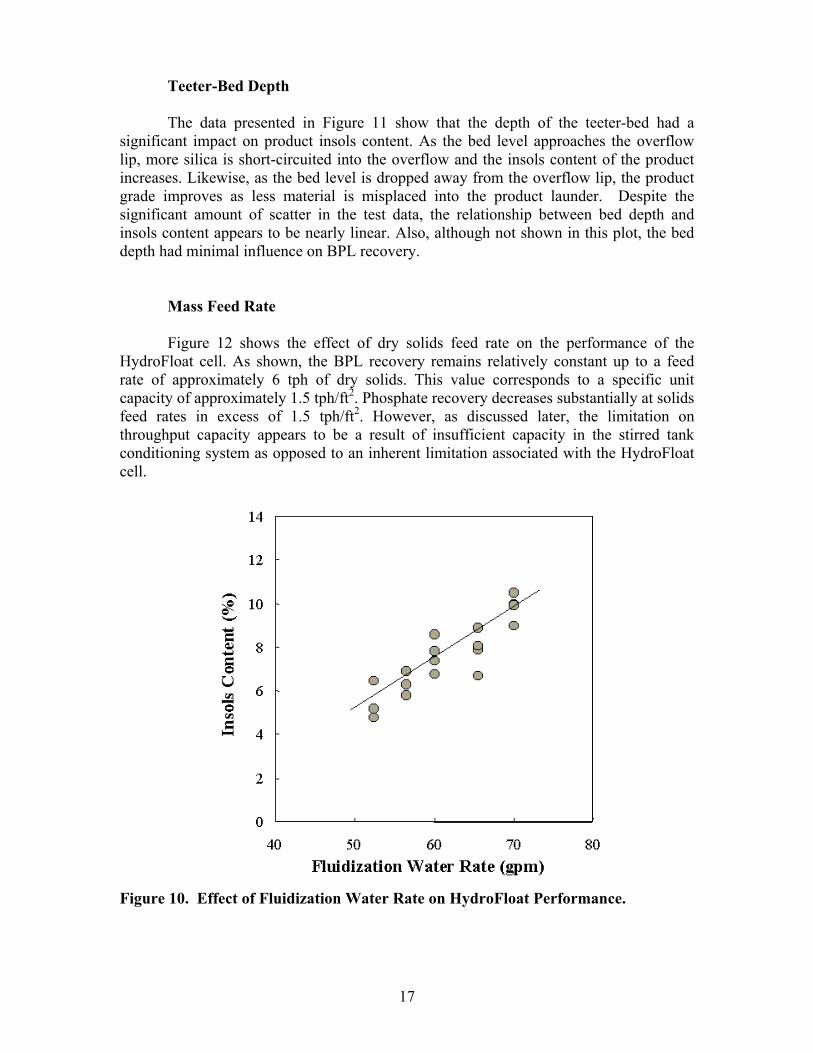
Fluidization Water Rate
Figure 10 shows the effect of increasing fluidization water rate on product quality. The data show that the product insols content increased from approximately 5% to 10% as the fluidization rate increased. In fact, the data collected to date suggest that this relationship is nearly linear. The increased water velocity through the teeter bed helps lift bubble-particle aggregates out of the bed and, hence, provides a slight increase in BPL recovery. Unfortunately, the increased water velocity also tends to carry silica into the overflow product, thereby reducing the quality of the overflow product. Therefore, an optimum water rate must be selected in each case that balances the loss in recovery against the decrease in selectivity.
17
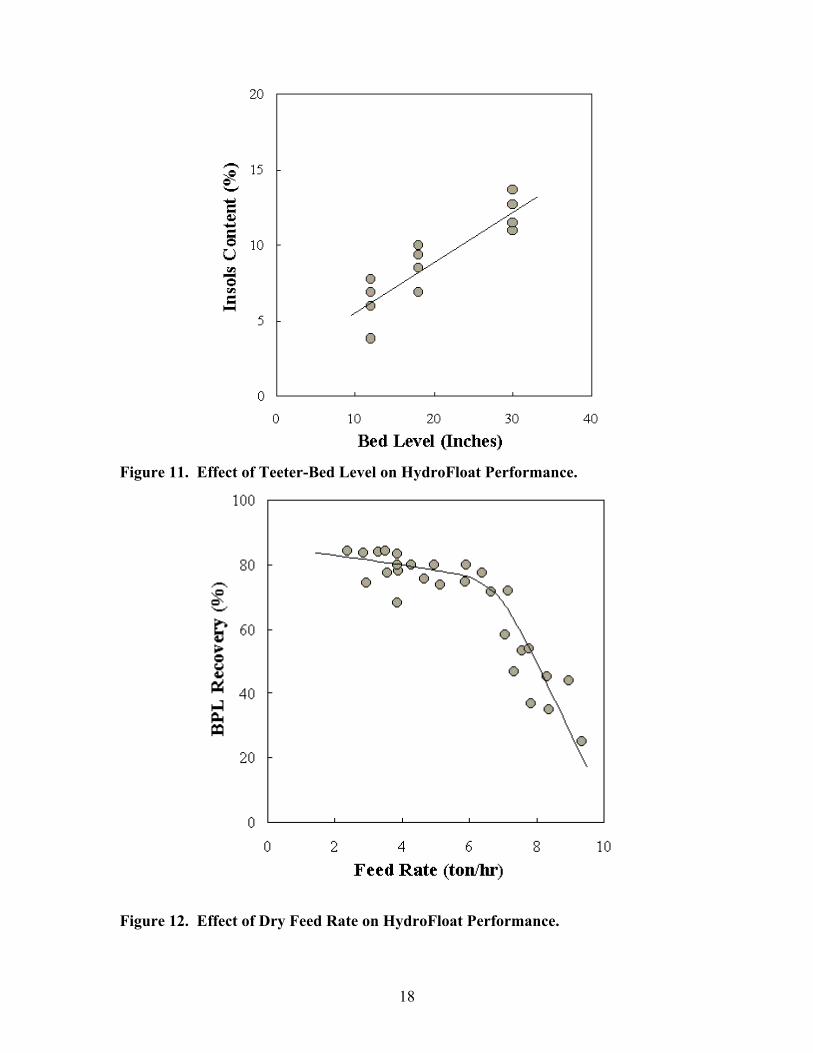
Teeter-Bed Depth
The data presented in Figure 11 show that the depth of the teeter-bed had a significant impact on product insols content. As the bed level approaches the overflow lip, more silica is short-circuited into the overflow and the insols content of the product increases. Likewise, as the bed level is dropped away from the overflow lip, the product grade improves as less material is misplaced into the product launder. Despite the significant amount of scatter in the test data, the relationship between bed depth and insols content appears to be nearly linear. Also, although not shown in this plot, the bed depth had minimal influence on BPL recovery.
Mass Feed Rate
Figure 12 shows the effect of dry solids feed rate on the performance of the HydroFloat cell. As shown, the BPL recovery remains relatively constant up to a feed rate of approximately 6 tph of dry solids. This value corresponds to a specific unit capacity of approximately 1.5 tph/ft2. Phosphate recovery decreases substantially at solids feed rates in excess of 1.5 tph/ft2. However, as discussed later, the limitation on throughput capacity appears to be a result of insufficient capacity in the stirred tank conditioning system as opposed to an inherent limitation associated with the HydroFloat cell.
Figure 10. Effect of Fluidization Water Rate on HydroFloat Performance.
18
Figure 11. Effect of Teeter-Bed Level on HydroFloat Performance.
Figure 12. Effect of Dry Feed Rate on HydroFloat Performance.
19
Feed Solids Content
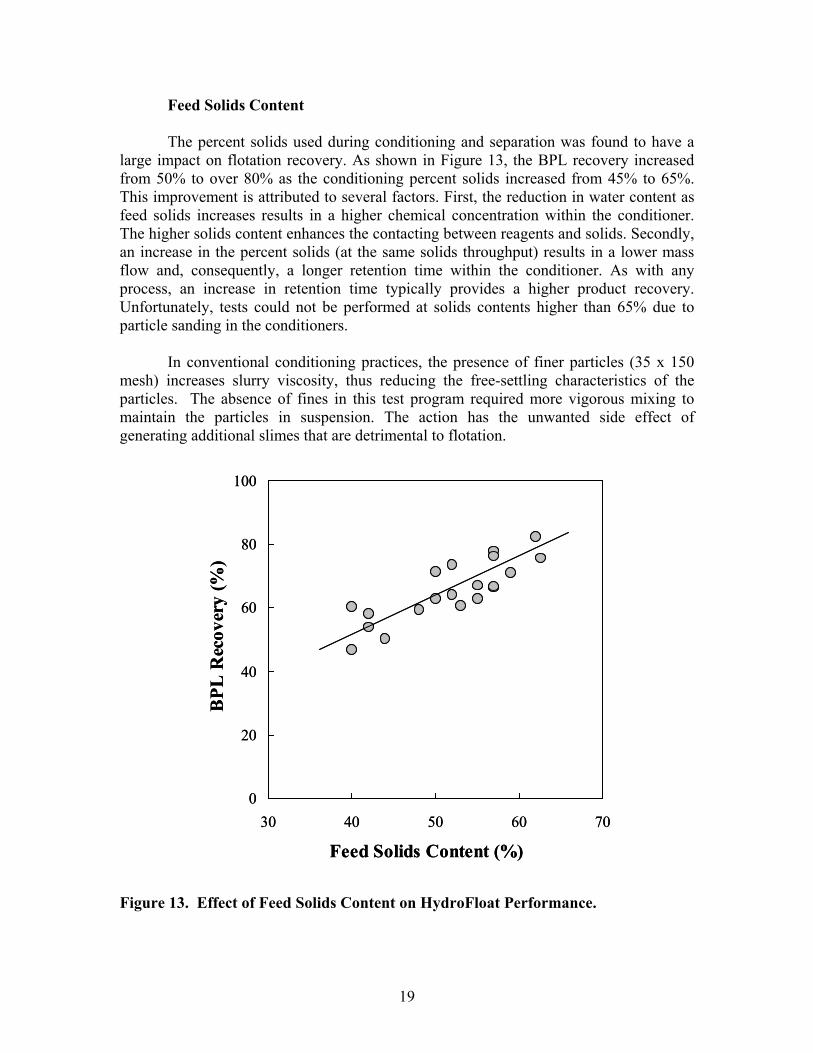
The percent solids used during conditioning and separation was found to have a large impact on flotation recovery. As shown in Figure 13, the BPL recovery increased from 50% to over 80% as the conditioning percent solids increased from 45% to 65%. This improvement is attributed to several factors. First, the reduction in water content as feed solids increases results in a higher chemical concentration within the conditioner. The higher solids content enhances the contacting between reagents and solids. Secondly, an increase in the percent solids (at the same solids throughput) results in a lower mass flow and, consequently, a longer retention time within the conditioner. As with any process, an increase in retention time typically provides a higher product recovery. Unfortunately, tests could not be performed at solids contents higher than 65% due to particle sanding in the conditioners.
In conventional conditioning practices, the presence of finer particles (35 x 150 mesh) increases slurry viscosity, thus reducing the free-settling characteristics of the particles. The absence of fines in this test program required more vigorous mixing to maintain the particles in suspension. The action has the unwanted side effect of generating additional slimes that are detrimental to flotation.
0
20
40
60
80
100
30 40 50 60 70
Feed Solids Content (%)
BPL
Rec
over
y (%
)
0
20
40
60
80
100
30 40 50 60 70
Feed Solids Content (%)
BPL
Rec
over
y (%
)
Figure 13. Effect of Feed Solids Content on HydroFloat Performance.
20
Aeration Rate
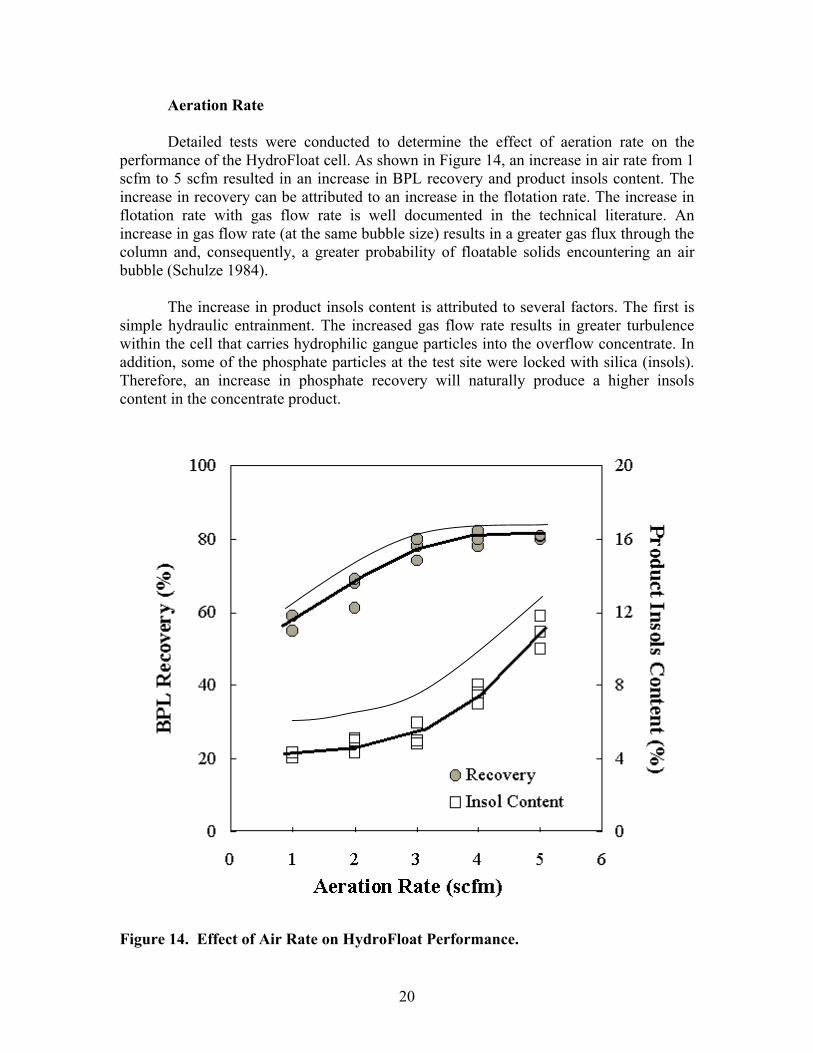
Detailed tests were conducted to determine the effect of aeration rate on the performance of the HydroFloat cell. As shown in Figure 14, an increase in air rate from 1 scfm to 5 scfm resulted in an increase in BPL recovery and product insols content. The increase in recovery can be attributed to an increase in the flotation rate. The increase in flotation rate with gas flow rate is well documented in the technical literature. An increase in gas flow rate (at the same bubble size) results in a greater gas flux through the column and, consequently, a greater probability of floatable solids encountering an air bubble (Schulze 1984).
The increase in product insols content is attributed to several factors. The first is simple hydraulic entrainment. The increased gas flow rate results in greater turbulence within the cell that carries hydrophilic gangue particles into the overflow concentrate. In addition, some of the phosphate particles at the test site were locked with silica (insols). Therefore, an increase in phosphate recovery will naturally produce a higher insols content in the concentrate product.
Figure 14. Effect of Air Rate on HydroFloat Performance.
21
Frother Dosage
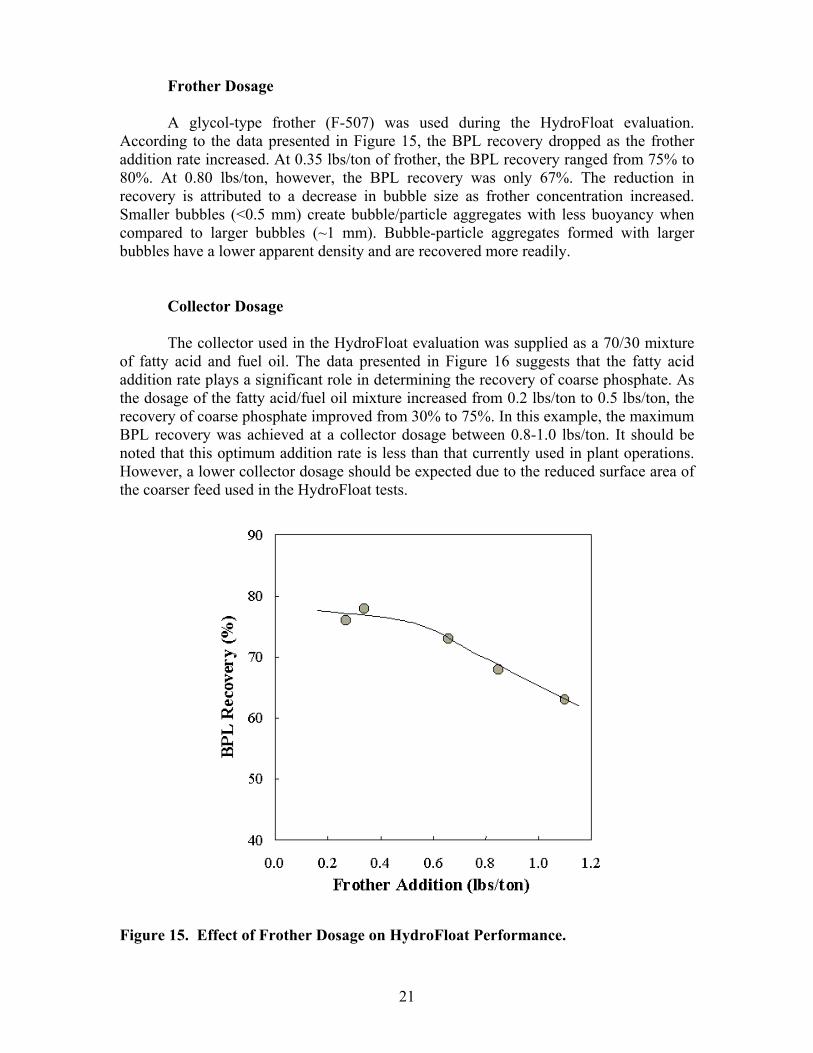
A glycol-type frother (F-507) was used during the HydroFloat evaluation. According to the data presented in Figure 15, the BPL recovery dropped as the frother addition rate increased. At 0.35 lbs/ton of frother, the BPL recovery ranged from 75% to 80%. At 0.80 lbs/ton, however, the BPL recovery was only 67%. The reduction in recovery is attributed to a decrease in bubble size as frother concentration increased. Smaller bubbles (<0.5 mm) create bubble/particle aggregates with less buoyancy when compared to larger bubbles (~1 mm). Bubble-particle aggregates formed with larger bubbles have a lower apparent density and are recovered more readily.
Collector Dosage
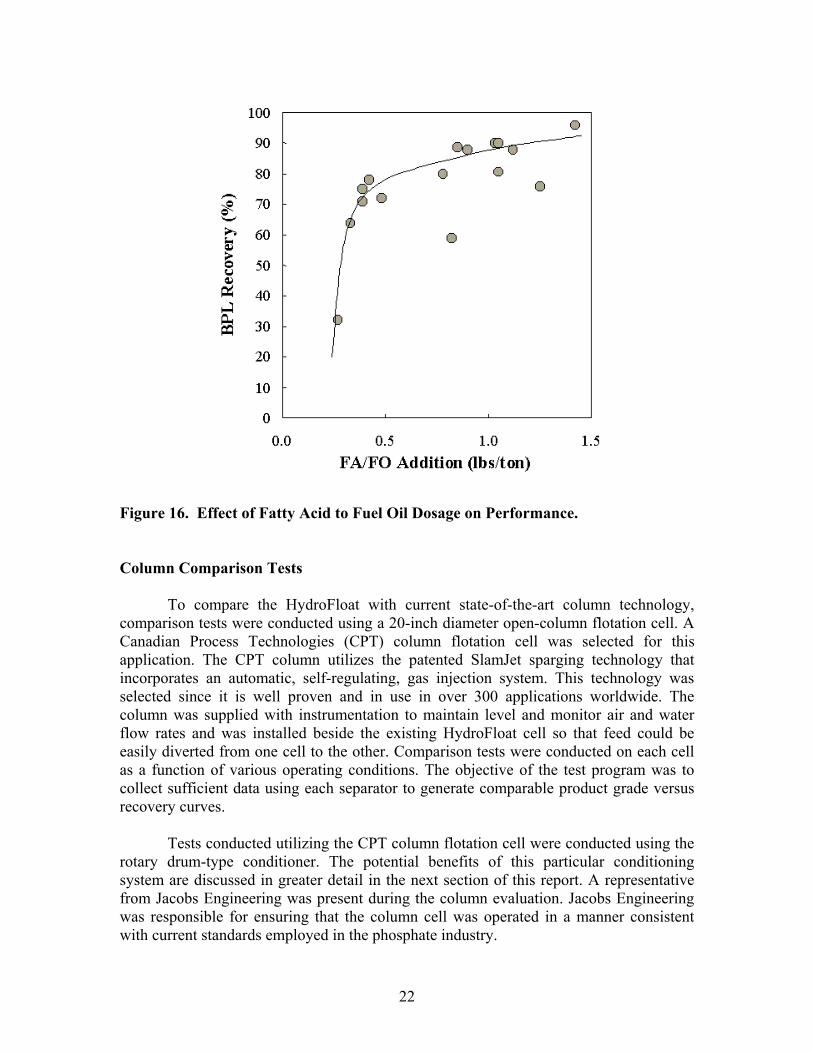
The collector used in the HydroFloat evaluation was supplied as a 70/30 mixture of fatty acid and fuel oil. The data presented in Figure 16 suggests that the fatty acid addition rate plays a significant role in determining the recovery of coarse phosphate. As the dosage of the fatty acid/fuel oil mixture increased from 0.2 lbs/ton to 0.5 lbs/ton, the recovery of coarse phosphate improved from 30% to 75%. In this example, the maximum BPL recovery was achieved at a collector dosage between 0.8-1.0 lbs/ton. It should be noted that this optimum addition rate is less than that currently used in plant operations. However, a lower collector dosage should be expected due to the reduced surface area of the coarser feed used in the HydroFloat tests.
Figure 15. Effect of Frother Dosage on HydroFloat Performance.
22
Figure 16. Effect of Fatty Acid to Fuel Oil Dosage on Performance. Column Comparison Tests
To compare the HydroFloat with current state-of-the-art column technology, comparison tests were conducted using a 20-inch diameter open-column flotation cell. A Canadian Process Technologies (CPT) column flotation cell was selected for this application. The CPT column utilizes the patented SlamJet sparging technology that incorporates an automatic, self-regulating, gas injection system. This technology was selected since it is well proven and in use in over 300 applications worldwide. The column was supplied with instrumentation to maintain level and monitor air and water flow rates and was installed beside the existing HydroFloat cell so that feed could be easily diverted from one cell to the other. Comparison tests were conducted on each cell as a function of various operating conditions. The objective of the test program was to collect sufficient data using each separator to generate comparable product grade versus recovery curves.
Tests conducted utilizing the CPT column flotation cell were conducted using the rotary drum-type conditioner. The potential benefits of this particular conditioning system are discussed in greater detail in the next section of this report. A representative from Jacobs Engineering was present during the column evaluation. Jacobs Engineering was responsible for ensuring that the column cell was operated in a manner consistent with current standards employed in the phosphate industry.
23
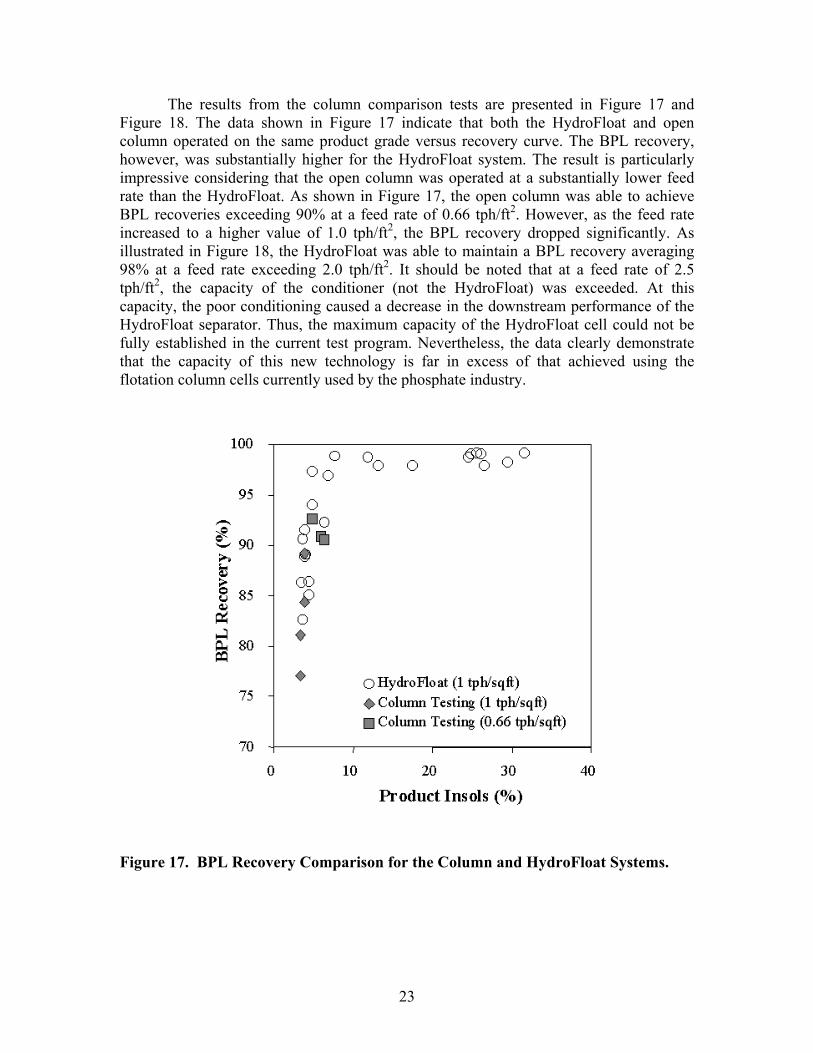
The results from the column comparison tests are presented in Figure 17 and
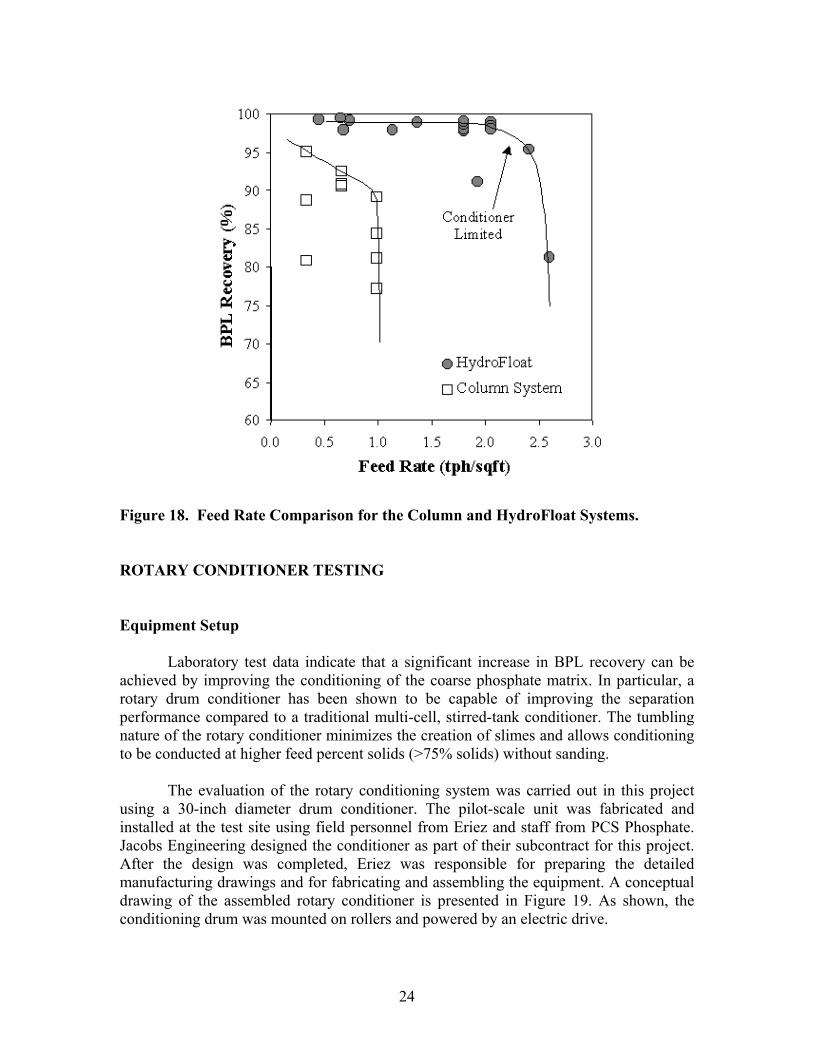
Figure 18. The data shown in Figure 17 indicate that both the HydroFloat and open column operated on the same product grade versus recovery curve. The BPL recovery, however, was substantially higher for the HydroFloat system. The result is particularly impressive considering that the open column was operated at a substantially lower feed rate than the HydroFloat. As shown in Figure 17, the open column was able to achieve BPL recoveries exceeding 90% at a feed rate of 0.66 tph/ft2. However, as the feed rate increased to a higher value of 1.0 tph/ft2, the BPL recovery dropped significantly. As illustrated in Figure 18, the HydroFloat was able to maintain a BPL recovery averaging 98% at a feed rate exceeding 2.0 tph/ft2. It should be noted that at a feed rate of 2.5 tph/ft2, the capacity of the conditioner (not the HydroFloat) was exceeded. At this capacity, the poor conditioning caused a decrease in the downstream performance of the HydroFloat separator. Thus, the maximum capacity of the HydroFloat cell could not be fully established in the current test program. Nevertheless, the data clearly demonstrate that the capacity of this new technology is far in excess of that achieved using the flotation column cells currently used by the phosphate industry.
Figure 17. BPL Recovery Comparison for the Column and HydroFloat Systems.
24
Figure 18. Feed Rate Comparison for the Column and HydroFloat Systems. ROTARY CONDITIONER TESTING Equipment Setup
Laboratory test data indicate that a significant increase in BPL recovery can be achieved by improving the conditioning of the coarse phosphate matrix. In particular, a rotary drum conditioner has been shown to be capable of improving the separation performance compared to a traditional multi-cell, stirred-tank conditioner. The tumbling nature of the rotary conditioner minimizes the creation of slimes and allows conditioning to be conducted at higher feed percent solids (>75% solids) without sanding.
The evaluation of the rotary conditioning system was carried out in this project using a 30-inch diameter drum conditioner. The pilot-scale unit was fabricated and installed at the test site using field personnel from Eriez and staff from PCS Phosphate. Jacobs Engineering designed the conditioner as part of their subcontract for this project. After the design was completed, Eriez was responsible for preparing the detailed manufacturing drawings and for fabricating and assembling the equipment. A conceptual drawing of the assembled rotary conditioner is presented in Figure 19. As shown, the conditioning drum was mounted on rollers and powered by an electric drive.

25
Figure 19. 30-Inch Diameter Drum Conditioner. Shakedown Testing
Shakedown testing of the tumbling conditioner system was completed in August 2001. During the shakedown period, the pilot-scale HydroFloat circuit was operated for five consecutive days. During this period, the performance of the conditioner was evaluated with regard to maximum solids loading, feed rate, retention time, and slimes generation. Power draw and various other mechanical checks were also completed. Results obtained from the preliminary shakedown testing were quite favorable. The conditioner was able to operate reliably up to and surpassing 75% solids at a maximum mass flow rate of 6 tph of dry solids. This feed rate allowed a range of conditioning times from 1-3 minutes to be maintained.
Figure 20 compares the initial separation results obtained using the rotary and stirred-tank conditioners for a 10 x 35 mesh feed. The data show that an acceptable product grade (i.e., <10% insols content) can be obtained using either conditioning system. The overall recovery, however, was nearly 20% higher for the tests conducted using the rotary conditioner. The difference in recovery can be attributed to the presence of slimes generated by the stirred-tank conditioner.

26
It is important to note that in current plant practice, the conditioner feed size distribution typically ranges from 10 mesh to 150 mesh. The presence of the fines fraction (35 x 150 mesh) contributes to an increase in viscosity that helps maintain coarser solids in suspension. After classification to remove the 10 x 150 mesh material, however, the 10 x 35 mesh fraction is highly prone to “sanding.” As such, high mixing speeds are required to maintain the plus 35 mesh solids in suspension when using the stirred-tank conditioner. The high mixing speeds and absence of fines resulted in the attrition of solids and subsequent slimes generation.
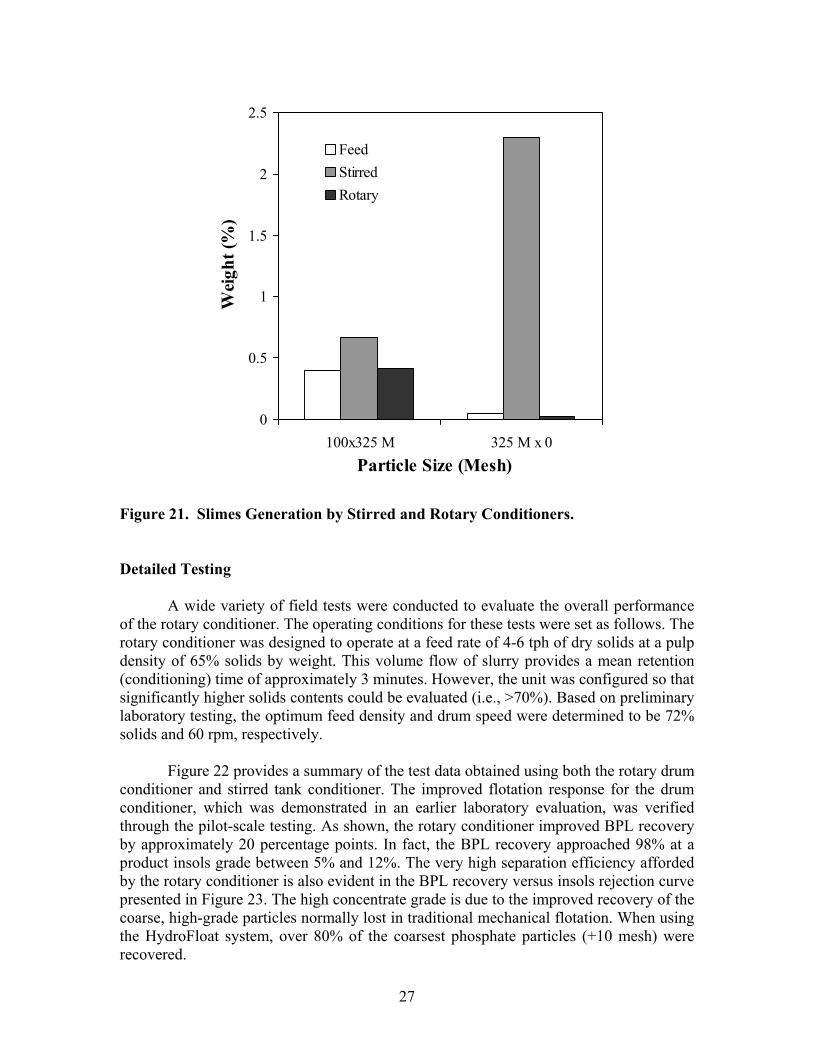
Several field tests were conducted to verify that the stirred tank conditioners produced more slimes than the rotary conditioner. These experiments were conducted by collecting samples of the discharge from both conditioners as a function of time. The proportion of slimes generated was determined by screening the conditioned solids at 100 mesh and 325 mesh. The test data from these evaluations are summarized in Figure 21. As shown, no measurable increase in slimes content was found to exist for the rotary conditioning system. In contrast, the results obtained using the stirred-tank conditioner indicate a twenty-fold increase in the amount of minus 325 mesh slimes. The large increase in the proportion of ultrafines is responsible for the lower recovery and poorer selectivity of the results obtained using the stirred tank conditioner.
Figure 20. Effect of Conditioner Type on HydroFloat Performance.
27
0
0.5
1
1.5
2
2.5
100x325 M 325 M x 0Particle Size (Mesh)
Wei
ght (
%)
FeedStirredRotary
Figure 21. Slimes Generation by Stirred and Rotary Conditioners. Detailed Testing
A wide variety of field tests were conducted to evaluate the overall performance of the rotary conditioner. The operating conditions for these tests were set as follows. The rotary conditioner was designed to operate at a feed rate of 4-6 tph of dry solids at a pulp density of 65% solids by weight. This volume flow of slurry provides a mean retention (conditioning) time of approximately 3 minutes. However, the unit was configured so that significantly higher solids contents could be evaluated (i.e., >70%). Based on preliminary laboratory testing, the optimum feed density and drum speed were determined to be 72% solids and 60 rpm, respectively.
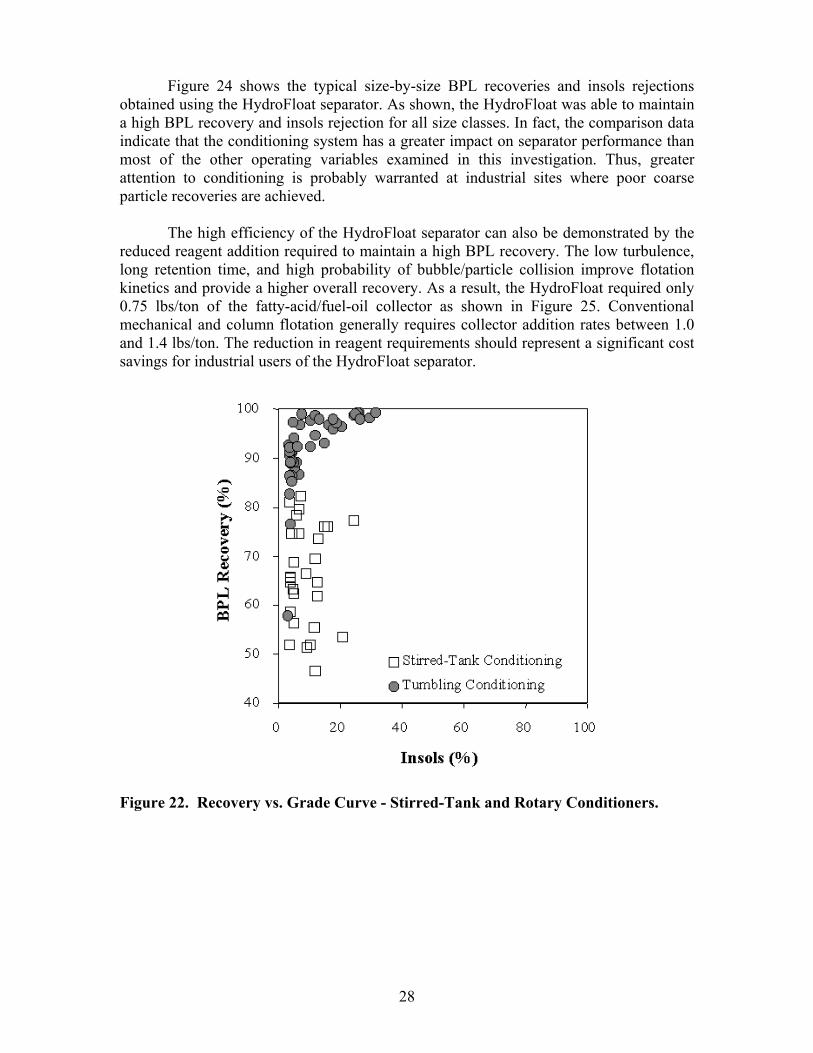
Figure 22 provides a summary of the test data obtained using both the rotary drum
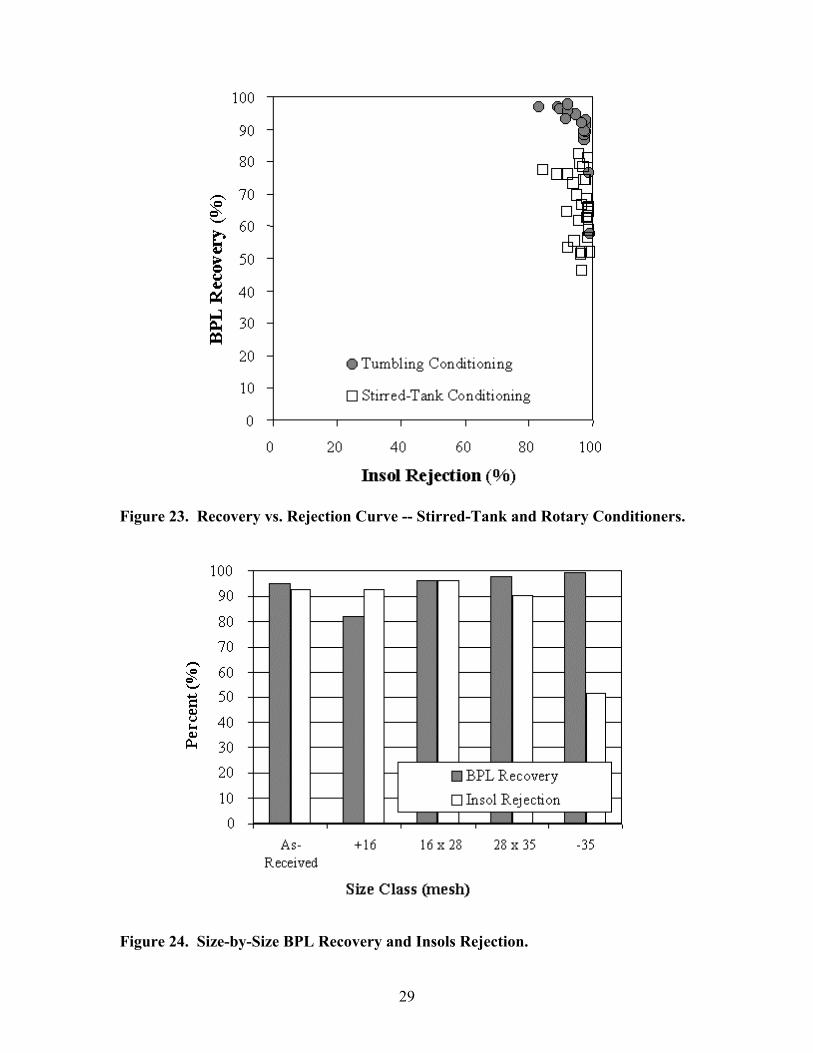
conditioner and stirred tank conditioner. The improved flotation response for the drum conditioner, which was demonstrated in an earlier laboratory evaluation, was verified through the pilot-scale testing. As shown, the rotary conditioner improved BPL recovery by approximately 20 percentage points. In fact, the BPL recovery approached 98% at a product insols grade between 5% and 12%. The very high separation efficiency afforded by the rotary conditioner is also evident in the BPL recovery versus insols rejection curve presented in Figure 23. The high concentrate grade is due to the improved recovery of the coarse, high-grade particles normally lost in traditional mechanical flotation. When using the HydroFloat system, over 80% of the coarsest phosphate particles (+10 mesh) were recovered.
28
Figure 24 shows the typical size-by-size BPL recoveries and insols rejections obtained using the HydroFloat separator. As shown, the HydroFloat was able to maintain a high BPL recovery and insols rejection for all size classes. In fact, the comparison data indicate that the conditioning system has a greater impact on separator performance than most of the other operating variables examined in this investigation. Thus, greater attention to conditioning is probably warranted at industrial sites where poor coarse particle recoveries are achieved.
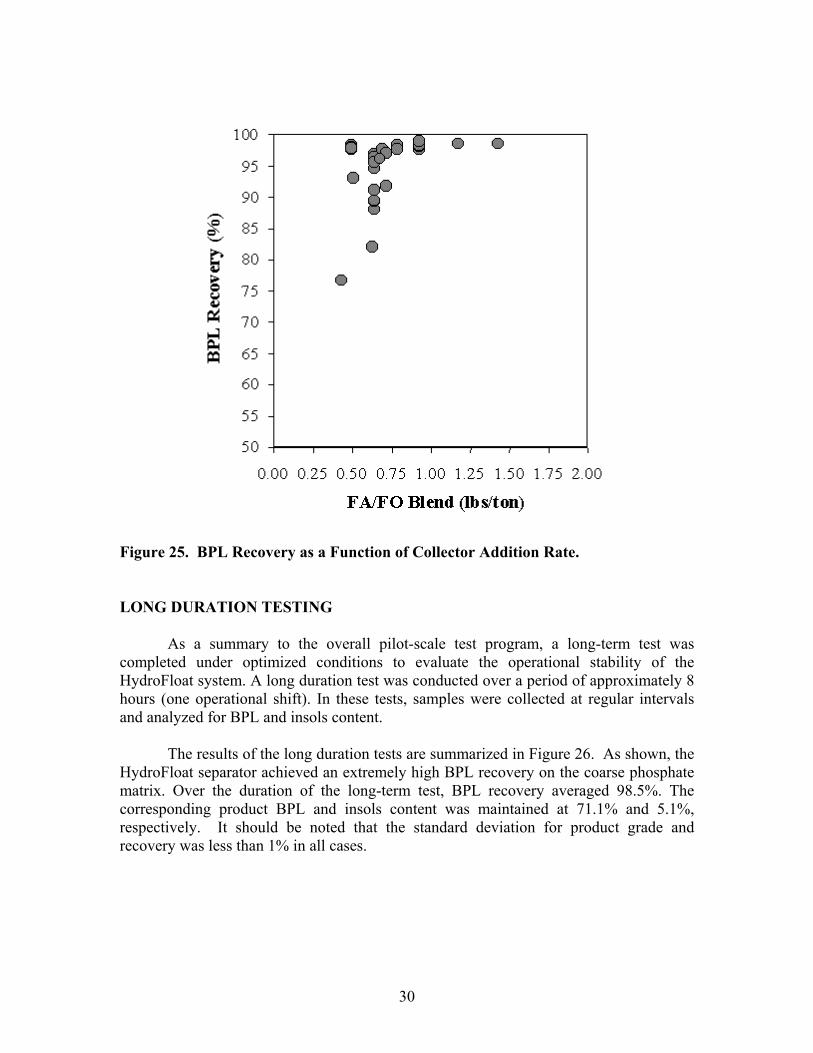
The high efficiency of the HydroFloat separator can also be demonstrated by the reduced reagent addition required to maintain a high BPL recovery. The low turbulence, long retention time, and high probability of bubble/particle collision improve flotation kinetics and provide a higher overall recovery. As a result, the HydroFloat required only 0.75 lbs/ton of the fatty-acid/fuel-oil collector as shown in Figure 25. Conventional mechanical and column flotation generally requires collector addition rates between 1.0 and 1.4 lbs/ton. The reduction in reagent requirements should represent a significant cost savings for industrial users of the HydroFloat separator.
Figure 22. Recovery vs. Grade Curve - Stirred-Tank and Rotary Conditioners.
29
Figure 23. Recovery vs. Rejection Curve -- Stirred-Tank and Rotary Conditioners.
Figure 24. Size-by-Size BPL Recovery and Insols Rejection.
30
Figure 25. BPL Recovery as a Function of Collector Addition Rate. LONG DURATION TESTING
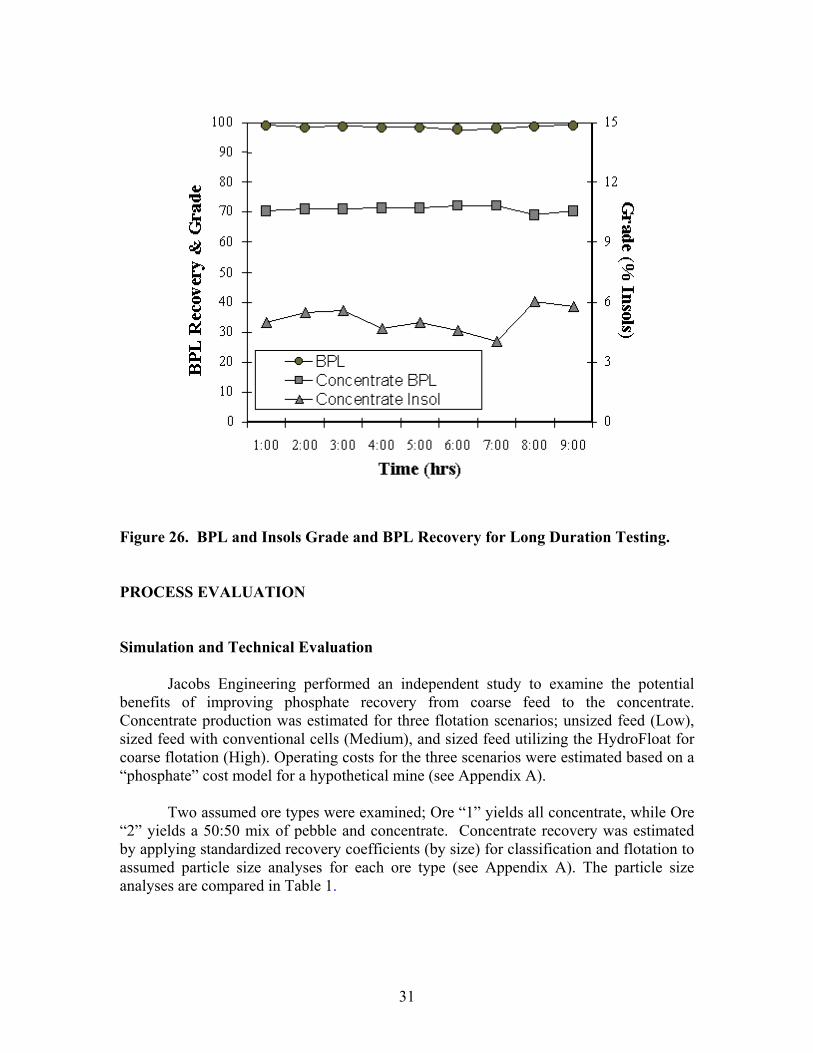
As a summary to the overall pilot-scale test program, a long-term test was completed under optimized conditions to evaluate the operational stability of the HydroFloat system. A long duration test was conducted over a period of approximately 8 hours (one operational shift). In these tests, samples were collected at regular intervals and analyzed for BPL and insols content.
The results of the long duration tests are summarized in Figure 26. As shown, the HydroFloat separator achieved an extremely high BPL recovery on the coarse phosphate matrix. Over the duration of the long-term test, BPL recovery averaged 98.5%. The corresponding product BPL and insols content was maintained at 71.1% and 5.1%, respectively. It should be noted that the standard deviation for product grade and recovery was less than 1% in all cases.
31
Figure 26. BPL and Insols Grade and BPL Recovery for Long Duration Testing. PROCESS EVALUATION Simulation and Technical Evaluation
Jacobs Engineering performed an independent study to examine the potential benefits of improving phosphate recovery from coarse feed to the concentrate. Concentrate production was estimated for three flotation scenarios; unsized feed (Low), sized feed with conventional cells (Medium), and sized feed utilizing the HydroFloat for coarse flotation (High). Operating costs for the three scenarios were estimated based on a “phosphate” cost model for a hypothetical mine (see Appendix A).
Two assumed ore types were examined; Ore “1” yields all concentrate, while Ore “2” yields a 50:50 mix of pebble and concentrate. Concentrate recovery was estimated by applying standardized recovery coefficients (by size) for classification and flotation to assumed particle size analyses for each ore type (see Appendix A). The particle size analyses are compared in Table 1.

32
Table 1. Ore 1 and Ore 2 Size Characteristics.
The margins for each case were estimated from the difference between selling price ($24/ton) and estimated operating costs, multiplied by the concentrate tonnage. Pebble tonnage, which remained constant, was not considered in the margin. The Net Present Values (NPV) of the margins were then calculated.
Ore 1
The cost model simulations for Ore 1 were based on the following annual production statistics as presented in Table 2. Table 2. Annual Product Statistics for Ore 1.
Mesh Unsized Coarse Fine Unsized Coarse Fine>14 2.0% 10.9% 0.0% 2.4% 14.4% 0.0%
14/20 3.0% 15.2% 0.3% 2.5% 13.9% 0.2%20/28 7.0% 25.5% 2.9% 4.8% 19.4% 1.9%28/35 10.0% 20.3% 7.7% 9.1% 20.3% 6.9%35/48 13.0% 12.5% 13.1% 13.3% 14.2% 13.1%48/65 23.0% 9.8% 26.0% 23.7% 11.2% 26.1%
65/100 26.0% 4.8% 30.7% 26.8% 5.4% 31.0%100/150 13.0% 1.0% 15.7% 14.4% 1.2% 17.0%
<150 3.0% 0.1% 3.6% 3.0% 0.1% 3.7%Total 100.0% 99.9% 100.0% 100.0% 100.0% 100.0%
%Wt. Distribution 100.0 18.3 81.7 100.0 16.5 83.5
%BPL 18.6 27.8 16.5 15.9 33.3 12.4 %BPL Distribution 100.0 27.3 72.7 100.0 34.7 65.3
Ore 1 Ore 2
Operating schedule 7 days/weekNo. of draglines 3Acres mined 528Overburden stripped 21,100,000 bcyOre recovered 15,100,000 bcyOre density 1.188 dry t/bcyFlotation feed 12,917,000 t/yFeed %BPL 18.6
33
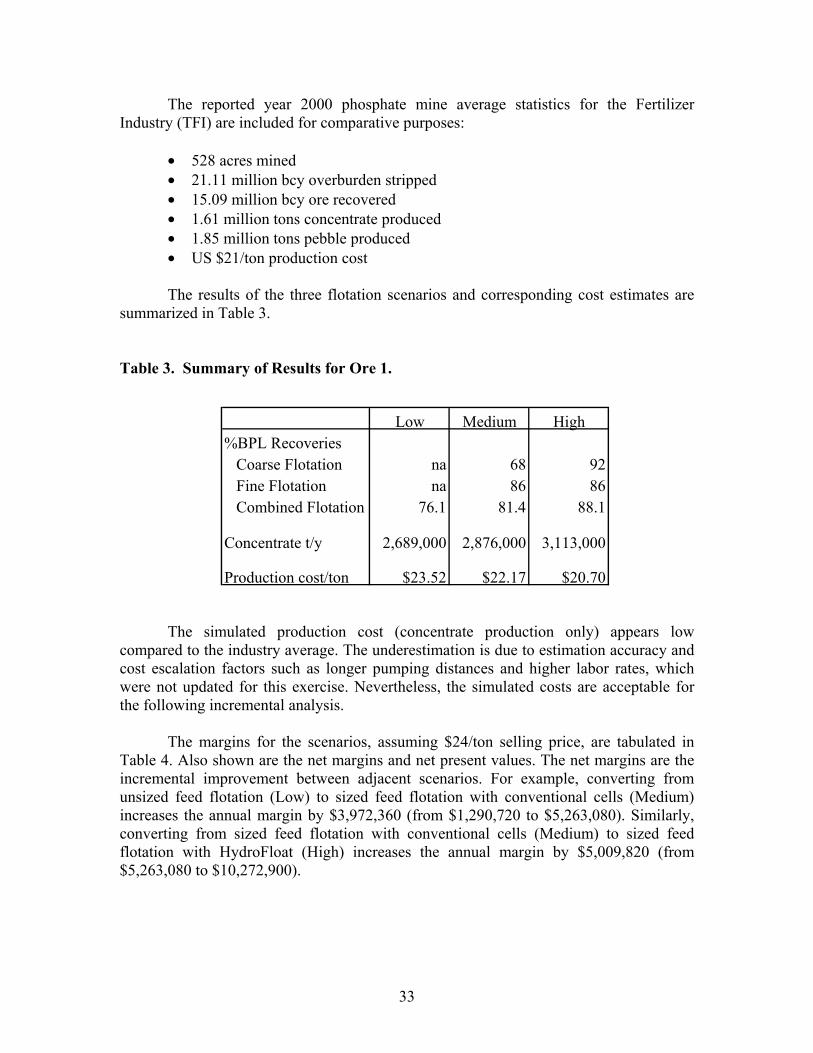
The reported year 2000 phosphate mine average statistics for the Fertilizer
Industry (TFI) are included for comparative purposes:
• 528 acres mined • 21.11 million bcy overburden stripped • 15.09 million bcy ore recovered • 1.61 million tons concentrate produced • 1.85 million tons pebble produced • US $21/ton production cost
The results of the three flotation scenarios and corresponding cost estimates are
summarized in Table 3. Table 3. Summary of Results for Ore 1.
The simulated production cost (concentrate production only) appears low compared to the industry average. The underestimation is due to estimation accuracy and cost escalation factors such as longer pumping distances and higher labor rates, which were not updated for this exercise. Nevertheless, the simulated costs are acceptable for the following incremental analysis.
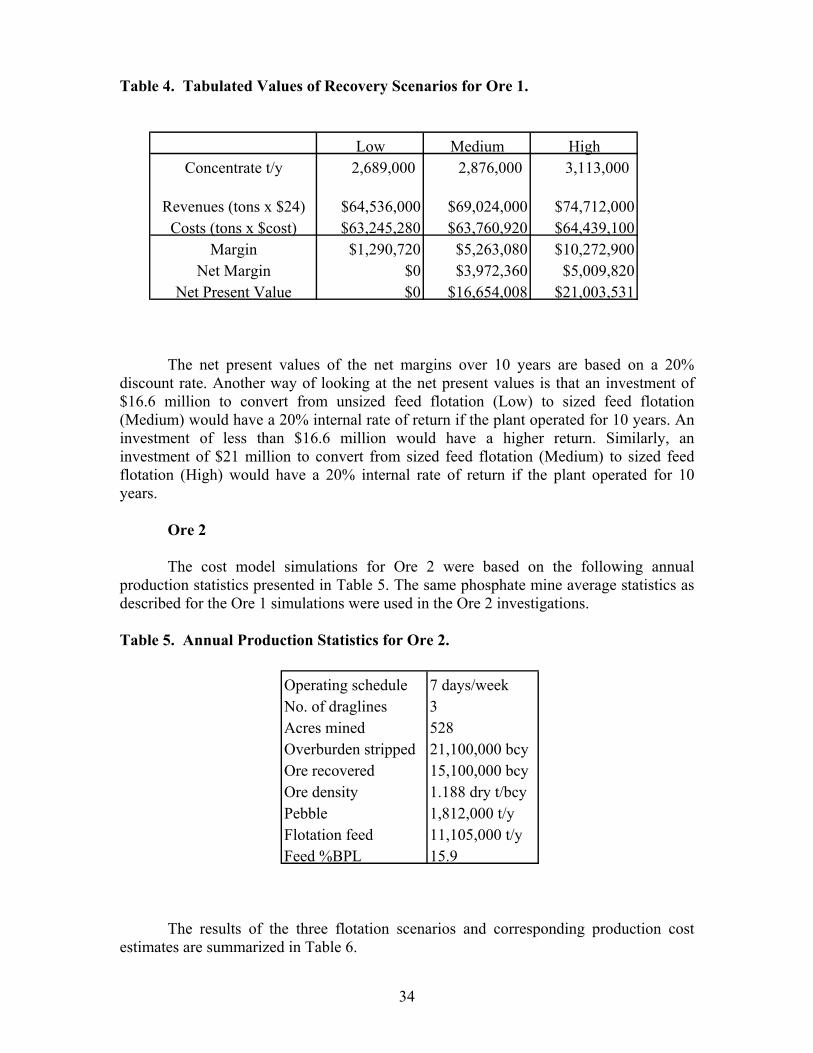
The margins for the scenarios, assuming $24/ton selling price, are tabulated in Table 4. Also shown are the net margins and net present values. The net margins are the incremental improvement between adjacent scenarios. For example, converting from unsized feed flotation (Low) to sized feed flotation with conventional cells (Medium) increases the annual margin by $3,972,360 (from $1,290,720 to $5,263,080). Similarly, converting from sized feed flotation with conventional cells (Medium) to sized feed flotation with HydroFloat (High) increases the annual margin by $5,009,820 (from $5,263,080 to $10,272,900).
Low Medium High%BPL Recoveries Coarse Flotation na 68 92 Fine Flotation na 86 86 Combined Flotation 76.1 81.4 88.1
Concentrate t/y 2,689,000 2,876,000 3,113,000
Production cost/ton $23.52 $22.17 $20.70
34
Table 4. Tabulated Values of Recovery Scenarios for Ore 1.
The net present values of the net margins over 10 years are based on a 20% discount rate. Another way of looking at the net present values is that an investment of $16.6 million to convert from unsized feed flotation (Low) to sized feed flotation (Medium) would have a 20% internal rate of return if the plant operated for 10 years. An investment of less than $16.6 million would have a higher return. Similarly, an investment of $21 million to convert from sized feed flotation (Medium) to sized feed flotation (High) would have a 20% internal rate of return if the plant operated for 10 years.
Ore 2
The cost model simulations for Ore 2 were based on the following annual production statistics presented in Table 5. The same phosphate mine average statistics as described for the Ore 1 simulations were used in the Ore 2 investigations. Table 5. Annual Production Statistics for Ore 2.
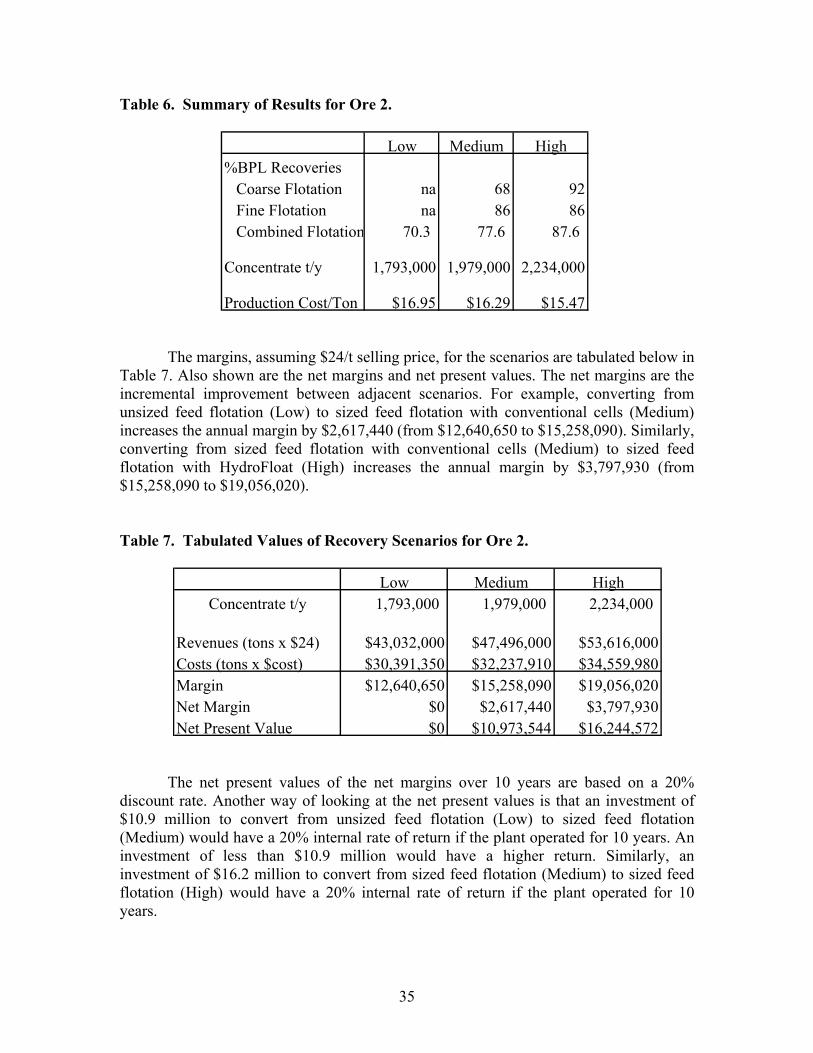
The results of the three flotation scenarios and corresponding production cost estimates are summarized in Table 6.
Low Medium HighConcentrate t/y 2,689,000 2,876,000 3,113,000
Revenues (tons x $24) $64,536,000 $69,024,000 $74,712,000Costs (tons x $cost) $63,245,280 $63,760,920 $64,439,100
Margin $1,290,720 $5,263,080 $10,272,900Net Margin $0 $3,972,360 $5,009,820
Net Present Value $0 $16,654,008 $21,003,531
Operating schedule 7 days/weekNo. of draglines 3Acres mined 528Overburden stripped 21,100,000 bcyOre recovered 15,100,000 bcyOre density 1.188 dry t/bcyPebble 1,812,000 t/yFlotation feed 11,105,000 t/yFeed %BPL 15.9
35
Table 6. Summary of Results for Ore 2.
The margins, assuming $24/t selling price, for the scenarios are tabulated below in Table 7. Also shown are the net margins and net present values. The net margins are the incremental improvement between adjacent scenarios. For example, converting from unsized feed flotation (Low) to sized feed flotation with conventional cells (Medium) increases the annual margin by $2,617,440 (from $12,640,650 to $15,258,090). Similarly, converting from sized feed flotation with conventional cells (Medium) to sized feed flotation with HydroFloat (High) increases the annual margin by $3,797,930 (from $15,258,090 to $19,056,020). Table 7. Tabulated Values of Recovery Scenarios for Ore 2.
The net present values of the net margins over 10 years are based on a 20% discount rate. Another way of looking at the net present values is that an investment of $10.9 million to convert from unsized feed flotation (Low) to sized feed flotation (Medium) would have a 20% internal rate of return if the plant operated for 10 years. An investment of less than $10.9 million would have a higher return. Similarly, an investment of $16.2 million to convert from sized feed flotation (Medium) to sized feed flotation (High) would have a 20% internal rate of return if the plant operated for 10 years.
Low Medium High%BPL Recoveries Coarse Flotation na 68 92 Fine Flotation na 86 86 Combined Flotation 70.3 77.6 87.6
Concentrate t/y 1,793,000 1,979,000 2,234,000
Production Cost/Ton $16.95 $16.29 $15.47
Low Medium HighConcentrate t/y 1,793,000 1,979,000 2,234,000
Revenues (tons x $24) $43,032,000 $47,496,000 $53,616,000Costs (tons x $cost) $30,391,350 $32,237,910 $34,559,980Margin $12,640,650 $15,258,090 $19,056,020Net Margin $0 $2,617,440 $3,797,930Net Present Value $0 $10,973,544 $16,244,572
36
The benefits of sized feed flotation are clear given the assumptions of the study. The assumptions are considered reasonable; however, they may not accurately represent current conditions at any given plant. Clearly, if a plant feed BPL distribution is finer than the feed in this study, the benefits of improved coarse feed flotation are diminished. However, in comparing Ores 1 and 2, it is apparent that improving flotation has more significance as the relative amount of concentrate increases. In general, the remaining ore reserves are such that the Florida phosphate industry will see a decline in pebble production and an increase in concentrate production.
37
SUMMARY
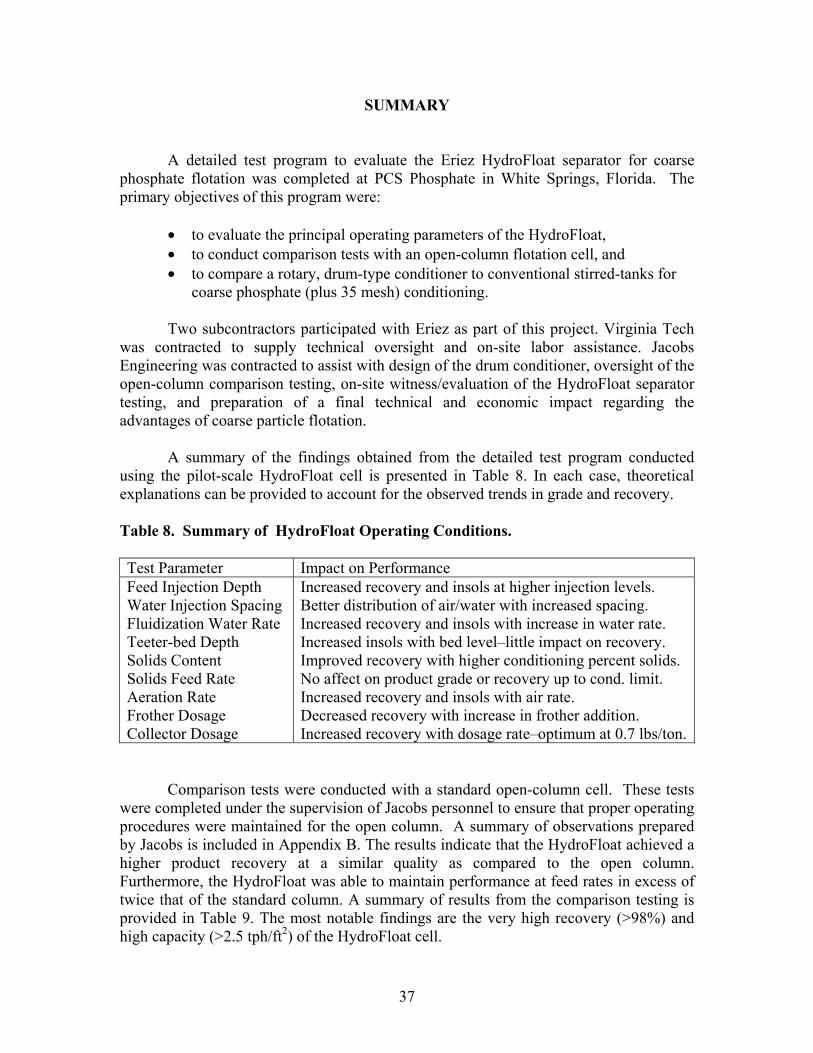
A detailed test program to evaluate the Eriez HydroFloat separator for coarse phosphate flotation was completed at PCS Phosphate in White Springs, Florida. The primary objectives of this program were:
• to evaluate the principal operating parameters of the HydroFloat, • to conduct comparison tests with an open-column flotation cell, and • to compare a rotary, drum-type conditioner to conventional stirred-tanks for
coarse phosphate (plus 35 mesh) conditioning.
Two subcontractors participated with Eriez as part of this project. Virginia Tech was contracted to supply technical oversight and on-site labor assistance. Jacobs Engineering was contracted to assist with design of the drum conditioner, oversight of the open-column comparison testing, on-site witness/evaluation of the HydroFloat separator testing, and preparation of a final technical and economic impact regarding the advantages of coarse particle flotation.
A summary of the findings obtained from the detailed test program conducted using the pilot-scale HydroFloat cell is presented in Table 8. In each case, theoretical explanations can be provided to account for the observed trends in grade and recovery. Table 8. Summary of HydroFloat Operating Conditions. Test Parameter Impact on Performance Feed Injection Depth Water Injection Spacing Fluidization Water Rate Teeter-bed Depth Solids Content Solids Feed Rate Aeration Rate Frother Dosage Collector Dosage
Increased recovery and insols at higher injection levels. Better distribution of air/water with increased spacing. Increased recovery and insols with increase in water rate. Increased insols with bed level–little impact on recovery. Improved recovery with higher conditioning percent solids. No affect on product grade or recovery up to cond. limit. Increased recovery and insols with air rate. Decreased recovery with increase in frother addition. Increased recovery with dosage rate–optimum at 0.7 lbs/ton.
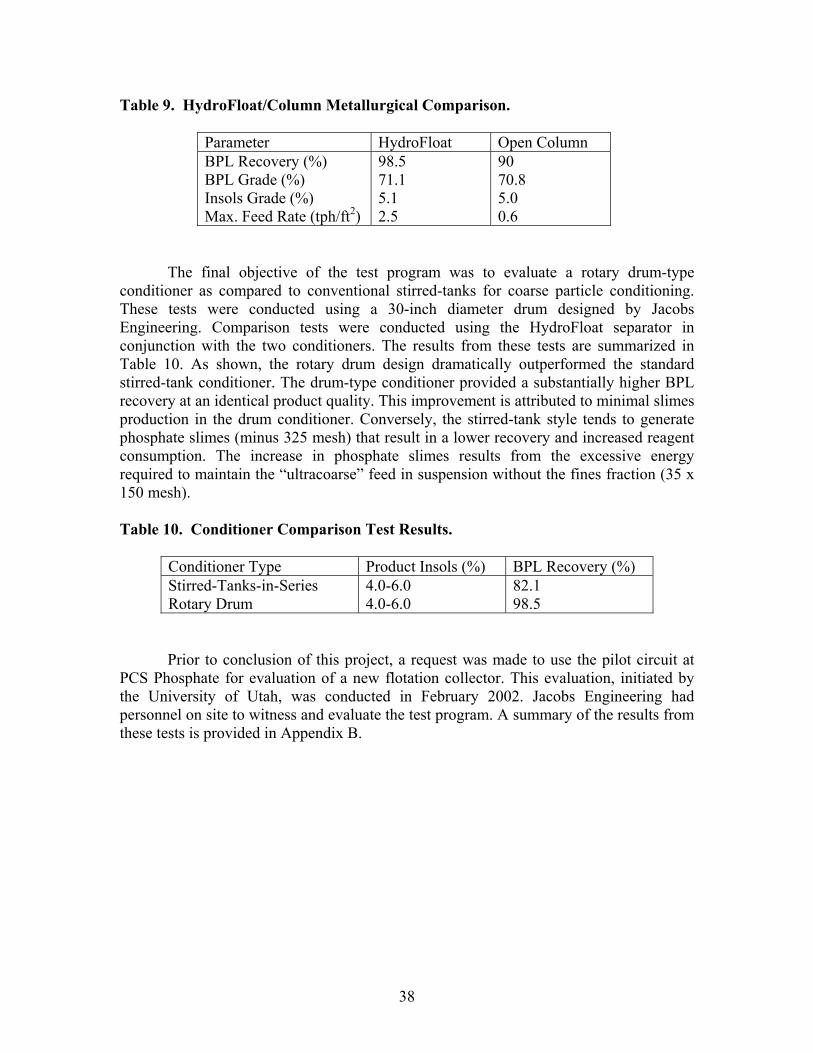
Comparison tests were conducted with a standard open-column cell. These tests were completed under the supervision of Jacobs personnel to ensure that proper operating procedures were maintained for the open column. A summary of observations prepared by Jacobs is included in Appendix B. The results indicate that the HydroFloat achieved a higher product recovery at a similar quality as compared to the open column. Furthermore, the HydroFloat was able to maintain performance at feed rates in excess of twice that of the standard column. A summary of results from the comparison testing is provided in Table 9. The most notable findings are the very high recovery (>98%) and high capacity (>2.5 tph/ft2) of the HydroFloat cell.
38
Table 9. HydroFloat/Column Metallurgical Comparison.
Parameter HydroFloat Open Column BPL Recovery (%) BPL Grade (%) Insols Grade (%) Max. Feed Rate (tph/ft2)
98.5 71.1 5.1 2.5
90 70.8 5.0 0.6
The final objective of the test program was to evaluate a rotary drum-type conditioner as compared to conventional stirred-tanks for coarse particle conditioning. These tests were conducted using a 30-inch diameter drum designed by Jacobs Engineering. Comparison tests were conducted using the HydroFloat separator in conjunction with the two conditioners. The results from these tests are summarized in Table 10. As shown, the rotary drum design dramatically outperformed the standard stirred-tank conditioner. The drum-type conditioner provided a substantially higher BPL recovery at an identical product quality. This improvement is attributed to minimal slimes production in the drum conditioner. Conversely, the stirred-tank style tends to generate phosphate slimes (minus 325 mesh) that result in a lower recovery and increased reagent consumption. The increase in phosphate slimes results from the excessive energy required to maintain the “ultracoarse” feed in suspension without the fines fraction (35 x 150 mesh). Table 10. Conditioner Comparison Test Results.
Conditioner Type Product Insols (%) BPL Recovery (%) Stirred-Tanks-in-Series Rotary Drum
4.0-6.0 4.0-6.0
82.1 98.5
Prior to conclusion of this project, a request was made to use the pilot circuit at PCS Phosphate for evaluation of a new flotation collector. This evaluation, initiated by the University of Utah, was conducted in February 2002. Jacobs Engineering had personnel on site to witness and evaluate the test program. A summary of the results from these tests is provided in Appendix B.

39
REFERENCES Ahmed N, Jameson GJ. 1989. Flotation kinetics. Mineral Processing and Extractive Metallurgy Review 5:77-99. Barbery G, Bouajila A, Soto H, inventors; Universite Laval, Cite Universitaire, Quebec, Canada, assignee. 1989 April 18. Method for separation of coarse particles. US patent 4,822,493. Barbery G. 1984. Engineering aspects of flotation in the minerals industry: flotation machines, circuits and their simulation. In: Ives KJ, editor. The scientific basis of flotation. NATO Advanced Institute Services, Series E: Applied Sciences, nr 25. Boston: Martinus Nijhoff Publishers. p 289-348. Bensley CN, Nicol SK. 1985. The effect of mechanical variables on the flotation of coarse coal. Coal Preparation 1:189-205. Bethell PJ. 1988. Current and future processing flowsheets. In: Klimpel RR, Luckie PT, editors. Industrial practice of fine coal processing. 25-28 Sep 1988, Somerset PA, Littleton (CO): Society of Mining Engineers. Chapter 30. p 317-29. Davis BE, Hood GD. 1993. Improved recovery of coarse Florida phosphate. Mining Engineering 45(6):596-9. Davis BE, Hood GD. 1992. Conditioning parameter effects on the recovery of coarse phosphate. Presented at Regional AIME/AIChE/AIPG/FIPR Phosphate Conference, Lakeland, FL, Sept. 24-25. Unpublished. Finch JA, Dobby GS. 1990. Column flotation. New York: Pergamon Press. Florida Institute of Phosphate Research. 1990. Enhanced recovery of coarse particles during phosphate flotation. Bartow (FL): Florida Institute of Phosphate Research. Publication nr 02-067-099. Florida Institute of Phosphate Research. 1992. Development of novel flotation-elutriation method for coarse phosphate beneficiation. Bartow (FL): Florida Institute of Phosphate Research. Publication nr 02-070-098. Gaudin AM, Groh JO, Henderson HB. 1931. Effect of particle size in flotation. New York: American Institute of Mining and Metallurgical Engineers. Technical Publication nr 414. p 3-23. Harris MC, Franzidis JP, O’Conner CT, Stonestreet P. 1992. An evaluation of the role of particle size in the flotation of coal using different cell technologies. Minerals Engineering 5(10/12): 1225-38.
40
Heiskanen KI. 1993. Particle classification. New York: Chapman & Hall. Honaker RQ. 1996. Hindered bed classifiers for fine coal cleaning. In: Coal prep ’96: proceedings, 13th International Coal Preparation Exhibition and Conference; 1996 April 30-2 May; Lexington, KY. Englewood (CO): Intertec Presentations, Inc. p 59-70. Ives KJ, editor. 1984. The scientific basis of flotation. NATO Advanced Science Institute Series. Boston: Martinus Nijhoff Publishers. Jameson GJ, Nam S, Young MM. 1977. Physical factors affecting recovery rates in flotation. Minerals Science and Engineering 9(3): 103-18. Laskowski JS, Wang Q, inventors; University of British Columbia, assignee. 1995 October 10. Flotation process for the flotation of coarse fractions of potash ores. US patent 5,456,362. Lawver JE, Bernardi JP, McKeraghan GF, Raulerson JD, Lynch D, Hearon RS. 1984. New techniques in beneficiation of the Florida phosphates of the future. Minerals and Metallurgical Processing 1(2): 89-106. Mankosa MJ, Carver RM. 1995. Processing of chopped wire waste material using the Floatex density separator. In: Queneau PB, Peterson RD, editors. Third International Symposium on Recycling of Metals and Engineered Materials; 1995 November 12-15; Point Clear, AL. Warrendale (PA): The Minerals, Metals, and Materials Society. p 111-20. McKnight K, Stouffer N, Domenico J, Mankosa MJ. 1996. Recovery of zircon and other economic minerals from wet-gravity tailings using the Floatex density separator. Presented at: SME Annual Meeting; 1996 Mar 11-14; Phoenix, AZ. Morris TM. 1952. Measurement and evaluation of the rate of flotation as a function of particle size. Mining Engineering 4(8):794-8. Moudgil BM, Gupta D. 1989. Flotation of coarse phosphate particles. In: Chander S, Klimpel R, editors. Advances in coal and mineral processing using flotation: proceedings of an Engineering Foundation Conference; 1989 December 3-8; Palm Coast, FL. p 164-8. Moudgil BM, Barnett DH. 1979. Agglomeration skin flotation of coarse phosphate rock. Mining Engineering 31(3):283-9. Reed S, Roger R, Honaker RQ, Mankosa MJ. 1995. In-plant testing of the Floatex density separator for fine coal cleaning. In: Proceedings, 12th International Coal Preparation Exhibition and Conference; 1995 May 2-4; Lexington, KY. p 163-174.
41
Robinson AJ. 1959. Relationship between particle size and collector concentration. Transactions, Institution of Mining and Metallurgy nr 69, p 45-62. Schulze HJ. 1984. Physico-chemical elementary processes in flotation: an analysis from the point of view of colloid science including process engineering considerations. New York: Elsevier. p 238-253. Schulze HJ. 1977. New theoretical and experimental investigations on stability of bubble/particle aggregates in flotation: a theory on the upper particle size of floatability. International Journal of Mineral Processing 4(3):241-59. Soto H, Barbery G. 1991. Flotation of coarse particles in a counter-current column cell. Minerals and Metallurgical Processing 8(1):16-21. Soto H. 1988. Private report to the Florida Institute of Phosphate Research. Soto H, Iwasaki I. 1986. Selective flotation of phosphates from dolomite using cationic collectors. Part II. Effect of particle size, abrasion and pH. International Journal of Mineral Processing 16(1/2):17-27. Trahar WJ, Warren LJ. 1976. The floatability of very fine particles–a review. International Journal of Mineral Processing 3:103-31. United States Geological Survey. 1999. Mineral commodity summaries. Phosphate rock. Reston (VA): U.S. Department of the Interior, U.S. Geological Survey.
APPENDIX A
COST SIMULATION DATA
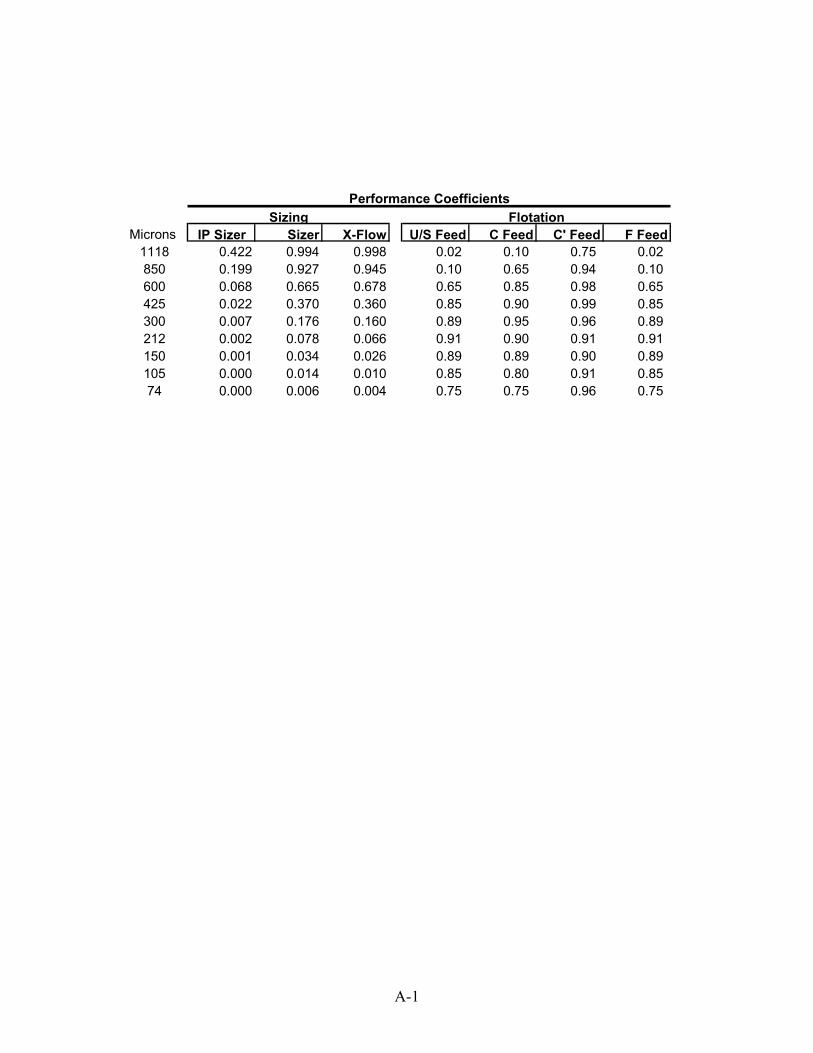
A-1
Microns IP Sizer Sizer X-Flow U/S Feed C Feed C' Feed F Feed1118 0.422 0.994 0.998 0.02 0.10 0.75 0.02 850 0.199 0.927 0.945 0.10 0.65 0.94 0.10 600 0.068 0.665 0.678 0.65 0.85 0.98 0.65 425 0.022 0.370 0.360 0.85 0.90 0.99 0.85 300 0.007 0.176 0.160 0.89 0.95 0.96 0.89 212 0.002 0.078 0.066 0.91 0.90 0.91 0.91 150 0.001 0.034 0.026 0.89 0.89 0.90 0.89 105 0.000 0.014 0.010 0.85 0.80 0.91 0.85 74 0.000 0.006 0.004 0.75 0.75 0.96 0.75
FlotationSizingPerformance Coefficients
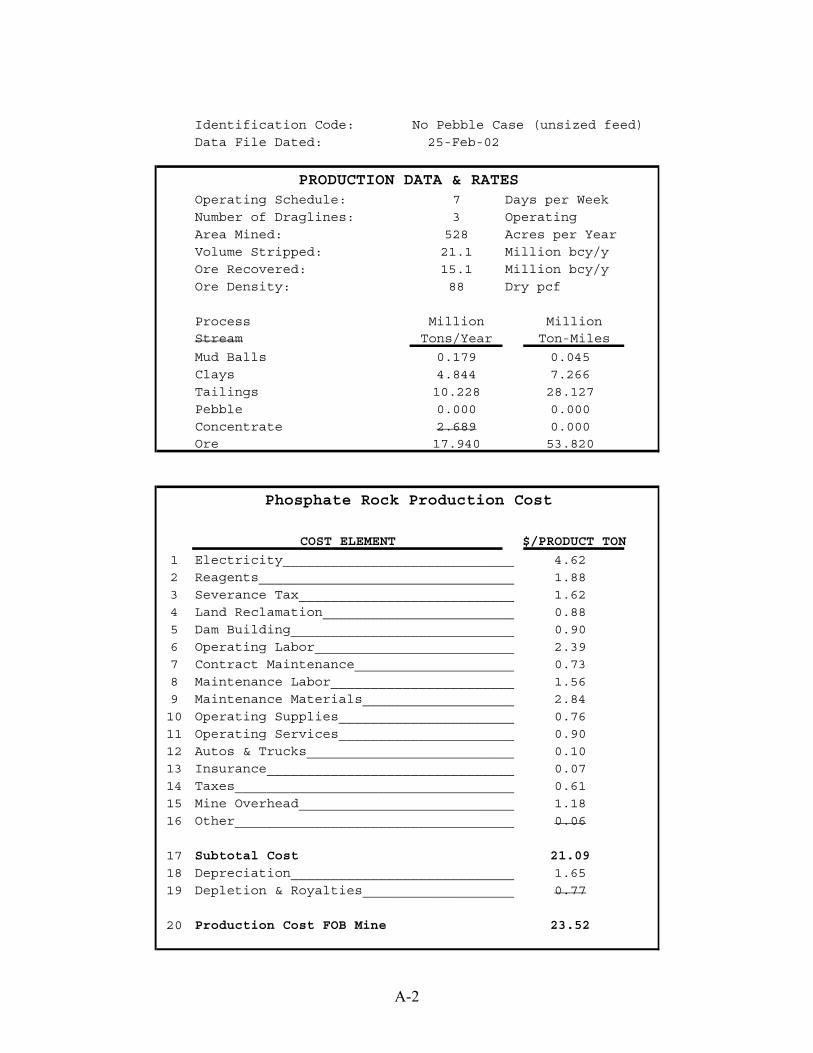
A-2
Identification Code: No Pebble Case (unsized feed)Data File Dated: 25-Feb-02
PRODUCTION DATA & RATESOperating Schedule: 7 Days per WeekNumber of Draglines: 3 OperatingArea Mined: 528 Acres per YearVolume Stripped: 21.1 Million bcy/yOre Recovered: 15.1 Million bcy/yOre Density: 88 Dry pcf
Process Million MillionStream Tons/Year Ton-Miles
Mud Balls 0.179 0.045Clays 4.844 7.266Tailings 10.228 28.127Pebble 0.000 0.000Concentrate 2.689 0.000Ore 17.940 53.820
Phosphate Rock Production Cost
COST ELEMENT $/PRODUCT TON
1 Electricity_____________________________ 4.622 Reagents________________________________ 1.883 Severance Tax___________________________ 1.624 Land Reclamation________________________ 0.885 Dam Building____________________________ 0.906 Operating Labor_________________________ 2.397 Contract Maintenance____________________ 0.738 Maintenance Labor_______________________ 1.569 Maintenance Materials___________________ 2.8410 Operating Supplies______________________ 0.7611 Operating Services______________________ 0.9012 Autos & Trucks__________________________ 0.1013 Insurance_______________________________ 0.0714 Taxes___________________________________ 0.6115 Mine Overhead___________________________ 1.1816 Other___________________________________ 0.06
17 Subtotal Cost 21.09
18 Depreciation____________________________ 1.6519 Depletion & Royalties___________________ 0.77
20 Production Cost FOB Mine 23.52

A-3
Identification Code: No Pebble Case (Base)Data File Dated: 25-Feb-02
PRODUCTION DATA & RATESOperating Schedule: 7 Days per WeekNumber of Draglines: 3 OperatingArea Mined: 528 Acres per YearVolume Stripped: 21.1 Million bcy/yOre Recovered: 15.1 Million bcy/yOre Density: 88 Dry pcf
Process Million MillionStream Tons/Year Ton-Miles
Mud Balls 0.179 0.045Clays 4.844 7.266Tailings 10.041 27.612Pebble 0.000 0.000Concentrate 2.876 0.000Ore 17.940 53.820
Phosphate Rock Production Cost
COST ELEMENT $/PRODUCT TON
1 Electricity_____________________________ 4.312 Reagents________________________________ 1.783 Severance Tax___________________________ 1.624 Land Reclamation________________________ 0.835 Dam Building____________________________ 0.846 Operating Labor_________________________ 2.247 Contract Maintenance____________________ 0.688 Maintenance Labor_______________________ 1.459 Maintenance Materials___________________ 2.6610 Operating Supplies______________________ 0.7111 Operating Services______________________ 0.8412 Autos & Trucks__________________________ 0.1013 Insurance_______________________________ 0.0714 Taxes___________________________________ 0.5715 Mine Overhead___________________________ 1.1016 Other___________________________________ 0.06
17 Subtotal Cost 19.86
18 Depreciation____________________________ 1.5519 Depletion & Royalties___________________ 0.77
20 Production Cost FOB Mine 22.17
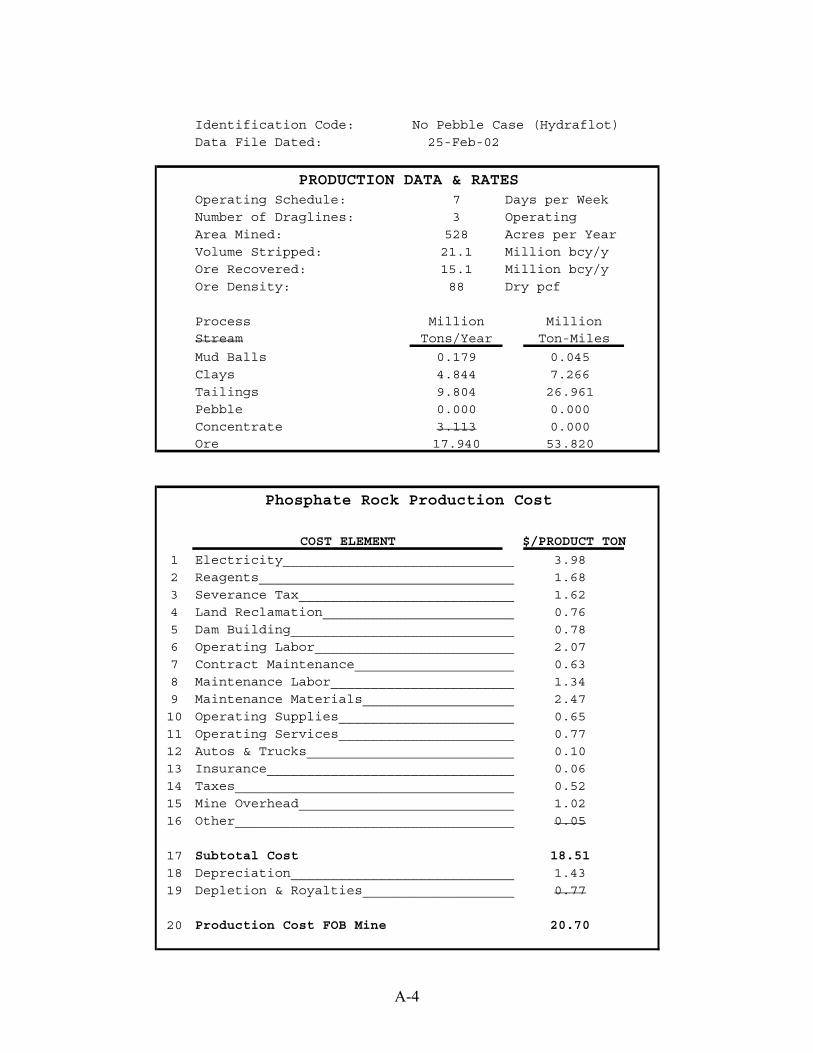
A-4
Identification Code: No Pebble Case (Hydraflot)Data File Dated: 25-Feb-02
PRODUCTION DATA & RATESOperating Schedule: 7 Days per WeekNumber of Draglines: 3 OperatingArea Mined: 528 Acres per YearVolume Stripped: 21.1 Million bcy/yOre Recovered: 15.1 Million bcy/yOre Density: 88 Dry pcf
Process Million MillionStream Tons/Year Ton-Miles
Mud Balls 0.179 0.045Clays 4.844 7.266Tailings 9.804 26.961Pebble 0.000 0.000Concentrate 3.113 0.000Ore 17.940 53.820
Phosphate Rock Production Cost
COST ELEMENT $/PRODUCT TON
1 Electricity_____________________________ 3.982 Reagents________________________________ 1.683 Severance Tax___________________________ 1.624 Land Reclamation________________________ 0.765 Dam Building____________________________ 0.786 Operating Labor_________________________ 2.077 Contract Maintenance____________________ 0.638 Maintenance Labor_______________________ 1.349 Maintenance Materials___________________ 2.4710 Operating Supplies______________________ 0.6511 Operating Services______________________ 0.7712 Autos & Trucks__________________________ 0.1013 Insurance_______________________________ 0.0614 Taxes___________________________________ 0.5215 Mine Overhead___________________________ 1.0216 Other___________________________________ 0.05
17 Subtotal Cost 18.51
18 Depreciation____________________________ 1.4319 Depletion & Royalties___________________ 0.77
20 Production Cost FOB Mine 20.70

A-5
Identification Code: Pebble Case (unsized feed)Data File Dated: 26-Feb-02
PRODUCTION DATA & RATESOperating Schedule: 7 Days per WeekNumber of Draglines: 3 OperatingArea Mined: 528 Acres per YearVolume Stripped: 21.1 Million bcy/yOre Recovered: 15.1 Million bcy/yOre Density: 88 Dry pcf
Process Million MillionStream Tons/Year Ton-Miles
Mud Balls 0.179 0.045Clays 4.844 7.266Tailings 9.150 25.163Pebble 1.973 0.000Concentrate 1.793 0.000Ore 17.940 53.820
Phosphate Rock Production Cost
COST ELEMENT $/PRODUCT TON
1 Electricity_____________________________ 3.112 Reagents________________________________ 1.083 Severance Tax___________________________ 1.624 Land Reclamation________________________ 0.635 Dam Building____________________________ 0.646 Operating Labor_________________________ 1.717 Contract Maintenance____________________ 0.528 Maintenance Labor_______________________ 1.119 Maintenance Materials___________________ 1.9510 Operating Supplies______________________ 0.5311 Operating Services______________________ 0.6312 Autos & Trucks__________________________ 0.1013 Insurance_______________________________ 0.0514 Taxes___________________________________ 0.4315 Mine Overhead___________________________ 0.8416 Other___________________________________ 0.04
17 Subtotal Cost 15.00
18 Depreciation____________________________ 1.1819 Depletion & Royalties___________________ 0.77
20 Production Cost FOB Mine 16.95

A-6
Identification Code: Pebble Case (Base)Data File Dated: 26-Feb-02
PRODUCTION DATA & RATESOperating Schedule: 7 Days per WeekNumber of Draglines: 3 OperatingArea Mined: 528 Acres per YearVolume Stripped: 21.1 Million bcy/yOre Recovered: 15.1 Million bcy/yOre Density: 88 Dry pcf
Process Million MillionStream Tons/Year Ton-Miles
Mud Balls 0.179 0.045Clays 4.844 7.266Tailings 8.964 24.651Pebble 1.973 0.000Concentrate 1.979 0.000Ore 17.940 53.820
Phosphate Rock Production Cost
COST ELEMENT $/PRODUCT TON
1 Electricity_____________________________ 2.952 Reagents________________________________ 1.053 Severance Tax___________________________ 1.624 Land Reclamation________________________ 0.605 Dam Building____________________________ 0.616 Operating Labor_________________________ 1.637 Contract Maintenance____________________ 0.498 Maintenance Labor_______________________ 1.069 Maintenance Materials___________________ 1.8710 Operating Supplies______________________ 0.5011 Operating Services______________________ 0.6012 Autos & Trucks__________________________ 0.1013 Insurance_______________________________ 0.0514 Taxes___________________________________ 0.4115 Mine Overhead___________________________ 0.8016 Other___________________________________ 0.04
17 Subtotal Cost 14.39
18 Depreciation____________________________ 1.1319 Depletion & Royalties___________________ 0.77
20 Production Cost FOB Mine 16.29

A-7
Identification Code: Pebble Case (Hydraflot)Data File Dated: 27-Feb-02
PRODUCTION DATA & RATESOperating Schedule: 7 Days per WeekNumber of Draglines: 3 OperatingArea Mined: 528 Acres per YearVolume Stripped: 21.1 Million bcy/yOre Recovered: 15.1 Million bcy/yOre Density: 88 Dry pcf
Process Million MillionStream Tons/Year Ton-Miles
Mud Balls 0.179 0.045Clays 4.844 7.266Tailings 8.709 23.950Pebble 1.973 0.000Concentrate 2.234 0.000Ore 17.940 53.820
Phosphate Rock Production Cost
COST ELEMENT $/PRODUCT TON
1 Electricity_____________________________ 2.772 Reagents________________________________ 1.013 Severance Tax___________________________ 1.624 Land Reclamation________________________ 0.565 Dam Building____________________________ 0.586 Operating Labor_________________________ 1.537 Contract Maintenance____________________ 0.468 Maintenance Labor_______________________ 0.999 Maintenance Materials___________________ 1.7610 Operating Supplies______________________ 0.4711 Operating Services______________________ 0.5612 Autos & Trucks__________________________ 0.1013 Insurance_______________________________ 0.0414 Taxes___________________________________ 0.3915 Mine Overhead___________________________ 0.7516 Other___________________________________ 0.04
17 Subtotal Cost 13.6518 Depreciation____________________________ 1.0619 Depletion & Royalties___________________ 0.77
20 Production Cost FOB Mine 15.47
APPENDIX B
JACOBS ENGINEERING ON-SITE TEST NOTES
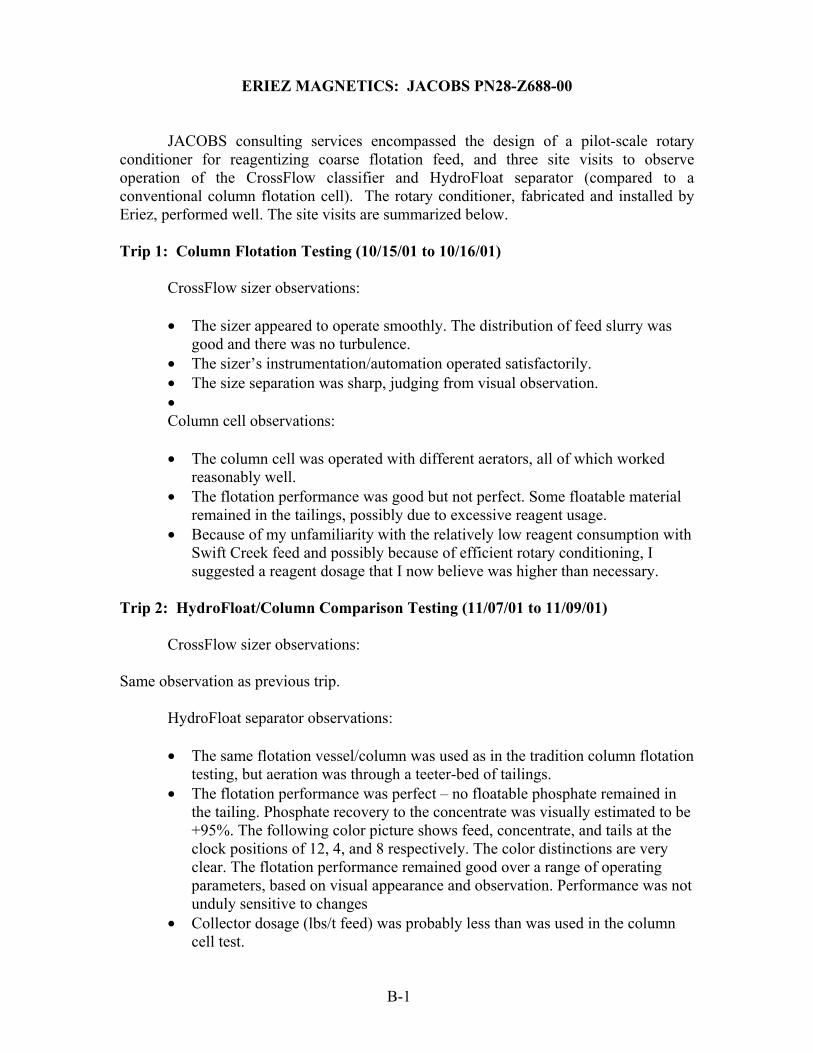
B- 1
ERIEZ MAGNETICS: JACOBS PN28-Z688-00
JACOBS consulting services encompassed the design of a pilot-scale rotary conditioner for reagentizing coarse flotation feed, and three site visits to observe operation of the CrossFlow classifier and HydroFloat separator (compared to a conventional column flotation cell). The rotary conditioner, fabricated and installed by Eriez, performed well. The site visits are summarized below. Trip 1: Column Flotation Testing (10/15/01 to 10/16/01) CrossFlow sizer observations:
• The sizer appeared to operate smoothly. The distribution of feed slurry was good and there was no turbulence.
• The sizer’s instrumentation/automation operated satisfactorily. • The size separation was sharp, judging from visual observation. •
Column cell observations:
• The column cell was operated with different aerators, all of which worked reasonably well.
• The flotation performance was good but not perfect. Some floatable material remained in the tailings, possibly due to excessive reagent usage.
• Because of my unfamiliarity with the relatively low reagent consumption with Swift Creek feed and possibly because of efficient rotary conditioning, I suggested a reagent dosage that I now believe was higher than necessary.
Trip 2: HydroFloat/Column Comparison Testing (11/07/01 to 11/09/01) CrossFlow sizer observations: Same observation as previous trip. HydroFloat separator observations:
• The same flotation vessel/column was used as in the tradition column flotation testing, but aeration was through a teeter-bed of tailings.
• The flotation performance was perfect – no floatable phosphate remained in the tailing. Phosphate recovery to the concentrate was visually estimated to be +95%. The following color picture shows feed, concentrate, and tails at the clock positions of 12, 4, and 8 respectively. The color distinctions are very clear. The flotation performance remained good over a range of operating parameters, based on visual appearance and observation. Performance was not unduly sensitive to changes
• Collector dosage (lbs/t feed) was probably less than was used in the column cell test.
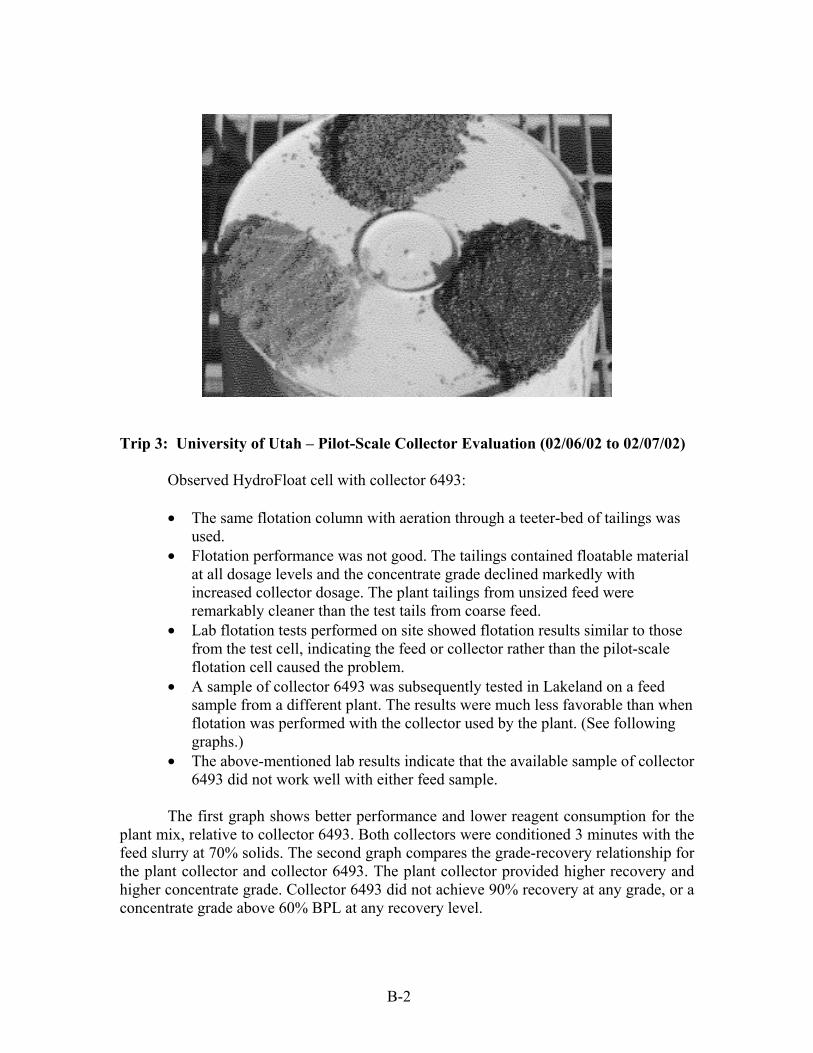
B- 2
Trip 3: University of Utah – Pilot-Scale Collector Evaluation (02/06/02 to 02/07/02) Observed HydroFloat cell with collector 6493:
• The same flotation column with aeration through a teeter-bed of tailings was used.
• Flotation performance was not good. The tailings contained floatable material at all dosage levels and the concentrate grade declined markedly with increased collector dosage. The plant tailings from unsized feed were remarkably cleaner than the test tails from coarse feed.
• Lab flotation tests performed on site showed flotation results similar to those from the test cell, indicating the feed or collector rather than the pilot-scale flotation cell caused the problem.
• A sample of collector 6493 was subsequently tested in Lakeland on a feed sample from a different plant. The results were much less favorable than when flotation was performed with the collector used by the plant. (See following graphs.)
• The above-mentioned lab results indicate that the available sample of collector 6493 did not work well with either feed sample.
The first graph shows better performance and lower reagent consumption for the
plant mix, relative to collector 6493. Both collectors were conditioned 3 minutes with the feed slurry at 70% solids. The second graph compares the grade-recovery relationship for the plant collector and collector 6493. The plant collector provided higher recovery and higher concentrate grade. Collector 6493 did not achieve 90% recovery at any grade, or a concentrate grade above 60% BPL at any recovery level.
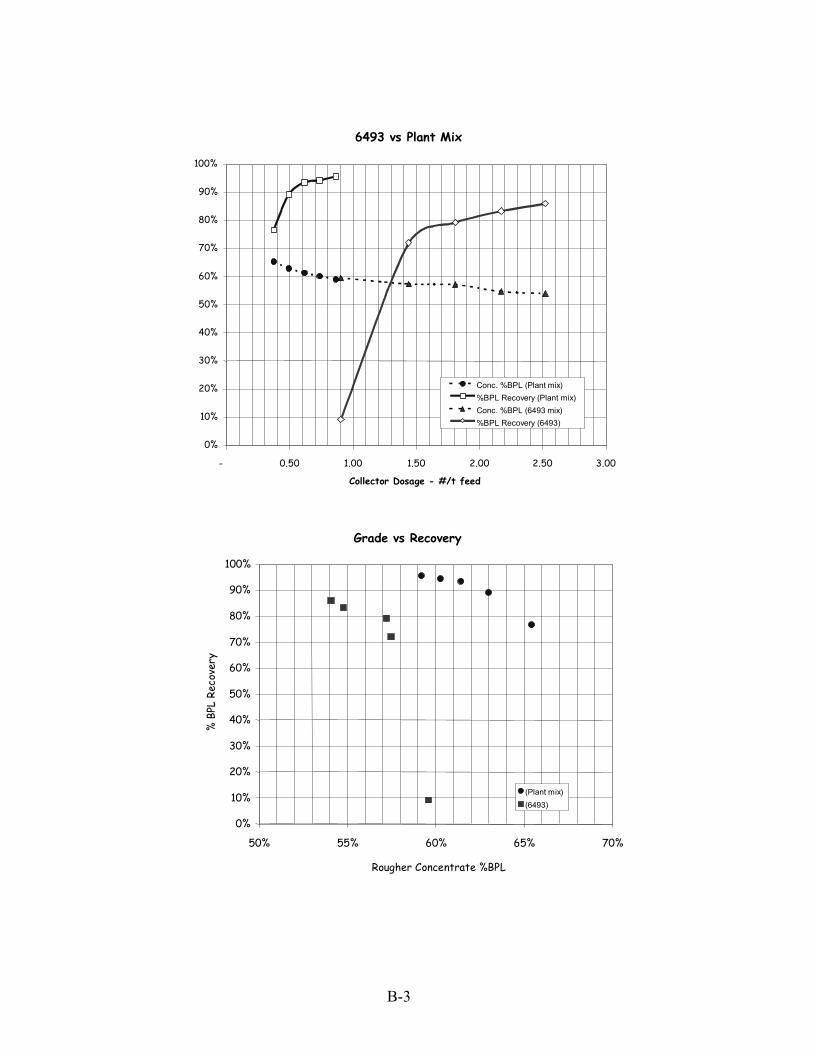
B- 3
6493 vs Plant Mix
0%
10%
20%
30%
40%
50%
60%
70%
80%
90%
100%
- 0.50 1.00 1.50 2.00 2.50 3.00
Collector Dosage - #/t feed
Conc. %BPL (Plant mix)%BPL Recovery (Plant mix)Conc. %BPL (6493 mix)%BPL Recovery (6493)
Grade vs Recovery
0%
10%
20%
30%
40%
50%
60%
70%
80%
90%
100%
50% 55% 60% 65% 70%
Rougher Concentrate %BPL
% B
PL R
ecov
ery
(Plant mix)(6493)