Improving ROI by Leveraging ArcGIS Server for Data...
26
Improving ROI by Leveraging ArcGIS Server for Data Analytics Subrahmanyam(Subbu) Pendyala Anil Jayavarapu June 29, 2016
Transcript of Improving ROI by Leveraging ArcGIS Server for Data...

Improving ROI by Leveraging
ArcGIS Server for Data Analytics
Subrahmanyam(Subbu) Pendyala
Anil Jayavarapu
June 29, 2016
2
Agenda
About Pepco Holdings
GIS at Pepco Holdings
Analytics
• Business Needs
• Current Approach: Mixed Bag
• New Approach: Leveraging “ArcGIS for Server” for Analytics
3
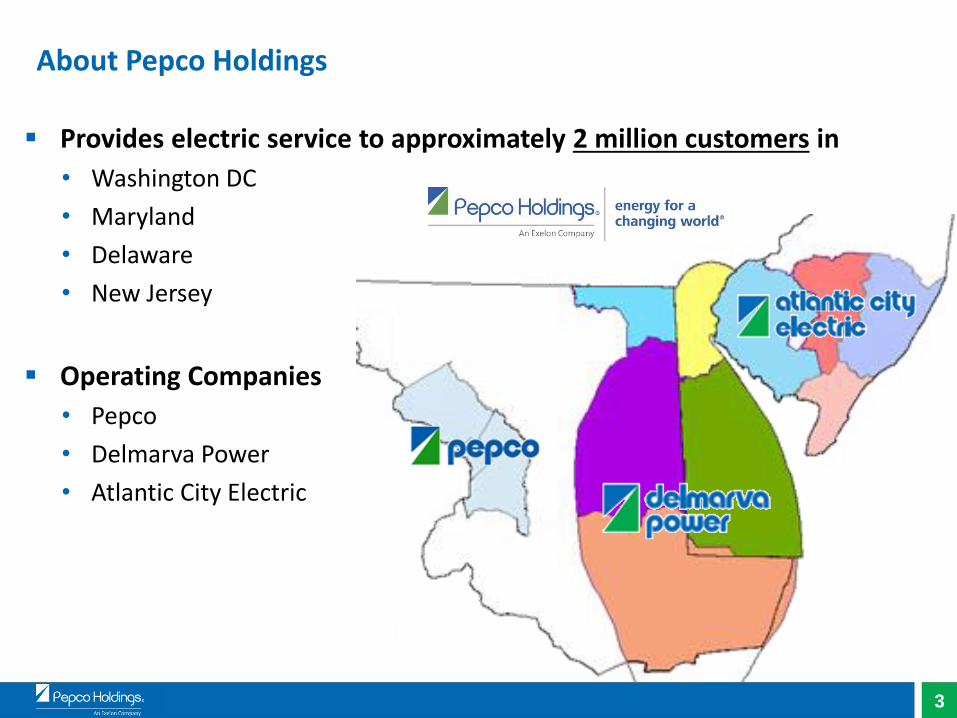
About Pepco Holdings
Provides electric service to approximately 2 million customers in
• Washington DC
• Maryland
• Delaware
• New Jersey
Operating Companies
• Pepco
• Delmarva Power
• Atlantic City Electric
4
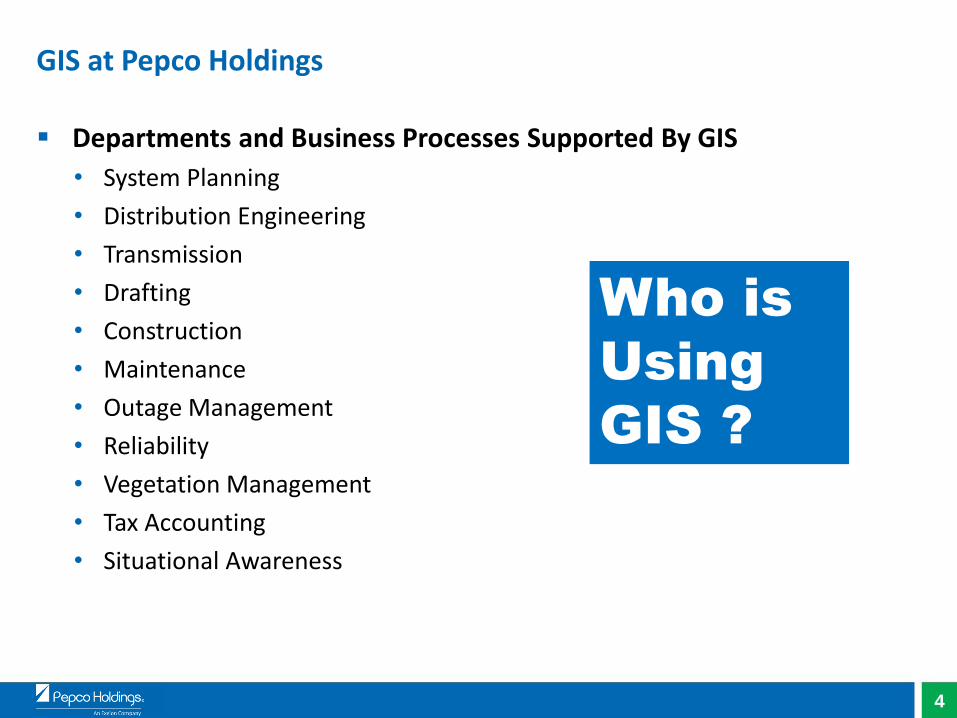
GIS at Pepco Holdings
Departments and Business Processes Supported By GIS
• System Planning
• Distribution Engineering
• Transmission
• Drafting
• Construction
• Maintenance
• Outage Management
• Reliability
• Vegetation Management
• Tax Accounting
• Situational Awareness
Who is
Using
GIS ?
5
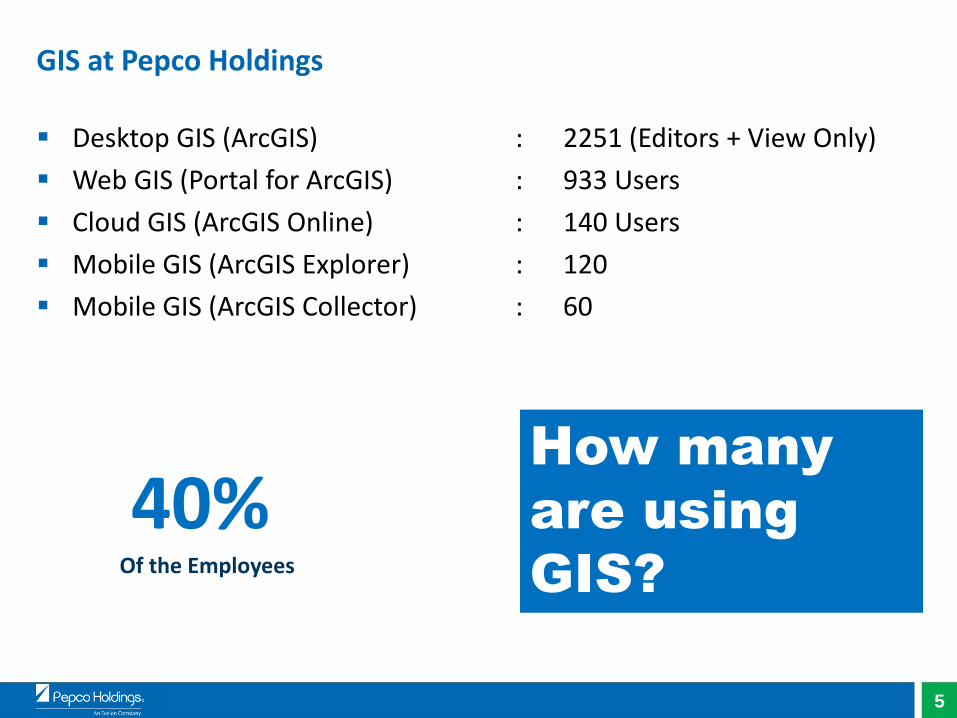
GIS at Pepco Holdings
Desktop GIS (ArcGIS) : 2251 (Editors + View Only)
Web GIS (Portal for ArcGIS) : 933 Users
Cloud GIS (ArcGIS Online) : 140 Users
Mobile GIS (ArcGIS Explorer) : 120
Mobile GIS (ArcGIS Collector) : 60
How many
are using
GIS?
40% Of the Employees
6
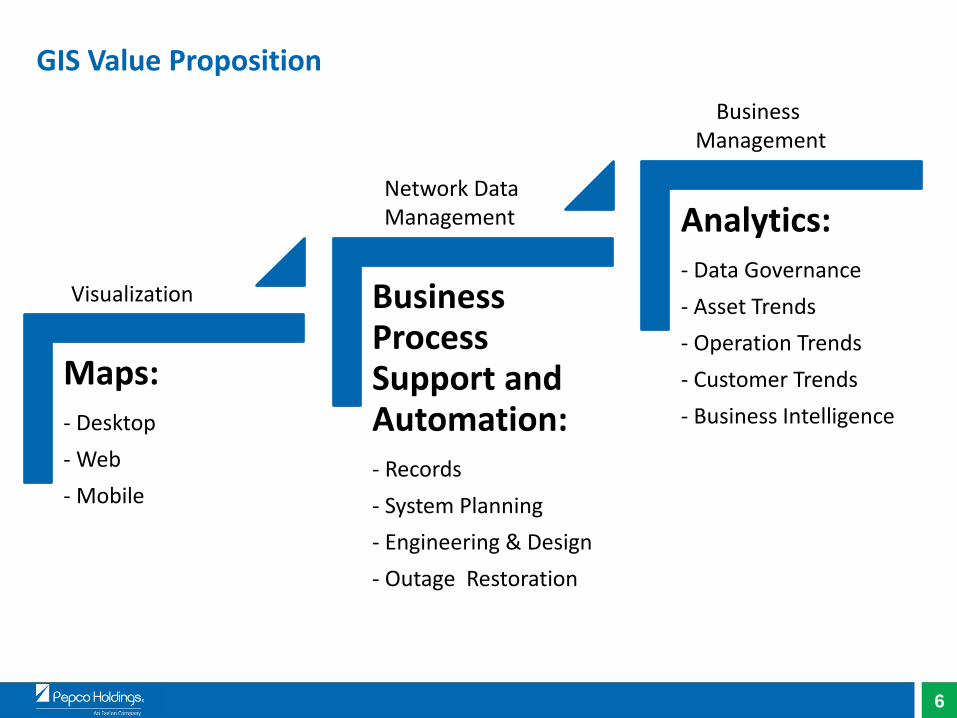
GIS Value Proposition
Maps: - Desktop
- Web
- Mobile
Business Process Support and Automation: - Records
- System Planning
- Engineering & Design
- Outage Restoration
Analytics: - Data Governance
- Asset Trends
- Operation Trends
- Customer Trends
- Business Intelligence
Visualization
Network Data Management
Business Management
7
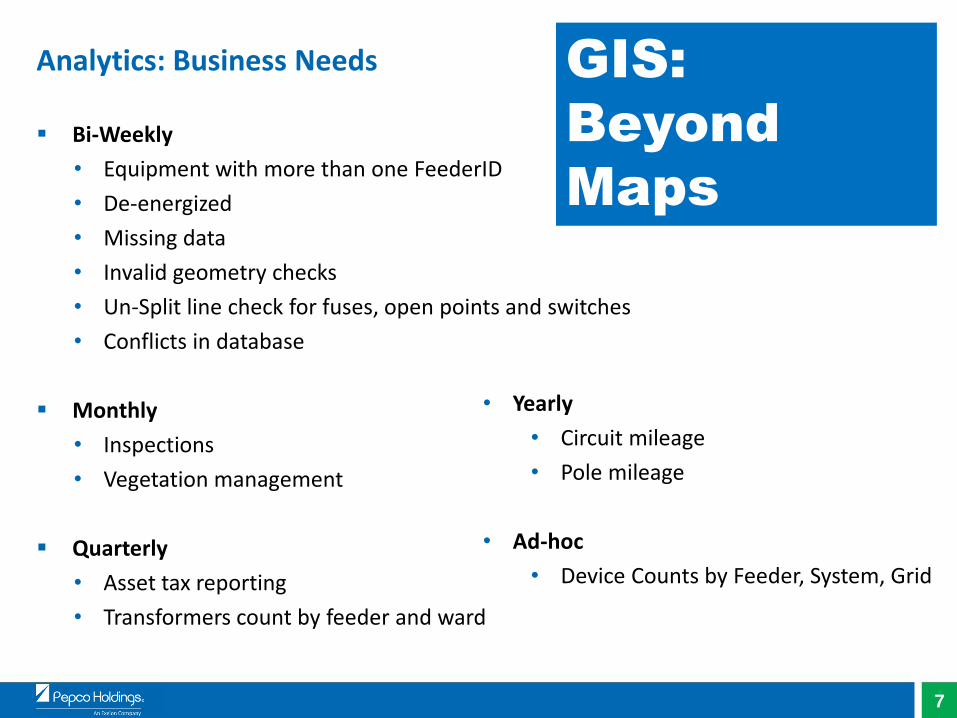
Analytics: Business Needs
Bi-Weekly
• Equipment with more than one FeederID
• De-energized
• Missing data
• Invalid geometry checks
• Un-Split line check for fuses, open points and switches
• Conflicts in database
Monthly
• Inspections
• Vegetation management
Quarterly
• Asset tax reporting
• Transformers count by feeder and ward
GIS:
Beyond
Maps
• Yearly
• Circuit mileage
• Pole mileage
• Ad-hoc
• Device Counts by Feeder, System, Grid
8
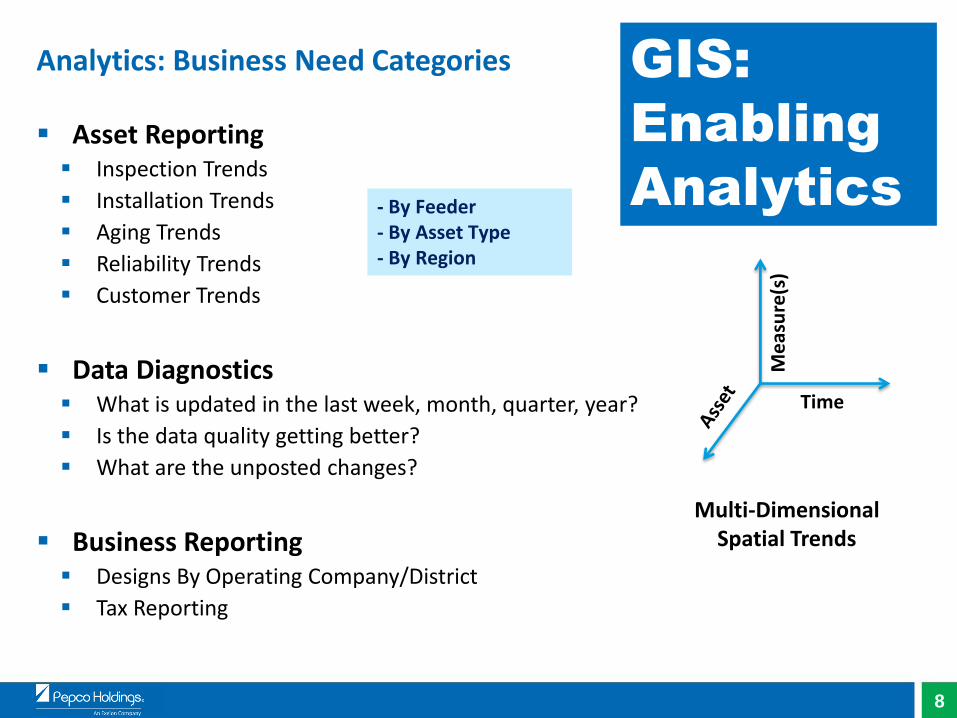
Analytics: Business Need Categories
Asset Reporting Inspection Trends
Installation Trends
Aging Trends
Reliability Trends
Customer Trends
Data Diagnostics What is updated in the last week, month, quarter, year?
Is the data quality getting better?
What are the unposted changes?
Business Reporting Designs By Operating Company/District
Tax Reporting
- By Feeder - By Asset Type - By Region
Time
Me
asu
re(s
)
Multi-Dimensional Spatial Trends
GIS:
Enabling
Analytics
9
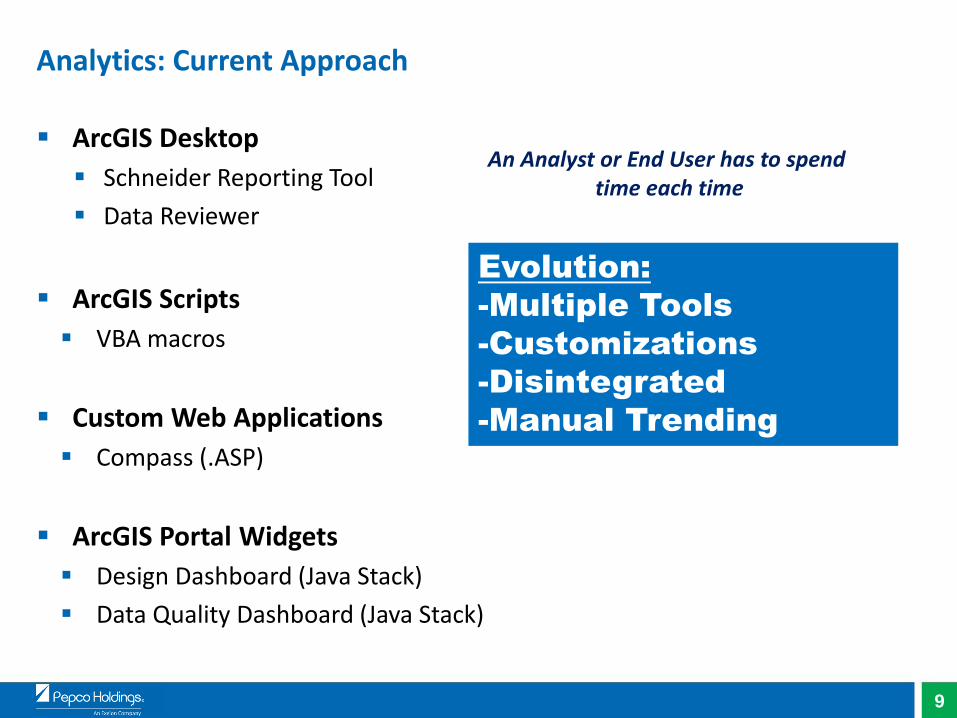
Analytics: Current Approach
ArcGIS Desktop
Schneider Reporting Tool
Data Reviewer
ArcGIS Scripts
VBA macros
Custom Web Applications
Compass (.ASP)
ArcGIS Portal Widgets
Design Dashboard (Java Stack)
Data Quality Dashboard (Java Stack)
Evolution:
-Multiple Tools
-Customizations
-Disintegrated
-Manual Trending
An Analyst or End User has to spend time each time
10
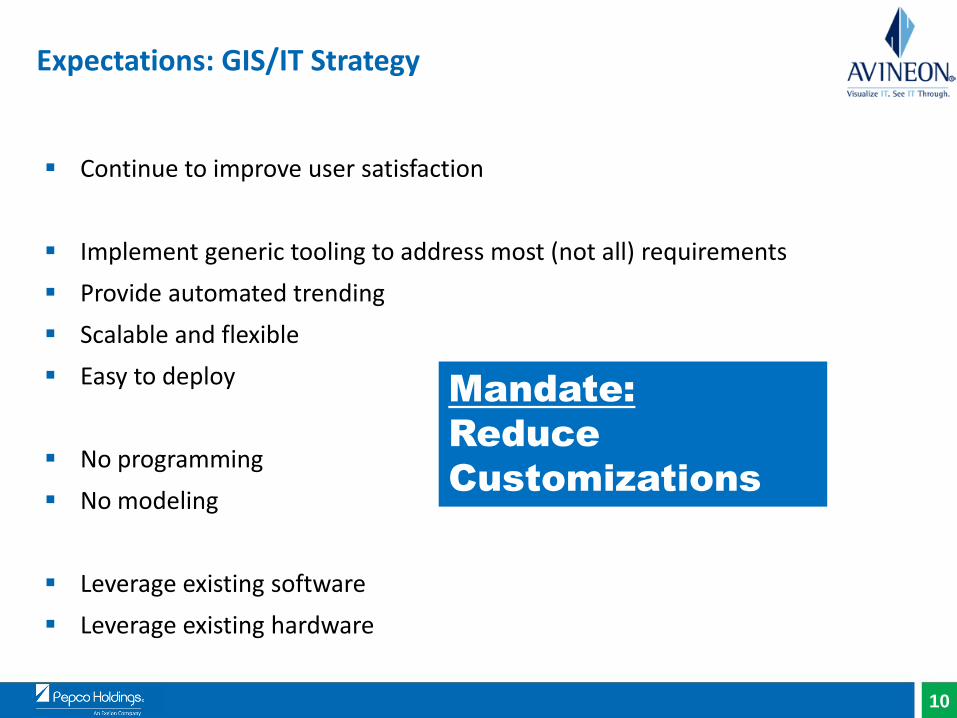
Expectations: GIS/IT Strategy
Continue to improve user satisfaction
Implement generic tooling to address most (not all) requirements
Provide automated trending
Scalable and flexible
Easy to deploy
No programming
No modeling
Leverage existing software
Leverage existing hardware
Mandate:
Reduce
Customizations
11
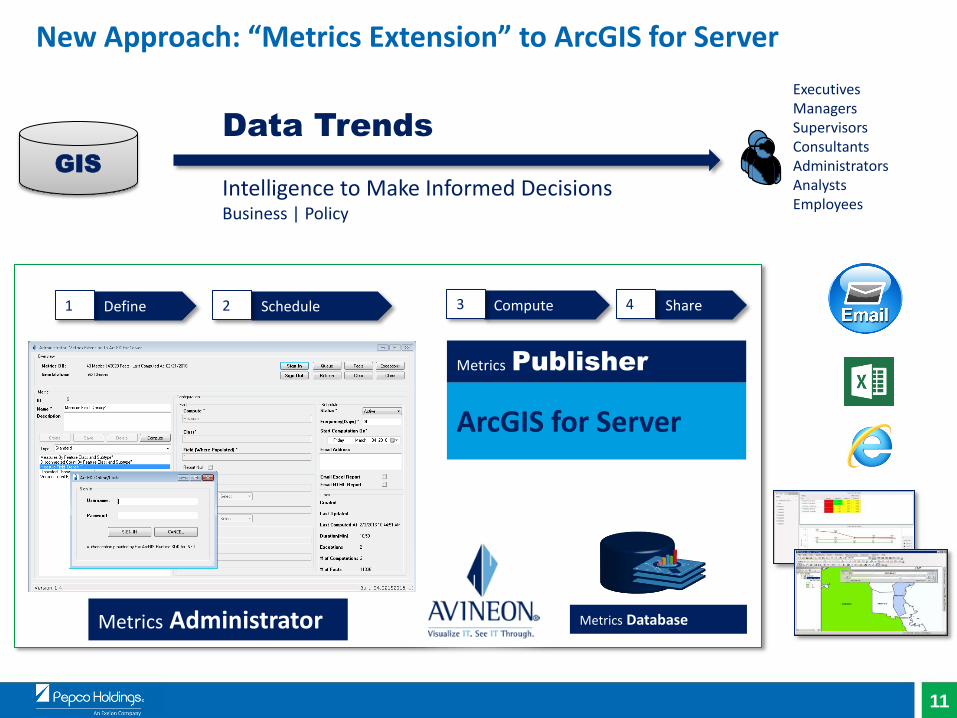
New Approach: “Metrics Extension” to ArcGIS for Server
GIS
ArcGIS for Server
Define Schedule Compute Share
Data Trends
Intelligence to Make Informed Decisions Business | Policy
Executives Managers Supervisors Consultants Administrators Analysts Employees
Metrics Administrator
Metrics Publisher
1 2 3 4
Metrics Database
12 www.avineon.com
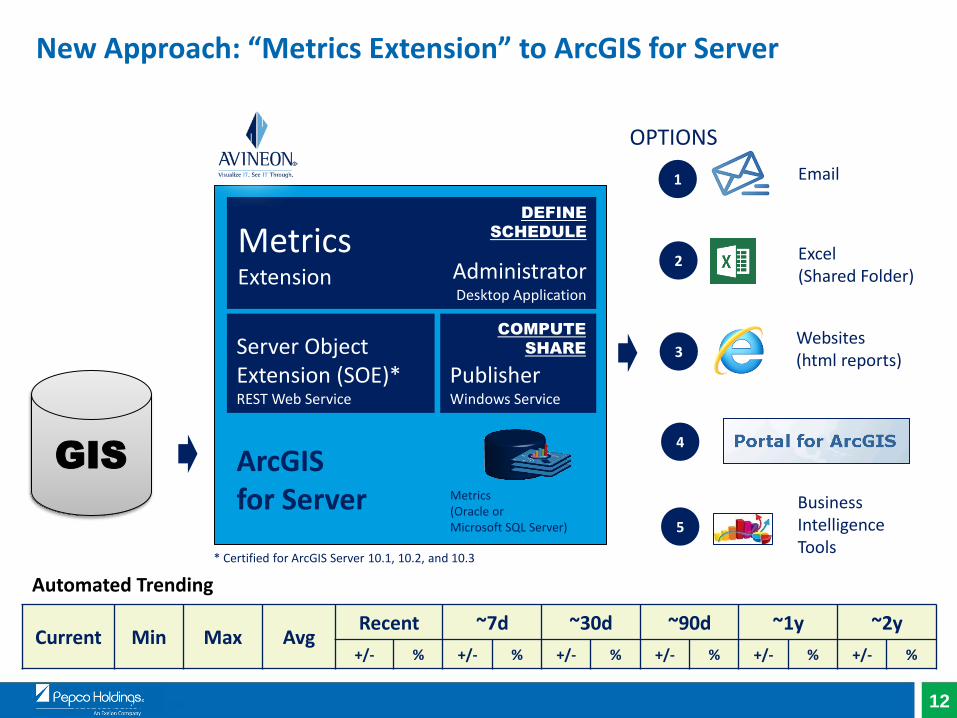
GIS ArcGIS for Server
Administrator Desktop Application
Publisher Windows Service
Server Object Extension (SOE)* REST Web Service
COMPUTE
SHARE
DEFINE
SCHEDULE Metrics Extension
* Certified for ArcGIS Server 10.1, 10.2, and 10.3
Websites (html reports)
Excel (Shared Folder)
Business Intelligence Tools
1
2
3
4
5
Metrics (Oracle or Microsoft SQL Server)
Current Min Max Avg Recent ~7d ~30d ~90d ~1y ~2y
+/- % +/- % +/- % +/- % +/- % +/- %
OPTIONS
New Approach: “Metrics Extension” to ArcGIS for Server
Automated Trending
13
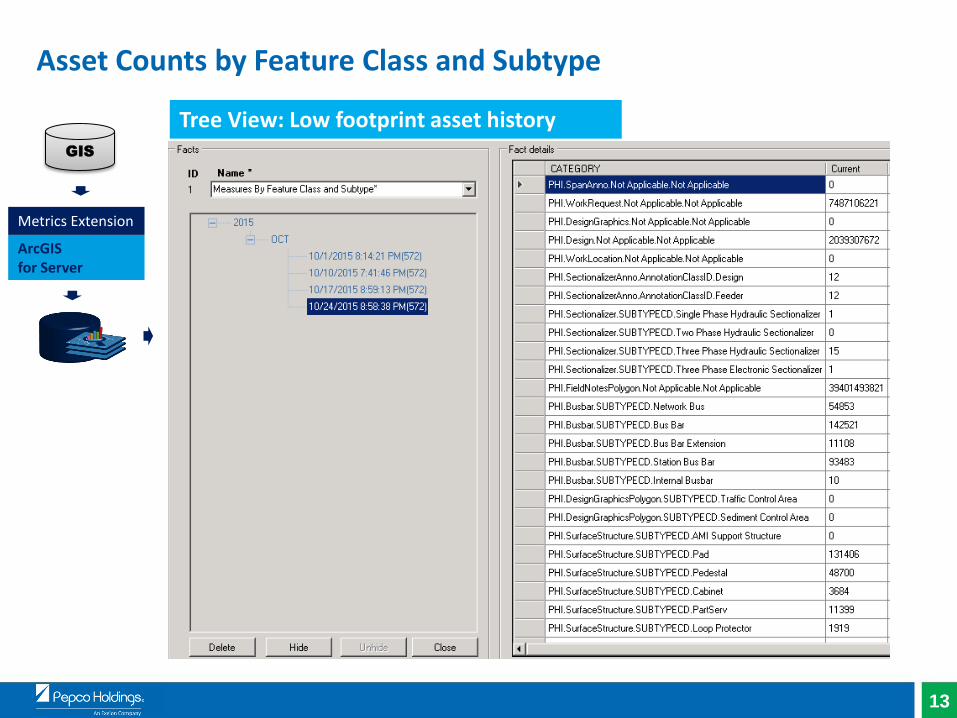
Asset Counts by Feature Class and Subtype
ArcGIS for Server
Metrics Extension
GIS
Tree View: Low footprint asset history
14
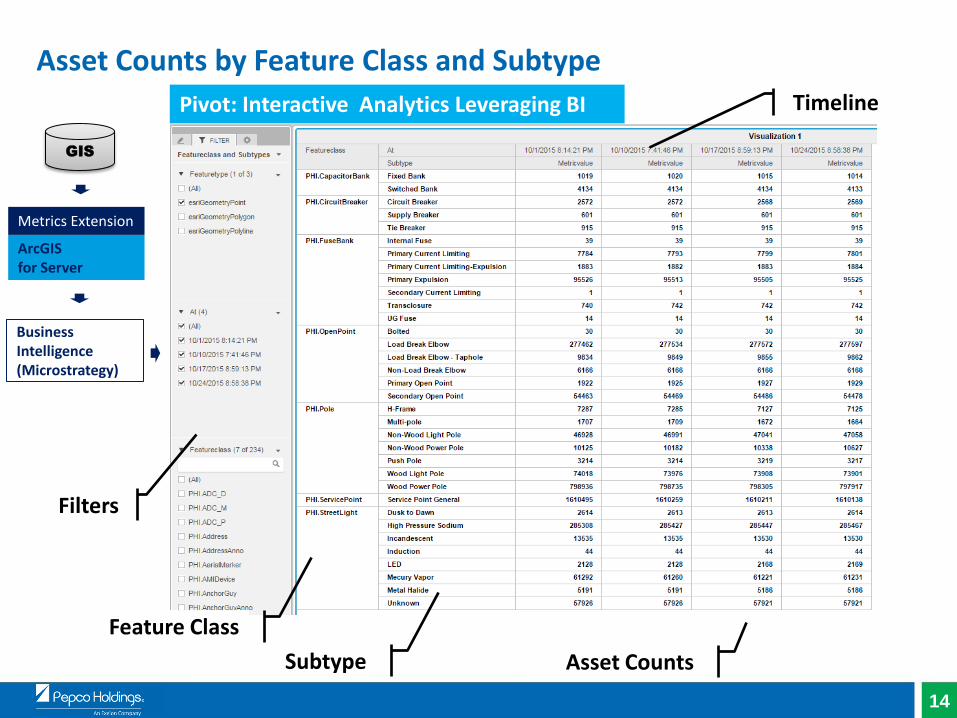
Asset Counts by Feature Class and Subtype
ArcGIS for Server
Metrics Extension
GIS
Pivot: Interactive Analytics Leveraging BI
Feature Class
Subtype
Timeline
Asset Counts
Filters
Business Intelligence (Microstrategy)
15
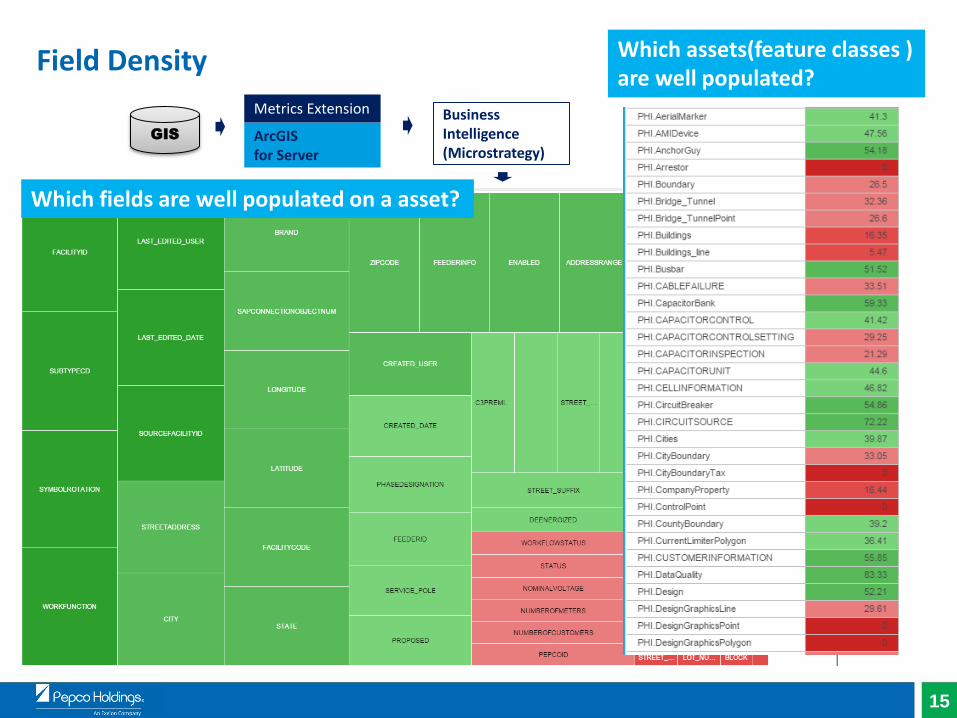
Field Density
Which fields are well populated on a asset?
Which assets(feature classes ) are well populated?
ArcGIS for Server
Metrics Extension
GIS
Business Intelligence (Microstrategy)
16
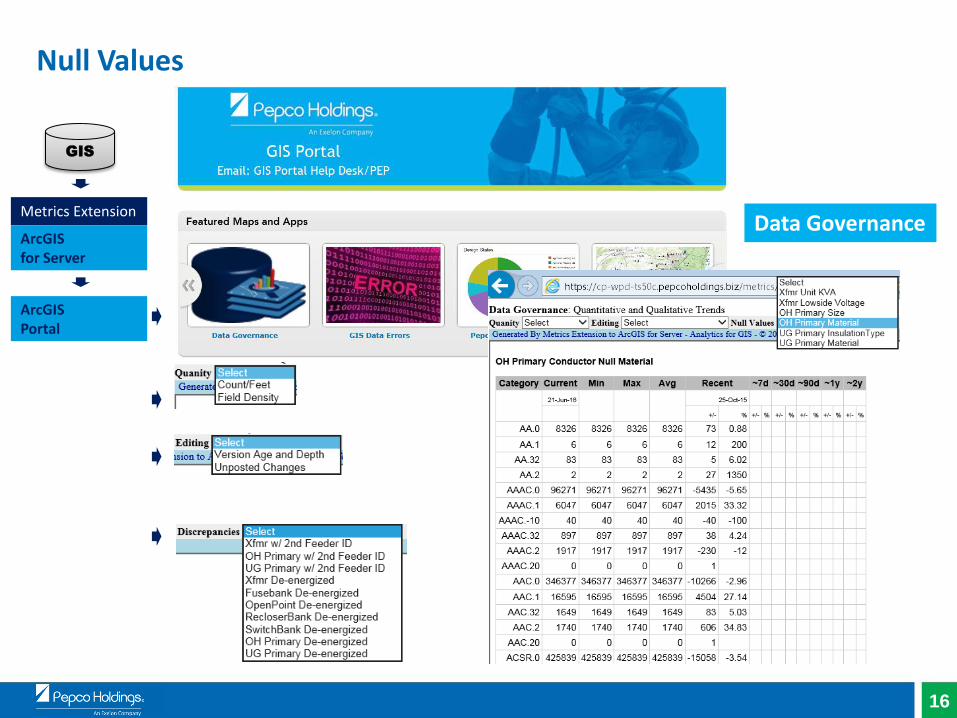
Null Values
ArcGIS for Server
Metrics Extension
GIS
ArcGIS Portal
Data Governance
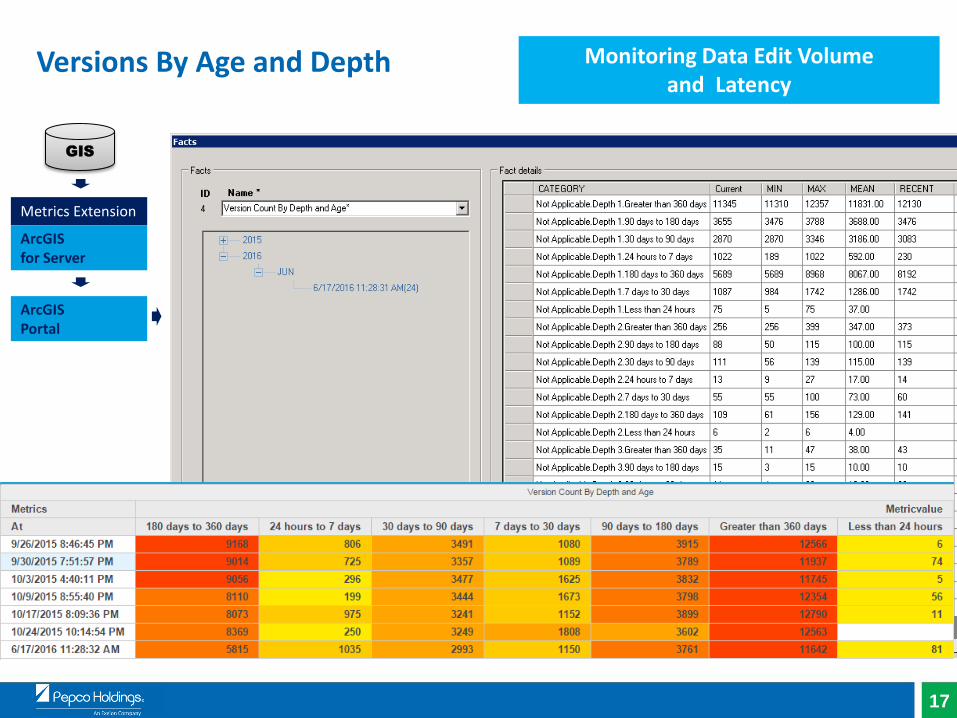
17
Versions By Age and Depth
ArcGIS for Server
Metrics Extension
GIS
ArcGIS Portal
Monitoring Data Edit Volume and Latency
18
ArcGIS for Server
Metrics Extension
GIS
ArcGIS Portal
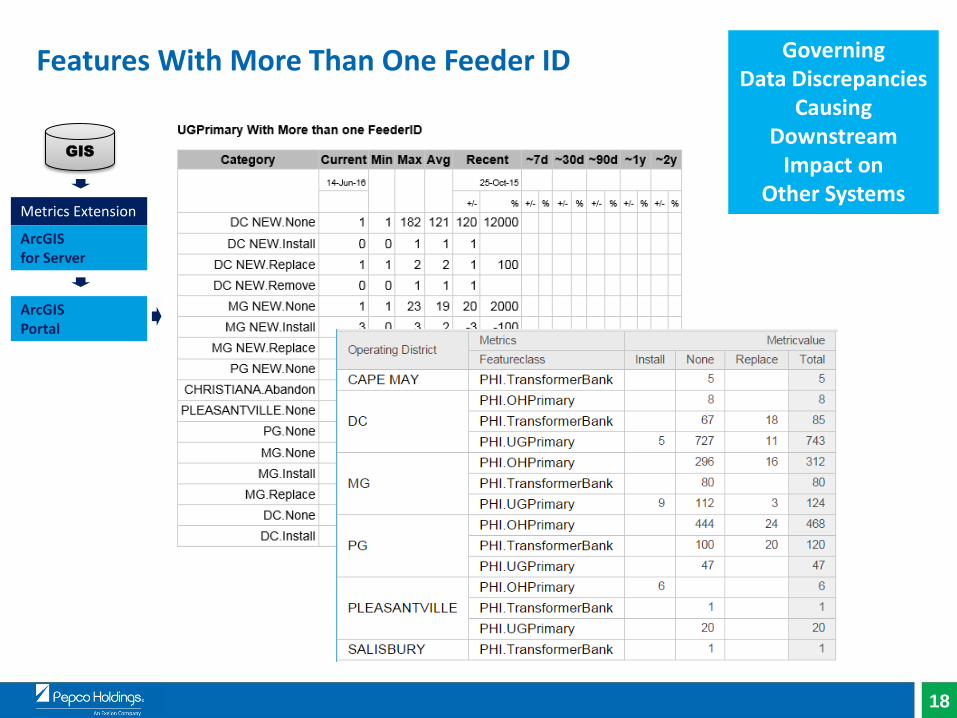
Features With More Than One Feeder ID Governing Data Discrepancies
Causing Downstream
Impact on Other Systems
19
ArcGIS for Server
Metrics Extension
GIS
ArcGIS Portal
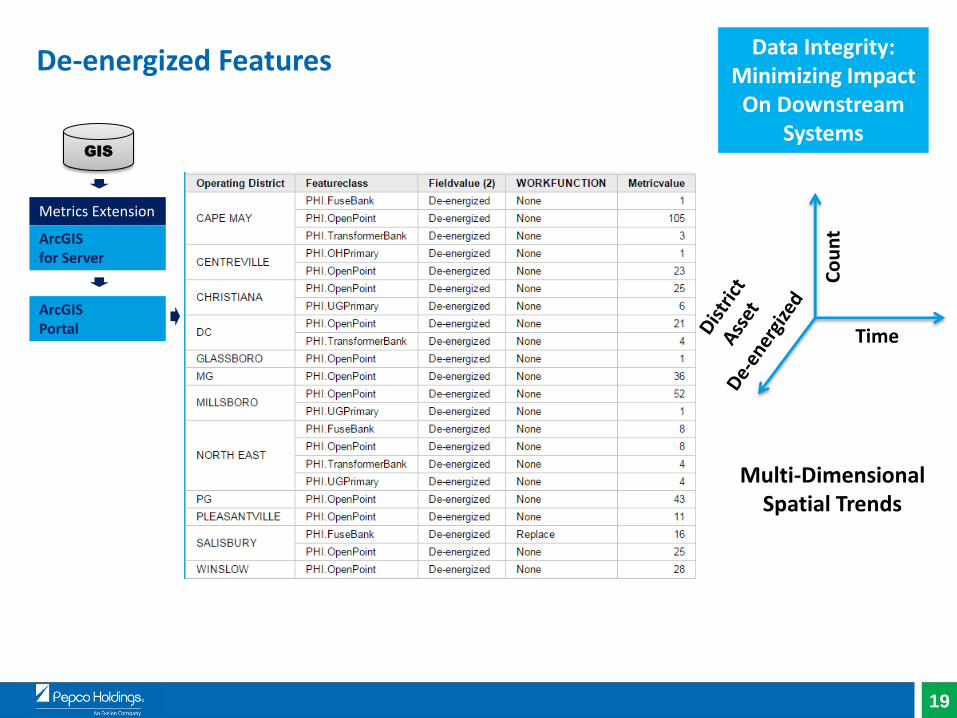
De-energized Features Data Integrity:
Minimizing Impact On Downstream
Systems
Time
Co
un
t
Multi-Dimensional Spatial Trends
20
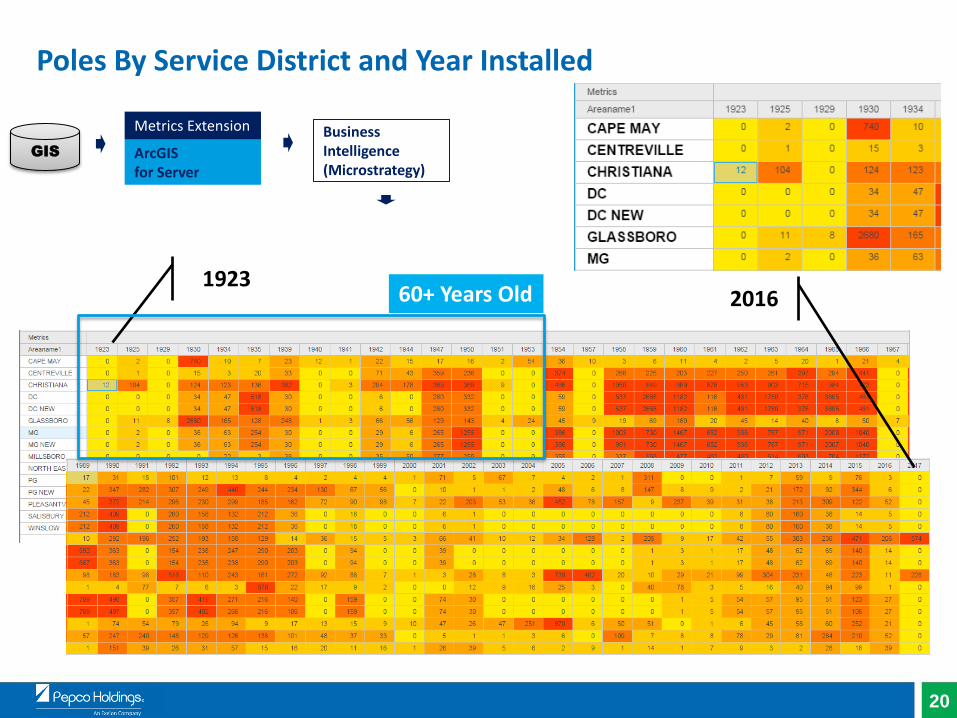
Poles By Service District and Year Installed
1923 2016
60+ Years Old
ArcGIS for Server
Metrics Extension
GIS
Business Intelligence (Microstrategy)
21
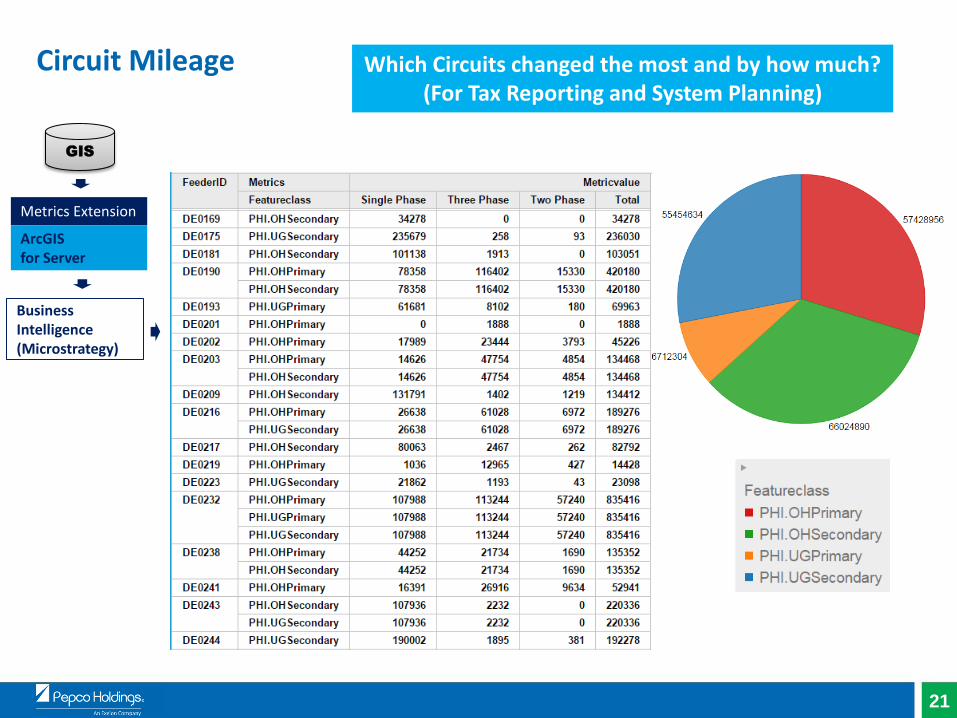
Circuit Mileage
ArcGIS for Server
Metrics Extension
GIS
Which Circuits changed the most and by how much? (For Tax Reporting and System Planning)
Business Intelligence (Microstrategy)
22
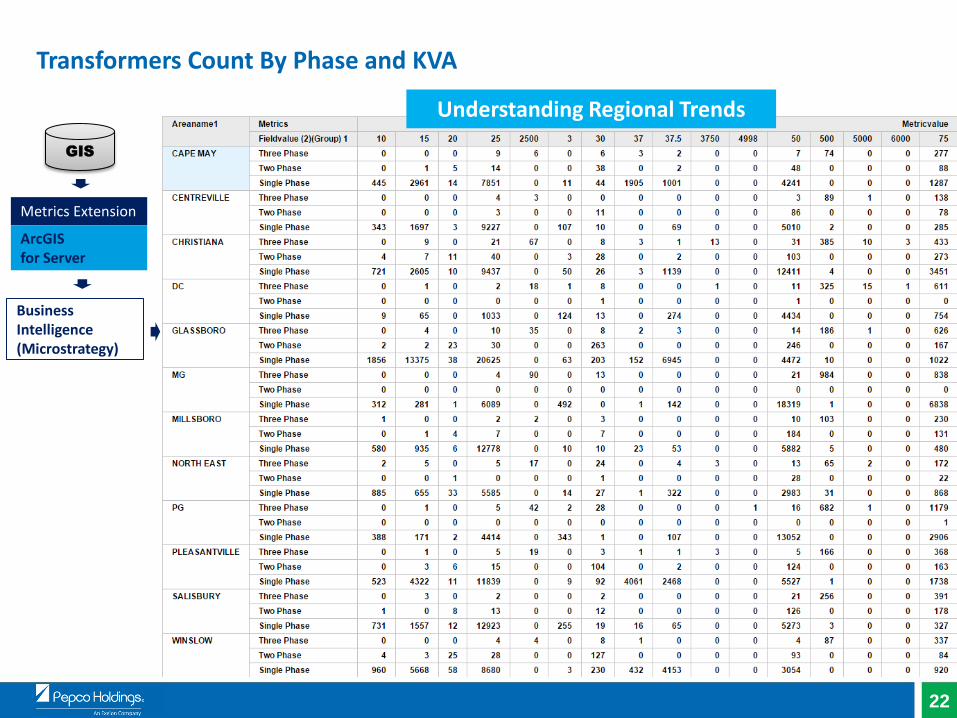
Transformers Count By Phase and KVA
ArcGIS for Server
Metrics Extension
GIS
Understanding Regional Trends
Business Intelligence (Microstrategy)
23
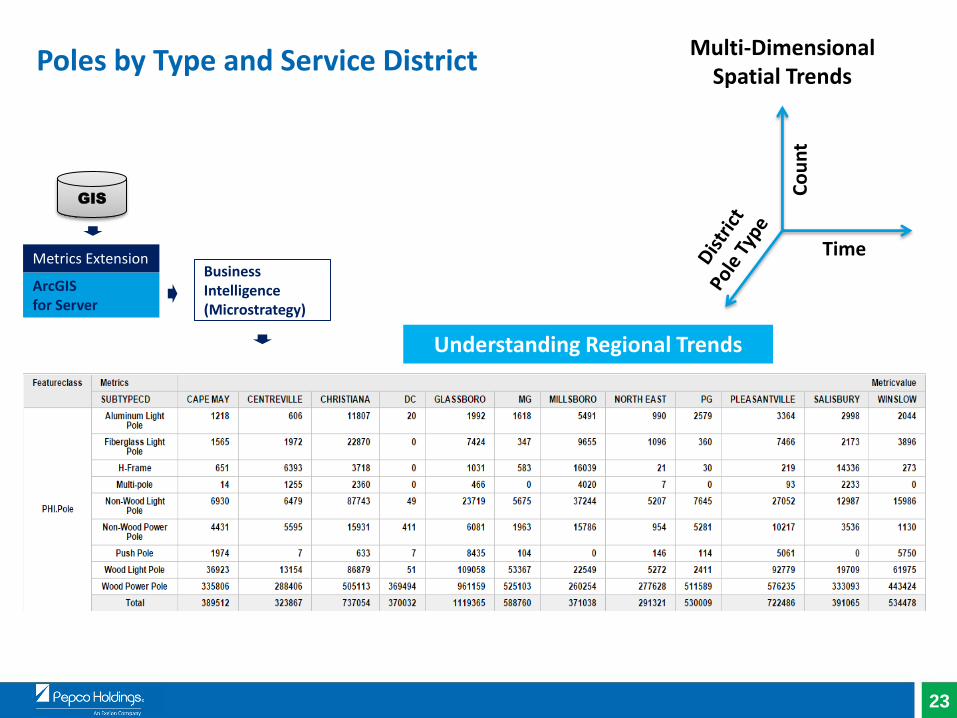
Poles by Type and Service District
ArcGIS for Server
Metrics Extension
GIS
Understanding Regional Trends
Business Intelligence (Microstrategy)
Time
Co
un
t
Multi-Dimensional Spatial Trends
24
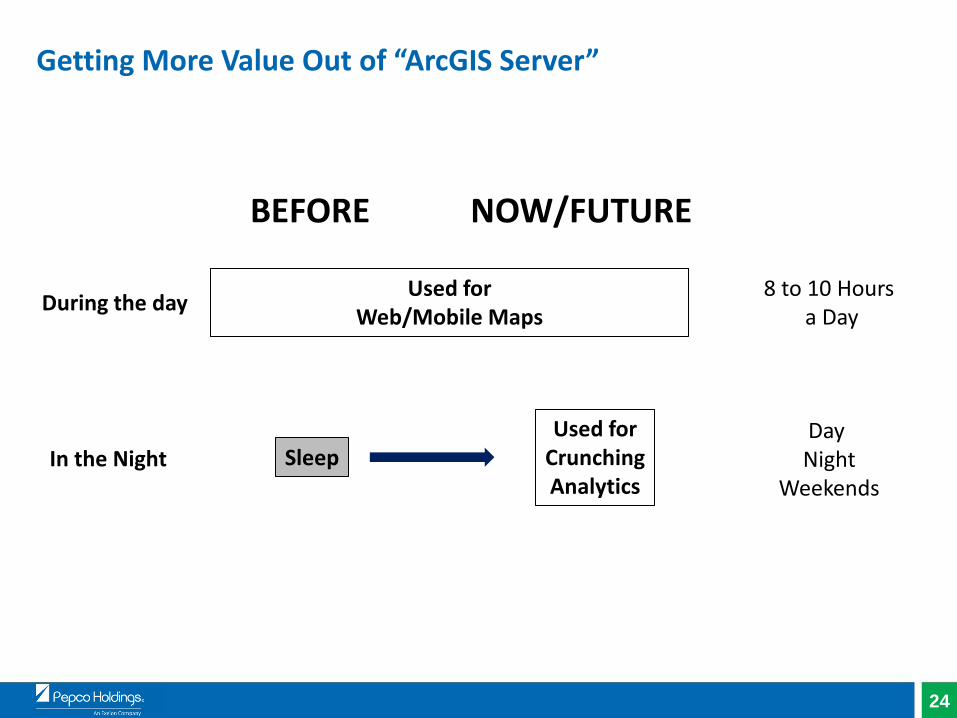
Getting More Value Out of “ArcGIS Server”
Used for Web/Mobile Maps
During the day
In the Night Sleep Used for
Crunching Analytics
BEFORE NOW/FUTURE
8 to 10 Hours a Day
Day Night
Weekends
25
Return on Investment (ROI): Metrics Extension to ArcGIS for Server
Implement automated process to define and share analytics • Asset reporting
• Data diagnostics
• Business reporting
Faster response time to end user requests
Exceed end user expectations by delivering trends periodically
Reduce customizations
Transition from a reactive to proactive posture

26
Questions?
Subrahmanyam(Subbu) Pendyala Sr. Analyst IT Pepco Holdings, Inc. [email protected]
Anil Jayavarapu Director, Software Solutions Avineon, Inc. [email protected]