IMPROVING VALIDITY IN WEB SURVEYS WITH HARD-TO-REACH TARGETS: ONLINE RDS METHODOLOGY
Improving government websites and surveys – Page 1
Improving Government Websites and Surveys With Usability Testing and User Experience Research
Jennifer Romano Bergstrom, Jonathan Strohl
Fors Marsh Group
1010 N Glebe Rd., Suite 510, Arlington, VA 22201
Introduction
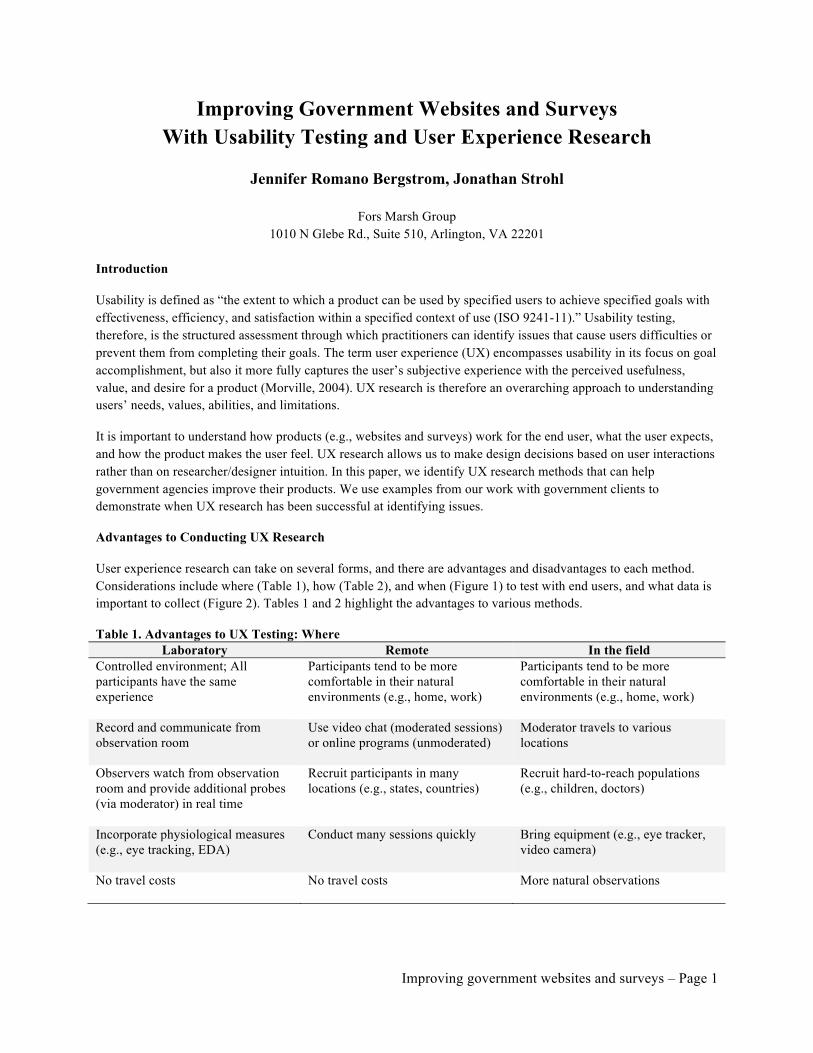
Usability is defined as “the extent to which a product can be used by specified users to achieve specified goals with effectiveness, efficiency, and satisfaction within a specified context of use (ISO 9241-11).” Usability testing, therefore, is the structured assessment through which practitioners can identify issues that cause users difficulties or prevent them from completing their goals. The term user experience (UX) encompasses usability in its focus on goal accomplishment, but also it more fully captures the user’s subjective experience with the perceived usefulness, value, and desire for a product (Morville, 2004). UX research is therefore an overarching approach to understanding users’ needs, values, abilities, and limitations.
It is important to understand how products (e.g., websites and surveys) work for the end user, what the user expects, and how the product makes the user feel. UX research allows us to make design decisions based on user interactions rather than on researcher/designer intuition. In this paper, we identify UX research methods that can help government agencies improve their products. We use examples from our work with government clients to demonstrate when UX research has been successful at identifying issues.
Advantages to Conducting UX Research
User experience research can take on several forms, and there are advantages and disadvantages to each method. Considerations include where (Table 1), how (Table 2), and when (Figure 1) to test with end users, and what data is important to collect (Figure 2). Tables 1 and 2 highlight the advantages to various methods.
Table 1. Advantages to UX Testing: Where Laboratory Remote In the field
Controlled environment; All participants have the same experience
Participants tend to be more comfortable in their natural environments (e.g., home, work)
Participants tend to be more comfortable in their natural environments (e.g., home, work)
Record and communicate from observation room
Use video chat (moderated sessions) or online programs (unmoderated)
Moderator travels to various locations
Observers watch from observation room and provide additional probes (via moderator) in real time
Recruit participants in many locations (e.g., states, countries)
Recruit hard-to-reach populations (e.g., children, doctors)
Incorporate physiological measures (e.g., eye tracking, EDA)
Conduct many sessions quickly Bring equipment (e.g., eye tracker, video camera)
No travel costs
No travel costs More natural observations
Improving government websites and surveys – Page 2
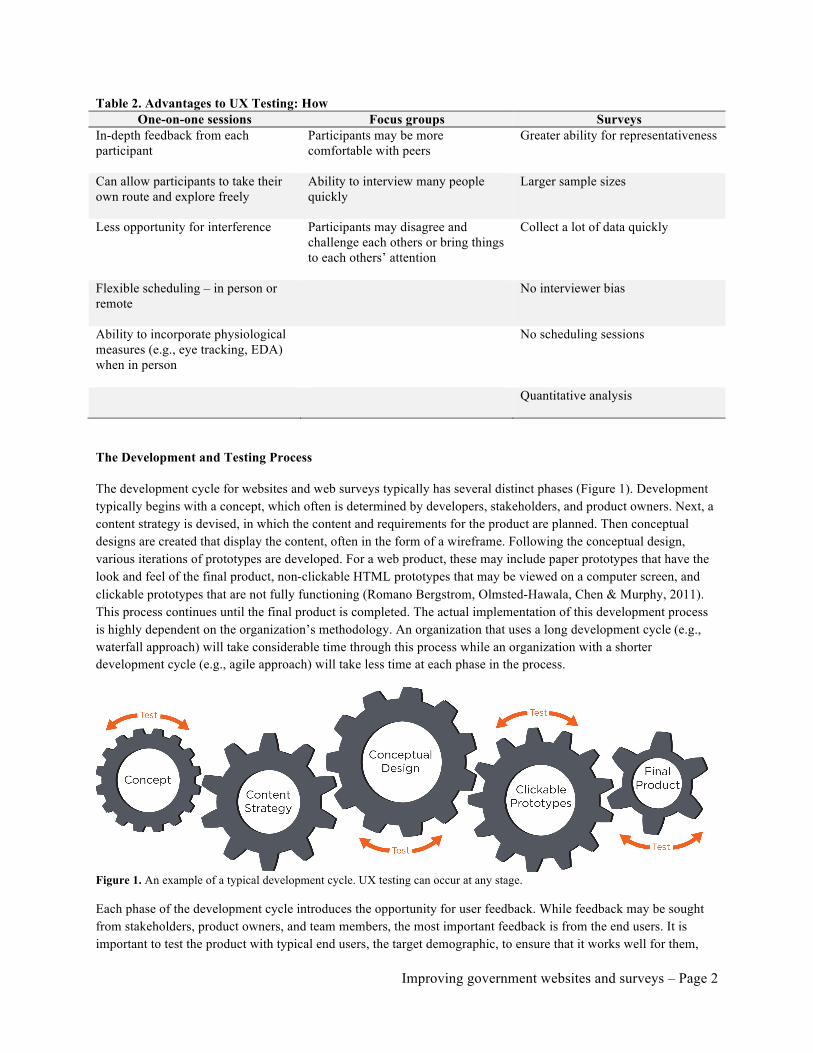
Table 2. Advantages to UX Testing: How One-on-one sessions Focus groups Surveys
In-depth feedback from each participant
Participants may be more comfortable with peers
Greater ability for representativeness
Can allow participants to take their own route and explore freely
Ability to interview many people quickly
Larger sample sizes
Less opportunity for interference
Participants may disagree and challenge each others or bring things to each others’ attention
Collect a lot of data quickly
Flexible scheduling – in person or remote
No interviewer bias
Ability to incorporate physiological measures (e.g., eye tracking, EDA) when in person
No scheduling sessions
Quantitative analysis
The Development and Testing Process
The development cycle for websites and web surveys typically has several distinct phases (Figure 1). Development typically begins with a concept, which often is determined by developers, stakeholders, and product owners. Next, a content strategy is devised, in which the content and requirements for the product are planned. Then conceptual designs are created that display the content, often in the form of a wireframe. Following the conceptual design, various iterations of prototypes are developed. For a web product, these may include paper prototypes that have the look and feel of the final product, non-clickable HTML prototypes that may be viewed on a computer screen, and clickable prototypes that are not fully functioning (Romano Bergstrom, Olmsted-Hawala, Chen & Murphy, 2011). This process continues until the final product is completed. The actual implementation of this development process is highly dependent on the organization’s methodology. An organization that uses a long development cycle (e.g., waterfall approach) will take considerable time through this process while an organization with a shorter development cycle (e.g., agile approach) will take less time at each phase in the process.
Figure 1. An example of a typical development cycle. UX testing can occur at any stage. Each phase of the development cycle introduces the opportunity for user feedback. While feedback may be sought from stakeholders, product owners, and team members, the most important feedback is from the end users. It is important to test the product with typical end users, the target demographic, to ensure that it works well for them,
Improving government websites and surveys – Page 3
which ultimately will lead to increased engagement (e.g., for websites) and better quality data (e.g., for surveys). Too often, user experience testing is not conducted until a product is complete, and often it is too late to make essential changes or much too costly. It is best to conduct UX testing throughout development and to make iterative changes as the product is developed (Romano Bergstrom et al., 2011). In iterative testing, usability testing is conducted on a product and issues are discovered, then the design is modified based on user feedback, and the revised design is tested. This process continues until optimal usability is achieved or a crucial deadline, such as product launch, arrives. Minor adjustments are usually made since iterative testing will discover additional issues and ensure that design changes did not lead to more issues. Minor changes are easier and faster to complete, are less costly, and do not require lots of approval (Krug, 2005). When you engage users at each phase, you ensure an optimal user experience.
In a recent series of UX studies, iterative testing enabled us to obtain user feedback at various points in product development. We worked with our client from the very start of a concept for a new website. The client wanted to know what users wanted from the new site – the redesign that was planned. To answer this question, we conducted focus groups with several user groups that included target demographics – typical users of the website. Focus groups allowed us to have conversations with target users about the resources they typically use, and their expectations for the upcoming website. The moderator guided the conversation so that the groups discussed how they typically used similar sites and what they found helpful and unhelpful from those websites. The focus groups provided actionable insights into the features that should be considered in a future version of the site.
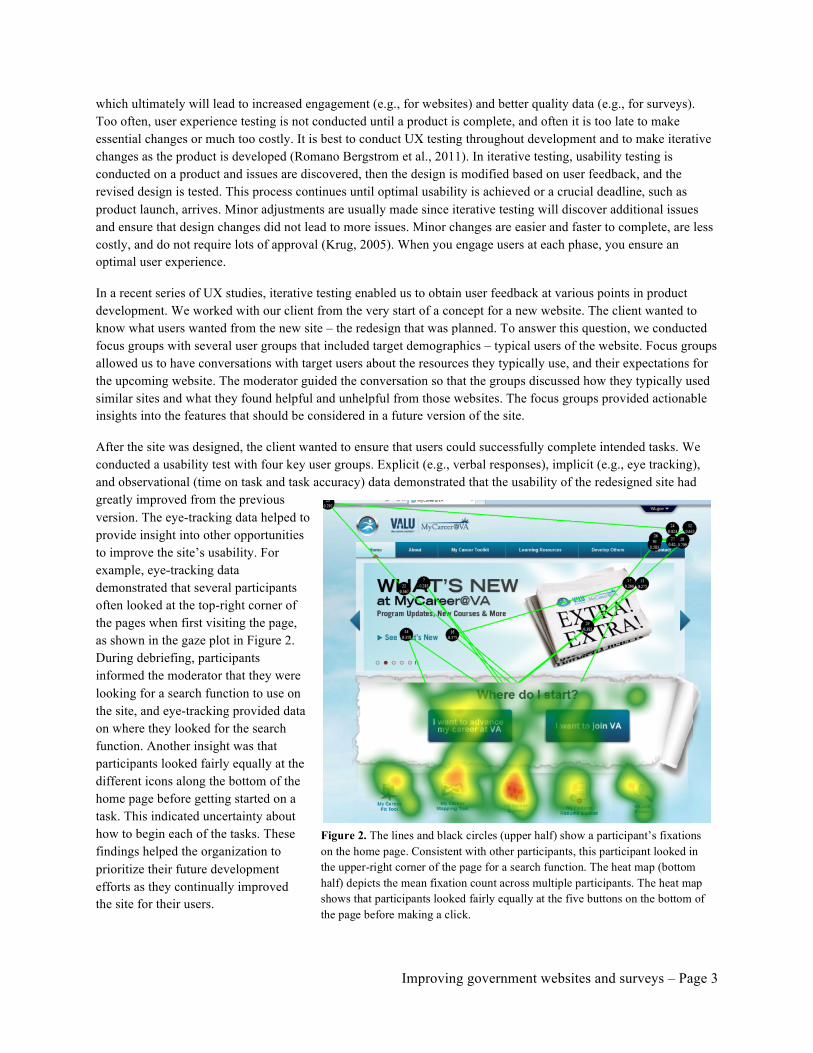
After the site was designed, the client wanted to ensure that users could successfully complete intended tasks. We conducted a usability test with four key user groups. Explicit (e.g., verbal responses), implicit (e.g., eye tracking), and observational (time on task and task accuracy) data demonstrated that the usability of the redesigned site had greatly improved from the previous version. The eye-tracking data helped to provide insight into other opportunities to improve the site’s usability. For example, eye-tracking data demonstrated that several participants often looked at the top-right corner of the pages when first visiting the page, as shown in the gaze plot in Figure 2. During debriefing, participants informed the moderator that they were looking for a search function to use on the site, and eye-tracking provided data on where they looked for the search function. Another insight was that participants looked fairly equally at the different icons along the bottom of the home page before getting started on a task. This indicated uncertainty about how to begin each of the tasks. These findings helped the organization to prioritize their future development efforts as they continually improved the site for their users.
Figure 2. The lines and black circles (upper half) show a participant’s fixations on the home page. Consistent with other participants, this participant looked in the upper-right corner of the page for a search function. The heat map (bottom half) depicts the mean fixation count across multiple participants. The heat map shows that participants looked fairly equally at the five buttons on the bottom of the page before making a click.
Improving government websites and surveys – Page 4
Methods and Tools for Measuring the UX
While it is important to obtain user feedback at each stage of product development, feedback should not necessarily be solicited in the same way at each stage. Rather, different UX research methods are used at different points in the design cycle. As previously mentioned, using focus groups to obtain user feedback about a concept works well, but once users can view a product, other methods are ususally more worthwhile.
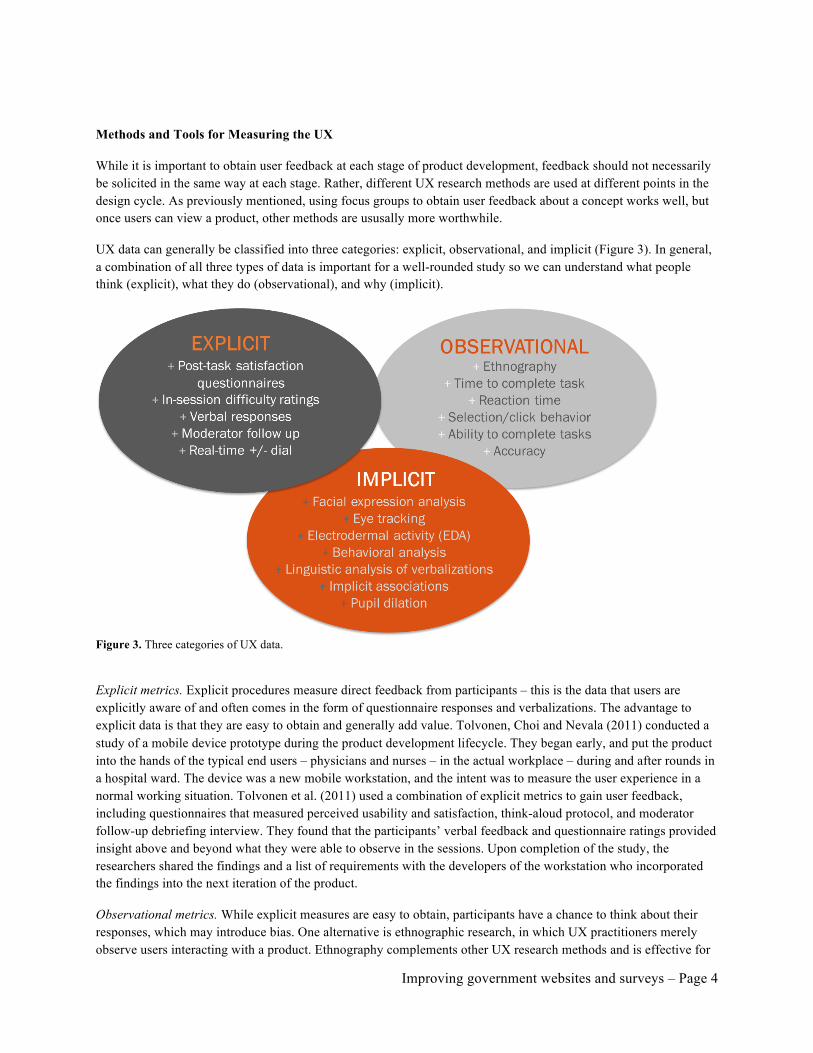
UX data can generally be classified into three categories: explicit, observational, and implicit (Figure 3). In general, a combination of all three types of data is important for a well-rounded study so we can understand what people think (explicit), what they do (observational), and why (implicit).
Figure 3. Three categories of UX data.
Explicit metrics. Explicit procedures measure direct feedback from participants – this is the data that users are explicitly aware of and often comes in the form of questionnaire responses and verbalizations. The advantage to explicit data is that they are easy to obtain and generally add value. Tolvonen, Choi and Nevala (2011) conducted a study of a mobile device prototype during the product development lifecycle. They began early, and put the product into the hands of the typical end users – physicians and nurses – in the actual workplace – during and after rounds in a hospital ward. The device was a new mobile workstation, and the intent was to measure the user experience in a normal working situation. Tolvonen et al. (2011) used a combination of explicit metrics to gain user feedback, including questionnaires that measured perceived usability and satisfaction, think-aloud protocol, and moderator follow-up debriefing interview. They found that the participants’ verbal feedback and questionnaire ratings provided insight above and beyond what they were able to observe in the sessions. Upon completion of the study, the researchers shared the findings and a list of requirements with the developers of the workstation who incorporated the findings into the next iteration of the product.
Observational metrics. While explicit measures are easy to obtain, participants have a chance to think about their responses, which may introduce bias. One alternative is ethnographic research, in which UX practitioners merely observe users interacting with a product. Ethnography complements other UX research methods and is effective for
Improving government websites and surveys – Page 5
exploring new environments (Kiewe, 2008). Observational procedures measure behavior that may be more natural, as in ethnography, or behavior that may not be expressed verbally or directly. These types of data typically include performance measures (e.g., reaction time, accuracy) and observed behaviors (e.g., click behavior).
In most usability studies, researchers collect a variety of explicit and observational data to understand the user experience. For example, in a usability study of a survey, we examined a number of usability metrics before it fielded to ensure that the data captured was accurate. While cognitive testing ensured that the questions and response options accurately captured the constructs of interest, usability testing was conducted to ensure the survey was usable and captured the data as intended. Participants thought aloud while working on the survey, which allowed us to understand participants’ thought processes while they worked (Boren & Ramey, 2000; Lewis, 1982).
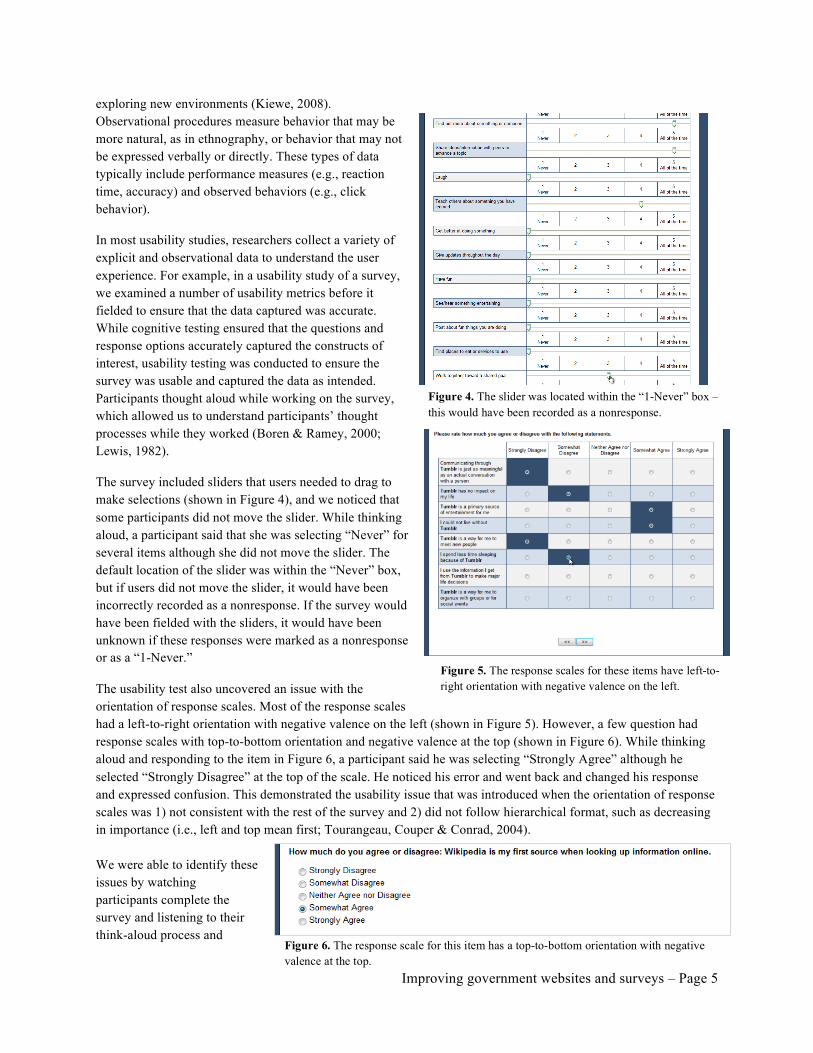
The survey included sliders that users needed to drag to make selections (shown in Figure 4), and we noticed that some participants did not move the slider. While thinking aloud, a participant said that she was selecting “Never” for several items although she did not move the slider. The default location of the slider was within the “Never” box, but if users did not move the slider, it would have been incorrectly recorded as a nonresponse. If the survey would have been fielded with the sliders, it would have been unknown if these responses were marked as a nonresponse or as a “1-Never.”
The usability test also uncovered an issue with the orientation of response scales. Most of the response scales had a left-to-right orientation with negative valence on the left (shown in Figure 5). However, a few question had response scales with top-to-bottom orientation and negative valence at the top (shown in Figure 6). While thinking aloud and responding to the item in Figure 6, a participant said he was selecting “Strongly Agree” although he selected “Strongly Disagree” at the top of the scale. He noticed his error and went back and changed his response and expressed confusion. This demonstrated the usability issue that was introduced when the orientation of response scales was 1) not consistent with the rest of the survey and 2) did not follow hierarchical format, such as decreasing in importance (i.e., left and top mean first; Tourangeau, Couper & Conrad, 2004). We were able to identify these issues by watching participants complete the survey and listening to their think-aloud process and
Figure 4. The slider was located within the “1-Never” box – this would have been recorded as a nonresponse.
Figure 5. The response scales for these items have left-to-right orientation with negative valence on the left.
Figure 6. The response scale for this item has a top-to-bottom orientation with negative valence at the top.
Improving government websites and surveys – Page 6
responses to questions in the debriefing interview. A combination of user experience metrics enabled us to catch usability issues and recommend changes to the interface. Implicit metrics. Observational and explicit data are easy to obtain, but users are generally aware of their actions and verbalizations. Implicit procedures measure behavior and physiology that are difficult or impossible for users to be aware of. These data include eye tracking, pupil dilation, and electrodermal activity, which users cannot control. This is the most unbiased form of user experience data because users cannot express or control the outcome.
Asking participants if they noticed particular elements is common practice among UX practitioners and researchers, and often these explicit data are the basis for important design considerations. Albert and Tedesco (2010) compared participants’ explicit ratings and verbalizations to eye-tracking data and found great variability in what people reported noticing and what they had actually seen. Many participants in the study had “false alarms” such that they said they saw elements, but in fact, they did not. This has important implications in that if researchers merely ask participants if they noticed elements and participants say they did, designers likely will opt not to make changes to the product. However, eye tracking can introduce reliability in knowing whether people actually noticed elements and how much time they spent looking at elements.
In a recent usability study of a government form, we used eye tracking to assess how much of the instructions people read and in what order they read the instructions. Asking about the amount or order of instructions people read before completing the form would have been an invalid measure since it would have been impossible for people to remember exactly what they read of the three pages of instructions. Eye tracking enabled us to understand users’ thought processes while they worked through the instructions, including what they thought was most important to read. For example, as shown in the eye-tracking data in Figure 7, on the first page of instructions, participants tended to focus on the “Purpose of Form” section and scanned the rest of the first page.
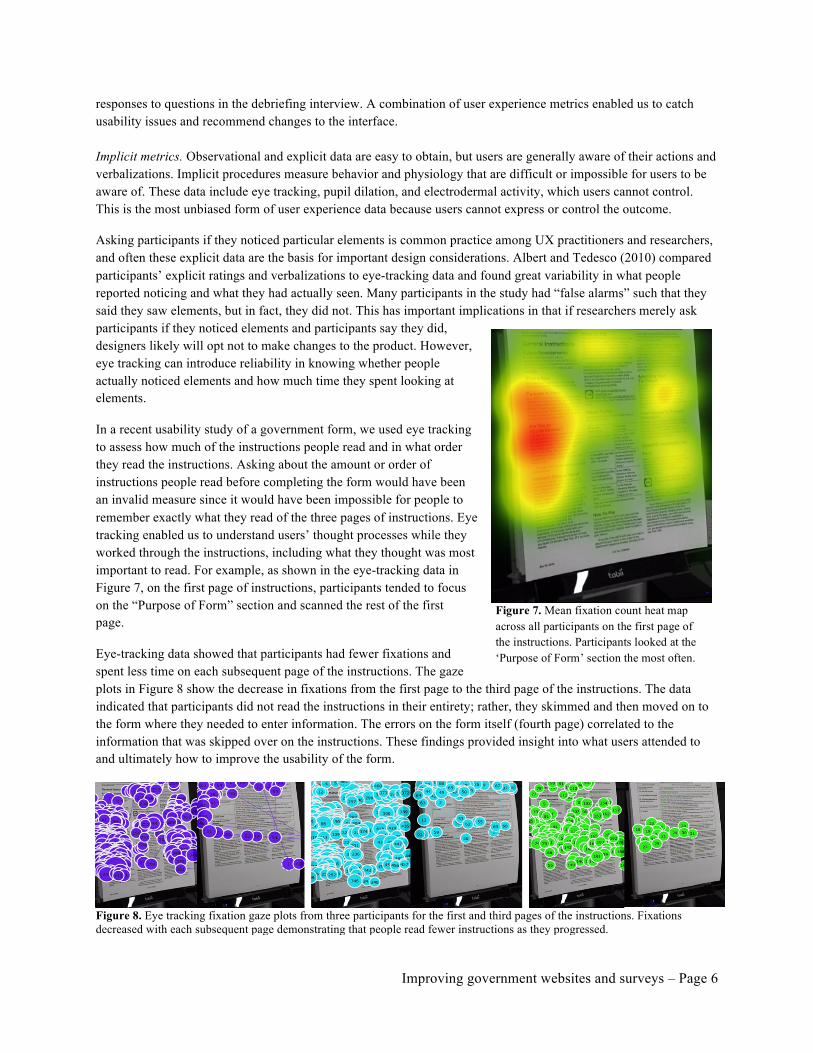
Eye-tracking data showed that participants had fewer fixations and spent less time on each subsequent page of the instructions. The gaze plots in Figure 8 show the decrease in fixations from the first page to the third page of the instructions. The data indicated that participants did not read the instructions in their entirety; rather, they skimmed and then moved on to the form where they needed to enter information. The errors on the form itself (fourth page) correlated to the information that was skipped over on the instructions. These findings provided insight into what users attended to and ultimately how to improve the usability of the form.
Figure 8. Eye tracking fixation gaze plots from three participants for the first and third pages of the instructions. Fixations decreased with each subsequent page demonstrating that people read fewer instructions as they progressed.
Figure 7. Mean fixation count heat map across all participants on the first page of the instructions. Participants looked at the ‘Purpose of Form’ section the most often.
Improving government websites and surveys – Page 7
Implementing User Experience Research
The optimal research method depends not only on the stage in the product development cycle but also the questions that are asked. Usability testing and user experience research can be implemented in every phase in the design process. In early stages of product development, results from UX research can inform about content strategy. Research at this stage is typically more qualitative in nature and may include focus groups, in-depth interviews, and ethnographic observation. Research in this stage helps to provide a clear direction and can move development along at an efficient pace. In later stages of product development, UX research informs about elements that work well and that do not work well from the user’s perspective. Research at this stage often focuses on identifying issues that lead to errors and decreased engagement or use.
By incorporating user experience research into the product development lifecycle, organizations can make evidence-based decisions about the design of products, including websites, applications, surveys, and forms. Products that are usable and engaging have numerous benefits for organizations, including 1) satisfied consumers, 2) improved perception of the organization, 3) decreased training, maintenance, and call center costs, and 4) efficient employee workflows. While the best research methods and study designs for an organization depend on the UX question for the particular product, including user-centered research is undoubtedly beneficial.
Works Cited
Albert, W. & Tedesco, D. (2010). Reliability of self-reported awareness measures based on eye tracking. Journal of Usability Studies, 5, 50-64.
Boren, T. & Ramey, J. (2000). Thinking aloud: Reconciling theory and practice. IEEE Transactions on Professional Communication 43, 261-278.
ISO 9241-11 (2208). Ergonomic requirements for office work with visual display terminals (VDTs). Part 11: Guidance on usability. International Organization for Standardization.
Kiewe, H. (2008). How may I help you? An ethnographic view of contact-center HCI. Journal of Usability Studies, 3, 74-89.
Krug, S. (2005). Don’t Make Me Think: A Common Sense Approach to Web Usability (2nd Edition). New Riders Publishing: Thousand Oaks, CA.
Lewis, C. H. (1982). Using the "Thinking Aloud" Method in Cognitive Interface Design (Technical report). IBM RC-9265.
Morville, P. (2008). User Experience Design. Retrieved from http://semanticstudios.com/publications/semantics/000029.php
Romano Bergstrom, J. C., Olmsted-Hawala, E. L., Chen, J. M., & Murphy, E. D. (2011). Conducting iterative usability testing on a Web site: Challenges and benefits. Journal of Usability Studies, 7, 9-30.
Tolvonen, R., Choi, D-S., & Nevala, N. (2011). Ergonomics product development of a mobile workstation for health
care. Journal of Usability Studies, 7, 40-50.
Tourangeau, R., Couper, M. P. & Conrad, F. (2004). Spacing, position, and order: Interpretive heuristics for visual features of survey questions. Public Opinion Quarterly, 68, 368-393.