Improved Inata mine plan and Q2 results - Avocet Mining PLC
23
Page 1 Page 1 Avocet Mining Improved Inata mine plan and Q2 results 8 th August 2013
Transcript of Improved Inata mine plan and Q2 results - Avocet Mining PLC

Page 1 Page 1
Avocet Mining Improved Inata mine plan and Q2 results
8th August 2013

Page 2
Quality assets in a highly prospective region
Inata Gold Mine
o Producing mine with significant
exploration potential
o Cash generative asset even at
lower prices
o Upside from satellite Souma
deposit 20km from Inata process
plant – currently 0.8Moz with
significant growth potential
o Inata Mineral Resources of 5.5
Moz., including 0.8 Moz. at
Souma
Tri-K Development Project
o Feasibility study commenced in Q4 2012
o Potential to be Guinea’s next producing gold mine - first under new mining code
o Low capex development plan assumes initial heap leach project
Avocet Mining: Q2 results and new mine plan (August 2013)

Page 3
Highlights
• Improved Inata life of mine plan
- Stronger cash generation - US$65m in hedge period, US$190m thereafter;
- 36% increase in life of mine recovered ounces;
- Inata cash flows to fund US$6m carbon blinding circuit with completion by mid-2014; and
- Capex reduced to an average of US$7m p.a. over the next five years.
• Q2 results
- Q2 production of 31,245 ounces at total cash cost of US$1,238 per ounce;
- Four million hours without a lost time injury reached during June;
- Access to higher grade, high recovery Minfo oxide ore in Q2 - recovery of 91% achieved in June and 12,072 ounces recovered;
- Similar results expected in H2 with processing of oxide ore through to mid-2014;
- Mining costs to fall in Q3 after end of waste catch-up campaign and stand down of mining contractor during the quarter; and
- EBITDA for the quarter of US$0.8m (Q1 2013: US$6.7m).
New life of mine plan: 36% increase in production, cash generative even at lower prices
Avocet Mining: Q2 results and new mine plan (August 2013)

Page 4
New plan – 36% increase in LOM gold production
• LOM gold production of 960koz, up 36% from 707koz previously
• Significant improvements in LOM recoveries – up from 78% to 83%
• Mining spread more evenly over LOM and at lower annual rate
• Annual production up 21% from average of 96koz to 116koz
• Reduction in LOM cash costs
• Net cash generated higher than previous LOM
- Especially in early years, even at prices below current spot
Significant improvement in production and cash generation
Avocet Mining: Q2 results and new mine plan (August 2013)
New plan - August 2013
Old plan - March 2013
-
20
40
60
80
100
120
140
160
2013 2014 2015 2016 2017 2018 2019 2020 2021
An
nu
al g
old
pro
du
ctio
n (
koz
p.a
.)
+19%
+17% +38% +42%
+52%

Page 5
Carbon blinding circuit – new process flow
Simple project with little or no disruption to operations during construction
Tailings
CIL tanks
Cyclones
Elution circuit
Cyanide
Blinding – additional tanks
Additional regen. capacity
2x additional CIL tanks
Ore feed from
existing grinding circuit
Key: Flow of material Existing plant Additional equipment - carbon blinding circuit
Avocet Mining: Q2 results and new mine plan (August 2013)

Page 6
Carbon blinding circuit
• New carbon blinding circuit will achieve significantly higher recoveries
- Carbon blinding refers to negating effects of active carbon in certain ore types
- Higher recovery rates over the life of the mine
- High grade ore previously excluded from LOMP due to high PRI values is now economic
• Blinding circuit is a simple project with estimated capex of US$6m, in contrast to previous estimates for a more complex solution
- Capex of US$6m will be met from Inata’s own cash generation
- Orders have already been placed for the longest lead time items
• Inata plant will continue processing benign oxide material until carbon blinding circuit is complete - scheduled by mid-2014
Low capex solution of US$6m – funded from Inata operating cash flow
Avocet Mining: Q2 results and new mine plan (August 2013)

Page 7
New mine plan – improved mining schedule
Mining cost in 2013-2016 per ounce down 14%
• Ability to process high PRI ore as it is mined, rather than it being stockpiled
- Ore stockpile peaks at 2.6Mt, down from 5.3Mt previously
• Mining therefore spread more evenly over LOM and at lower annual rate
• Nine million fewer tonnes mined in gold hedge period of 2013-2016
Avocet Mining: Q2 results and new mine plan (August 2013)
-
5
10
15
20
25
30
35
40
45
2013 2014 2015 2016 2017 2018 2019
Tota
l to
nn
es
min
ed
pe
r an
nu
m M
illio
ns Old plan - March 2013
New plan - August 2013

Page 8
New mine plan: reduced costs
• Carbon blinding circuit allows plant to process high grade, high PRI ore earlier at increased recoveries, raising production
• Increase in gold produced, together with reduced mining volumes, results in approximately US$200/oz reduction in cash cost during 2013-16
• Life of mine cash costs (incl. royalties) of US$906/oz, down from US$964/oz
• Life of mine all in cash cost (incl. capex) of US$958/oz, down from US$1,028/oz
Significant reduction in cash cost per ounce
New plan - August 2013
Old plan - March 2013
-
200
400
600
800
1,000
1,200
1,400
2013 2014 2015 2016 2017 2018 2019 2020 2021
Tota
l cas
h c
ost
incl
ud
ing
roya
lty
(US$
00
0)
Avocet Mining: Q2 results and new mine plan (August 2013)

Page 9
Tri-K feasibility study on track
• ESIA submitted and presentation to Government in July
• Required drilling for maiden Ore Reserve complete
• Complete feasibility & mining permit application in H2 2013
• Heap leach project will target oxide portion of Orebody
- Approximately 0.6Moz estimated to be amenable to heap leach, subject to metallurgical testing
• Exploitation of fresh material to be considered at a later date
Potential to be Guinea’s first mine under the new mining code
Avocet Mining: Q2 results and new mine plan (August 2013)

Page 10
Q2 Results review
Avocet Mining: Q2 results and new mine plan (August 2013)

Page 11
Inata gold mine – Q2 2013 results
Q2 production and costs in line with expectations
Minfo pit
Inata North pit
Sayouba pit
Inata processing
plant
Q1 2013 Q2 2013
Ore mined (k tonnes) 817 971
Waste mined (k tonnes) 9,127 8,700
Total mined (k tonnes) 9,944 9,670
Ore processed (k tonnes) 616 620
Average head grade (g/t) 1.65 1.84
Process recovery rate 82% 87%
Gold Produced (oz) 30,481 31,245
Cash costs (US$/oz)
Mining 542 582
Processing 360 371
Administration 163 188
Royalties 104 97
1,169 1,238
Inata Central pit
Avocet Mining: Q2 results and new mine plan (August 2013)

Page 12
Progress during Q2
• Mining of ore at Minfo pit commenced during quarter
- Near surface oxide material
- Higher grade ore with recoveries >90%
- Ramp up of Minfo material in April and May
• June first full month of Minfo ore, with 12,072 ounces recovered – similar results expected in H2 2013
• Oxide ore scheduled until mid-2014
• Carbon blinding circuit will allow processing of high PRI ore at significantly higher recoveries
Access to higher grade, high recovery oxide ore in Q2 – continues into 2014
1.72g/t
1.87g/t 1.94g/t 80.7%
88.2% 91.7%
April 13 May 13 June 13
Q2 grade and recovery
Avocet Mining: Q2 results and new mine plan (August 2013)
9.7 10.2 12.1 9.2 10.6 11.4
April 13 May 13 June 13
Q2 oz recovered & produced by month
Ouncesrecovered
Ouncesproduced

Page 13
Cost saving culture
• 2013 capex of US$18m, incl. US$3m carbon blanking project in H2
- Excluding this, capex is US$5m below original US$20m
- Savings on TMF & fleet component changes
- Second lube truck built in-house
• Reduced average LOM capex of US$7m p.a. over next five years
• Mining contractor stood down
- Equates to US$1.1m per month saving
• 25% reduction in expat headcount
• Rationalisation of accommodation & office in Ouagadougou
• Reduced travel to/from site
• Corporate cost savings
- Head office headcount reduced by equivalent of 5 full time positions
Avocet Mining: Q2 results and new mine plan (August 2013)

Page 14
Financial review
Avocet Mining: Q2 results and new mine plan (August 2013)
Page 15
Income statement
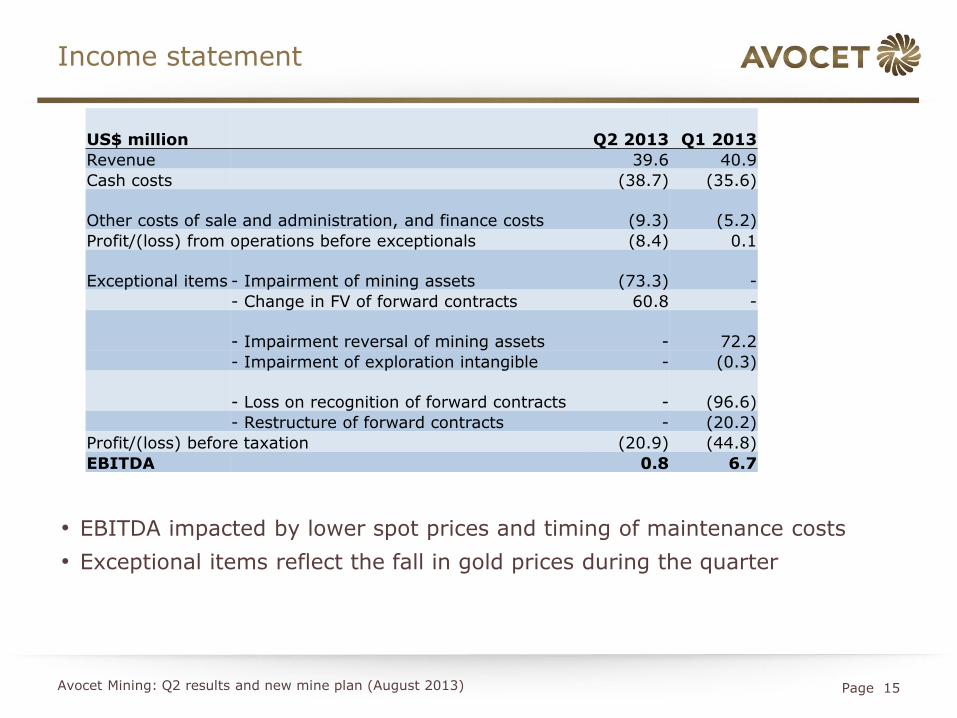
• EBITDA impacted by lower spot prices and timing of maintenance costs
• Exceptional items reflect the fall in gold prices during the quarter
Avocet Mining: Q2 results and new mine plan (August 2013)
US$ million Q2 2013 Q1 2013
Revenue 39.6 40.9
Cash costs (38.7) (35.6)
Other costs of sale and administration, and finance costs (9.3) (5.2)
Profit/(loss) from operations before exceptionals (8.4) 0.1
Exceptional items - Impairment of mining assets (73.3) -
- Change in FV of forward contracts 60.8 -
- Impairment reversal of mining assets - 72.2
- Impairment of exploration intangible - (0.3)
- Loss on recognition of forward contracts - (96.6)
- Restructure of forward contracts - (20.2)
Profit/(loss) before taxation (20.9) (44.8)
EBITDA 0.8 6.7

Page 16
Cash flow statement
• Q2 working capital reflects:
- increase in ore stockpile and spares/consumable inventory, ahead of the rainy season
- fall in payables due to timing (in Q1 payables increased by US$8.1 million)
• Q2 capex includes - US$1.2 million mining equipment
and rebuilds
- US$1.6 million tailings facility
• Q2 exploration expenditure mainly comprises Tri-K feasibility study
• Loans proceeds represent draw downs under the Elliott loan
Avocet Mining: Q2 results and new mine plan (August 2013)
US$ million Q2 2013 Q1 2013
EBITDA 0.8 6.7
Working capital (11.4) (1.2)
Hedge restructure - (20.2)
Provision/other - (0.7)
Net cash generated by operating
activities (10.6) (15.4)
Capex (4.0) (5.4)
Exploration (5.1) (5.7)
Loan proceeds 5.0 5.0
Other cash movement (0.5) (0.5)
Total (decrease)/increase in cash (15.2) (22.0)
Opening cash 32.9 54.9
Closing cash 17.7 32.9
Loan balances outstanding (15.0) (10.0)
Closing net cash 2.7 22.9
Page 17
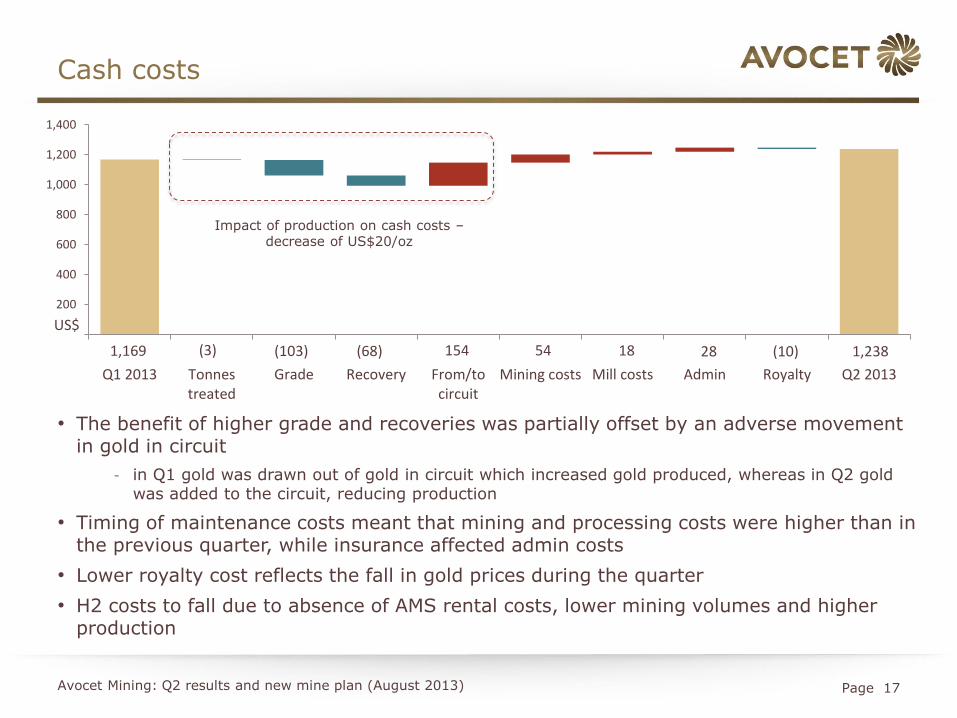
1,169 1,238 (3) (103) (68) (10) 154 54 18 28
200
400
600
800
1,000
1,200
1,400
Q1 2013 Tonnestreated
Grade Recovery From/tocircuit
Mining costs Mill costs Admin Royalty Q2 2013
• The benefit of higher grade and recoveries was partially offset by an adverse movement in gold in circuit
- in Q1 gold was drawn out of gold in circuit which increased gold produced, whereas in Q2 gold was added to the circuit, reducing production
• Timing of maintenance costs meant that mining and processing costs were higher than in the previous quarter, while insurance affected admin costs
• Lower royalty cost reflects the fall in gold prices during the quarter
• H2 costs to fall due to absence of AMS rental costs, lower mining volumes and higher production
Cash costs
Impact of production on cash costs – decrease of US$20/oz
US$
Avocet Mining: Q2 results and new mine plan (August 2013)

Page 18
• Cost per tonne mined up 14% on 3% fewer tonnes mined
• Higher maintenance and explosive costs account for the majority of the increase
• AMS now demobilised – saving of ~US$1.1m/month rental costs in H2
Mining cash costs
Avocet Mining: Q2 results and new mine plan (August 2013)
Tonnes mined 7.8m 7.3m 8.1m 9.9m 9.9m 9.7m
US$12.7m US$13.2m
US$12.4m
US$17.4m US$16.5m
US$18.2m
-
2.0
4.0
6.0
8.0
10.0
12.0
14.0
16.0
18.0
20.0
Q12012
Q22012
Q32012
Q42012
Q12013
Q22013
Total mining costs US$m
Other
Labour
Explosives
Maintenance
Fuel
US$1.63/t
US$1.81/t
US$1.52/t
US$1.76/t US$1.66/t
US$1.88/t
-
0.20
0.40
0.60
0.80
1.00
1.20
1.40
1.60
1.80
2.00
Q12012
Q22012
Q32012
Q42012
Q12013
Q22013
Cost per tonne mined US$/t

Page 19
• Cost per tonne milled up 5% with 1% higher tonnes milled
• Increase mainly reflects higher maintenance due to liner changes and motor replacements in both the SAG mill and one ball mill
• Reagent costs include higher usage and price increases for some products
Processing cash costs
Avocet Mining: Q2 results and new mine plan (August 2013)
Tonnes milled 608kt 651kt 643kt 654kt 616kt 620kt
US$10.8m US$10.9m
US$9.2m
US$10.8m US$11.0m US$11.6m
-
1.0
2.0
3.0
4.0
5.0
6.0
7.0
8.0
9.0
10.0
11.0
12.0
Q12012
Q22012
Q32012
Q42012
Q12013
Q22013
Total processing costs in US$m
Other
Labour
Reagents
Maintenance
Fuel
US$17.81/t US$16.75/t
US$14.34/t
US$16.53/t
US$17.81/t US$18.70/t
-
2.0
4.0
6.0
8.0
10.0
12.0
14.0
16.0
18.0
20.0
Q12012
Q22012
Q32012
Q42012
Q12013
Q22013
Cost per tonne milled US$/t

Page 20
Total cash costs – Q2 2013
Avocet Mining: Q2 results and new mine plan (August 2013)
Mining
US$ Processing
US$ Admin
US$ Royalties
US$ Total US$
Fuel 177 112 18 - 307
Maintenance 149 99 17 - 265
Labour 59
30 53 - 153
Reagents - 118 - - 112
Royalties - - - 97 97
Explosives 83 - - - 83
Contractors and consultants
34 2 24 - 60
Insurance - - 25 - 25
Other (incl. AMS rental)
83 10 51 - 137
Total per oz. 582 371 188 97 1,238
Total US$ millions
18.2 11.6 5.9 3.0 38.7
Fuel - 25%
Maintenance- 21%
Labour - 11%
Reagents - 10%
Royalties - 8%
Explosives -7%
Contractors - 5%
Insurance - 2%
Other - 12%

Page 21
H2 2013 outlook
Focussed on optimising cash flow at Inata
Similar monthly production expected as in June, with processing of oxide ore
through rest of year
Progress carbon blinding project
Complete Tri-K feasibility study
Refinancing a priority, with discussions centred on Inata LOM and Tri-K
feasibility study
Avocet Mining: Q2 results and new mine plan (August 2013)

Page 22
Avocet Mining – a West African
focused gold mining
and exploration company
Avocet Mining: Q2 results and new mine plan (August 2013)

Page 23
Disclaimer
This Presentation is for information purposes in connection with Avocet Mining PLC (the “Company”). While the information contained herein has been prepared in good faith, neither the Company nor any of its shareholders, directors, officers, agents, employees, consultants or advisers give, have given or have authority to give, any representations or warranties (express or implied) as to, or in relation to, the accuracy, reliability, completeness or suitability of the information in this Presentation, or any revision thereof, or of any other written or oral information made or to be made available to any interested party or its advisers (all such information being referred to as "Information") and liability therefore is expressly disclaimed. Accordingly, neither the Company nor any of its shareholders, directors, officers, agents, employees, consultants or advisers take any responsibility for, or will accept any liability whether direct or indirect, express or implied, contractual, tortious, statutory or otherwise, in respect of the accuracy or completeness of the Information or for any of the opinions contained herein or for any errors, omissions or misstatements or for any loss, howsoever arising or out of or in connection with the use of this Presentation. Each party to whom this Presentation is made available must make its own independent assessment of the Company and the Presentation after making such investigations and taking such advice as may be deemed necessary. Any reliance placed on the Presentation is strictly at the risk of such person relying on such Presentation and the Information contained within. This Presentation may contain forward-looking statements regarding the Company and its subsidiaries. These statements are based on various assumptions made by the Company. Such assumptions are subject to factors which are beyond our control and which involve known and unknown risks, uncertainties and other factors which may cause the Company's actual results, performance or achievements to be materially different from any future results, performances or achievements expressed or implied by the forward-looking statements. Forward-looking statements may in some cases be identified by terminology such as “may”, “will”, “could”, “should”, “expect”, “plan”, “intend”, “anticipate”, “believe”, “estimate”, “predict”, “potential” or “continue”, the negative of such terms or other comparable terminology. These forward looking statements are only predictions. Actual events or results may differ materially, and a number of factors may cause the Company's actual results to differ materially from any such statement. Such factors include among others general market conditions, demand for the Company's products, development in reserves and resources, unpredictable changes in regulations affecting our markets, market acceptance of products and such other factors that may be relevant from time to time. Although we believe that the expectations and assumptions reflected in the statements are reasonable, any person relying on such Information and Presentation are cautioned that the Company cannot guarantee future results, levels of activity, performance or achievement. In preparing this Presentation and except as required by law, the Company does not undertake or agree to any obligation or responsibility to provide the recipient with access to any additional information or to update this Presentation or Information or to correct any inaccuracies in, or omission from this Presentation or to update publicly any forward-looking statements for any reason after the date of this Presentation to conform these statements to actual results or to changes in our expectations. You are advised, however, to consult any further public disclosures made by the Company, such as filings made with the London Stock Exchange, Oslo Stock Exchange or press releases. This Presentation does not constitute an offer or invitation to sell, or any solicitation of any offer to subscribe for or purchase any securities and nothing contained herein shall form the basis of any contract or commitment whatsoever. Copies of this Presentation should not be distributed to any affiliates, third parties or indirect recipients in any manner whatsoever. The distribution of this Presentation in or to persons subject to other jurisdictions may be restricted by law and persons into whose possession this Presentation comes should inform themselves about, and observe any such restrictions. Any failure to comply with these restrictions may constitute a violation of the laws of the relevant jurisdictions. United Kingdom: This Presentation has not been approved by an authorised person in accordance with Section 21 of the Financial Services and Markets Act 2000 and therefore it is being delivered for information purposes only to a very limited number of persons and companies who are persons who have professional experience in matters relating to investments and who fall within the category of person set out in Article 19 of the Financial Services and Markets Act 2000 (Financial Promotion) Order 2005 (the "Order") or are high net worth companies within the meaning set out in Article 49 of the Order or are otherwise permitted to receive it. Any person who receives this Presentation who does not fall within the category of person set out in Article 19 and Article 49 of the Order should not rely or act upon it. By accepting this Presentation, the recipient represents and warrants that they are a person who falls within the above description of persons entitled to receive the Presentation
Avocet Mining: Q2 results and new mine plan (August 2013)