Improve GC/MS 2 pm, EST (11 am PST) Detection and Quantitation · Using Deconvolution to Improve...
27
Using Deconvolution to Improve GC/MS Detection and Quantitation E-Seminar, October 19th, 2010 2 pm, EST (11 am PST) Chinkai (Kai) Meng, Ph.D. Senior Applications Chemist Wilmington, Delaware USA [email protected]
Transcript of Improve GC/MS 2 pm, EST (11 am PST) Detection and Quantitation · Using Deconvolution to Improve...
Using Deconvolution to Improve GC/MS
Detection and Quantitation
E-Seminar, October 19th, 20102 pm, EST (11 am PST)
Chinkai (Kai) Meng, Ph.D.Senior Applications ChemistWilmington, Delaware USA

Outline
• Introduction
• Deconvolution - Find Trace Compounds in Complex Matrices
• Deconvolution - Quantitation
• Summary
E-seminar, October 2010
Page 2

Introduction
• Instrument sensitivity (e.g., signal-to-noise ratio) is usually determined by the amount of sample injected and the responses from the detector. We will discuss sensitivity from a different view.
• In a multi-residue analysis, the data reviewing process is also very important in confirming the hits found by the software and reviewing the integration/quantitation for accuracy.
• Deconvolution has been proven to be a powerful data processing tool in finding trace compounds in complex matrices. In this study, results from Deconvolution (AMDIS) is closely looked at and compared to the results from ChemStation. The goal is to determine if Deconvolution can provide better results (sensitivity) than the routine ChemStation data processing.
Page 3
E-seminar, October 2010
What is Deconvolution?
Deconvolution is a process (tool) to extract ions from a complex full-scan total ion chromatogram (TIC), even with the target compound signal at trace level. The software used for this technique is AMDIS (Automated Mass spectral Deconvolution and Identification System) developed by NIST (National Institute of Standards and Technology).
E-seminar, October 2010
Page 4
3-D movieMagic Eye
Information is there, you just need the right tool to see it.

GC/MSD Deconvolution – What it can do.
E-seminar, October 2010
Page 5
From here…
Deconvolution Reporting Software
Quant on Deconvoluted Peaks
GC/MSD in Scan Mode
…to here in 2 - 3 min
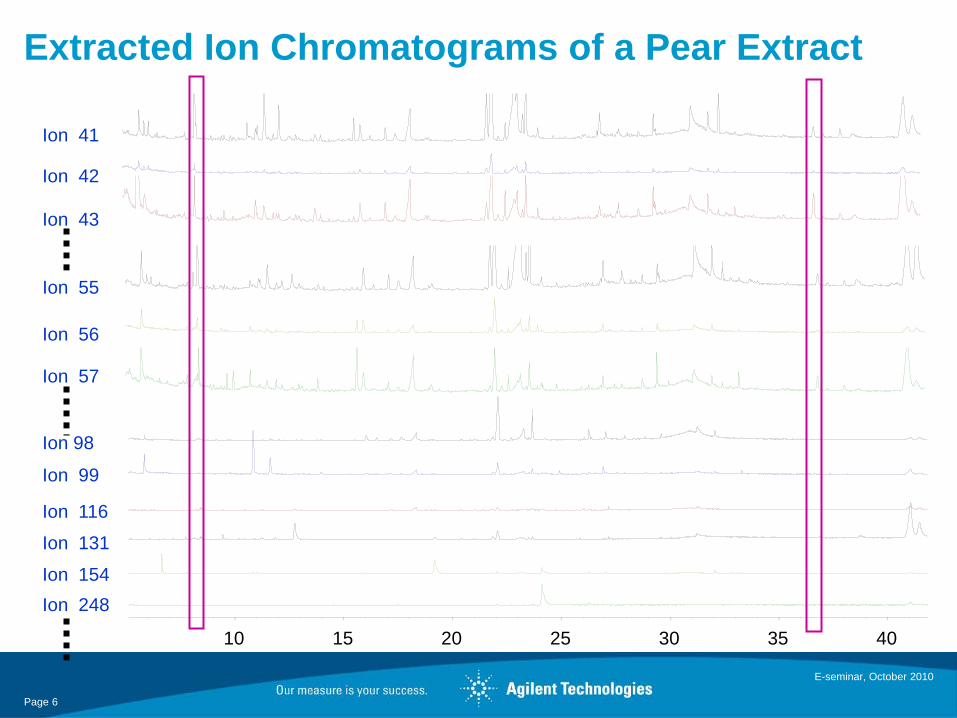
10 15 20 25 30 35 40
Ion 41
Ion 42
Ion 43
Ion 154
Ion 98
Ion 55
Ion 56
Ion 57
Ion 99
Ion 116
Ion 131
Ion 248
Extracted Ion Chromatograms of a Pear Extract
Page 6
E-seminar, October 2010
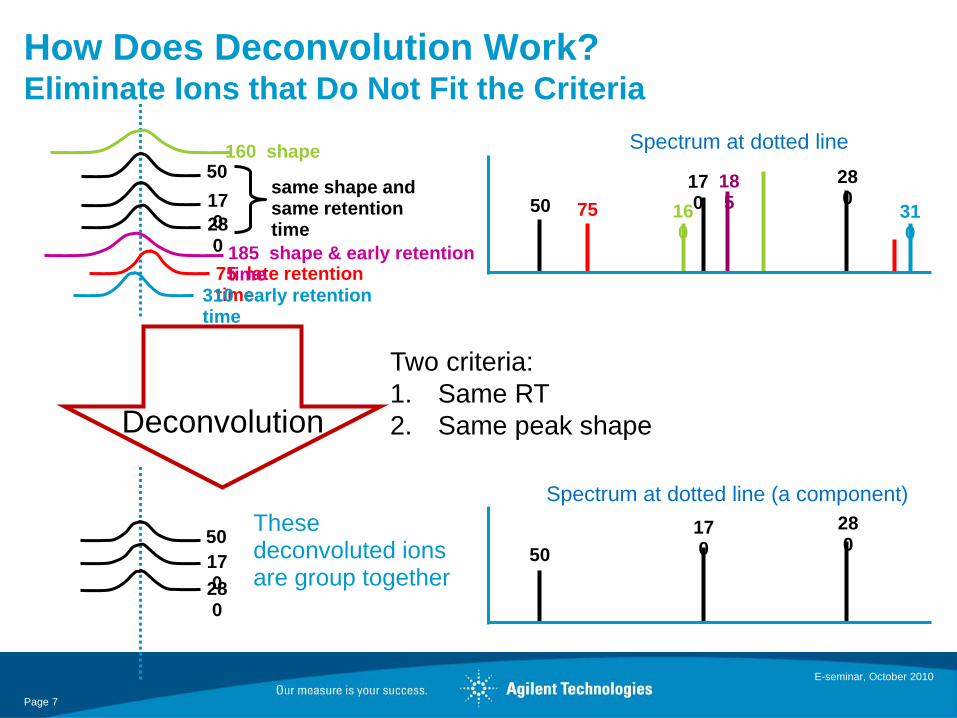
How Does Deconvolution Work? Eliminate Ions that Do Not Fit the Criteria
50170
280
310
7518516
0
5017028075 late retention time
185 shape & early retention time
310 early retention time
160 shape
same shape and same retention time
Page 7
E-seminar, October 2010
Spectrum at dotted line
Deconvolution
Two criteria:1. Same RT2. Same peak shape
50170
28050
170280
Spectrum at dotted line (a component)These deconvoluted ions are group together
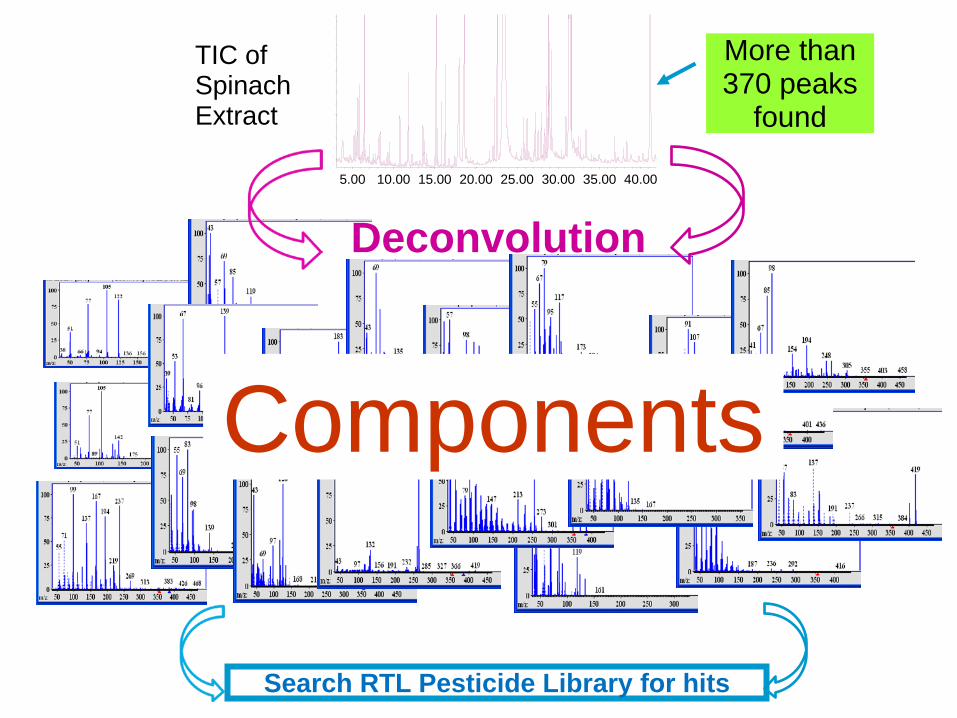
5.00 10.00 15.00 20.00 25.00 30.00 35.00 40.00
TIC of Spinach Extract
More than 370 peaks
found
Components
Deconvolution
Search RTL Pesticide Library for hitsPage 8
E-seminar, October 2010
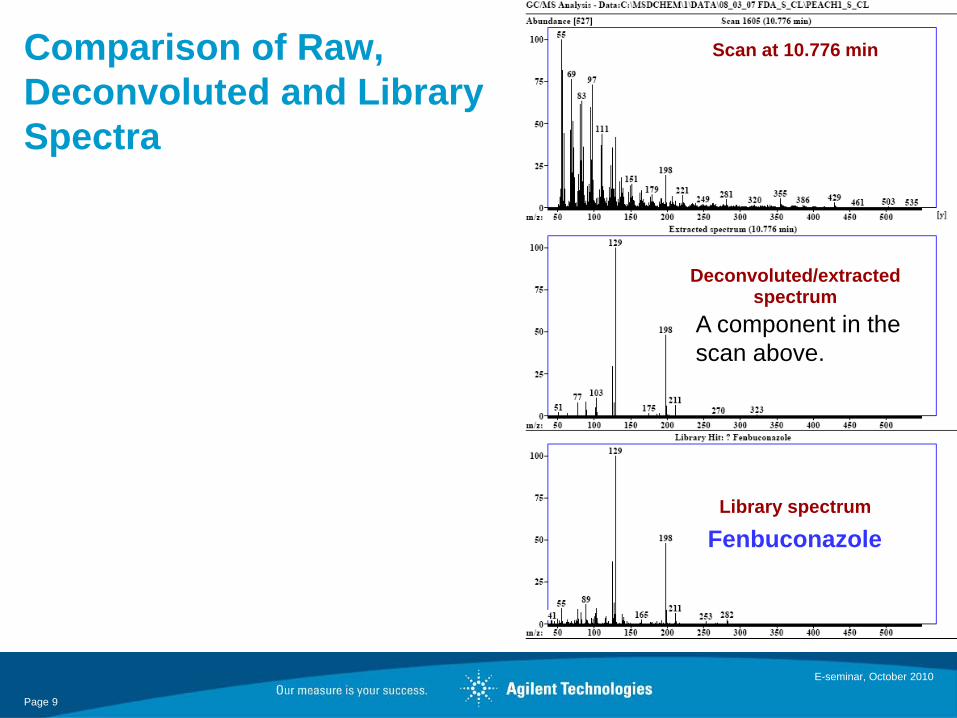
Fenbuconazole
Scan at 10.776 min
Deconvoluted/extracted spectrum
Library spectrum
A component in the scan above.
Comparison of Raw, Deconvoluted and Library Spectra
Page 9
E-seminar, October 2010
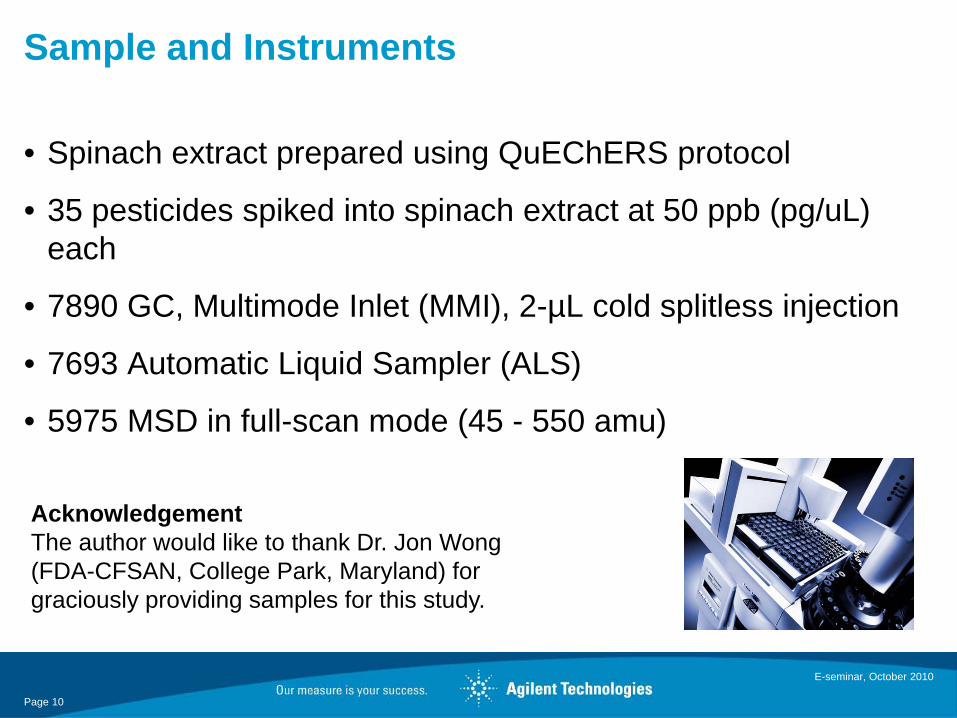
Sample and Instruments
• Spinach extract prepared using QuEChERS protocol
• 35 pesticides spiked into spinach extract at 50 ppb (pg/uL) each
• 7890 GC, Multimode Inlet (MMI), 2-µL cold splitless injection
• 7693 Automatic Liquid Sampler (ALS)
• 5975 MSD in full-scan mode (45 - 550 amu)
AcknowledgementThe author would like to thank Dr. Jon Wong (FDA-CFSAN, College Park, Maryland) for graciously providing samples for this study.
Page 10
E-seminar, October 2010
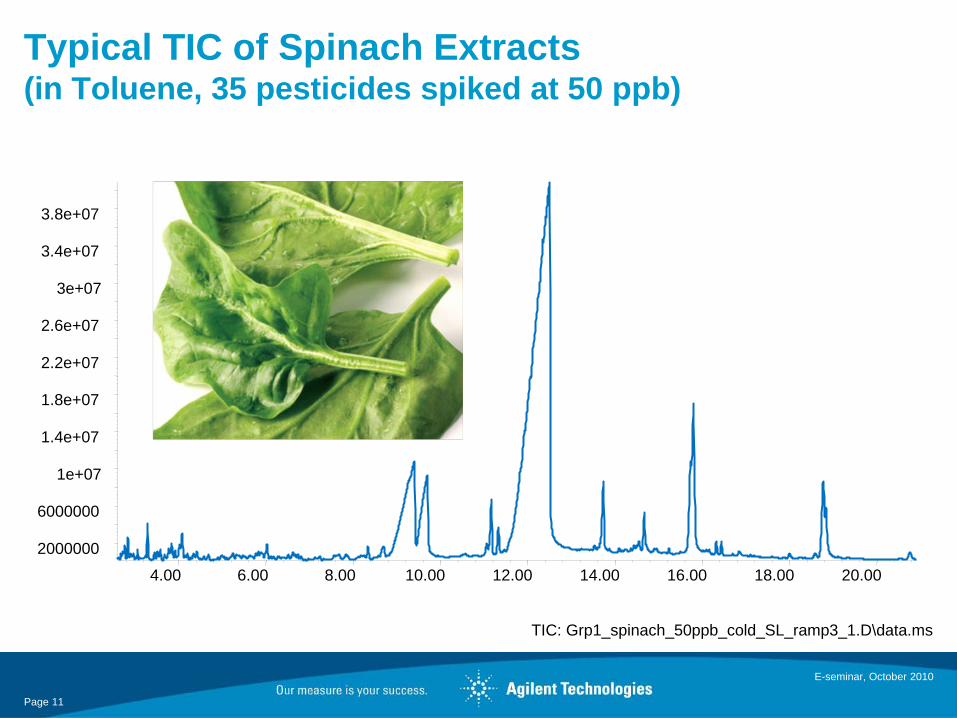
Typical TIC of Spinach Extracts (in Toluene, 35 pesticides spiked at 50 ppb)
4.00 6.00 8.00 10.00 12.00 14.00 16.00 18.00 20.00
2000000
6000000
1e+07
1.4e+07
1.8e+07
2.2e+07
2.6e+07
3e+07
3.4e+07
3.8e+07
TIC: Grp1_spinach_50ppb_cold_SL_ramp3_1.D\data.ms
Page 11
E-seminar, October 2010

MSD ChemStation “Edit Compound” Screen
In ChemStation, the target compound identification is based on 4 ions and three ion ratios.
However, the target compound identification in AMDIS was based on the full spectral library matchwhich is more dependable.
This screen shows the quantitationdatabase for locating and then confirming a compound.
Page 12
E-seminar, October 2010
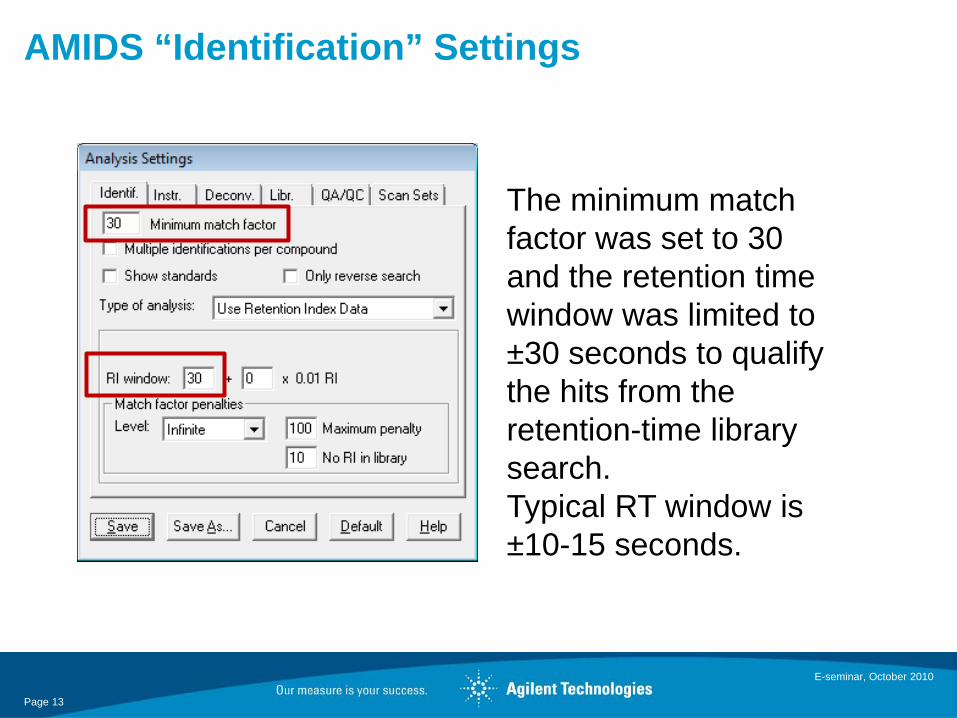
AMIDS “Identification” Settings
The minimum match factor was set to 30 and the retention time window was limited to ±30 seconds to qualify the hits from the retention-time library search. Typical RT window is ±10-15 seconds.
Page 13
E-seminar, October 2010

AMIDS “Deconvolution” Settings (1 of 2)
Assumed component width in scans. Increase this if all peaks are wider.
Masses listed here will not be used as models but can still be included in a component.
A closely eluting large ion will be subtracted to allow more models to be considered. None yields the fastest processing, two the slowest.
Page 14
E-seminar, October 2010
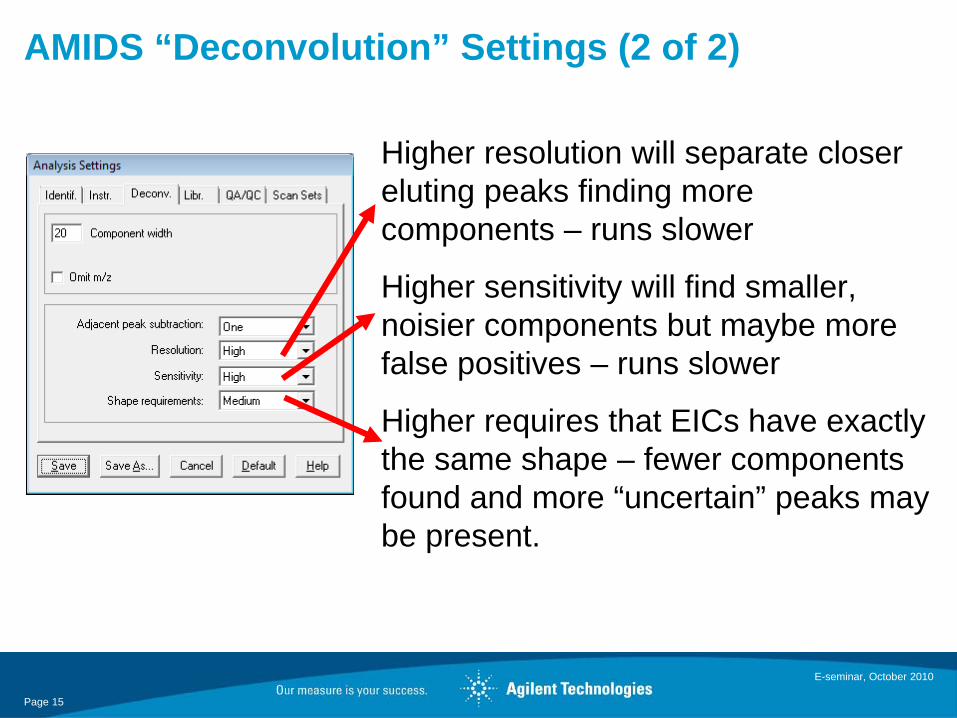
AMIDS “Deconvolution” Settings (2 of 2)
Higher resolution will separate closer eluting peaks finding more components – runs slower
Higher sensitivity will find smaller, noisier components but maybe more false positives – runs slower
Higher requires that EICs have exactly the same shape – fewer components found and more “uncertain” peaks may be present.
Page 15
E-seminar, October 2010

Comparison of Match Factors with AMDIS Settings
0
10
20
30
40
50
60
70
80
90
100
1 H VH M
2 H VH M
1 H H M
2 H H M
Page 16
E-seminar, October 2010
Adjacent peak subtraction (1 or 2) and Sensitivity (VH or H)
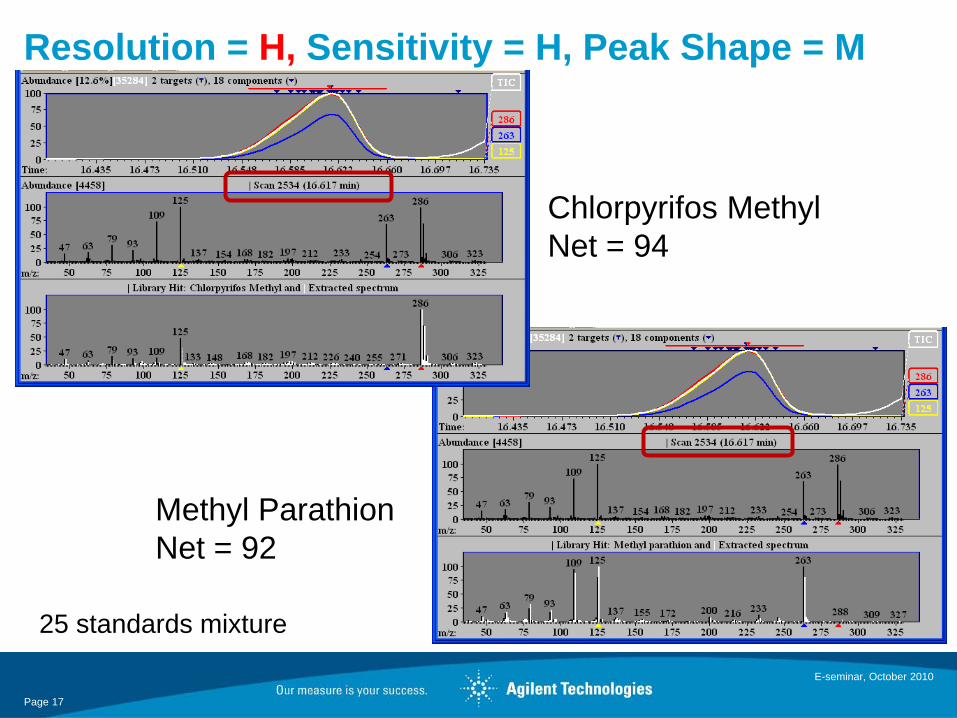
Resolution = H, Sensitivity = H, Peak Shape = M
E-seminar, October 2010
Page 17
Chlorpyrifos Methyl Net = 94
Methyl Parathion Net = 92
25 standards mixture

Resolution = M, Sensitivity = H, Peak Shape = M
E-seminar, October 2010
Page 18
Chlorpyrifos Methyl Net = 89
Methyl Parathion Net = 37
25 standards mixture

Comparison of Number of Compounds Found with Various AMDIS Settings (Spinach Extract, MF = 30)
Changing Resolution only
Changing Sensitivityonly
Changing Shape Requirement only
HHM
MHM
HMM
HHL
HVHM
HHH
35
31
33
32
35
33
Page 19
E-seminar, October 2010
0
20
40
60
80
100
120
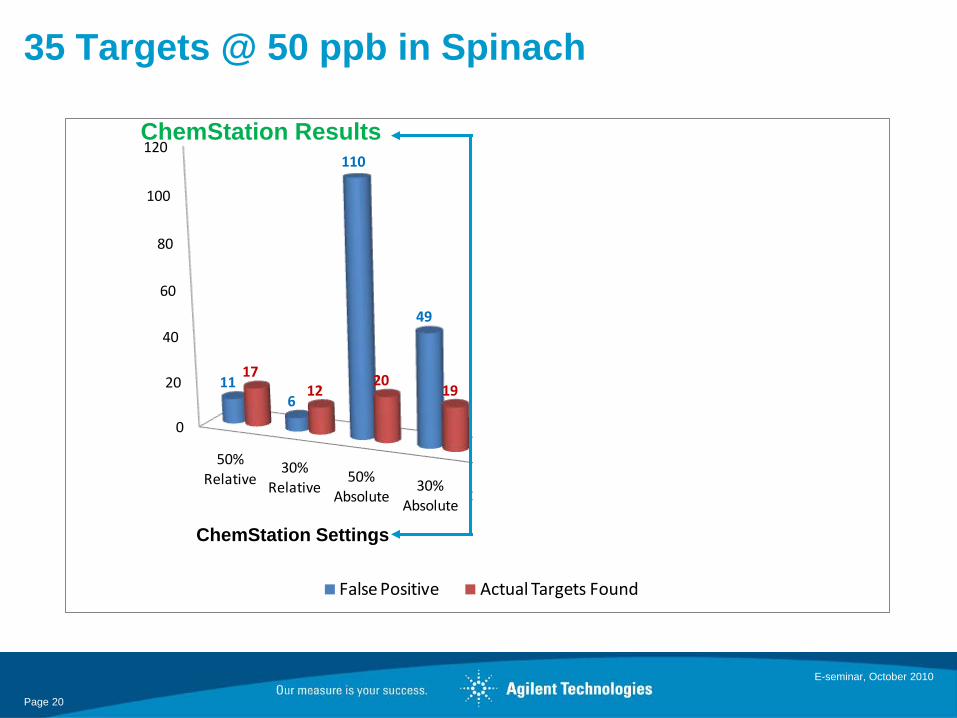
50% Relative
30% Relative
50% Absolute
30% Absolute
1 H VH M2 H VH M
1 H H M2 H H M
116
110
49
72
88
7383
1712
2019
35 35 35 35
False Positive Actual Targets Found
35 Targets @ 50 ppb in Spinach
AMDIS ResultsChemStation Results
AMDIS SettingsChemStation Settings
Page 20
E-seminar, October 2010

0
20
40
60
80
100
120
50% Relative
30% Relative
50% Absolute
30% Absolute
1 H VH M2 H VH M
1 H H M2 H H M
116
110
49
72
88
7383
1712
2019
35 35 35 35
False Positive Actual Targets Found
35 Targets @ 50 ppb in Spinach
AMDIS ResultsChemStation Results
AMDIS SettingsChemStation Settings
Page 21
E-seminar, October 2010
Deconvolution (AMDIS) Helps to Find all Compounds in a Complex Matrix.
Will Deconvolution Help in Quantitation?
E-seminar, October 2010
Page 22

Deconvolution Advantage – no baseline drift, noise-free, easier to integrate for more reliable quantitation results
13.60 13.70 13.80 13.90 14.00 14.10 14.20 14.30
0
2000
4000
6000
8000
10000
12000
14000
14.079|
|
|
|
|
|
14.078
Ion 123Ion 171Ion 128Ion 143AMDIS
Deconvolution shows a flat baseline
Page 23
E-seminar, October 2010
Deconvolution is fully integrated in MSD ChemStation.
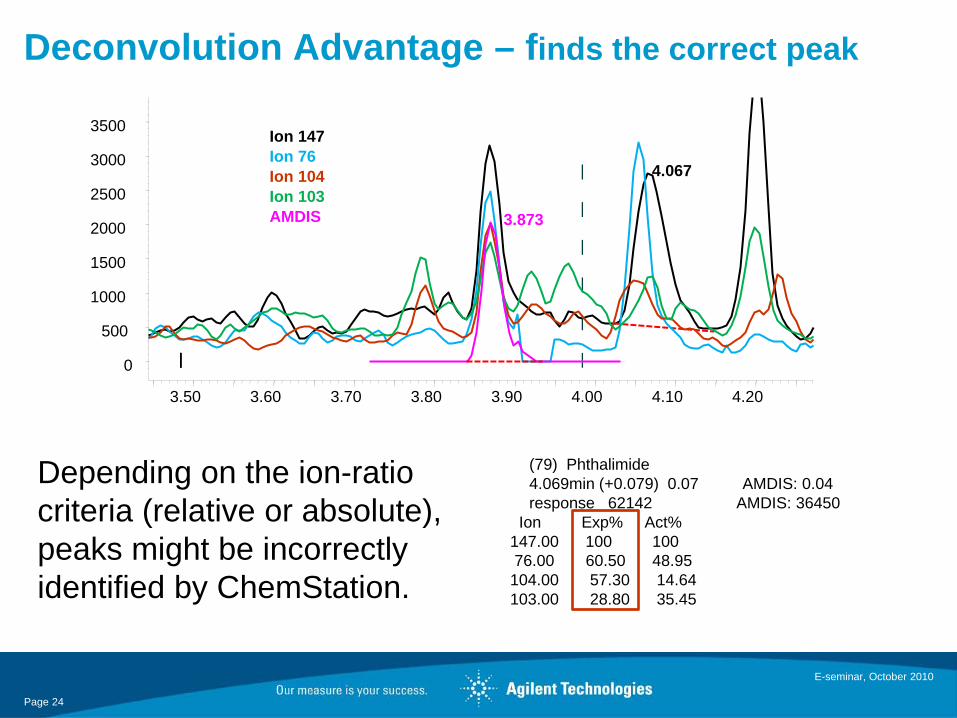
Deconvolution Advantage – finds the correct peak
3.50 3.60 3.70 3.80 3.90 4.00 4.10 4.20
0
500
1000
1500
2000
2500
3000
3500
4.067|
|
|
|
|
||||
3.873
Ion 147Ion 76Ion 104Ion 103AMDIS
103.00 28.80 35.45 104.00 57.30 14.64 76.00 60.50 48.95 147.00 100 100
Ion Exp% Act%response 62142 AMDIS: 364504.069min (+0.079) 0.07 AMDIS: 0.04 (79) Phthalimide
Page 24
E-seminar, October 2010
Depending on the ion-ratio criteria (relative or absolute), peaks might be incorrectly identified by ChemStation.

ChemStation could not discriminate co-eluting signals, Deconvolution isolates the target signal from the matrix
260.00 35.20 6.05 258.00 53.10 0.96# 177.00 64.50 73.85 175.00 100 100
Ion Exp% Act%response 8806390 AMDIS: 5543212.486min (+0.277) 9.89 AMDIS: 0.06 (604) Oxadiazon
Ion 175Ion 177Ion 258Ion 260AMDIS
11.70 11.90 12.10 12.30 12.50 12.700
1000200030004000500060007000
12.482
| ||||||
12.303
11.70 11.90 12.10 12.30 12.50 12.700
10000
20000
30000
40000
50000 12.482|
|
|
|
|
| ||||||12.303
Zoom in A factor of 150x !
Page 25
E-seminar, October 2010
Summary
• Deconvolution (AMDIS) finds more target compounds than ChemStation does with fewer false positives in a complex matrix. (Improved sensitivity?) This minimizes the time an analyst must spend reviewing results.
• Deconvolution provides a cleaned peak to be integrated properly for more reliable results. (Improved sensitivity?)
E-seminar, October 2010
Page 26
Using Deconvolution to Improve GC/MS Detection and Quantitation
References• Christopher P. Sandy, “A Blind Study of Pesticide Residues in Spiked and Unspiked Fruit
Extracts Using Deconvolution Reporting Software”Agilent Technologies publication, 5989-1654EN, October 2006
• M. Anastassiades, S. J. Lehotay, D. Stajnbaher, and F. J. Schenck, “Fast and Easy Multiresidue Method Employing Acetonitrile Extraction/Partitioning and ‘Dispersive Solid-Phase Extraction’ for the Determination of Pesticide Residues in Produce,” 2003, J. AOAC Int, 86:412–431
• S. J. Lehotay, K. Maštovská, and A.R. Lightfield, “Use of Buffering and Other Means to Improve Results of Problematic Pesticides in a Fast and Easy Method for Residue Analysis of Fruits and Vegetables,” 2005, J. AOAC Int, 88:615–629
• Philip L. Wylie, “Screening for 926 Pesticides and Endocrine Disruptors by GC/MS with Deconvolution Reporting Software and a New Pesticide Library,” Agilent Technologies publication, 5989-5076EN, April 2006
• Chin-Kai Meng and Mike Szelewski, “Replacing Multiple 50-Minute GC and GC-MS/SIM Analyses with One 15-Minute Full-Scan GC-MS Analysis for Nontargeted Pesticides Screening and >10x Productivity Gain” Agilent Technologies publication, 5989-7670EN, December 2007
• Chin-Kai Meng and Mike Szelewski , “Can Deconvolution Improve GC/MS Detectability?”, Agilent Technologies publication, 5990-5052EN, January 2010.
E-seminar, October 2010
Page 27