
Mq peptide-quantitation-tutorial-en
72
MultiQuant™ 3.0 Software Peptide Quantitation Tutorial RUO-IDV-05-0889-A August 2013
-
Upload
krishna-kumar -
Category
Science
-
view
172 -
download
0
Transcript of Mq peptide-quantitation-tutorial-en

MultiQuant™ 3.0 Software
Peptide Quantitation Tutorial
RUO-IDV-05-0889-AAugust 2013

AB Sciex Pte. Ltd.Blk 33, #04-06Marsiling Ind Estate Road 3Woodlands Central Indus. EstateSINGAPORE 739256
This document is provided to customers who have purchased AB SCIEX equipment to use in the operation of such AB SCIEX equipment. This document is copyright protected and any reproduction of this document or any part of this document is strictly prohibited, except as AB SCIEX may authorize in writing.
Software that may be described in this document is furnished under a license agreement. It is against the law to copy, modify, or distribute the software on any medium, except as specifically allowed in the license agreement. Furthermore, the license agreement may prohibit the software from being disassembled, reverse engineered, or decompiled for any purpose. Warranties are as stated therein.
Portions of this document may make reference to other manufacturers and/or their products, which may contain parts whose names are registered as trademarks and/or function as trademarks of their respective owners. Any such use is intended only to designate those manufacturers' products as supplied by AB SCIEX for incorporation into its equipment and does not imply any right and/or license to use or permit others to use such manufacturers' and/or their product names as trademarks.
AB SCIEX warranties are limited to those express warranties provided at the time of sale or license of its products and are AB SCIEX’s sole and exclusive representations, warranties, and obligations. AB SCIEX makes no other warranty of any kind whatsoever, expressed or implied, including without limitation, warranties of merchantability or fitness for a particular purpose, whether arising from a statute or otherwise in law or from a course of dealing or usage of trade, all of which are expressly disclaimed, and assumes no responsibility or contingent liability, including indirect or consequential damages, for any use by the purchaser or for any adverse circumstances arising therefrom.
For research use only. Not for use in diagnostic procedures.
The trademarks mentioned herein are the property of AB Sciex Pte. Ltd. or their respective owners.
AB SCIEX™ is being used under license.
© 2013 AB Sciex Pte. Ltd.
Printed in Canada.
MultiQuant™ 3.0 Software Peptide Quantitation Tutorial
2 of 72 RUO-IDV-05-0889-A — August 2013

Contents
Peptide Quantitation . . . . . . . . . . . . . . . . . . . . . . . . . . . . . . . . . . . . . . . . . . . . . . . . 5
Objectives . . . . . . . . . . . . . . . . . . . . . . . . . . . . . . . . . . . . . . . . . . . . . . . . . . . . . . .5Related Documentation . . . . . . . . . . . . . . . . . . . . . . . . . . . . . . . . . . . . . . . . . . . . .5Example Files . . . . . . . . . . . . . . . . . . . . . . . . . . . . . . . . . . . . . . . . . . . . . . . . . . . .5About Calibration Curves . . . . . . . . . . . . . . . . . . . . . . . . . . . . . . . . . . . . . . . . . . .6About the MultiQuant Software . . . . . . . . . . . . . . . . . . . . . . . . . . . . . . . . . . . . . . .6What is Multiple Reaction Monitoring? . . . . . . . . . . . . . . . . . . . . . . . . . . . . . . . . .6Relative Quantitation . . . . . . . . . . . . . . . . . . . . . . . . . . . . . . . . . . . . . . . . . . . . . . .7Absolute Quantitation . . . . . . . . . . . . . . . . . . . . . . . . . . . . . . . . . . . . . . . . . . . . . .8Relative Quantitation Using the MultiQuant Software . . . . . . . . . . . . . . . . . . . . .10
Set the Peak Integration Parameters . . . . . . . . . . . . . . . . . . . . . . . . . . . . . . .10Create a Results Table . . . . . . . . . . . . . . . . . . . . . . . . . . . . . . . . . . . . . . . . . .11Modify the Results Table . . . . . . . . . . . . . . . . . . . . . . . . . . . . . . . . . . . . . . . . .21Create Reports . . . . . . . . . . . . . . . . . . . . . . . . . . . . . . . . . . . . . . . . . . . . . . . .26
Process Data Acquired Using the Scheduled MRM Algorithm . . . . . . . . . . . . . .28Create a Results Table . . . . . . . . . . . . . . . . . . . . . . . . . . . . . . . . . . . . . . . . . .29Run Queries . . . . . . . . . . . . . . . . . . . . . . . . . . . . . . . . . . . . . . . . . . . . . . . . . .38
Accurate Quantitation Using Calibration Curves . . . . . . . . . . . . . . . . . . . . . . . . .40Set the Peak Integration Parameters . . . . . . . . . . . . . . . . . . . . . . . . . . . . . . .40Create a Results Table . . . . . . . . . . . . . . . . . . . . . . . . . . . . . . . . . . . . . . . . . .41Modify the Results Table . . . . . . . . . . . . . . . . . . . . . . . . . . . . . . . . . . . . . . . . .51View Calibration Curves . . . . . . . . . . . . . . . . . . . . . . . . . . . . . . . . . . . . . . . . .57Evaluate the Statistics of the Standard Calibration Curve . . . . . . . . . . . . . . . .60Export Calibration Curves . . . . . . . . . . . . . . . . . . . . . . . . . . . . . . . . . . . . . . . .61Create a Metric Plot . . . . . . . . . . . . . . . . . . . . . . . . . . . . . . . . . . . . . . . . . . . . .62Process Unknown Samples . . . . . . . . . . . . . . . . . . . . . . . . . . . . . . . . . . . . . . .63Create Reports . . . . . . . . . . . . . . . . . . . . . . . . . . . . . . . . . . . . . . . . . . . . . . . .70
Peptide Quantitation Tutorial MultiQuant™ 3.0 Software
RUO-IDV-05-0889-A — August 2013 3 of 72

Contents
MultiQuant™ 3.0 Software Peptide Quantitation Tutorial
4 of 72 RUO-IDV-05-0889-A — August 2013

Peptide Quantitation
ObjectivesThis tutorial describes how to use the MultiQuant™ software to quantitatively process MRM data acquired on any QTRAP® system or triple quadrupole system.
You can use the MultiQuant software to process data from many different types of quantitativeMS-based experiments. While the software is very flexible and allows for many different types ofexperiments to be processed, an overview of two main workflows is provided in this tutorial. Inparticular, only MRM workflows are discussed although the program can also be used to processscan mode data.
For more information about the software features, refer to the Reference Guide. This guide provides a description of the functionality available in the MultiQuant software.
The two main types of quantitative analysis that are covered in this tutorial are relative quantitation and accurate quantitation.
To learn about relative quantitation go to:
• Relative Quantitation Using the MultiQuant Software on page 10
• Process Data Acquired Using the Scheduled MRM Algorithm on page 28
To learn about accurate quantitation go to:
• Accurate Quantitation Using Calibration Curves on page 40
Related DocumentationThe MultiQuant software documentation can be found under the MultiQuant software Help menu. The Analyst® software documentation can be found under the Start menu: All Programs > AB SCIEX > Analyst.
• Reference Guide for the MultiQuant software
• Laboratory Director’s Guide for the Analyst software
• Standard Quantitation Tutorial for the Analyst software
• Getting Started Guide for the Analyst software
• Instrument operator’s manual for your instrument (if you are using a pre 1.5 version of the Analyst software)
Example FilesData files used in this tutorial are provided with the software and can be found in the following folders:
• For Windows 7: C:\ProgramData\AB SCIEX\MultiQuant\Example Data
Peptide Quantitation Tutorial MultiQuant™ 3.0 Software
RUO-IDV-05-0889-A — August 2013 5 of 72

Peptide Quantitation
• Tutorial Dataset Heavy_Light.wiff is the file for the relative quantitation experiment
• mTRAQ HumPlas Apo sMRM 1.wiff is the file acquired using the Scheduled MRM™ algorithm
• Pep Quant Curve 1.wiff and Pep Quant Samples A.wiff are the two files for the accurate quantitation experiment
• For Windows XP: C:\Documents and Settings\All Users\Application Data\AB SCIEX\MultiQuant\Example Data
• Tutorial Dataset Heavy_Light.wiff is the file for the relative quantitation experiment
• mTRAQ HumPlas Apo sMRM 1.wiff is the file acquired using the Scheduled MRM™ algorithm
• Pep Quant Curve 1.wiff and Pep Quant Samples A.wiff are the two files for the accurate quantitation experiment
Copy the files to the <drive>:\Analyst Data\Projects\Example\Data\Example Data folder.
About Calibration CurvesA calibration curve (also know as a standard concentration curve) is a method for determining the concentration of a substance in an unknown sample by comparing the unknown sample to a set of standard samples of known concentration. The calibration curve is a plot of how the instrument responds (the analytical signal) to changes with the concentration of the analyte (the substance to be measured). The operator prepares a series of standards across a range of concentrations near the expected concentration of the analyte in the unknown.
About the MultiQuant SoftwareMultiQuant software has been specifically developed for users that have large numbers of MRM transitions or samples in their acquisition methods, although it can also be used effectively with acquisition methods that have smaller numbers of MRM transitions. The user interface has been designed to simplify processing of these data files.This software is also compatible with the MIDAS™ Workflow. Although the examples presented in this document all use proteomics data, the software is also useful for processing small molecule data.
MultiQuant software has the added ability to deal with stable isotope labeled components in a seamless manner. This type of work is done routinely in protein/peptide quantitation but also applies to other applications.
What is Multiple Reaction Monitoring?In Multiple Reaction Monitoring (MRM), Q1 is set to transmit only the precursor m/z of the peptide or other molecule, the collision energy is optimized to produce a diagnostic charged fragment of this peptide in Q2, and Q3 is set to transmit this diagnostic fragment only. Because of the short dwell times required (5 ms to 50 ms) and the ability to change rapidly between MRM transitions, many components (transitions) in a mixture can be monitored simultaneously in a single LC/MS/MS run.
MultiQuant™ 3.0 Software Peptide Quantitation Tutorial
6 of 72 RUO-IDV-05-0889-A — August 2013

Peptide Quantitation
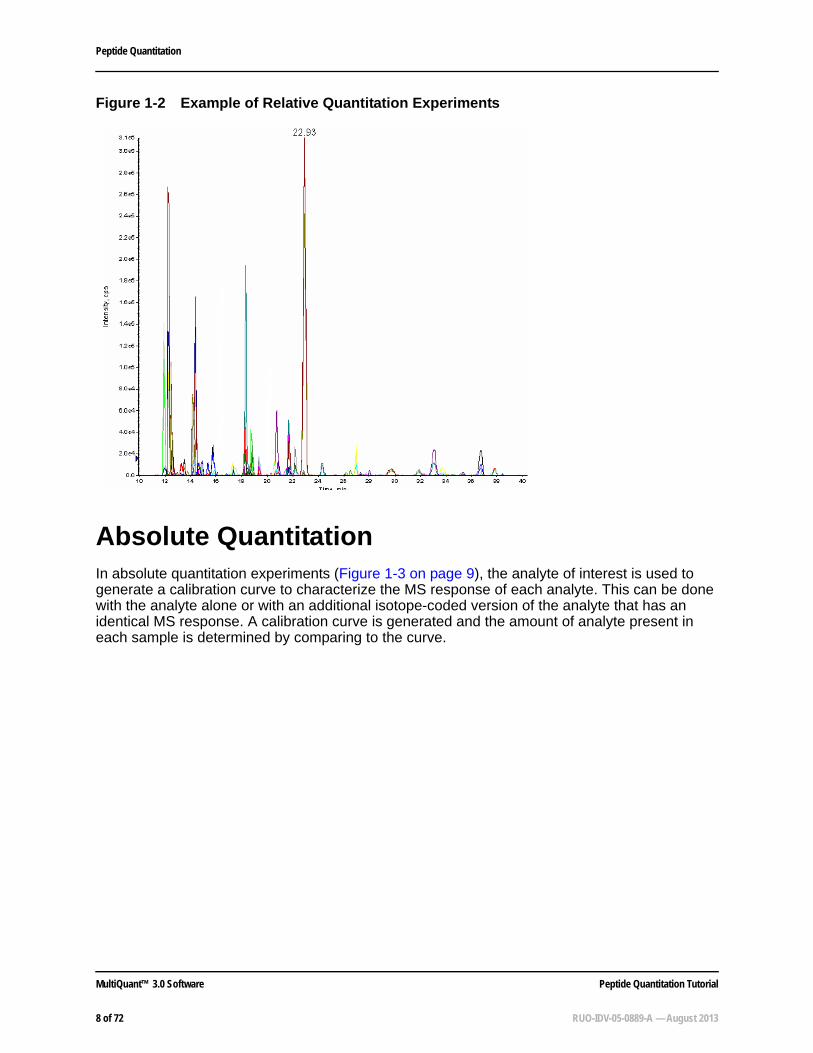
Relative QuantitationIn relative quantitation experiments (Figure 1-2 on page 8), the MRM peak areas from multiple MRMs can be determined across multiple samples and used to compare the relative amounts of analyte present in each sample. This can be done using raw MRM peak areas or by including isotope-coded internal standards and determining MRM peak area ratios. The example in this tutorial covers the case where there is an isotope-coded internal standard for each analyte of interest and the ratios between the analyte and the internal standard for each MRM are determined and compared between three samples.
Figure 1-1 Multiple Reaction Monitoring
Item Description1 Molecule
2 Fragment
1 2
Peptide Quantitation Tutorial MultiQuant™ 3.0 Software
RUO-IDV-05-0889-A — August 2013 7 of 72
Peptide Quantitation
Absolute QuantitationIn absolute quantitation experiments (Figure 1-3 on page 9), the analyte of interest is used to generate a calibration curve to characterize the MS response of each analyte. This can be done with the analyte alone or with an additional isotope-coded version of the analyte that has an identical MS response. A calibration curve is generated and the amount of analyte present in each sample is determined by comparing to the curve.
Figure 1-2 Example of Relative Quantitation Experiments
MultiQuant™ 3.0 Software Peptide Quantitation Tutorial
8 of 72 RUO-IDV-05-0889-A — August 2013

Peptide Quantitation
Figure 1-3 Example of an Absolute Quantitation Experiment
Peptide Quantitation Tutorial MultiQuant™ 3.0 Software
RUO-IDV-05-0889-A — August 2013 9 of 72

Peptide Quantitation
Relative Quantitation Using the MultiQuant SoftwareIn this section, you will learn how to process the MRM data from a relative quantitation experiment in which there is a heavy labeled peptide internal standard for every peptide of interest. First, the peak integration parameters are set before quantitative processing to avoid any reprocessing of data.
Topics in this section
• Set the Peak Integration Parameters on page 10
• Modify the Results Table on page 21
• Create Reports on page 26
Before you begin
• Make sure you are in the Example project.
• Make sure the Tutorial Dataset Heavy_Light.wiff file is in the <drive>:\Analyst Data\Projects\Example\Data\Example Data folder.
Set the Peak Integration Parameters1. In the Analyst® software, on the Navigation bar, under Companion Software,
double-click MultiQuant 3.0.
2. Click Edit > Project Integration Defaults.
3. In the Integration Defaults dialog, select MQ4 from the Integration Algorithm list. Good peak integration parameters for this dataset are shown in Figure 1-4 on page 11.
MultiQuant™ 3.0 Software Peptide Quantitation Tutorial
10 of 72 RUO-IDV-05-0889-A — August 2013

Peptide Quantitation
In many cases a smaller smoothing width (for example, 1.0) might be more appropriate. Also note that the peak review process is eased by specifying a non-zero Min. Peak Height, typically corresponding to at least one or two counts. Because the entered threshold should be in counts per second (cps) the actual value required depends on the dwell time. For example, for a dwell time of 100 ms, two counts corresponds to a setting of 20 cps.
When analyzing compounds for which there are multiple MRM transitions and which have been assigned to groups, the Group option of the Updated Expected RT parameter is generally the best choice. In this case, the expected retention time (RT) is updated using the position of maximum overlap of the individual chromatograms for the group (for each sample separately) within the RT window.
4. Adjust the values and then click OK.
Create a Results TableQuantitation methods include a set of instructions on how to quantitate the peaks selected for integration. In this tutorial, you will create a quantitation method at the same time that you create a Results Table. Use the following procedures to create a Results Table.
1. Click File > New Results Table.
2. On the Create Results Table - Select Samples page (Figure 1-5 on page 12), drag the Tutorial Dataset Heavy_Light.wiff file into the Selected pane and then click Next.
Figure 1-4 Integration Defaults Dialog
Note: If you are not using the Audit Trail with Security Features edition, then you can launch the MultiQuant software directly from the desktop icon.
Peptide Quantitation Tutorial MultiQuant™ 3.0 Software
RUO-IDV-05-0889-A — August 2013 11 of 72

Peptide Quantitation
3. On the Create Results Table - Select Method page (Figure 1-6 on page 13), click the Create New Method (MQ4) option and then click New.
Figure 1-5 Create Results Table - Select Samples Page
MultiQuant™ 3.0 Software Peptide Quantitation Tutorial
12 of 72 RUO-IDV-05-0889-A — August 2013

Peptide Quantitation
4. Type a name for the method, click Save, and then click Next.
In this tutorial, you will create a method. Creating methods gives you an opportunity to review and apply different parameters for the integration of your data.
5. On the Create Results Table - Select Representative Sample page (Figure 1-7 on page 14), a representative sample has been recommended and is selected. Click Next.
The software recommends a representative sample based on selecting a chromatogram that provides the best opportunity to select integration parameters that fit the entire batch.
Figure 1-6 Create Results Table - Select Method Page
Peptide Quantitation Tutorial MultiQuant™ 3.0 Software
RUO-IDV-05-0889-A — August 2013 13 of 72

Peptide Quantitation
On the Create Results Table - Define Components page, the details of the various analytes and internal standards to be processed must be defined. All the MRM transitions from the data file are automatically loaded into the window.
6. On the Create Results Table - Define Components page (Figure 1-8 on page 15), define all Group members by giving them the same name. In this example, there are four groups, each consisting of eight MRMs. The group names can be typed into the Group column or copied in from an Excel spreadsheet.
7. Type the peptide name in the first row only of each group (row 1, 9, 17, 25), and then right-click in the table and click Groups > By Filling Down Existing Groups. In this example, the first eight MRMs are named Peptide 1, the second eight rows are named Peptide 2, the third eight are named Peptide 3, and the final eight rows are named Peptide 4.
Figure 1-7 Create Results Table - Select Representative Sample Page
MultiQuant™ 3.0 Software Peptide Quantitation Tutorial
14 of 72 RUO-IDV-05-0889-A — August 2013

Peptide Quantitation
The Groups can be named in many ways, depending on the compounds. Examples of group nomenclature are: using the peptide sequence as the group name or using the Protein name_Peptide sequence.
8. Copy the Group column into the Name column. Right-click in the table and then click Groups > Add Group to Start of Component Name.
The Name and Group columns are shown in Figure 1-9 on page 16.
Figure 1-8 Create Results Table - Define Components Page
Note: When you group MRM transitions together, they should correspond to the same compound, including the internal standard version of that compound.
Peptide Quantitation Tutorial MultiQuant™ 3.0 Software
RUO-IDV-05-0889-A — August 2013 15 of 72

Peptide Quantitation
9. Define the MRM transitions to be used as the internal standards for Peptide 1 only by selecting the check boxes in the IS column as shown in Figure 1-10 on page 17. In this example, the last four transitions in each group are the internal standards for the first four transitions in the group.
10. After an MRM transition has been defined as an internal standard, it can be associated with the correct analyte in the IS Name column. Click the right side of each row within this column and then select the internal standard from the list that is shown (Figure 1-10 on page 17).
11. Select the appropriate internal standard from the list for each of the first four MRM transitions for Peptide 1. Within the group, the fifth MRM is the IS for the first row, the sixth MRM is the IS for the second row, and so on.
Figure 1-9 Name and Group Columns
MultiQuant™ 3.0 Software Peptide Quantitation Tutorial
16 of 72 RUO-IDV-05-0889-A — August 2013

Peptide Quantitation
12. To propagate this format to all the groups in the data file, select the first row for Peptide 1, right-click and then click Internal Standards > Set for all Groups as for Selected Group.
The structure of the Peptide 1 group is applied to Peptide 2, 3 and 4 groups as shown in Figure 1-11 on page 18.
Figure 1-10 Associating Internal Standards
Note: The pattern of sample and IS MRMs must be constant throughout the data file to be able to propagate the set pattern. This reduces the manual interaction required when setting up the processing method.
Peptide Quantitation Tutorial MultiQuant™ 3.0 Software
RUO-IDV-05-0889-A — August 2013 17 of 72

Peptide Quantitation
13. Click Next.
On the Create Results Table - Define Integration page (Figure 1-13 on page 20), the appropriate peak integration parameters are defined for each individual MRM. Each MRM peak has been automatically integrated, but you have the option to adjust the peak integration (that is, retention time of integrated peak) for each MRM.
Figure 1-11 Set for all Groups as for Selected Group Option
Tip! This highlights one option for structuring the use of internal standards. For more information on how to use the internal standards, refer to the Software Reference Guide.
Note: If a multi-period experiment was used, the previous steps must be repeated for each period. To switch between periods, select the period from the Experiment list and then repeat the process of setting up the processing method as described.
MultiQuant™ 3.0 Software Peptide Quantitation Tutorial
18 of 72 RUO-IDV-05-0889-A — August 2013
Peptide Quantitation
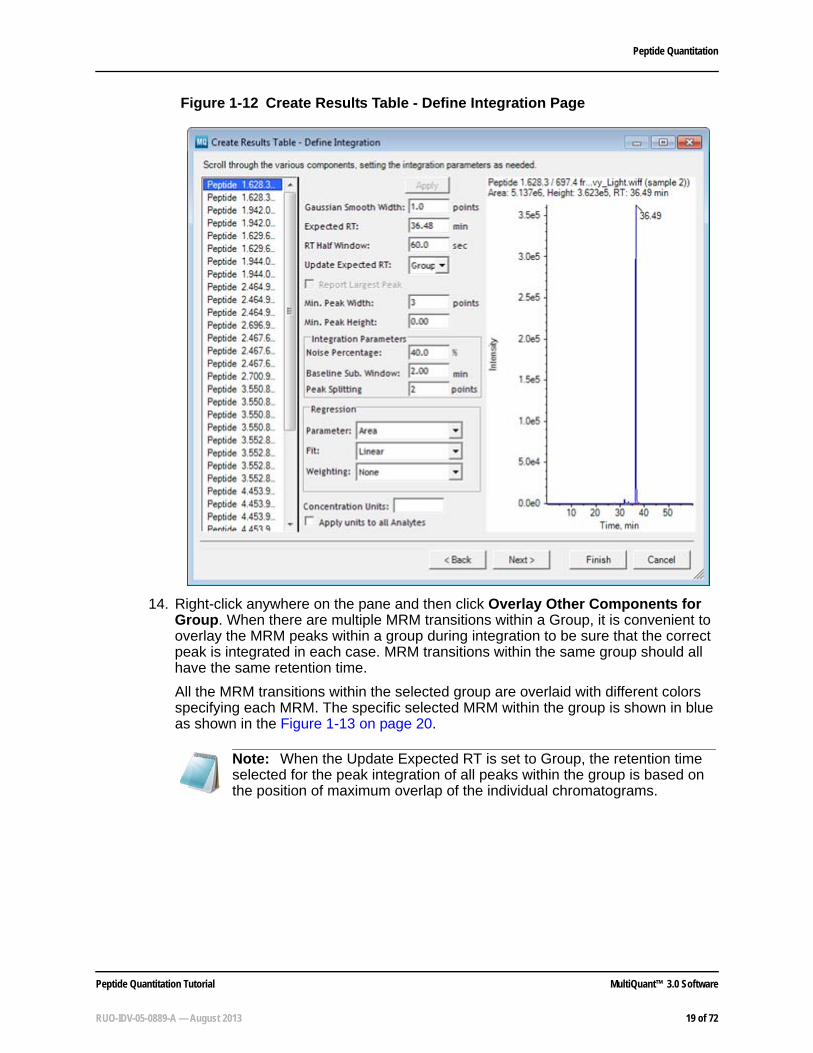
14. Right-click anywhere on the pane and then click Overlay Other Components for Group. When there are multiple MRM transitions within a Group, it is convenient to overlay the MRM peaks within a group during integration to be sure that the correct peak is integrated in each case. MRM transitions within the same group should all have the same retention time.
All the MRM transitions within the selected group are overlaid with different colors specifying each MRM. The specific selected MRM within the group is shown in blue as shown in the Figure 1-13 on page 20.
Figure 1-12 Create Results Table - Define Integration Page
Note: When the Update Expected RT is set to Group, the retention time selected for the peak integration of all peaks within the group is based on the position of maximum overlap of the individual chromatograms.
Peptide Quantitation Tutorial MultiQuant™ 3.0 Software
RUO-IDV-05-0889-A — August 2013 19 of 72

Peptide Quantitation
15. Each MRM transition can be viewed by clicking the specific MRM in the list, or by using the Up and Down arrows to automatically advance through the list. When an individual MRM transition has not been integrated at the right retention time, the correct peak can be selected by dragging across it on the pane . The peak is automatically reintegrated. In some cases it might be necessary to adjust the peak-finding parameters.
If multiple periods are present in the method, all MRM transitions within all periods are integrated in this pane as a single list.
16. After all the MRM transitions have been reviewed and the correct retention times defined for each, click Next.
Figure 1-13 Overlay Other Components for Group Option
MultiQuant™ 3.0 Software Peptide Quantitation Tutorial
20 of 72 RUO-IDV-05-0889-A — August 2013
Peptide Quantitation
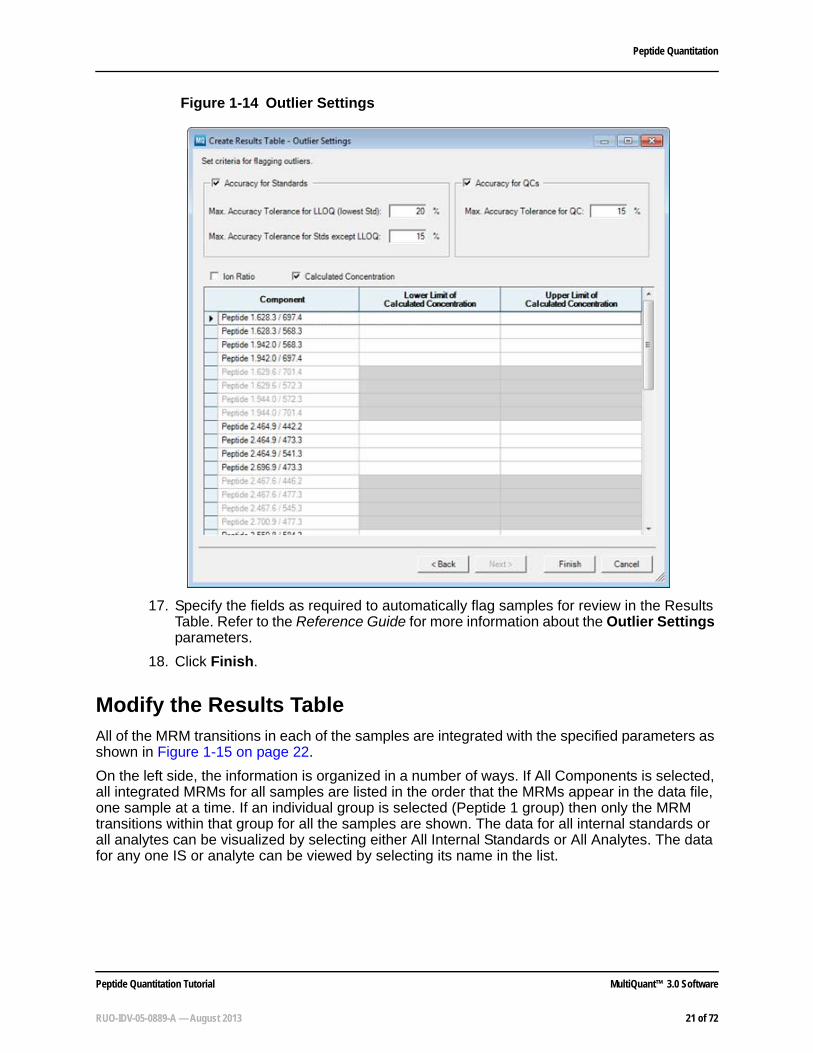
17. Specify the fields as required to automatically flag samples for review in the Results Table. Refer to the Reference Guide for more information about the Outlier Settings parameters.
18. Click Finish.
Modify the Results TableAll of the MRM transitions in each of the samples are integrated with the specified parameters as shown in Figure 1-15 on page 22.
On the left side, the information is organized in a number of ways. If All Components is selected, all integrated MRMs for all samples are listed in the order that the MRMs appear in the data file, one sample at a time. If an individual group is selected (Peptide 1 group) then only the MRM transitions within that group for all the samples are shown. The data for all internal standards or all analytes can be visualized by selecting either All Internal Standards or All Analytes. The data for any one IS or analyte can be viewed by selecting its name in the list.
Figure 1-14 Outlier Settings
Peptide Quantitation Tutorial MultiQuant™ 3.0 Software
RUO-IDV-05-0889-A — August 2013 21 of 72

Peptide Quantitation
1. Save the Results Table by clicking File > Save.
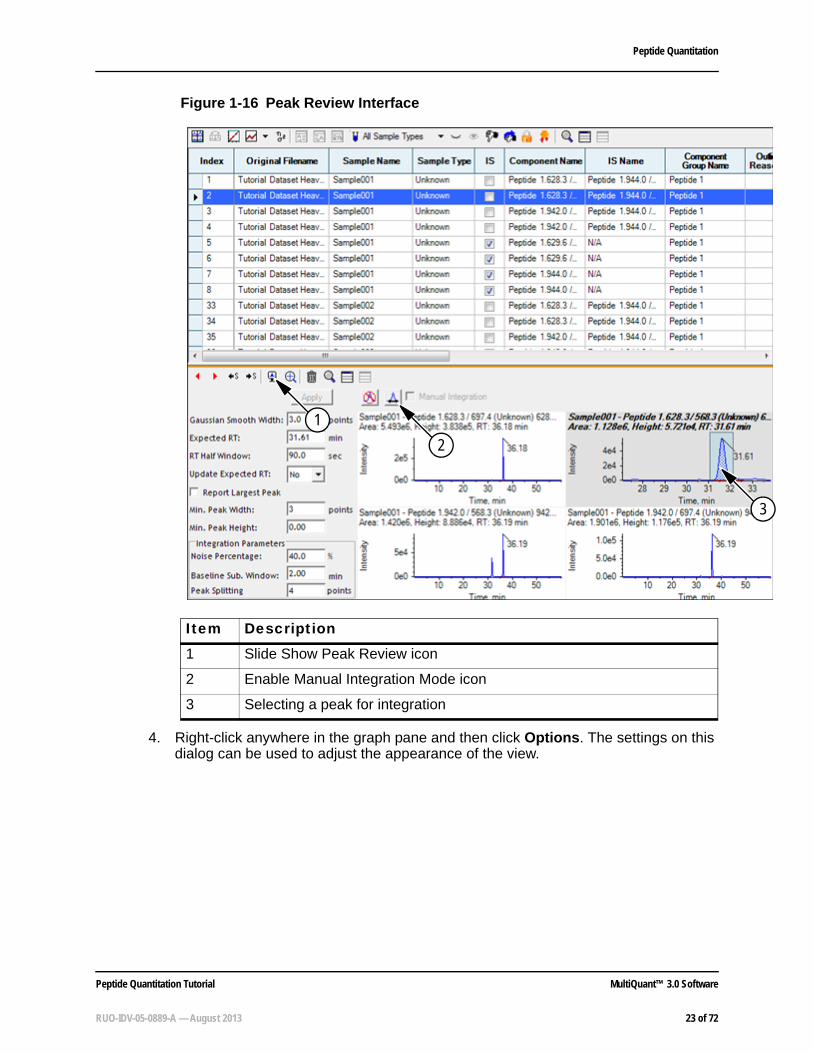
2. To visualize the MRM transitions for selected group for all samples, select a Peptide group (Figure 1-16 item 1) from the left panel and then click the Peak Review icon (Figure 1-16 item 2). If a row is selected within the table, the selected MRM transition is shown in the pane below with the name highlighted in bold. The up and down arrows or the scroll wheel on the mouse can be used to advance through the rows of the table to change the active pane.
3. If an incorrect peak is integrated, the correct peak can be selected and integrated by dragging the mouse across the peak. If the peak does not integrate, click the Enable Manual Integration Mode icon (Figure 1-16 item 2) to integrate manually. Define the peak area by dragging the mouse across the bottom of the peak area to be integrated (Figure 1-16 item 3). The selected peak integration are shown automatically by the peak filling.
Figure 1-15 Results Table Interface
Item Description1 Peptide group
2 Peak Review icon
1
2
MultiQuant™ 3.0 Software Peptide Quantitation Tutorial
22 of 72 RUO-IDV-05-0889-A — August 2013
Peptide Quantitation
3
4. Right-click anywhere in the graph pane and then click Options. The settings on this dialog can be used to adjust the appearance of the view.
Figure 1-16 Peak Review Interface
Item Description1 Slide Show Peak Review icon
2 Enable Manual Integration Mode icon
3 Selecting a peak for integration
2
1
Peptide Quantitation Tutorial MultiQuant™ 3.0 Software
RUO-IDV-05-0889-A — August 2013 23 of 72

Peptide Quantitation
5. From the toolbar, the slide show mode can be selected by clicking the Slide Show Peak Review icon (Figure 1-18 on page 24). This is a convenient way to review the data.
Figure 1-17 Peak Review Options Dialog
Figure 1-18 Slide Show Options Dialog
Tip! You can review the data within the Results Table in many ways. For example, the Area column can be selected by clicking on the column header and then selecting the Ascending Sort or Descending Sort (Figure 1-16). This sorts the data within the table.
MultiQuant™ 3.0 Software Peptide Quantitation Tutorial
24 of 72 RUO-IDV-05-0889-A — August 2013

Peptide Quantitation
6. To edit the structure of the Results Table and make sure that the required columns for determining calibration curves are visible, right-click in the table and then click Column Settings. Columns can be added or removed from the Results Table view by selecting or clearing the check boxes in the Visible column. For relative quantitation experiments, the common columns required are shown in Figure 1-19.
It is useful to sort on the Quality column. All the peaks with low quality scores can be viewed together and you can decide if it is necessary to reintegrate some of the peaks. Quality is computed by determining the percentage of the peak area that the integrated peak contributes to the total area under the MRM trace (in a region around the integrated peak, that is, 1.5 times the size of the user specified RT Window). For more information about Results Table columns, refer to the Reference Guide.
Figure 1-19 Quality Column
Peptide Quantitation Tutorial MultiQuant™ 3.0 Software
RUO-IDV-05-0889-A — August 2013 25 of 72

Peptide Quantitation
When you perform relative quantitation experiments, using internal standards provides extra robustness and quantitative accuracy and reproducibility. The Area Ratio column is the peak area of the analyte divided by the peak area of the corresponding internal standard.
If further manipulation of the data is required, the data can be exported and opened in other programs such as Microsoft Excel. For more information about the Export command, refer to the Reference Guide. Refer to Run Queries on page 38.
Create ReportsIf you are creating reports using unlocked Results Tables, make sure that you are allowed to create and export unlocked Results Tables. See your administrator if you are unable to create reports.
1. Click File > Create Report and Save Results Table.
Figure 1-20 Column Settings Dialog
Figure 1-21 Create Report Dialog
1
2
MultiQuant™ 3.0 Software Peptide Quantitation Tutorial
26 of 72 RUO-IDV-05-0889-A — August 2013
Peptide Quantitation
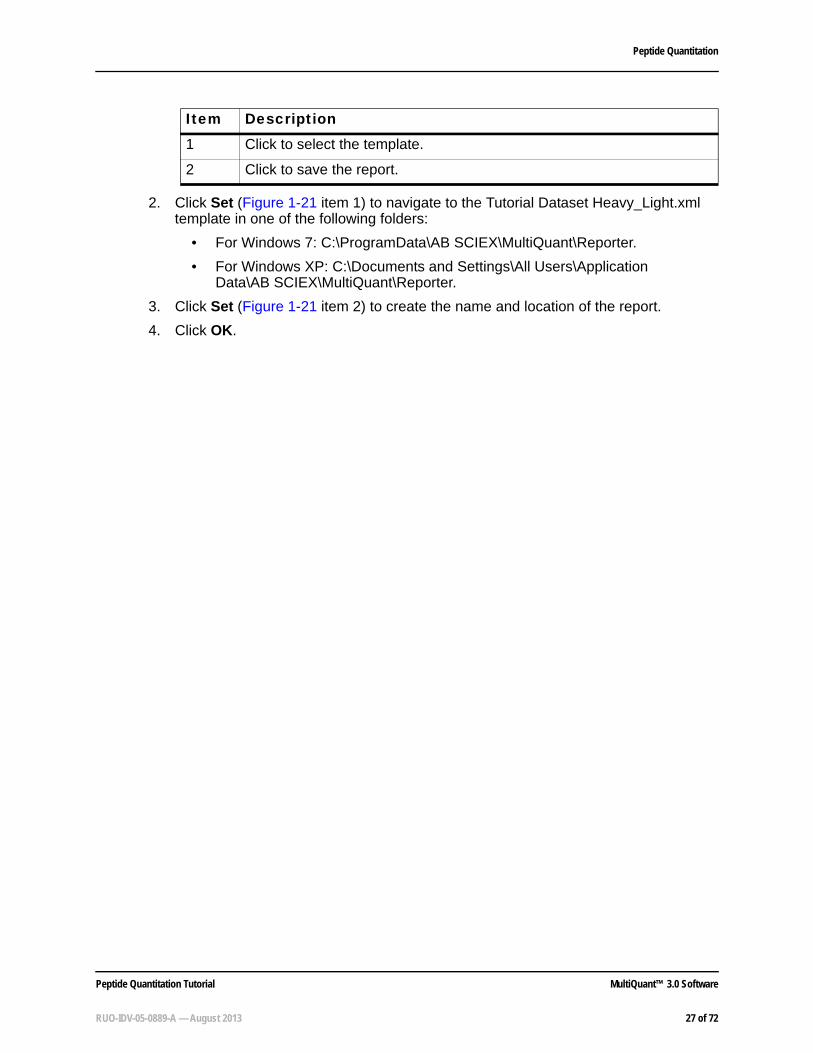
2. Click Set (Figure 1-21 item 1) to navigate to the Tutorial Dataset Heavy_Light.xml template in one of the following folders:
• For Windows 7: C:\ProgramData\AB SCIEX\MultiQuant\Reporter.
• For Windows XP: C:\Documents and Settings\All Users\Application Data\AB SCIEX\MultiQuant\Reporter.
3. Click Set (Figure 1-21 item 2) to create the name and location of the report.
4. Click OK.
Item Description1 Click to select the template.
2 Click to save the report.
Peptide Quantitation Tutorial MultiQuant™ 3.0 Software
RUO-IDV-05-0889-A — August 2013 27 of 72

Peptide Quantitation
Process Data Acquired Using the Scheduled MRM AlgorithmThe Scheduled MRM™ algorithm is a powerful acquisition tool in Analyst® software 1.5 or later versions that enables much higher multiplexing of MRM transitions per acquisition method. From the user-supplied retention time, individual acquisition windows are built for each separate analyte, minimizing the total number of MRM transitions monitored at any single point in time. This improves data quality by enabling the use of higher dwell times for every analyte.
Another feature in Analyst Software 1.5 and later is the ID column (Figure 1-23). Individual MRM transitions can be named in the Analyst software Acquisition Method Editor. The IDs should be of the in the following formats:
{Root Name}.{Group}.{IS Indicator}
Figure 1-22 Example of Scheduled MRM™ Algorithm Data
Figure 1-23 Example of the ID Column
MultiQuant™ 3.0 Software Peptide Quantitation Tutorial
28 of 72 RUO-IDV-05-0889-A — August 2013

Peptide Quantitation
The Group and IS Indicator are both optional. For small molecule applications, the IS Indicator should be absent for analytes and set to IS or internal standard for internal standards. For example if the IDs are:
• Compound1
• Compound1.IS
• Compound2
• Compound2.IS
Then Compound1.IS and Compound2.IS are both automatically set as internal standards. Additionally, Compound1 will be setup to use ‘Compound1.IS’ as its internal standard and similarly for Compound2.
For proteomics applications, the ID will usually be of the form:
{Peptide Sequence}.{Transition}.{Light or Heavy}
For more information about mTRAQ® reagent triplex support, refer to the Software Reference Guide. The nomenclature is as follows:
Protein.peptide.transition.M00
Protein.peptide.transition.M04
Protein. peptide. transition.M08
Topics in this section
• Create a Results Table on page 29
• Run Queries on page 38
Before you begin
• Set the integration parameter defaults. Refer to Set the Peak Integration Parameters on page 10.
• Make sure you are in the Example project.
• Make sure the mTRAQ HumPlas Apo sMRM 1.wiff file is in the <drive>:\Analyst Data\Projects\Example\Data\Example Data folder.
Create a Results TableQuantitation methods include a set of instructions on how to quantitate the peaks selected for integration. In this tutorial, you will create a quantitation method at the same time that you create a Results Table.
1. In the Analyst software, on the Navigation bar, under Companion Software, double-click Multiquant 3.0.
2. Click File > New Results Table.
3. On the Create Results Table - Select Samples page (Figure 1-24 on page 30), drag the mTRAQ HumPlas Apo sMRM 1.wiff file into the Selected pane and then click Next.
Peptide Quantitation Tutorial MultiQuant™ 3.0 Software
RUO-IDV-05-0889-A — August 2013 29 of 72

Peptide Quantitation
4. On the Create Results Table - Select Method page (Figure 1-25 on page 31), click the Create New Method (MQ4) option and then click New.
Figure 1-24 Create Results Table - Select Samples Page
Tip! If the interface has Create New Method (Signalfinder1), then refer to Set the Peak Integration Parameters on page 10 to change the algorithm to MQ4.
MultiQuant™ 3.0 Software Peptide Quantitation Tutorial
30 of 72 RUO-IDV-05-0889-A — August 2013

Peptide Quantitation
5. Type a name for the method, click Save, and then click Next.
In this tutorial, you will create a method. Creating methods gives you an opportunity to review and apply different parameters for the integration of your data.
6. On the Create Results Table - Select Representative Sample page (Figure 1-26 on page 32), a representative sample has been recommended and is selected. Click Next.
The software recommends a representative sample based on selecting a chromatogram that provides the best opportunity to select integration parameters that fit the entire batch.
Figure 1-25 Create Results Table - Select Method Page
Peptide Quantitation Tutorial MultiQuant™ 3.0 Software
RUO-IDV-05-0889-A — August 2013 31 of 72

Peptide Quantitation
On the Create Results Table - Define Components page (Figure 1-27 on page 33), the details of the various analytes and internal standards to be processed must be defined. All the MRM transitions from the data file are automatically loaded into the window.
Figure 1-26 Create Results Table - Select Representative Sample Page
Tip! When the ID column is correctly entered in the Analyst® software MRM acquisition method, the information is used to automatically populate the Group and internal standard information in the following pane.
MultiQuant™ 3.0 Software Peptide Quantitation Tutorial
32 of 72 RUO-IDV-05-0889-A — August 2013

Peptide Quantitation
7. Click Next.
8. On the Create Results Table - Define Integration page (Figure 1-28 on page 34), the automatic integrations can be reviewed. Because Update Expected RT is selected, the retention time is automatically determined from all members of each group as explained for the previous example. To see all members of each group, right-click and then click Overlay Other Components for Group.
Figure 1-27 Create Results Table - Define Components Page
Tip! The MRM transitions marked *.IS or *. heavy are automatically used as internal standards. However, if the light transitions are to be used as the internal standard, this can be easily reversed by right-clicking in the table and then clicking Internal Standards > Reverse Analyte/IS Assignments.
Note: If you acquire data using a MIDAS™ Workflow, there are additional experiments in the acquisition method because of the MS/MS spectra acquired. If you click Next before reviewing all the experiments, an error message is shown advising you to review all the experiments before proceeding. No review is required, click OK to continue.
Peptide Quantitation Tutorial MultiQuant™ 3.0 Software
RUO-IDV-05-0889-A — August 2013 33 of 72

Peptide Quantitation
9. Because the MRM data is collected using the Scheduled MRM™ algorithm, data is only collected over a short retention time. This is why a narrow time axis is shown for each group. Review each group and then click Next.
Figure 1-28 Create Results Table - Define Integration Page
MultiQuant™ 3.0 Software Peptide Quantitation Tutorial
34 of 72 RUO-IDV-05-0889-A — August 2013

Peptide Quantitation
10. Specify the fields as required to automatically flag samples for review in the Results Table. Refer to the Reference Guide for more information about the Outlier Settings parameters.
11. Click Finish.
12. After the Results Table opens, click the Peak Review icon.
Figure 1-29 Outlier Settings
Peptide Quantitation Tutorial MultiQuant™ 3.0 Software
RUO-IDV-05-0889-A — August 2013 35 of 72
Peptide Quantitation
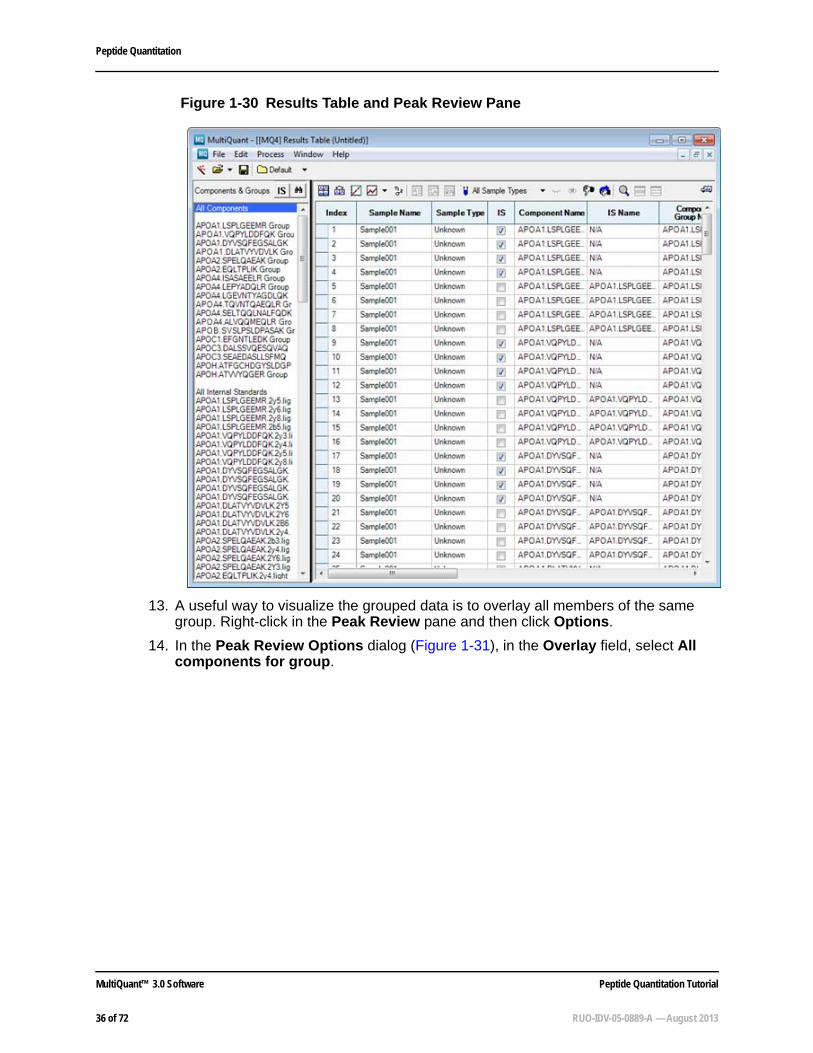
13. A useful way to visualize the grouped data is to overlay all members of the same group. Right-click in the Peak Review pane and then click Options.
14. In the Peak Review Options dialog (Figure 1-31), in the Overlay field, select All components for group.
Figure 1-30 Results Table and Peak Review Pane
MultiQuant™ 3.0 Software Peptide Quantitation Tutorial
36 of 72 RUO-IDV-05-0889-A — August 2013

Peptide Quantitation
Figure 1-31 Peak Review Options Dialog
Figure 1-32 Overlay: All components for group
Peptide Quantitation Tutorial MultiQuant™ 3.0 Software
RUO-IDV-05-0889-A — August 2013 37 of 72
Peptide Quantitation
Run QueriesThe primary purpose of queries is to allow potentially problem peak integrations to be flagged so that only a subset of the chromatograms needs to be manually reviewed. Queries can also be used to create and populate custom columns. Refer to the Software Reference Guide for more information on using and creating queries.
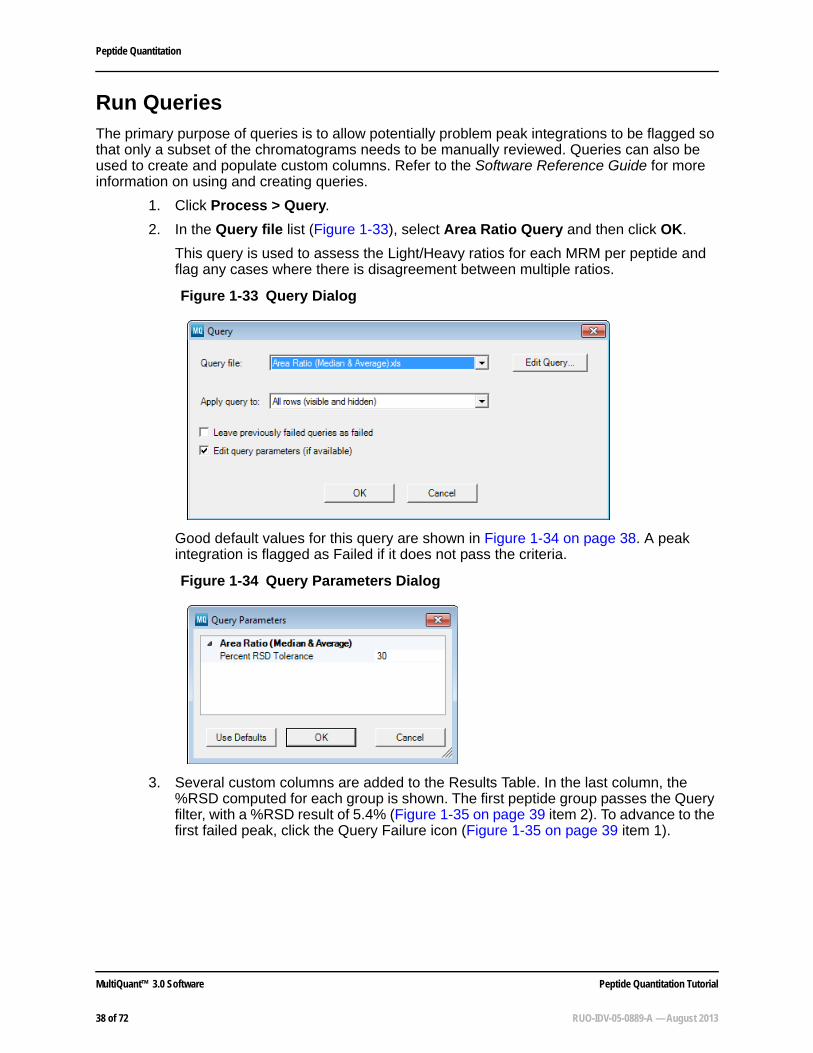
1. Click Process > Query.
2. In the Query file list (Figure 1-33), select Area Ratio Query and then click OK.
This query is used to assess the Light/Heavy ratios for each MRM per peptide and flag any cases where there is disagreement between multiple ratios.
Good default values for this query are shown in Figure 1-34 on page 38. A peak integration is flagged as Failed if it does not pass the criteria.
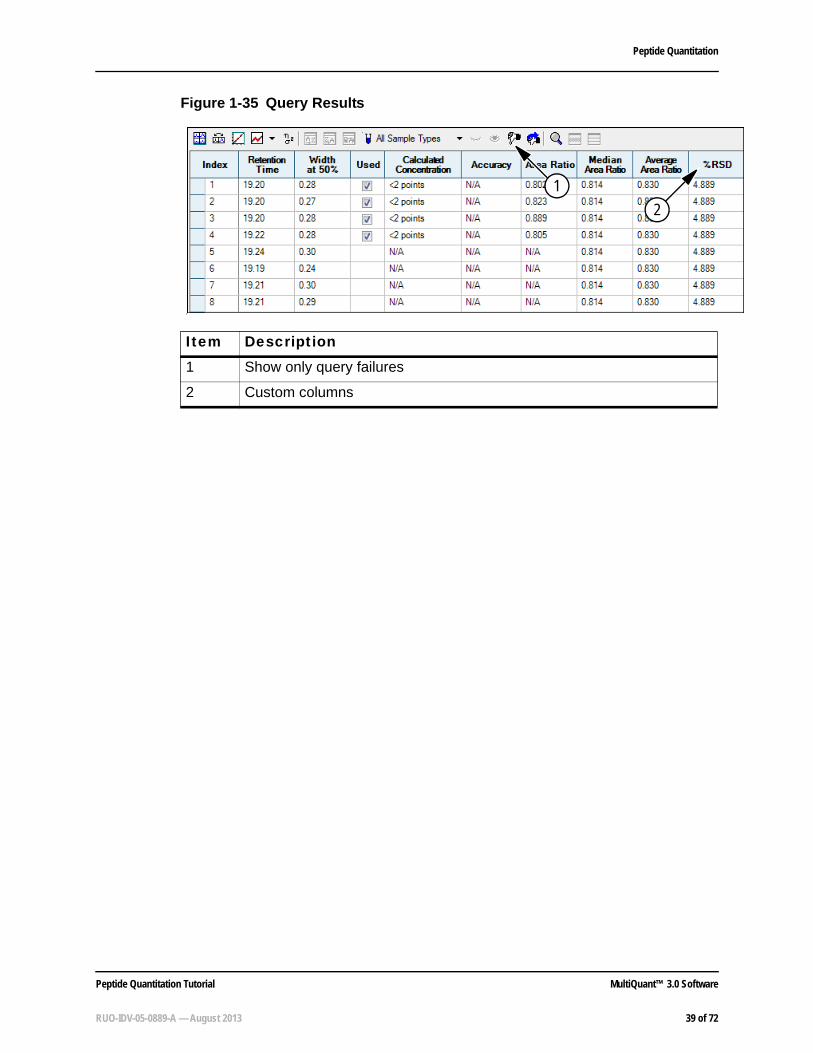
3. Several custom columns are added to the Results Table. In the last column, the %RSD computed for each group is shown. The first peptide group passes the Query filter, with a %RSD result of 5.4% (Figure 1-35 on page 39 item 2). To advance to the first failed peak, click the Query Failure icon (Figure 1-35 on page 39 item 1).
Figure 1-33 Query Dialog
Figure 1-34 Query Parameters Dialog
MultiQuant™ 3.0 Software Peptide Quantitation Tutorial
38 of 72 RUO-IDV-05-0889-A — August 2013
Peptide Quantitation
Figure 1-35 Query Results
o
Item Description1 Show only query failures
2 Custom columns
1
2
Peptide Quantitation Tutorial MultiQuant™ 3.0 Software
RUO-IDV-05-0889-A — August 2013 39 of 72

Peptide Quantitation
Accurate Quantitation Using Calibration CurvesWhen you perform accurate quantitation of peptides or proteins (using peptides as surrogates), it is possible to create stable isotope labeled peptides to use as concentration standards. These heavy peptides can be created using labeling strategies such as mTRAQ® reagents or by making synthetic peptides using stable isotope-labeled amino acids. By proper use of these peptides, experiments can be designed that leverage the internal standard concept and add robustness to your experiments.
A calibration curve can be generated for the accurate quantitation experiment using increasing concentrations of the “heavy peptide” in the presence of a constant amount of the biological sample of interest (the matrix that contains the light version of the same peptide). In this case, the endogenous light peptide acts as the constant internal standard for the calibration curve.
Topics in this section
• Set the Peak Integration Parameters on page 10
• Modify the Results Table on page 51
• Evaluate the Statistics of the Standard Calibration Curve on page 60
• Create a Metric Plot on page 62
• Process Unknown Samples on page 63
• Create Reports on page 70
Before you begin
• Make sure you are in the Example project.
• Make sure the Pep Quant Curve 1.wiff file and the Pep Quant Samples A.wiff file are in the <drive>:\Analyst Data\Projects\Example\Data\Example Data folder.
Set the Peak Integration Parameters1. In the Analyst® software, on the Navigation bar, under Companion Software,
double-click MultiQuant 3.0.
2. Click Edit > Project Integration Defaults.
3. In the Integration Defaults dialog, select MQ4 from the Integration Algorithm list. Good peak integration parameters for this dataset are shown in Figure 1-36.
Note: If you are not using the Audit Trail with Security Features edition, then you can launch the MultiQuant™ software directly from the desktop icon.
Note: If you are not using the Audit Trail and Security Features edition, then click Edit > User Integration Defaults.
MultiQuant™ 3.0 Software Peptide Quantitation Tutorial
40 of 72 RUO-IDV-05-0889-A — August 2013

Peptide Quantitation
In many cases a smaller smoothing width (for example, 1.0) might be more appropriate. Also note that the peak review process will be eased by specifying a non-zero Min. Peak Height, typically corresponding to at least one or two counts. Because the entered threshold should be in counts per second (cps), the actual value required will depend on the dwell time. For example, for a dwell time of 100 ms, two counts corresponds to a setting of 20 cps.
4. For this dataset, good results are achieved using the parameters shown in the previous figure. Adjust the values and then click OK.
Create a Results Table1. Click File > New Results Table.
2. On the Create Results Table - Select Samples page (Figure 1-37 on page 42), drag the Pep Quant Curve 1.wiff into the Selected pane and then click Next.
Figure 1-36 Integration Defaults dialog
Peptide Quantitation Tutorial MultiQuant™ 3.0 Software
RUO-IDV-05-0889-A — August 2013 41 of 72

Peptide Quantitation
3. On the Create Results Table - Select Method page (Figure 1-38 on page 43), click the Create New Method (MQ4) option and then click New.
Figure 1-37 Create Results Table - Select Samples page
MultiQuant™ 3.0 Software Peptide Quantitation Tutorial
42 of 72 RUO-IDV-05-0889-A — August 2013

Peptide Quantitation
4. Type a name for your method, click Save, and then click Next.
In this tutorial, you will create a new method. Creating new methods gives you an opportunity to review and apply different parameters for the integration of your data.
5. On the Create Results Table - Select Representative Sample page (Figure 1-39 on page 44), a representative sample has been recommended and is selected. Click Next.
The software recommends a representative sample based on selecting a chromatogram that provides the best opportunity to select integration parameters that fit the entire batch.
Figure 1-38 Create Results Table - Select Method page
Peptide Quantitation Tutorial MultiQuant™ 3.0 Software
RUO-IDV-05-0889-A — August 2013 43 of 72

Peptide Quantitation
6. On the Create Results Table - Define Components page (Figure 1-40 on page 45), the details of the various analytes and internal standards to be processed must be defined. This step is required because the ID field of the Analyst software Acquisition Method Editor was not completed as discussed in Process Data Acquired Using the Scheduled MRM Algorithm on page 28. All the MRM transitions from the data file are automatically loaded into the window. First, all the members of a Group must be defined by giving them the same name. In this example, there are three groups, each consisting of four MRMs. The group names can be typed into the Group column or copied from an Excel spreadsheet. The Groups can be named in many ways, depending on the compounds.
Figure 1-39 Create Results Table - Select Representative Sample page
MultiQuant™ 3.0 Software Peptide Quantitation Tutorial
44 of 72 RUO-IDV-05-0889-A — August 2013

Peptide Quantitation
7. In this example, name the first 4 MRMs Peptide 1, the second four rows Peptide 2, and the third four are Peptide 3. Type the peptide name in the first row only of each group (Rows 1, 5, 9), and then right-click in the table and then click Groups > By Filling Down Existing Groups (Figure 1-41 on page 46).
Figure 1-40 Create Results Table - Define Components page
Note: When you group MRM transitions together, they should be to the same compound, including the internal standard version of that compound.
Peptide Quantitation Tutorial MultiQuant™ 3.0 Software
RUO-IDV-05-0889-A — August 2013 45 of 72

Peptide Quantitation
8. Copy the Group column into the Name column. Right-click in the table and then click Groups > Add Group to Start of Component Name (Figure 1-42 on page 47).
Figure 1-41 Groups > By Filling Down Existing Groups option
Note: Specifying the names and groups here is necessary because this information was not specified in the original data acquisition method. Refer to the Tip on page 32 to learn how to use the ID field of the Acquisition Method Editor to enter this information.
MultiQuant™ 3.0 Software Peptide Quantitation Tutorial
46 of 72 RUO-IDV-05-0889-A — August 2013

Peptide Quantitation
9. Define the MRM transitions to be used as the internal standards by selecting the check boxes in the IS column. In this example, the last four transitions in each group are the internal standards for the first four transitions in the group. Select the IS boxes as shown in the following figure for Peptide 1.
10. After an MRM transition has been defined as an internal standard, it can be associated with the correct analyte in the IS Name column. By clicking on the right side of each row within this column, a list of internal standards is shown and can be selected. Select the appropriate internal standard from the list for each of the first two MRM transitions for Peptide 1. Within the group, the third MRM is the IS for the first row, the forth MRM is the IS for the second row (Figure 1-43 on page 48).
Figure 1-42 Groups > Add Group to Start of Component Name option
Peptide Quantitation Tutorial MultiQuant™ 3.0 Software
RUO-IDV-05-0889-A — August 2013 47 of 72

Peptide Quantitation
11. To propagate this format to all the groups in the data file, select the first row for Peptide 1, right-click and then click Internal Standards > Set for all Groups as for Selected Group (Figure 1-44 on page 49).
Figure 1-43 Selecting Internal Standards
Note: The pattern of sample and IS MRM transitions must be constant through the data file to be able to propagate the group pattern. This reduces the manual interaction required when setting up the processing method.
MultiQuant™ 3.0 Software Peptide Quantitation Tutorial
48 of 72 RUO-IDV-05-0889-A — August 2013

Peptide Quantitation
12. Click Next.
13. On the Create Results Table - Define Integration page (Figure 1-45 on page 50), the appropriate peak integration parameters will be defined for each individual MRM. Each MRM peak has been automatically integrated, but you have the option to adjust the peak integration (that is, retention time of integrated peak) for each MRM.
14. Each MRM transition can be viewed by clicking the specific MRM in the left pane list, or by using the Up / Down arrows or mouse scroll wheel to automatically advance through the list. When an individual MRM transition has not been integrated at the right retention time, the correct peak can be selected with the mouse by just dragging across it on the pane and it will be automatically reintegrated. In some cases it might also be necessary to adjust the peak-finding parameters.
Figure 1-44 Standards > Set for all Groups as for Selected Group Option
Note: If a multi-period experiment was used, the previous steps must be repeated for each period. To switch between periods, select the period from the Experiment list and then repeat the process of setting up the processing method as described. This dataset does not contain multiple periods.
Tip! If required, multiple MRM transitions for the same analyte can be summed during data processing. Right-click in the Define Components table and then click Sum Multiple Ions.
Peptide Quantitation Tutorial MultiQuant™ 3.0 Software
RUO-IDV-05-0889-A — August 2013 49 of 72

Peptide Quantitation
If multiple periods are present in the method, all MRM transitions within all periods are integrated in this pane as a single list.
15. Select the parameters for generating the calibration curve. Typically, the peak area is used in the calculation. In the Regression group, select the following and then click Apply:
• Parameter: Area
• Fit: Linear
• Weighting: 1/x.
Typically, the peak area is used in the calculation. A linear calibration curve with a weighting of 1/x is most commonly used for calculating the calibration curve.
16. Click Next.
Figure 1-45 Create Results Table - Define Integration page
MultiQuant™ 3.0 Software Peptide Quantitation Tutorial
50 of 72 RUO-IDV-05-0889-A — August 2013

Peptide Quantitation
17. Specify the fields as required to automatically flag samples for review in the Results Table. Refer to the Reference Guide for more information about the Outlier Settings parameters.
18. Click Finish.
Modify the Results TableAll of the MRM transitions in each of the samples are integrated with the specified parameters as shown in Figure 1-47 on page 52.
On the left side, the information is organized in a number of ways. If All Components is selected, all integrated MRMs for all samples are listed in the order that the MRMs appear in the data file, one sample at a time. If an individual group is selected (Peptide 1 Group) then only the MRM transitions within that group for all the samples are shown. The data for all internal standards or all analytes can be visualized by selected either All Internal Standards or All Analytes. Finally, the data for any one IS or analyte can be viewed by selecting its name in the list.
Figure 1-46 Outlier Settings
Peptide Quantitation Tutorial MultiQuant™ 3.0 Software
RUO-IDV-05-0889-A — August 2013 51 of 72

Peptide Quantitation
1. Save the Results Table by clicking File > Save.
2. To visualize the MRM transitions for selected group for all samples, select a Peptide Group (Figure 1-48 on page 53 item 1) from the left panel and then click the Peak Review icon (Figure 1-48 on page 53 item 2). If a row is selected within the table, the selected MRM transition is shown in the pane below with the name highlighted in bold. The Up / Down arrows or the scroll wheel on the mouse can be used to advance through the rows of the table to change the active pane.
3. If an incorrect peak is integrated, the correct peak can be selected and integrated by dragging the mouse across the peak. If the peak does not integrate, click the Enable Manual Integration Mode icon (Figure 1-48 on page 53 item 2) to integrate manually. Define the peak area by dragging the mouse across the bottom of the peak area to be integrated. The selected peak integration will be shown automatically by the peak filling.
Figure 1-47 Results Table Interface
Item Description1 Peptide Group
2 Peak Review icon
1
2
MultiQuant™ 3.0 Software Peptide Quantitation Tutorial
52 of 72 RUO-IDV-05-0889-A — August 2013

Peptide Quantitation
4. To edit the structure of the Results Table and ensure that the required columns for determining calibration curves are visible, right-click in the table and then click Column Settings. Columns can be added or removed from the Results Table view by selecting or clearing the check boxes in the Visible column.
Recommended columns to use for accurate quantitation include: Sample Index, Sample Name, Sample Type, Actual Concentration, Area, IS Area, S/N, Modified, Used, Calculated Concentration and Accuracy.
Figure 1-48 Peak Review Interface
Item Description1 Sort buttons
2 Enable Manual Integration Mode icon
Tip! You can review the data within the Results Table in many ways. For example, the Area column can be selected by clicking on the column header and then selecting the Ascending Sort or Descending Sort (Figure 1-48 on page 53 item 1). This sorts the data within the table.
1
2
Peptide Quantitation Tutorial MultiQuant™ 3.0 Software
RUO-IDV-05-0889-A — August 2013 53 of 72

Peptide Quantitation
5. The information about the internal standards and samples must be defined. Select one of the peptide MRMs under All Internal Standards and then enter the Actual Concentration (25 in this example) in the correct column for the first sample. Select the column by clicking the column header, and then click Edit > Fill Down (Figure 1-50 on page 55). The concentration are filled in down the column.
Figure 1-49 Column Settings Dialog
MultiQuant™ 3.0 Software Peptide Quantitation Tutorial
54 of 72 RUO-IDV-05-0889-A — August 2013

Peptide Quantitation
6. To translate this information to all peptide MRMs, right-click anywhere in the Results Table and then click Apply Current IS’s Actual Concentration to All. Click another peptide under All Internal Standards and make sure that each Actual Concentration is 25.
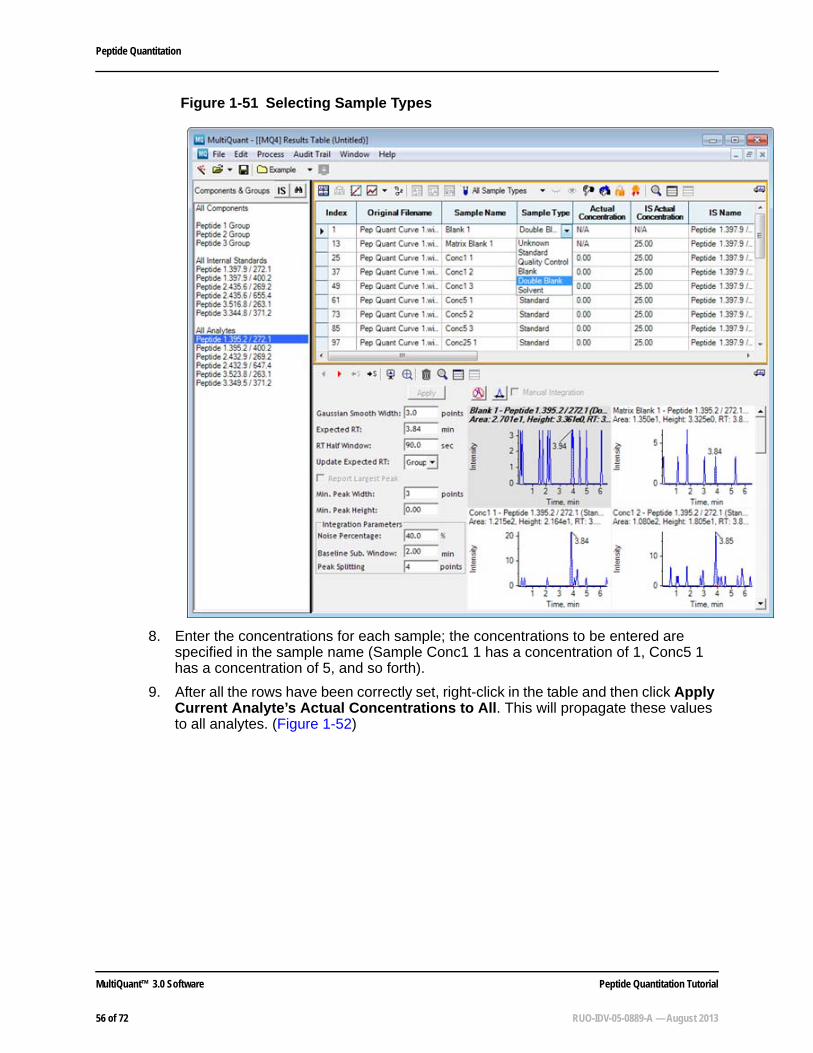
7. The sample types for each sample in the data file must be defined. Select one of the peptide MRMs under All Analytes. Select the correct Sample Type for each row by clicking the right corner of the Sample Type box and then selecting the correct sample type. The Blank 1 in row 1 is a double blank as it contains no analyte or no internal standard (note the IS Actual Concentration is reset to N/A). The Matrix Blank 1 in row 2 is the blank as it contains only the internal standards. The remaining rows are all Standard samples and will be used for calculating the concentration curve. An alternative approach is to first set all samples to Standard using the Fill Down command and then to adjust the type for the first two samples Figure 1-51 on page 56).
Figure 1-50 Edit > Fill Down Option
Peptide Quantitation Tutorial MultiQuant™ 3.0 Software
RUO-IDV-05-0889-A — August 2013 55 of 72
Peptide Quantitation
8. Enter the concentrations for each sample; the concentrations to be entered are specified in the sample name (Sample Conc1 1 has a concentration of 1, Conc5 1 has a concentration of 5, and so forth).
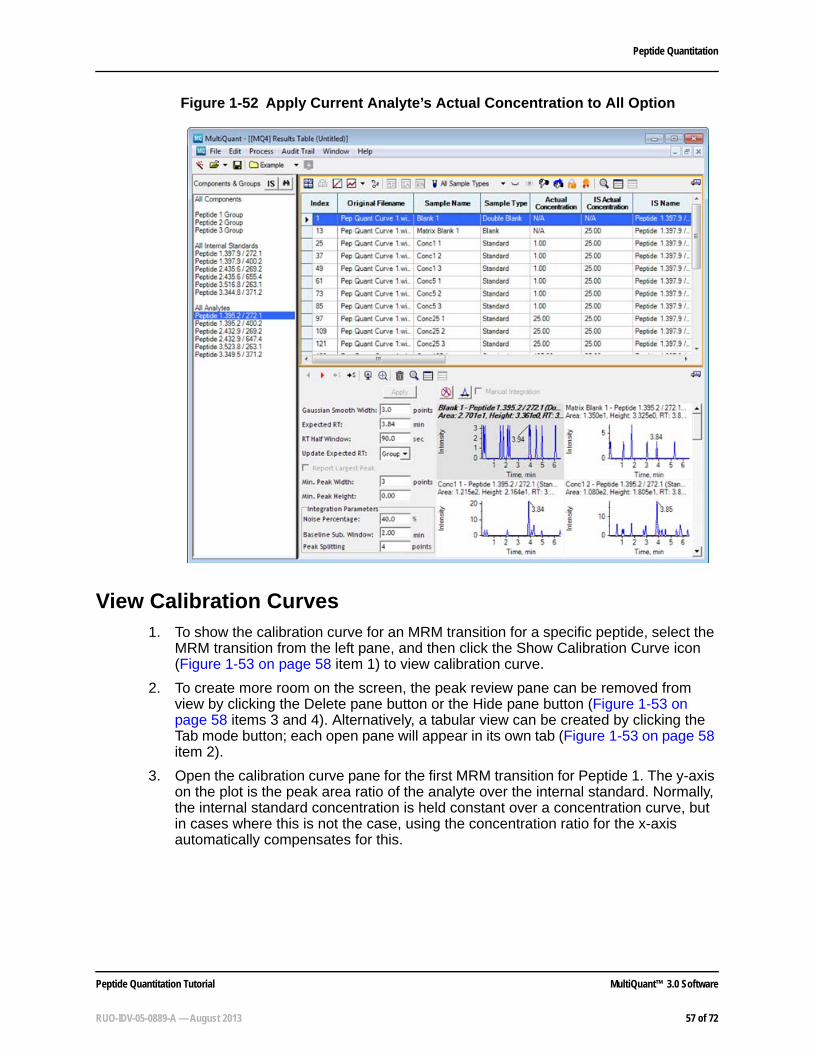
9. After all the rows have been correctly set, right-click in the table and then click Apply Current Analyte’s Actual Concentrations to All. This will propagate these values to all analytes. (Figure 1-52)
Figure 1-51 Selecting Sample Types
MultiQuant™ 3.0 Software Peptide Quantitation Tutorial
56 of 72 RUO-IDV-05-0889-A — August 2013
Peptide Quantitation
View Calibration Curves1. To show the calibration curve for an MRM transition for a specific peptide, select the
MRM transition from the left pane, and then click the Show Calibration Curve icon (Figure 1-53 on page 58 item 1) to view calibration curve.
2. To create more room on the screen, the peak review pane can be removed from view by clicking the Delete pane button or the Hide pane button (Figure 1-53 on page 58 items 3 and 4). Alternatively, a tabular view can be created by clicking the Tab mode button; each open pane will appear in its own tab (Figure 1-53 on page 58 item 2).
3. Open the calibration curve pane for the first MRM transition for Peptide 1. The y-axis on the plot is the peak area ratio of the analyte over the internal standard. Normally, the internal standard concentration is held constant over a concentration curve, but in cases where this is not the case, using the concentration ratio for the x-axis automatically compensates for this.
Figure 1-52 Apply Current Analyte’s Actual Concentration to All Option
Peptide Quantitation Tutorial MultiQuant™ 3.0 Software
RUO-IDV-05-0889-A — August 2013 57 of 72

Peptide Quantitation
4. From the peak review performed, notice that there was very little peak area for Conc 1 in the dataset. Therefore this concentration can be removed from the calculation of the calibration curve by clearing the Used check box in each Conc1 row.
Notice that the three replicates for the highest concentration show a small amount of variability. Notice also that the data point now seems ‘hollow’ and the correlation co-efficient (r value) is improved (increased in value). In addition, it is important to
Figure 1-53 Calibration Curve Interface
Item Description1 Show Calibration Curve icon
2 Toggles to tab mode
3 Deletes this pane
4 Hide pane
Tip! Remove a data point from the curve by right-clicking on the data point on the calibration curve pane and then clicking Exclude.
1
3 4
2
MultiQuant™ 3.0 Software Peptide Quantitation Tutorial
58 of 72 RUO-IDV-05-0889-A — August 2013

Peptide Quantitation
observe the accuracy column in the table as this reflects how close the computed concentration at each data point is to the expected concentration. It is desirable for the accuracy of all data points in the calibration curve to lie between 80 to 120%.
The calibration curves for all the analytes can be assessed by removing outlying data points to improve the accuracy of the calibration curve. This is one advantage of performing replicates at each concentration, as the occasional data point can then be removed.
5. Sometimes, a complete concentration point must be removed, at either the low end of the curve (due to low signal for example) or at the high end of the curve (due to saturation or injection issues). Select one of the MRM transitions for Peptide 3 and notice the shape of the calibration. The curve is not very linear but can be greatly improved by removing all the points at the very highest concentration (refer to Figure 1-54 and Figure 1-55).
Figure 1-54 Before removal of high concentration data points
Figure 1-55 After removal of high concentration data points
Peptide Quantitation Tutorial MultiQuant™ 3.0 Software
RUO-IDV-05-0889-A — August 2013 59 of 72

Peptide Quantitation
6. Before exporting the calibration curve, check the calibration curve statistics. Go to Evaluate the Statistics of the Standard Calibration Curve.
Evaluate the Statistics of the Standard Calibration CurveThe Statistics Table is used to view information related to the reproducibility of an analysis. Each row of the table summarizes information such as the average, standard deviation, and so forth for a group of related peaks, from the same analyte, that would ideally be expected to have the same response.
• Click the active Results Table, and then click the Statistics icon (Figure 1-56 on page 61 item 1) to open the Statistics pane.
You can assess the reproducibility of the replicates. Notice that when a peak is removed from the quantitation curve by clearing the Used check box, it is not considered in the calculations and is visualized as a struck out value (Figure 1-56 on page 61 item 2).
Note: Any reported concentrations for unknown samples greater than the concentration of the most concentrated standard used for the calibration should be treated with some suspicion. The quality of the calibration curve can be evaluated using the accuracy values calculated in the Results Table. Typically most values across the curves should fall between 80 to 120% accuracy to be included. Points that fall outside the line can be omitted by clearing the check box in the Used column.
MultiQuant™ 3.0 Software Peptide Quantitation Tutorial
60 of 72 RUO-IDV-05-0889-A — August 2013

Peptide Quantitation
Export Calibration Curves1. After the calibration curves have been optimized for all the MRM transitions for all
the peptides, the calibration curve can be saved by clicking Process > Export Calibration. This creates a *.mqcal file.
2. For this tutorial, export the calibration noting where you save the file.
Figure 1-56 Statistics Table
Item Description1 Statistics icon
2 Peak removed from statistics calculation
Note: This step is only necessary if you will subsequently apply this external calibration to a new Results Table.
1
2
Peptide Quantitation Tutorial MultiQuant™ 3.0 Software
RUO-IDV-05-0889-A — August 2013 61 of 72
Peptide Quantitation
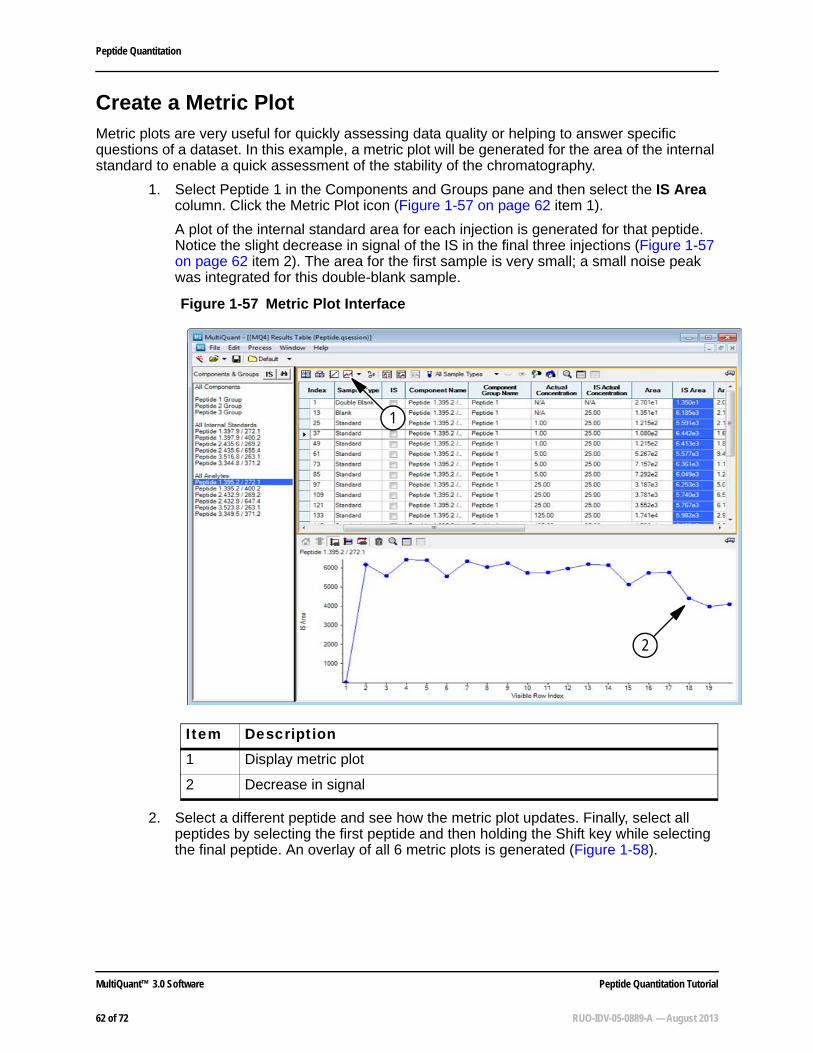
Create a Metric PlotMetric plots are very useful for quickly assessing data quality or helping to answer specific questions of a dataset. In this example, a metric plot will be generated for the area of the internal standard to enable a quick assessment of the stability of the chromatography.
1. Select Peptide 1 in the Components and Groups pane and then select the IS Area column. Click the Metric Plot icon (Figure 1-57 on page 62 item 1).
A plot of the internal standard area for each injection is generated for that peptide. Notice the slight decrease in signal of the IS in the final three injections (Figure 1-57 on page 62 item 2). The area for the first sample is very small; a small noise peak was integrated for this double-blank sample.
2. Select a different peptide and see how the metric plot updates. Finally, select all peptides by selecting the first peptide and then holding the Shift key while selecting the final peptide. An overlay of all 6 metric plots is generated (Figure 1-58).
Figure 1-57 Metric Plot Interface
Item Description1 Display metric plot
2 Decrease in signal
1
2
MultiQuant™ 3.0 Software Peptide Quantitation Tutorial
62 of 72 RUO-IDV-05-0889-A — August 2013

Peptide Quantitation
Process Unknown SamplesAfter the calibration curve is generated, the biological samples (unknowns) can be processed. In these samples, you want to measure the amount of the endogenous light peptide present in each sample. The heavy peptide can be added into each biological sample at a fixed amount. It can then act as the internal standard for these samples to add robustness to your quantitation experiment. Using the calibration curve previously generated, the actual concentration of peptide in the biological sample can be computed from the ratio of the endogenous peptide (light) to the added internal standard (heavy).
1. Click File > New Results Table.
2. On the Create Results Table - Select Samples page (Figure 1-59), drag the Pep Quant Samples A.wiff file into the Selected pane and then click Next.
Figure 1-58 Overlaid metric plots
Peptide Quantitation Tutorial MultiQuant™ 3.0 Software
RUO-IDV-05-0889-A — August 2013 63 of 72

Peptide Quantitation
3. On the Create Results Table - Select Method page, click the Choose Existing Method option and then select the Edit Method check box.
4. Click Open, select the method created in Accurate Quantitation Using Calibration Curves on page 40, and then click Next.
In a subsequent step we will switch the analyte and internal standard MRMs. The net effect will be to overwrite the method.
5. On the Create Results Table - Select Representative Sample page, a representative sample has been recommended and is selected. Click Next.
Figure 1-59 Create Results Table - Select Samples Page
MultiQuant™ 3.0 Software Peptide Quantitation Tutorial
64 of 72 RUO-IDV-05-0889-A — August 2013

Peptide Quantitation
6. On the Create Results Table - Define Components page, right-click in the table and then click Internal Standards > Reverse Analyte/IS Assignments.
The analytes and internal standards should interchange so that the method now looks as shown in the Figure 1-61 on page 66.
Figure 1-60 Create Results Table - Select Representative Sample Page
Peptide Quantitation Tutorial MultiQuant™ 3.0 Software
RUO-IDV-05-0889-A — August 2013 65 of 72
Peptide Quantitation
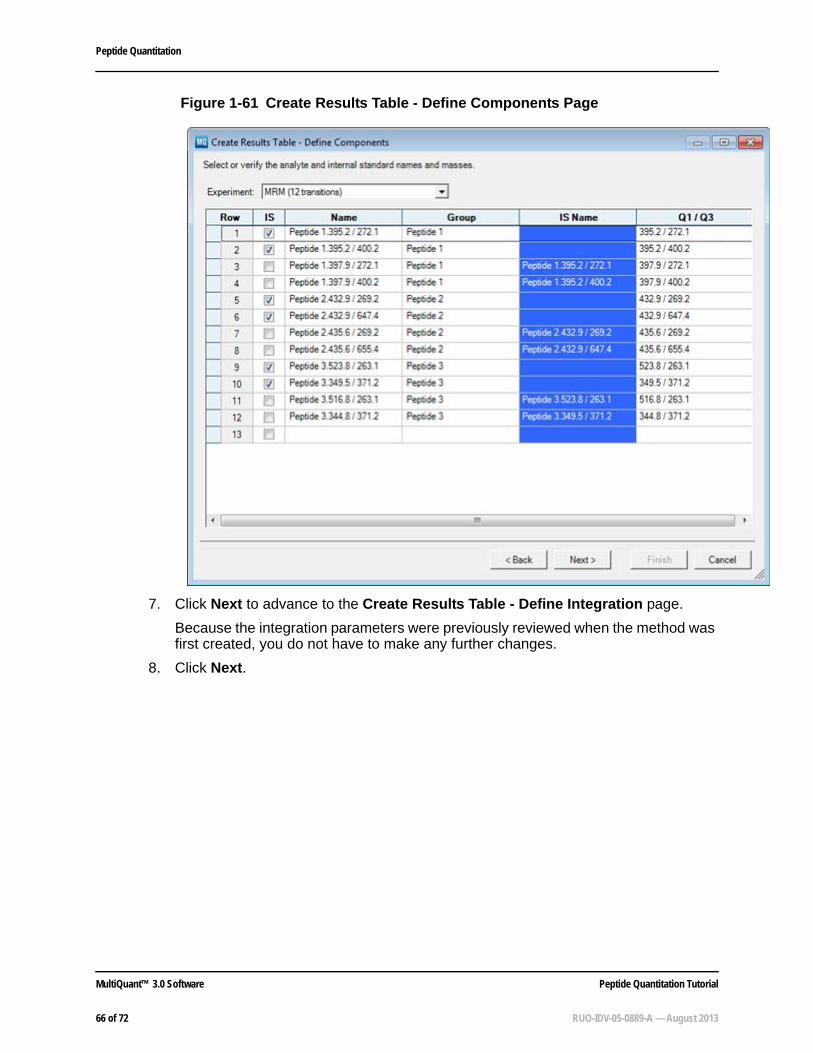
7. Click Next to advance to the Create Results Table - Define Integration page.
Because the integration parameters were previously reviewed when the method was first created, you do not have to make any further changes.
8. Click Next.
Figure 1-61 Create Results Table - Define Components Page
MultiQuant™ 3.0 Software Peptide Quantitation Tutorial
66 of 72 RUO-IDV-05-0889-A — August 2013

Peptide Quantitation
9. Specify the fields as required to automatically flag samples for review in the Results Table. Refer to the Reference Guide for more information about the Outlier Settings parameters.
10. Click Finish.
11. Define the Sample Type for the QC samples as Quality Control and the leave the remaining samples as Unknown.
12. Type an IS Actual Concentration of 20 for every sample.
13. Type 200 for the Actual Concentration for the QC low samples and 4000 for the QC high samples. The Results Table should now look as shown in Figure 1-63.
Figure 1-62 Outlier Settings
Tip! To fill down a specific section of cells in a table, click the first and last cells in the section while pressing the Shift key. The cells will be selected and you can click Edit > Fill Down to populate the cells.
Peptide Quantitation Tutorial MultiQuant™ 3.0 Software
RUO-IDV-05-0889-A — August 2013 67 of 72

Peptide Quantitation
14. Click Process > Import External Calibration to import the calibration curve calculated in the previous section into this Results Table. Browse for the *.mqcal file that you saved in step 2 on page 61 and then click Open.
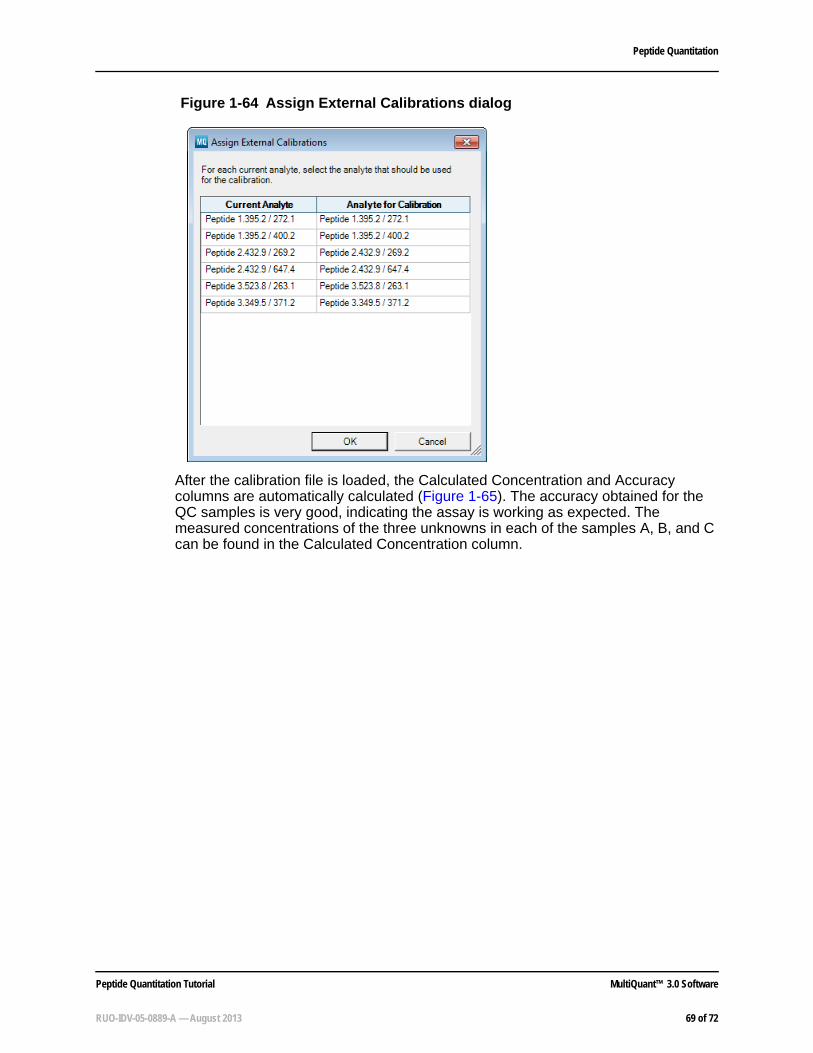
15. In the Assign External Calibrations dialog (Figure 1-64), select the calibration curve that should be used for each specific analyte in the current data file. Specify the relationships as shown and then click OK.
Figure 1-63 Actual concentrations
MultiQuant™ 3.0 Software Peptide Quantitation Tutorial
68 of 72 RUO-IDV-05-0889-A — August 2013
Peptide Quantitation
After the calibration file is loaded, the Calculated Concentration and Accuracy columns are automatically calculated (Figure 1-65). The accuracy obtained for the QC samples is very good, indicating the assay is working as expected. The measured concentrations of the three unknowns in each of the samples A, B, and C can be found in the Calculated Concentration column.
Figure 1-64 Assign External Calibrations dialog
Peptide Quantitation Tutorial MultiQuant™ 3.0 Software
RUO-IDV-05-0889-A — August 2013 69 of 72

Peptide Quantitation
16. Save the Results Table.
Create ReportsIf you are creating reports using unlocked Results Tables, make sure that you are allowed to create and export unlocked Results Tables. See your administrator if you are unable to create reports.
1. Click File > Create Report and Save Results Table.
Figure 1-65 Calculated Concentration and Accuracy columns
Figure 1-66 Create Report Dialog
1
2
MultiQuant™ 3.0 Software Peptide Quantitation Tutorial
70 of 72 RUO-IDV-05-0889-A — August 2013

Peptide Quantitation
2. Click Set (Figure 1-66 item 1) to navigate to the Tutorial Dataset Heavy_Light.xml template in one of the following folders:
• For Windows 7: C:\ProgramData\AB SCIEX\MultiQuant\Reporter.
• For Windows XP: C:\Documents and Settings\All Users\Application Data\AB SCIEX\MultiQuant\Reporter.
3. Click Set (Figure 1-66 item 2) to create the name and location of the report.
4. Click OK to generate the report as a secure PDF.
Item Description1 Click to select the template.
2 Click to save the report.
Peptide Quantitation Tutorial MultiQuant™ 3.0 Software
RUO-IDV-05-0889-A — August 2013 71 of 72

Peptide Quantitation
MultiQuant™ 3.0 Software Peptide Quantitation Tutorial
72 of 72 RUO-IDV-05-0889-A — August 2013


![Human C-peptide Quantitation by LC-MS Isotope-Dilution ......concentration in urine is approximately one order of magnitude higher [9, 10]. Mass-spectrometric (MS) analysis of C-peptide](https://static.fdocuments.us/doc/165x107/5e7016825fe3886214737c0e/human-c-peptide-quantitation-by-lc-ms-isotope-dilution-concentration-in.jpg)
