
Important note on these presentation slides, including the ... · The verbal presentation to...
54
2 This document is a visual aid accompanying a presentation to analysts by the Group Chief Executive Officer and the Executive Director Finance on 31 October 2013. It is not intended to be read as a stand-alone document. It contains select information, in abbreviated or summary form, and does not purport to be complete. It is intended to be read by an analyst audience familiar with National Australia Bank Limited and its September 2013 Full Year Results, and to be accompanied by the verbal presentation. This document should not be read without first reading the National Australia Bank Limited September 2013 Full Year Results, which has been lodged with the Australian Securities Exchange at the same time as this document and is available at www.nab.com.au. The verbal presentation to analysts places emphasis on cash earnings measures of the Group’s performance. NAB uses cash earnings for its internal management reporting purposes and considers it a better reflection of the Group’s underlying performance. Accordingly, as a visual aid to that presentation, information in this document is presented on a cash earnings basis unless otherwise stated. Cash earnings is calculated by excluding some items which are included within the statutory net profit attributable to owners of the Company. It is not a statutory financial measure and is not presented in accordance with Australian Accounting Standards nor audited or reviewed in accordance with Australian Auditing Standards. The definition of cash earnings, a discussion of non-cash earnings items and a full reconciliation of the cash earnings to statutory net profit attributable to owners of the company is set out on pages 2-8 of the National Australia Bank Limited September 2013 Full Year Results. The financial report section (section 5) of the September 2013 Full Year Results sets out the Consolidated Income Statement of the Group, including statutory net profit. The Group’s financial statements, prepared in accordance with the Corporations Act 2001 (Cth) and Australian Accounting Standards, and audited in accordance with Australian Auditing Standards, will be released on 18 November in NAB’s 2013 Annual Financial Report. Note: • The inclusion of percentage changes in brackets in this document indicates an unfavourable movement on a prior comparative period. • This document is not intended to be relied upon as advice to investors or potential investors and does not take into account the investment objectives, financial situation or needs of any particular investor. These should be considered, with or without professional advice, when deciding if an investment is appropriate. • This document contains certain "forward-looking statements". The words "anticipate", "believe", "expect", "project", "forecast", "estimate", “outlook”, "likely", "intend", "should", "could", "may", "target", "plan" and other similar expressions are intended to identify forward-looking statements. Indications of, and guidance on, future earnings and financial position and performance are also forward-looking statements. Such forward-looking statements are not guarantees of future performance and involve known and unknown risks, uncertainties and other factors, many of which are beyond the control of the Group, which may cause actual results to differ materially from those expressed or implied in such statements. There can be no assurance that actual outcomes will not differ materially from these statements. Important note on these presentation slides, including the use of non-IFRS financial information
Transcript of Important note on these presentation slides, including the ... · The verbal presentation to...

2
This document is a visual aid accompanying a presentation to analysts by the Group Chief Executive Officer and the Executive Director Finance on 31 October 2013. It is not intended to be read as a stand-alone document. It contains select information, in abbreviated or summary form, and does not purport to be complete. It is intended to be read by an analyst audience familiar with National Australia Bank Limited and its September 2013 Full Year Results, and to be accompanied by the verbal presentation. This document should not be read without first reading the National Australia Bank Limited September 2013 Full Year Results, which has been lodged with the Australian Securities Exchange at the same time as this document and is available at www.nab.com.au.
The verbal presentation to analysts places emphasis on cash earnings measures of the Group’s performance. NAB uses cash earnings for its internal management reporting purposes and considers it a better reflection of the Group’s underlying performance. Accordingly, as a visual aid to that presentation, information in this document is presented on a cash earnings basis unless otherwise stated.
Cash earnings is calculated by excluding some items which are included within the statutory net profit attributable to owners of the Company. It is not a statutory financial measure and is not presented in accordance with Australian Accounting Standards nor audited or reviewed in accordance with Australian Auditing Standards. The definition of cash earnings, a discussion of non-cash earnings items and a full reconciliation of the cash earnings to statutory net profit attributable to owners of the company is set out on pages 2-8 of the National Australia Bank Limited September 2013 Full Year Results.
The financial report section (section 5) of the September 2013 Full Year Results sets out the Consolidated Income Statement of the Group, including statutory net profit.
The Group’s financial statements, prepared in accordance with the Corporations Act 2001 (Cth) and Australian Accounting Standards, and audited in accordance with Australian Auditing Standards, will be released on 18 November in NAB’s 2013 Annual Financial Report.
Note:• The inclusion of percentage changes in brackets in this document indicates an unfavourable movement on a prior comparative period.• This document is not intended to be relied upon as advice to investors or potential investors and does not take into account the investment
objectives, financial situation or needs of any particular investor. These should be considered, with or without professional advice, when deciding if an investment is appropriate.
• This document contains certain "forward-looking statements". The words "anticipate", "believe", "expect", "project", "forecast", "estimate", “outlook”, "likely", "intend", "should", "could", "may", "target", "plan" and other similar expressions are intended to identify forward-looking statements. Indications of, and guidance on, future earnings and financial position and performance are also forward-looking statements. Such forward-looking statements are not guarantees of future performance and involve known and unknown risks, uncertainties and other factors, many of which are beyond the control of the Group, which may cause actual results to differ materially from those expressed or implied in such statements. There can be no assurance that actual outcomes will not differ materially from these statements.
Important note on these presentation slides, including the use of non-IFRS financial information

3
Solid result from core franchise and improved UK performance
FY13 FY13 vs FY12
Cash earnings ($m) 5,936 9.3%
Cash EPS (diluted cps) 250.6 4.9%
Dividend (100% franked cps) 190 5.6%
Cash ROE 14.5% 30bps
Statutory net profit attributable to owners ($m) 5,452 33.6%
4
Operating environment stable … some signs of improvement
Percentage change in dwelling values from previous peak1 to August 2013
Business confidence and conditions in Australia
-30.0
-20.0
-10.0
0.0
10.0
20.0
Sep 07 Sep 09 Sep 11 Sep 13
Conditions Confidence
UK commercial property capital values
-15 -10 -5 0 5 10
Retail Central London
Retail Rest of London
Retail East Midlands
Retail West Midlands
Retail Scotland
Office City
Office West End
Office Rest of London
Office Midlands & Wales
Office Scotland
Shopping Centre - London &South East
Shopping Centre - Rest of UK
September 2012 to February 2013 (%)
March 2013 to August 2013 (%)Source: IPD
4.0
1.2
-0.2
-4.3 -5.1
-8.6-9.4
-11.5
-0.9
Sydney Canberra Perth Melbourne Adelaide Darwin Brisbane Hobart 8 CapitalCities
(%)
(1) The previous peak for each Capital City was in 2010
Source: NAB
Source: RP Data
55
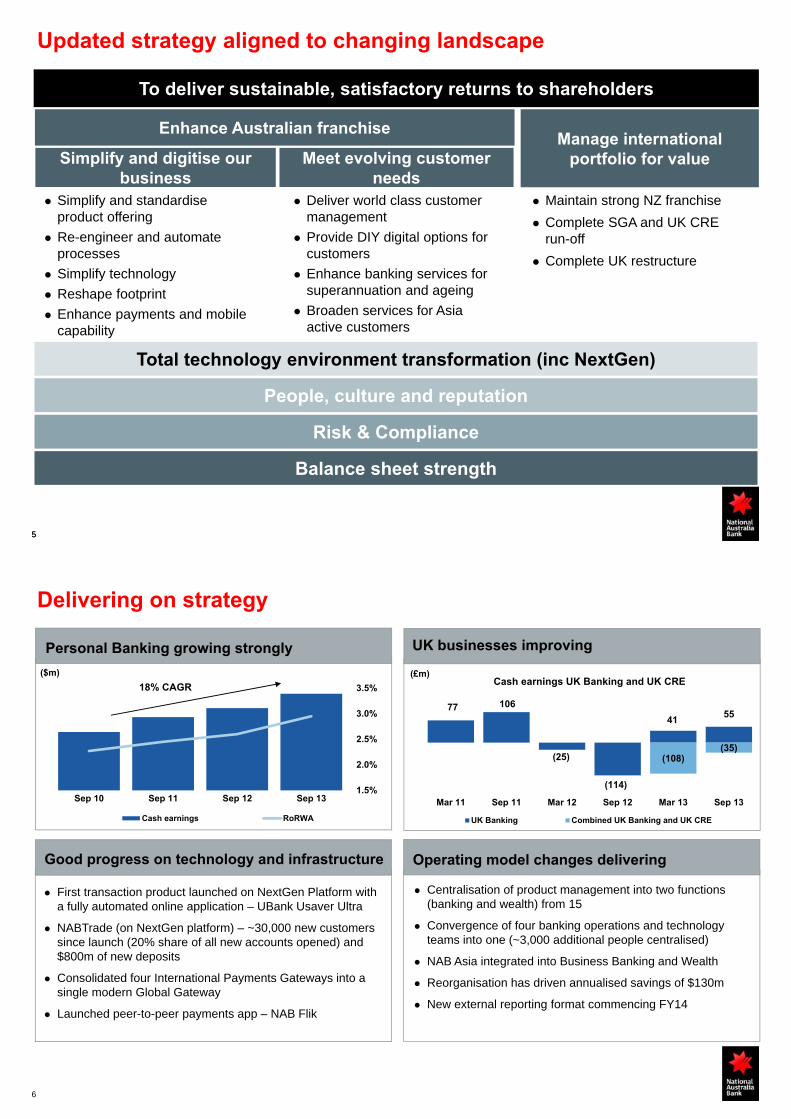
Updated strategy aligned to changing landscape
Simplify and digitise our business
Simplify and standardise product offering
Re-engineer and automate processes
Simplify technology
Reshape footprint
Enhance payments and mobile capability
Risk & Compliance
People, culture and reputation
Deliver world class customer management
Provide DIY digital options for customers
Enhance banking services for superannuation and ageing
Broaden services for Asia active customers
Manage international portfolio for value
Maintain strong NZ franchise
Complete SGA and UK CRE run-off
Complete UK restructure
To deliver sustainable, satisfactory returns to shareholders
Enhance Australian franchise
Total technology environment transformation (inc NextGen)
Meet evolving customer needs
Balance sheet strength
6
Delivering on strategy
Good progress on technology and infrastructure
Personal Banking growing strongly UK businesses improving
Operating model changes delivering
Centralisation of product management into two functions (banking and wealth) from 15
Convergence of four banking operations and technology teams into one (~3,000 additional people centralised)
NAB Asia integrated into Business Banking and Wealth
Reorganisation has driven annualised savings of $130m
New external reporting format commencing FY14
(£m)
18% CAGR
($m)
First transaction product launched on NextGen Platform with a fully automated online application – UBank Usaver Ultra
NABTrade (on NextGen platform) – ~30,000 new customers since launch (20% share of all new accounts opened) and $800m of new deposits
Consolidated four International Payments Gateways into a single modern Global Gateway
Launched peer-to-peer payments app – NAB Flik
1.5%
2.0%
2.5%
3.0%
3.5%
Sep 10 Sep 11 Sep 12 Sep 13
Cash earnings RoRWA
77 106
(25)
(114)
4155
(108)(35)
Mar 11 Sep 11 Mar 12 Sep 12 Mar 13 Sep 13
UK Banking Combined UK Banking and UK CRE
Cash earnings UK Banking and UK CRE

7
Balance sheet continues to strengthen
Basel III Common Equity Tier 1 ratio Group Stable Funding Index
Australian and New Zealand business exposures by probability of default
(%)
(1) Estimated Basel III Common Equity Tier 1 ratio
56%66% 69%
16%
20% 20%72%
86% 89%
Sep 08 Sep 12 Sep 13
Customer Funding Index Term Funding Index
Risk profile of loan book
Proportion housing lending
46%55%
17.1% 11.6%
2009 2013 2009 2013
$203bn $289bn
$75bn$61bn
Proportion CRE lending
0.0
10.0
20.0
30.0
40.0
0<0.03% 0.03<0.1% 0.1<0.5% 0.5<2.0% 2.0<5.0% 5.0<100% 100%
Sep 09 Mar 13
Probability of default
EA
D (
as %
of
To
tal)
2009 PD ≥ 2% 26%
2013 PD ≥ 2% 14%
7.58% 7.90% 8.22% 8.43%
Mar 12 Sep 12 Mar 13 Sep 131 1
8
Summary and outlook
Stronger FY13 performance from all banking businesses
UK operating conditions improving
Pick up in business confidence encouraging
Operating model changes delivering substantive savings
Continued improvement in risk profile
Well positioned for FY14

2H13 Financials
10
Group financial result
($m)Sep 13
Half year
Change on
Mar 13
Net operating income 9,330 0.9%
Operating expenses (4,198) (5.6%)
Underlying profit 5,132 (2.7)%
B&DDs (842) 22.9%
Cash earnings 3,021 3.6%
APRA Basel III CET11 ratio 8.43% 21bps
Spot GLAs ($bn) 521.8 4.2%
Spot Customer Deposits ($bn) 366.0 6.9%
Statutory net profit attributable to owners ($m) 2,932 16.3%
Notable items in Sep 13 half year result
Revenue
• Insurance reserves increased $57m
Expenses
• UK conduct provisions $106m ($57m in 1H13)
• Australian restructuring costs $109m ($5m in 1H13)
• GST credits $38m
Non-cash earnings (after tax)
• UK customer redress (PPI) ($163m)
• Bell Resources litigation recovery $56m
(1) Common Equity Tier One

11
Operating income
Group net interest margin
Operating income
2.03% 2.02%
(0.01%)(0.01%)
(0.01%)(0.02%) (0.01%)0.02% 0.01%
0.02%
Mar 13 Lending Margin Deposits Funding &Liquidity Costs
Liability Mix Lending Mix Earnings onCapital
Markets &Treasury (ex
Liquids)
Liquid holdings Sep 13
Customer margin up 1bp
9,250 9,330
(33) (114) (46) (57)224 66 40
Mar 13 Volumes Margin Trading Income Other OOI Wealthinvestments
Insurance Strengthing ofinsurancereserves
Sep 13
Net interest income Other operating income NAB Wealth($m)
12
Operating expense trends
Jaws momentum (ex SCDO and FX)
Operating expense
($m)
1.1%
+ 0.5%
0.6%
FY12 v FY13FY11 v FY12
Expense growth (excluding UK conduct, restructuring costs, GST credits and D&A policy change)
3,976 4,0284,198
102
10449 78
(30) (20)
(38) (23)
Mar 13 Australianrestructuring
benefits
UKrestructuring
benefits
Otheropex
Sep 13adjusted
Restructuringcosts
UK conductand redress
GSTcredits
D&A policychange
FX Sep 13
1.3%
3.6%
+5.2%
-1.6%
Revenue growth6.9%
4.0%
+2.9% 3.6%
+5.2%
- 1.6%
Expense growth
3.4%
- 2.3%
1.1%
FY10 v FY11 FY11 v FY12 FY12 v FY13
Revenue growth
13
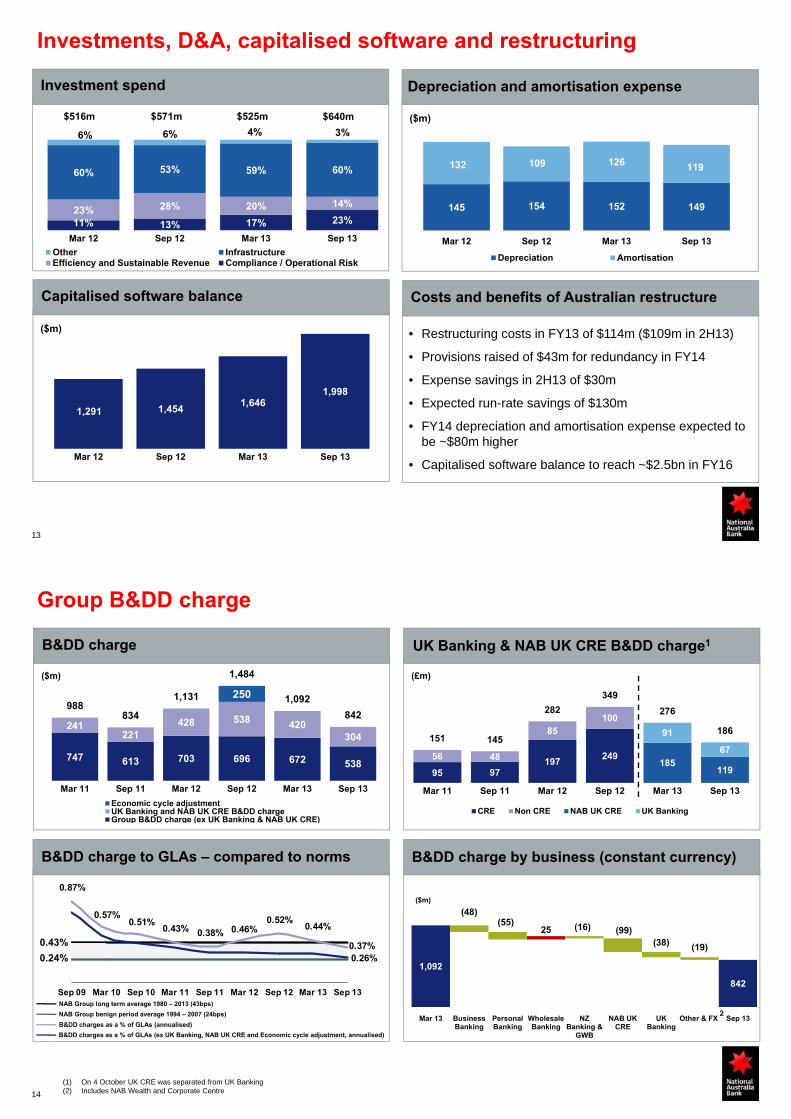
Investments, D&A, capitalised software and restructuring
11% 13% 17% 23%23% 28% 20% 14%
60% 53% 59% 60%
6% 6% 4% 3%
Mar 12 Sep 12 Mar 13 Sep 13
Other InfrastructureEfficiency and Sustainable Revenue Compliance / Operational Risk
$516m $571m $525m $640m
Investment spend
1,291 1,4541,646
1,998
Mar 12 Sep 12 Mar 13 Sep 13
Capitalised software balance
($m)
Depreciation and amortisation expense
($m)
145 154 152 149
132 109 126 119
Mar 12 Sep 12 Mar 13 Sep 13
Depreciation Amortisation
Costs and benefits of Australian restructure
• Restructuring costs in FY13 of $114m ($109m in 2H13)
• Provisions raised of $43m for redundancy in FY14
• Expense savings in 2H13 of $30m
• Expected run-rate savings of $130m
• FY14 depreciation and amortisation expense expected to be ~$80m higher
• Capitalised software balance to reach ~$2.5bn in FY16
(£m)($m)
($m)
Group B&DD charge
B&DD charge UK Banking & NAB UK CRE B&DD charge1
B&DD charge to GLAs – compared to norms B&DD charge by business (constant currency)
0.87%
0.57%
0.43% 0.38%0.52%
0.37%
0.51%0.46% 0.44%
0.26%
Sep 09 Mar 10 Sep 10 Mar 11 Sep 11 Mar 12 Sep 12 Mar 13 Sep 13
NAB Group benign period average 1994 – 2007 (24bps)
NAB Group long term average 1980 – 2013 (43bps)
B&DD charges as a % of GLAs (annualised)
B&DD charges as a % of GLAs (ex UK Banking, NAB UK CRE and Economic cycle adjustment, annualised)
95 97197
24956 48
85100
185119
91
67151 145
282
349
276
186
Mar 11 Sep 11 Mar 12 Sep 12 Mar 13 Sep 13
CRE Non CRE NAB UK CRE UK Banking
747 613 703 696 672 538
241221
428 538 420304
250988
834
1,131
1,484
1,092
842
Mar 11 Sep 11 Mar 12 Sep 12 Mar 13 Sep 13
Economic cycle adjustmentUK Banking and NAB UK CRE B&DD chargeGroup B&DD charge (ex UK Banking & NAB UK CRE)
14
0.43%
0.24%1,092
842
25
(48)(55) (16) (99)
(38) (19)
Mar 13 BusinessBanking
PersonalBanking
WholesaleBanking
NZBanking &
GWB
NAB UKCRE
UKBanking
Other & FX Sep 132
(1) On 4 October UK CRE was separated from UK Banking (2) Includes NAB Wealth and Corporate Centre

1.02% 1.05% 1.04% 0.99% 0.94%
0.30% 0.25% 0.25% 0.23% 0.22%
1.32% 1.30% 1.29%1.22%
1.16%
Mar 12 Sep 12 Mar 13 Mar 13 Sep 13
Asset quality and coverage ratios
($bn)
Categorised assets by class
Coverage ratios (with and without GRCL top-up)
90+ DPD & impaired assets as a % of GLAs
Total and specific provision coverage
26.8%30.3%
32.9% 32.0%
1.64% 1.59%1.56%
1.71% 1.73%
Mar 12 Sep 12 Mar 13 Sep 13
Specific Provisions as % of Impaired Assets
Total provisions as % of Credit Risk Weighted Assets (Basel III)
Total provisions as % of Credit Risk Weighted Assets (Basel II)
1.73% 1.78% 1.74% 1.69%1.50% 1.43% 1.31% 1.25%
Mar 12 Sep 12 Mar 13 Sep 13
Group Group (excluding UK Banking & NAB UK CRE)
15
GRCL top-up (pre-tax) as a % of Credit Risk Weighted AssetsCollective Provisions as a % of Credit Risk Weighted Assets
Basel IIIBasel II
3.0%
4.0%
5.0%
6.0%
0
4
8
12
16
20
24
28
Sep 10 Mar 11 Sep 11 Mar 12 Sep 12 Mar 13 Sep 13Impaired Assets 90+DPD
Watch Loans Categorised Assets as % of GLAs (RHS)
16
Business unit contributions
Annual return on average RWAs for Banking Business Units
($m)
Cash earnings attribution analysis by business (constant currency)
(1) Other comprises SGA, Group Funding, Group Business Services, other supporting units and Great Western Bank(2) Wholesale Banking March 13 risk-weighted assets increased by $12.5bn due to the introduction of the Basel III regulatory capital framework
(-ve)
2,9153,021
(52) (22)(70)
8122
11 2188
Mar 13 BusinessBanking
PersonalBanking
WholesaleBanking
NAB Wealth NZ Banking UKBanking
NABUK CRE
Other , FX,IoRE
Sep 131
1.68%
2.30%1.90% 1.54%
0.55%
1.69%
2.60% 2.70%
1.85%1.76%
2.95%
2.33%1.86%
0.37%
BB PB WB NZ UK Banking
FY11 FY12 FY13 FY13 Group 1.70%
2

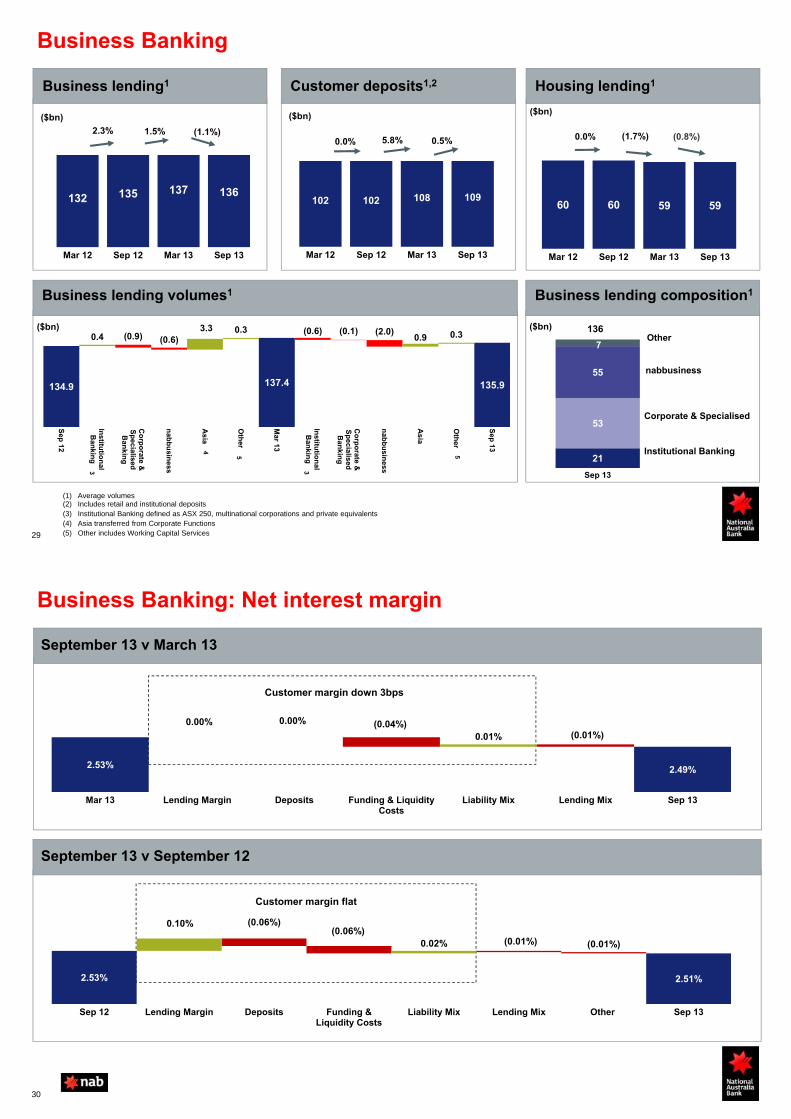
(1) Average volumes(2) Institutional Banking defined as ASX 250, multinational corporations and private equivalents(3) Asia transferred from Corporate Functions(4) Other includes Working Capital Services(5) SME business data reflects the nabbusiness segment of Business Banking which supports business customers with lending typically up to $25m, excluding the Specialised Businesses
Business Banking
(%)
Business lending volumes1 Net interest margin
90+ DPD and GIAs as a % of GLAs
2.29%2.23% 2.19%
1.98%
1.76%
1.50%
1.75%
2.00%
2.25%
2.50%
Sep 11 Mar 12 Sep 12 Mar 13 Sep 13
Business Banking SME
17
($bn)
2.45
2.51 2.50
2.57
2.66
2.56
2.502.53
2.49
Sept 09 Mar 10 Sep 10 Mar 11 Sep 11 Mar 12 Sep 12 Mar 13 Sep 13
($m)
B&DD charge and B&DD as % GLAs
154 208 182 219
218
313
219 135
372
521
401354
0.00%
0.15%
0.30%
0.45%
0.60%
Mar 12 Sep 12 Mar 13 Sep 13
SME All other B&DD/GLAs (annualised) (RHS)5
134.9 137.4 135.9
(0.9) (0.6)(0.6) (0.1) (2.0)0.4
3.3 0.30.9 0.3
Se
p 1
2
Institu
tion
al
Ban
king
Co
rpo
rate
& S
pecialis
edB
ankin
g
na
bb
usin
ess
Asia
Oth
er
Mar 13
Institu
tion
al
Ban
king
Co
rpo
rate
& S
pecialis
edB
ankin
g
na
bb
usin
ess
Asia
Oth
er
Se
p 1
3
2
43
2
4
Personal Banking
($m)
Cash earnings and RoRWA
B&DD charge and B&DD as % GLAs Australian mortgages1 - cumulative 30+ DPD
($m)
Net interest margin
(%)
18
($m)
(1) Includes Business Banking and NAB Wealth mortgages
0.0%
1.0%
2.0%
3.0%
4.0%
1 4 7 10 13 16 19 22 25
Months on books
2006 2007 2008 2009 2010 2011 2012 2013
317426 432 500 464
581 553675
1.50%
2.00%
2.50%
3.00%
3.50%
Mar 10 Sep 10 Mar 11 Sep 11 Mar 12 Sep 12 Mar 13 Sep 13
Cash earnings RoRWA
231
116
163138
169
73
187
132
0.00%
0.15%
0.30%
0.45%
0.60%
Mar 10 Sep 10 Mar 11 Sep 11 Mar 12 Sep 12 Mar 13 Sep 13
B&DD charge B&DD as % of GLAs (annualised)
2.02 2.04 2.09 2.07
Mar 12 Sep 12 Mar 13 Sep 13

19
Wholesale Banking
($m) ($m)
Cash earnings Customer and risk income
Customer income Risk income
($m)
263 298 296 308 333 328 329
128 122 128 148 135 125 141107 109
220 224 121254 13622
42
4144
68
58100520
571
685 724 657765
706
Sep 10 Mar 11 Sep 11 Mar 12 Sep 12 Mar 13 Sep 13
Fees & Other Sales Rates & Credit SalesFX Sales Specialised Finance, Asset Servicing & FIG
($m)
19
206 268
67
295 322 352 330
169158
107
200303 200 234375
426
174
495
625552 564
0
5
10
15
20
25
30
Sep 10 Mar 11 Sep 11 Mar 12 Sep 12 Mar 13 Sep 13
FICC Treasury Avg FICC traded market risk VaR (RHS)
518 574 615 579
Mar 12 Sep 12 Mar 13 Sep 13
724 657 765 706
495 625552 564
1,219 1,282 1,317 1,270
Mar 12 Sep 12 Mar 13 Sep 13
Customer Risk
NAB Wealth
($m)
114
(1,480)(871)
1,323 1,294
Sep 11 Mar 12 Sep 12 Mar 13 Sep 13
FUM2 net funds flow
Investments cash earnings1
162 167 183 208
255
Sep 11 Mar 12 Sep 12 Mar 13 Sep 13
($m)
(1) Inclusive of Private Wealth (2) FUM on a proportional ownership basis
20
Movement in total investments margin
0.85% 0.85% 0.86%
0.78% 0.77%
Sep 11 Mar 12 Sep 12 Mar 13 Sep 13
Net income to average FUM
Insurance cash earnings and income to average premiums inforce
($m)
10872
93 7648
(18)22
Mar 11 Sep 11 Mar 12 Sep 12 Mar 13 Sep 13
Cash earnings excl strengtheninging ofInsurance reserves ($57m pre tax, $40m post tax)
Cash earnings
Net income to average PiF (RHS)

New Zealand Banking and Great Western Bank
(NZ$m)
(NZ$m)
(%)
New Zealand Banking - Cash earnings New Zealand Banking - Net interest margin
21
New Zealand Banking - B&DD charge and B&DD as % of GLAs
(US$m)
Great Western Bank - Cash earnings
2.24 2.24 2.35 2.41 2.38 2.40 2.33
Sep 10 Mar 11 Sep 11 Mar 12 Sep 12 Mar 13 Sep 13
385 356 387 401
Mar 12 Sep 12 Mar 13 Sep 13
(7.5%)
8.7%
3.6%
50 50 55 58
Mar 12 Sep 12 Mar 13 Sep 13
34
64 5643
0.12%
0.22%0.19%
0.14%
Mar 12 Sep 12 Mar 13 Sep 13
B&DD charge B&DD as % of GLAs (annualised)
UK Banking
Key conduct issues
Net interest margin
2.06%
2.19%
0.04%
0.07%0.02%
Mar 13 Customermargin
FSCS Levy Lending Mix Sep 13
CHART REMOVED
(£m) 2H13 1H13 Movement
Income 496 490 6
Expenses (356) (345) (11)
B&DDs (67) (91) 24
Cash earnings 55 41 14
Cash earnings (ex conduct) 76 58 18
UK Banking Summary Results
90+ DPD and GIAs as a % of GLAs1
2.64 2.55 2.893.79
1.72 1.60
0.80 0.570.79
0.97
0.67 0.59
3.443.12
3.68
4.76
2.39 2.19
Mar 11 Sep 11 Mar 12 Sep 12 Mar 13 Sep 13
GIA as % of GLAs 90+ DPD as % of GLAs
(%)
(1) On 5 October 2012 UK CRE was separated from UK Banking
Issue (£m)Charge Remaining
Provision 1H13 2H13 FY13
Mortgage Repayments Irregularities 13 24 37 16
CPP Scheme of Arrangement 9 4 13 12
UK cash expense impact 22 28 50 28
Interest Rate Hedging Products 15 21 36 49
Other matters 0 18 18 36
Group cash expense impact 37 67 104 113
Payment Protection Insurance (PPI) 0 130 130 152
22

23
NAB UK CRE
568 625895
1,051 97955
114
174
185127
623739
1,0691,236
1,106
Sep 11 Mar 12 Sep 12 Mar 13 Sep 13
CRE GIAs CRE 90+DPD
(10.5%)
UK CRE credit quality – indicative comparisons1
Provision coverage – September 2013
95 97
197249
185
119
Mar 11 Sep 11 Mar 12 Sep 12 Mar 13 Sep 13
(£m)
UK CRE B&DD charge – indicative comparisons1
40%
55%
15%
Specificprovisioncoverage
Partialwriteoffs
Implied CREimpairedcoverage
NAB UK CRE run off2
(£bn)
9.9%
14.8%
21.2%4.9%
6.4%
Specificprovision
Collectiveprovision
(incoverlay)
Totalprovision
Partialwrite-offs
ImpliedCRE
coverage
18.6%
44.7%
15.6%
Specific provision to Impaired Assets Total provision to GLAs
(£m)
0
2
4
6
8
Sep 09 Sep 10 Sep 11 Sep 12 Sep 13 Sep 14 Sep 15 Sep 16 Sep 17 Sep 18
Contractual Maturity
Actual Run-off
Expected Maturity
(1) On 5 October 2012 UK CRE was separated from UK Banking(2) Represents CRE portfolio within UK Banking to September 2012 and the NAB UK CRE run-off portfolio post September 2012
8.22 8.43
10.25
0.86
0.12 0.45
0.97
0.85
(0.57)(0.38)
(0.05)(0.07) (0.05) (0.05) (0.05)
2424
Strong capital position
(%)
CashEarnings
$3.0bn
Dividend(net of DRP)
($2.0bn)
Mar 13
$28.9bn
Provision for UK conduct
charges($0.2bn)
Sep 13$30.5bn(APRA
standards)
Deferred Tax Assets
($0.2bn)
Net RWA reduction($4.9bn)
Sep 13$34.5bn
(BIS)
Capitalised Software
ex FX($0.3bn)
WM NTAs, DTA, Equity Investments
& Other
RWA Adjust-ments
FCTR$1.6bn
Group Basel III Common Equity Tier 1 Capital Position
Other Capital matters
• Basel III Common Equity Tier 1 (CET1) ratio above >7.50% target
• The 2013 final dividend of 97c will be paid in December 2013 with a fully neutralised dividend reinvestment plan (DRP)
• FY13 dividend payout ratio 75.1% (FY12 74.7%)
• Some capital regulatory uncertainty remains:
o APRA’s position on Domestic Systemically Important Bank (D-SIB)
o APRA has announced a revised timetable for the implementation of Level 3 reforms as 1 January 2015 (previously 1 Jan 2014)
• As the Tier 1 and Tier 2 transition portfolio amortises at 10% per annum, the Group will continue to look at opportunities to issue further hybrid and sub-debt in FY14
UK Pension Scheme($0.2bn)
FX impacts on RWAs$15.6bn
FX impacts on other
capital items($0.2bn)
Net FX impacts on capital +2bps

Stable and conservative liquid assets
Balance sheet strength remains a priority
($bn)
Tenor2 (1) Australian funding gap = Gross loans and advances + Acceptances less Total deposits (excluding certificates of deposits) Source: APRA Monthly Banking Statistics (Aug 2013)
(2) Weighted average maturity (years) of term funding issuance (> 12 months)
Term funding – volume and tenor2 of new issuance
25
Group Stable Funding Index (SFI)
56% 59% 64% 65% 66% 69%
16%19%
20% 20% 20% 20%72%78%
84% 85% 86% 89%
Sep 08 Sep 09 Sep 10 Sep 11 Sep 12 Sep 13
Customer Funding Index Term Funding Index
42 55 54 73
3040 37
3417
21 2027
Sep 10 Sep 11 Sep 12 Sep 13
Government, Cash & Central Bank Bank, Corporate & Other
Internal RMBS (contingent liquidity)
134
89
116111
($bn) 5.14.5 4.8
$31.6bn $31.3bn$25.8bn
2719.8 18.2
4.611.5
7.6
Sep 11 Sep 12 Sep 13 Sep 14
Senior and Sub Debt Secured Funding FY14 Funding Task
$25bn to $30bn
Australian funding gap1
($bn)
104 98 118 101
156 151 185 169
NAB Peer 1 Peer 2 Peer 3
Including Financial Institutional depositsExcluding Financial Institutional deposits
26
Summary
Good result despite some challenges
Managing to positive jaws
Encouraging asset quality trends
UK results showing improvement, but some uncertainty on conduct matters
Strong organic capital generation provides flexibility

Questions
Additional Information
Business BankingPersonal BankingWholesale BankingNAB WealthNZ BankingUK BankingNAB UK CREGreat Western BankGroup Asset QualityCapital and FundingOtherEconomic Outlook
Business Banking
Business lending1
132 135 137 136
Mar 12 Sep 12 Mar 13 Sep 13
2.3% 1.5% (1.1%)
102 102 108 109
Mar 12 Sep 12 Mar 13 Sep 13
0.5%0.0% 5.8%
($bn) ($bn) ($bn)
60 60 59 59
Mar 12 Sep 12 Mar 13 Sep 13
(0.8%)0.0% (1.7%)
Customer deposits1,2 Housing lending1
(1) Average volumes (2) Includes retail and institutional deposits(3) Institutional Banking defined as ASX 250, multinational corporations and private equivalents(4) Asia transferred from Corporate Functions(5) Other includes Working Capital Services29
134.9 137.4 135.9
(0.9) (0.6)(0.6) (0.1) (2.0)
0.43.3 0.3
0.9 0.3
Sep
12
Institu
tion
alB
ankin
g
Co
rpo
rate &S
pecialised
Ban
king
nab
bu
siness
Asia
Oth
er
Mar 13
Institu
tion
alB
ankin
g
Co
rpo
rate &S
pecialised
Ban
king
nab
bu
siness
Asia
Oth
er
Sep
13
3
4
5
3
5
Business lending volumes1
21
53
55
7
Sep 13
136Other
nabbusiness
Corporate & Specialised
Institutional Banking
Business lending composition1
($bn)($bn)
September 13 v March 13
Business Banking: Net interest margin
September 13 v September 12
Customer margin flat
2.53% 2.49%
0.00% 0.00% (0.04%)(0.01%)0.01%
Mar 13 Lending Margin Deposits Funding & LiquidityCosts
Liability Mix Lending Mix Sep 13
2.53% 2.51%
(0.06%)(0.06%)
(0.01%) (0.01%)
0.10%
0.02%
Sep 12 Lending Margin Deposits Funding &Liquidity Costs
Liability Mix Lending Mix Other Sep 13
30
Customer margin down 3bps
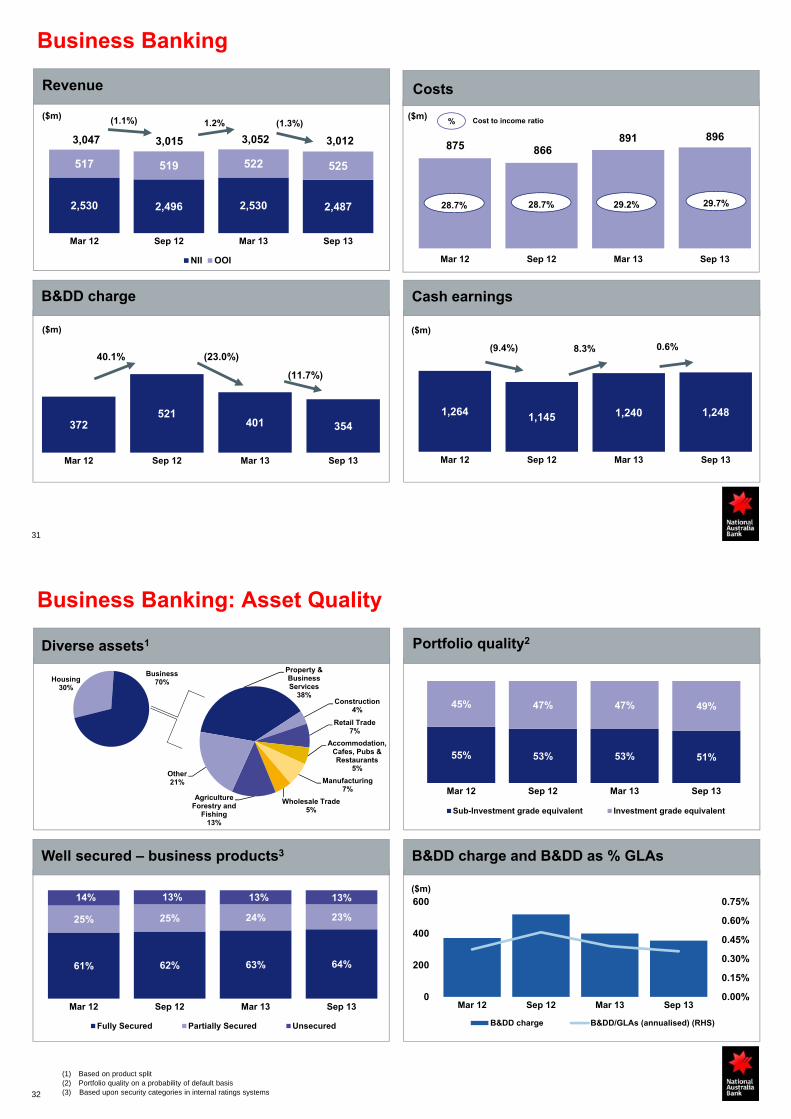
Business Banking
Revenue
1,264 1,145 1,240 1,248
Mar 12 Sep 12 Mar 13 Sep 13
0.6%(9.4%) 8.3%
($m)
372521
401 354
Mar 12 Sep 12 Mar 13 Sep 13
(11.7%)
40.1% (23.0%)
2,530 2,496 2,530 2,487
517 519 522 525
3,047 3,015 3,052 3,012
Mar 12 Sep 12 Mar 13 Sep 13
NII OOI
(1.3%)(1.1%) 1.2%($m)
($m)
B&DD charge Cash earnings
31
Costs
Cost to income ratio%($m)
875 866891 896
Mar 12 Sep 12 Mar 13 Sep 13
28.7% 29.7%28.7% 29.2%
32
Well secured – business products3 B&DD charge and B&DD as % GLAs
Diverse assets1
Business Banking: Asset Quality
(1) Based on product split(2) Portfolio quality on a probability of default basis(3) Based upon security categories in internal ratings systems
0.00%
0.15%
0.30%
0.45%
0.60%
0.75%
0
200
400
600
Mar 12 Sep 12 Mar 13 Sep 13
B&DD charge B&DD/GLAs (annualised) (RHS)
($m)
55% 53% 53% 51%
45% 47% 47% 49%
Mar 12 Sep 12 Mar 13 Sep 13
Sub-Investment grade equivalent Investment grade equivalent
61% 62% 63% 64%
25% 25% 24% 23%
14% 13% 13% 13%
Mar 12 Sep 12 Mar 13 Sep 13
Fully Secured Partially Secured Unsecured
Property & Business Services
38%Construction
4%
Retail Trade7%
Accommodation, Cafes, Pubs & Restaurants
5%
Manufacturing7%
Wholesale Trade5%
Agriculture Forestry and
Fishing13%
Other21%
Portfolio quality2
Housing30%
Business70%

33
Business Banking: SME Business1 Asset Quality
(1) SME business data reflects the nabbusiness segment of Business Banking which supports business customers with lending typically up to $25m, excluding the Specialised Businesses
(2) Based on customer split(3) Portfolio quality on a probability of default basis (4) Based upon security categories in internal ratings systems
0.00%
0.15%
0.30%
0.45%
0.60%
0
50
100
150
200
250
300
Mar 12 Sep 12 Mar 13 Sep 13
B&DD charge B&DD/GLAs (annualised) (RHS)
($m)
59% 59% 59% 58%
41% 41% 41% 42%
Mar 12 Sep 12 Mar 13 Sep 13
Sub-Investment grade equivalent Investment grade equivalent
72% 73% 73% 73%
23% 22% 22% 22%
5% 5% 5% 5%
Mar 12 Sep 12 Mar 13 Sep 13
Fully Secured Partially Secured Unsecured
Well secured – business products4 B&DD charge and B&DD as % GLAs
Diverse assets2 Portfolio quality3
Property & Business Services
45%
Construction8%
Retail Trade8%
Accommodation, Cafes, Pubs & Restaurants
8%Manufacturing
6%
Wholesale Trade7%
Finance & Insurance
5%
Other13%
Personal35%
Business65%
34
State NSW VIC QLD Other Total
Location % 36% 26% 20% 18% 100%
Loan Balance1 < $5m 10% 10% 7% 5% 32%
> $5m < $10m 4% 3% 2% 4% 13%
> $10m 22% 13% 11% 9% 55%
Loan tenor < 3 yrs 29% 22% 18% 15% 84%
Loan tenor > 3 < 5 yrs 5% 3% 1% 2% 11%
Loan tenor > 5 yrs 2% 1% 1% 1% 5%
Average loan size $m 3.4 2.5 2.8 3.1 2.9
Security Level2 – Fully Secured 29% 23% 15% 16% 83%
Partially Secured 3% 2% 4% 1% 10%
Unsecured 4% 1% 1% 1% 7%
90+ days past due 0.09% 0.04% 0.03% 0.02% 0.18%
Impaired loans 0.68% 0.27% 0.67% 0.13% 1.75%
Specific provision coverage 10.6% 22.5% 20.5% 34.2% 18.0%
Trend Sep 13 Mar 13 Sep 12 Mar 12
90+ days past due 0.18% 0.38% 0.17% 0.31%
Impaired Loans 1.75% 2.01% 2.75% 2.91%
Specific provision coverage 18.0% 19.3% 14.0% 16.4%
(1) Distribution based on loan balance(2) Fully Secured represents loans of up to 70% of the Market Value of Security. Partially Secured are over 70%, but not Unsecured.
Unsecured is primarily Negative Pledge lending
Total $44.8bn11.4% of Australian geography Gross Loans & Acceptances
NSW 36%
Vic 26%
Qld 20%
Other 18%
Office29%
Tourism & Leisure
4%
Residential9%
Industrial15%
Other6%
Land8%
Retail29%
Business Banking: Commercial Real Estate

Additional InformationBusiness Banking
Personal BankingWholesale BankingNAB WealthNZ BankingUK BankingNAB UK CREGreat Western BankGroup Asset QualityCapital and FundingOtherEconomic Outlook
Personal Banking
(1) Roy Morgan Research, Aust MFIs, population aged 14+, six month moving average. Customer satisfaction is based on customers who answered very/fairly satisfied. NAB compared with the weighted average of the three major banks (ANZ, CBA, WBC)
(2) RBA Financial System / NAB total Australian mortgages (includes Business Banking and NAB Wealth)
(x)
(#)
(%)
MFI customer satisfaction1 Home loan multiple of system growth2
Net transaction account growth Jaws momentum
Revenue growth
Expense growth
2H11 v 1H111H11 v 2H10 1H12 v 2H11 2H12 v 1H12 1H13 v 2H12
6.0%
3.5%
+2.5%4.0%
+4.1%
-0.1%
0.2%
-1.1%
-0.9%
4.7%
+3.7%
1.0%
5.0%
+2.1%
2.9%
36
2.43.2
1.8 1.9 1.71.3
Mar 11 Sep 11 Mar 12 Sep 12 Mar 13 Aug 13
2H13 v 1H13
5.1%
-1.9%
+7.0%
152,121 154,499137,506 139,236 137,286143,700
123,173
79,911
Mar 10 Sep 10 Mar 11 Sep 11 Mar 12 Sep 12 Mar 13 Sep 13
Mar 09 Sep 09 Mar 10 Sep 10 Mar 11 Sep 11 Mar 12 Sep 12 Mar 13 Sep 13
Weighted average of three major bank peers NAB
74.2
68.9
81.7
82.1

464581 553
675
Mar 12 Sep 12 Mar 13 Sep 13
22.1%
25.2% (4.8%)
1,731 1,835 1,908 2,005
Mar 12 Sep 12 Mar 13 Sep 13
5.1%
6.0%4.0%
Personal Banking
($m)
902 934 933 915
Mar 12 Sep 12 Mar 13 Sep 13
45.6%52.1% 50.9% 48.9%
($m) (%)
($m)
Cash earnings Revenue
Costs Net interest margin
Cost to income ratio%
37
2.022.04
2.09 2.07
Mar 12 Sep 12 Mar 13 Sep 13
Personal Banking: Net interest margin
September 13 v March 13
September 13 v September 12
38
2.09% 2.07%
(0.02%)(0.03%)
0.02%0.01% 0.00%
Mar 13 Lending Margin Deposits Funding & LiquidityCosts
Liability Mix Lending Mix Sep 13
Customer margin up 11bps
2.03%2.08%
(0.10%)
(0.01%) (0.05%)(0.01%)
0.20%0.02%
Sep 12 Lending Margin Deposits Funding & LiquidityCosts
Liability Mix Lending Mix Other Sep 13
Customer margin up 1bp

Personal Banking
(1) Average volumes (2) RBA Financial System / NAB (includes Business Banking and NAB Wealth)(3) APRA Banking System / NAB (includes Business Banking and NAB Wealth)
78 83 89 94
Mar 12 Sep 12 Mar 13 Sep 13
4.9%6.7% 7.6%
133 139 147 154
Mar 12 Sep 12 Mar 13 Sep 13
4.8%4.5%
5.8%
($bn) ($bn)
Housing loans1 Customer deposits1
Housing loan market share2 Household deposits market share3
14.7%15.0% 15.2% 15.3%
Mar 12 Sep 12 Mar 13 Aug 13
14.6% 14.7% 14.6% 14.5%
Mar 12 Sep 12 Mar 13 Aug 13
39
Personal Banking: Asset quality
40
169
73
187
132
Mar 12 Sep 12 Mar 13 Sep 13
(29.4%)(56.8%) 156.2%($m)
($m)
B&DD charge
($m)
($m)
873 845923 965
0.60%0.55%
0.58% 0.58%
Mar 12 Sep 12 Mar 13 Sep 13
Cards and personal loans 90+ DPD and % to total cards and personal loans outstandings
Mortgage 90+ DPD and impaired and % to total mortgage outstandings
Total 90+ DPD and impaired and % to total outstandings
765 752 807 838
0.56%0.52% 0.54% 0.53%
Mar 12 Sep 12 Mar 13 Sep 13
94 78 99 78
36
1.15%0.97%
1.24%1.45%
0.00%
0.50%
1.00%
1.50%
Mar 12 Sep 12 Mar 13 Sep 13
as % total cards and PLs90+ DPD
90+ DPD methodology change

41
Australian Mortgages Sep 13 Mar 13 Sep 12
Owner Occupied 72.2% 71.9% 71.4%
- of which First Home Buyer 8% 8% 8%
Investment 27.8% 28.1% 28.6%
Low Documentation 1.8% 2.0% 2.2%
Low Documentation LVR cap (without LMI) 60% 60% 60%
Variable rate lending drawn balance 72.6% 74.3% 73.8%
Fixed rate lending drawn balance 12.4% 9.9% 9.2%
Line of credit drawn balance 15.0% 15.8% 17.0%
Interest only drawn balance 31.3% 30.7% 30.3%
Mortgage balances attributed to:
- Proprietary 63.8% 65.3% 66.6%
- Broker 29.1% 27.4% 25.9%
- Introducer 7.1% 7.3% 7.5%
Mortgage final approvals attributed to:
- Proprietary 59.6% 57.4% 59.5%
- Broker 35.4% 38.1% 36.0%
- Introducer 5.0% 4.5% 4.5%
LMI Insured % of Total HL Portfolio 15.8% 15.6% 15.0%
Current LVR on an exposure calculated basis 55.4% 56.1% 56.3%
Current LVR on a drawn balance calculated basis2 47.7% 48.3% 48.5%
Customers in advance >1 month3 63.8% 64.1% 65.9%
Avg # of payments in advance4 7.9 n/a n/a
Average loan size $ (‘000) $265 $266 $262
90 + days past due 0.50% 0.52% 0.50%
Impaired loans 0.26% 0.27% 0.30%
Specific provision coverage 20.7% 21.2% 19.1%
Loss rate 0.04% 0.05% 0.06%
Australian mortgages1: Key metrics
(1) Includes Personal Banking, Business Banking and NAB Wealth(2) Comparative periods have been marginally revised to present data on a like-for-like basis(3) Ratio excludes Advantedge portfolio and offset accounts(4) Excludes loans in advance > 12 years that represents ~3% of the total population, offset accounts and Line of Credit
42
Australian mortgages: Change in LVR profile
Risk grade distribution of 90%+ LVR1,2
Current LVR breakdown of drawn balances3LVR breakdown of Homeside final approvals
(1) Includes Personal Banking, Business Banking and NAB Wealth, excludes Advantedge mortgages portfolio (2) Based on applicant risk as assessed at application using internal credit scorecard (3) Total current portfolio balances for Personal Banking, Business Banking and NAB Wealth, includes Advantedge mortgages portfolio
0%
20%
40%
60%
80%
100%
Mar09
Jun09
Sep09
Dec09
Mar10
Jun10
Sep10
Dec10
Mar11
Jun11
Sep11
Dec11
Mar12
Jun12
Sep12
Dec12
Mar13
Jun13
Sep13
LVR 60% or less LVR 60.01% to 70% LVR 70.01% to 80%LVR 80.01% to 90% LVR >90%
0%
20%
40%
60%
80%
100%
Mar09
Jun09
Sep09
Dec09
Mar10
Jun10
Sep10
Dec10
Mar11
Jun11
Sep11
Dec11
Mar12
Jun12
Sep12
Dec12
Mar13
Jun-13
Sep-13
LVR 60% or less LVR 60.01% to 70% LVR 70.01% to 80%LVR 80.01% to 90% LVR >90%
0%
20%
40%
60%
80%
100%
Mar09
Jun09
Sep09
Dec09
Mar10
Jun10
Sep10
Dec10
Mar11
Jun11
Sep11
Dec11
Mar12
Jun12
Sep12
Dec12
Mar13
Jun13
Sep13
Very High High Medium Low Very Low
LVR breakdown of final approvals1
0%
10%
20%
30%
40%
50%
0 < 60% 60 < 70% 70 < 80% 80 < 90% 90+
Mar 12 Sep 12 Mar 13 Sep 13

Personal Banking: Key metrics
43
FY10 FY11 FY12 FY13 FY13 vs FY10
Total # customers 4.1m 4.5m 5.1m 5.3m +1.2m
Mortgage market share1 13.3% 14.5% 15.0% 15.3% +200bps
Household deposit share2 13.5% 14.1% 14.7% 14.5% +100bps
Customer satisfaction3 74.6% 78.4% 82.6% 81.7% +710bps
Revenue ($m) 3,105 3,416 3,566 3,913 +26%
Cash earnings ($m) 743 932 1,045 1,228 +65%
Net interest margin (bps) 231 219 203 208 -23bps
FTEs (avg) 8,280 8,855 8,540 8,117 -2%
Revenue per average FTE ($000) 375 386 418 482 +29%
(1) RBA Financial System / NAB(2) APRA Banking System / NAB(3) Roy Morgan Research, Aust MFIs, population aged 14+, six month moving average. Customer satisfaction is based on customers who answered
very/fairly satisfied
Additional InformationBusiness BankingPersonal Banking
Wholesale BankingNAB WealthNZ BankingUK BankingNAB UK CREGreat Western BankGroup Asset QualityCapital and FundingOtherEconomic Outlook

Wholesale Banking
Largest Asset Servicing business5 in Australia with ~26% market share (by volume)
($bn)
Assets under custody & administration
Delivering value to Financial InstitutionsCustomer sales performance
Best advice on Use of Interest Rate Risk Management1
Lead Interest Rate provider where the relevant bank is lead domestic credit provider2
Most frequent provider of complex/structured finance where the relevant bank is lead domestic credit provider1
Best Advice on Foreign Exchange needs1
Provider of Interest Rate Swaps (% of primary relationships –Corporate)3
Provider of Spot Foreign Exchange (% of primary relationship –Corporate)3
Best Domestic Provider of FX Services as voted by Corporates – Australia4
110,000 NAB Traveller Card customers have loaded $477m for
their travel spend since the April 2012 launch
#1
Current ranking
Previous ranking
=#1
#1
#4
#4
#2
na
#1
#1
#1
#1
#1
#2
#2
(1) Peter Lee Associates – Large Corporate & Institutional Relationship Banking Australia Survey 2013. Ranking against the four major domestic banks; (2) Peter Lee Associates – Large Corporate & Institutional Relationship Banking Australia Survey 2013; (3) East & Partners Australian Corporate Banking Markets Report, July 2013; (4) Asiamoney FX Poll 2012; (5) Australian Custodial Services Association, Total Assets Under Custody for Australian Investors, June 2013; (6) Peter Lee Associates – Foreign Exchange Survey Australia 2012, Financial Institution Respondents. Ranking against the four major domestic banks; (7) Peter Lee Associates – Debt Securities Investor Survey Australia 2012. Ranking against the four major domestic banks; (8) AFMA, 2013 Australian Financial Markets Report
Foreign Exchange Survey of FI’s: Market Penetration, Market Share and Relationship Strength Index6
Interest Rate Swaps and Short Dated Securities Market Share7
AUD Repurchase Agreements, with 21.5% market share8
#1
#1
#1
45
Market leading positions
599 600 660 653 703 698 692 717
0
200
400
600
800
Sep 08 Sep 09 Sep 10 Sep 11 Mar 12 Sep 12 Mar 13 Sep 13
Wholesale Banking
(1) Peter Lee Associates – Debt Securities Originations Survey Australia 2013 (1a) ranking against all banks, (1b) ranking against the four major domestic banks; (2) Infrastructure Investor Awards, 2012 (includes Asia Pacific); (3) Infrastructure Journal Online League Tables Project Finance Mandated Lead Arranger (Australia & New Zealand), Half Year 2013; (4) Infrastructure Journal Online League Tables Project Finance Mandated Lead Arranger (Australia), Half Year 2013; (5) Kanganews, Australian Market Awards 2012; (6) Thomson Reuters US Private Placement Review, First Half 2013 – Traditional Private Placements
Infrastructure and Natural Resources
Infrastructure Bank of the Year, Asia 2
MLA Project Finance in Australasian PPPs 3
MLA Project Finance in Australian Power and Renewable sectors 4
Debt Capital Solutions
Australian Securitisation House of the Year 5
Top amongst the Australian banks in US Private Placements 6
#1
#1
#1
Wholesale Banking capabilities assist NAB’s clients with direct access to funding markets as well as providing funding and investment products via:• NABWealth (MLC) • JBWere and NAB Private Wealth • Business Bank and; • Private Bank
Wholesale Banking’s market leading debt capital raising and distribution capabilities have transacted over A$13.3bn in FY13, exclusive of NAB deals of A$14.2bn, and is recognised as having the Strongest Domestic Distribution to Retail1a & Institutional1b Investors for Hybrid Securities1 in Australia
46
Originate to distribute funding solutions Key transactions
Market leading positions
Aurizon Network Pty Ltd
Syndicated Debt Facilities
Joint Mandated Lead Arranger, Underwriter and Bookrunner
June 2013
Royal Bank of Canada
A$1.25bn
Inaugural Kangaroo Covered Bond
Joint Lead Manager and Joint Bookrunner
August 2013
Arqiva
GBP 3.7bn
Term Loan, Capex and Liquidity FacilitiesMandated Lead Arranger
US$600m
USPPJoint Lead Agent
May 2013
New Bendigo Hospital PPP
A$630m
Project Finance Facilities
Mandated Lead Arranger
May 2013
NSW Ports
A$2.02bn
Project Finance Acquisition Facility
Mandated Lead Arranger
May 2013
Gullen Range Wind Farm
A$247m
Construction and TermFacilities
Financial Advisor, Sole Mandated Lead Arranger and Bookrunner
June 2013

47
Wholesale Banking
10
14
18
22
26
2008 2009 2010 2011 2012 2013
ANZ CBA NAB Westpac (incl. St G)
Primary Supplier for IR swaps – Corporates
Interest rate hedging market share trends FX hedging market share trends
Interest rate hedging Relationship Strength FX hedging Relationship Strength
Source: East & Partners Corporate Survey July 2013 Source: Peter Lee FX Financials 2012 (All Financials)
460480500520540560580600620
2008 2009 2010 2011 2012
ANZ CBA NAB Westpac
Relationships Strength Index – IRD – Corporates
Rel
atio
nsh
ips
Str
eng
th I
nd
ex s
core
(%) (%)
Source: Peter Lee IRD Survey 2012 (All Corps)
450
470
490
510
530
550
570
2008 2009 2010 2011 2012
ANZ CBA NAB Westpac Deutsche
Relationships Strength Index – FX – Financial Institutions
Rel
atio
nsh
ips
Str
eng
th I
nd
ex s
core
Source: Peter Lee FX Financials 2012 (All Financials)
0
5
10
15
20
2008 2009 2010 2011 2012
ANZ CBA NAB Westpac Deutsche
Market share for FX – Financial Institutions
Additional InformationBusiness BankingPersonal BankingWholesale Banking
NAB WealthNZ BankingUK BankingNAB UK CREGreat Western BankGroup Asset QualityCapital and FundingOtherEconomic Outlook

2 527
(33)
(2)
(40)
(33)
(13)(9) (5)
(25)
4876
Sep 12 PiF Earning s o nasset s b ackingt he insurance
p o rt f o lio
C laims Lap ses M ar 13 Lap ses St reng t heningInsurancereserves
C laims Earning s o nasset s b ackingt he insurance
p o rt f o lio
Lo ssreco g nit io n
Increase ino p erat ingexp enses
Sep 13
NAB Wealth: Cash earnings
($m)
($m)
Investments cash earnings includes Private Wealth
Insurance cash earnings
49
183208
255
2416 10
2330
7
(1)(24)
(10)(3)
Sep 12 FUM/volumes InvestmentMargins
(Business mix& pricing)
Private Wealthvolumes &
margins andinclusion of
PW Asia
Annuityexperience(incl MtM
invest. profits)
Brokerage andequity lending
income
Mar 13 FUM/volumes IncreasedAsset
Managementrevenue
Private Wealthvolumes and
margins
Increasedoperatingexpenses
Other Sep 13
7648
2 527
(33)
(2)
(34)
(13)(6) (40)
Sep 12 PiF / Volumes Earnings onassets backingthe insurance
portfolio
Claims Lapses Mar 13 Lapses Claims Earnings onassets backingthe insurance
portfolio
Other Strengtheninginsurancereserves
Sep 13
(18)
NAB Wealth: FUM, Net Funds Flow and Investment sales
Movement in FUM1 Spot FUM by product group
Net Funds Flow by product group
($bn)
Product group 2H13 NFF ($m)
NFF as % of Opening FUM
1H13 NFF ($m)
MasterKey on sale 582 3% 385
MasterKey off sale (987) (7%) (1,023)
MLC Wrap 377 3% 309
Navigator (737) (6%) (642)
Plum, Business Super & Other
1,568 4% 3,065
Wholesale 491 1% (771)
Total Net Funds Flow 1,294 1% 1,323
($bn)
50
(1) FUM on a proportional ownership basis
0
5
10
15
20
25
30
35
40
45
50
MasterKey onsale
MasterKey offsale
MLC Wrap Navigator Plum,Business
Super & Other
Wholesale
124.7 136.7 145.1
1.311.4 1.3
9.9(0.7) (2.8)
Sep 12 Net flows InvestmentEarnings
Other Mar 13 Net flows InvestmentEarnings
Other Sep 13
68%66%
67%
%
Investments including Private Wealth: Cost to Income trends
65.7% 65.7%64.2%
59.0%
FY10 FY11 FY12 FY13
Retail FUM

NAB Wealth: Investments margin
Investments net income to average FUM
514 501 498 510 524 505 545
0.0%
0.2%
0.4%
0.6%
0.8%
1.0%
Sep 10 Mar 11 Sep 11 Mar 12 Sep 12 Mar 13 Sep 13
Investments net income Net income to average FUM (RHS)
($m)
51
Movement in total investments margin
0.86% 0.78% 0.77%
0.02%(0.05%) (0.04%) (0.01%) (0.01%)
Sep 12 Annuity experience Reclass of advisersales incentives
Business mix andpricing
MasterKey Custom toMLC Wrap migration
costs 2H12
Mar 13 Other Sep 13
NAB Wealth: Insurance
Premiums inforce (PiF)
1,493 1,524 1,536 1,611
Mar 12 Sep 12 Mar 13 Sep 13
4.9%2.1% 0.8%
PiF and Insurance sales as % of PiF
Insurance net income to average PiF
269
218
250 231
194
91
5%
15%
25%
35%
45%
Mar 11 Sep 11 Mar 12 Sep 12 Mar 13 Sep 13
Insurance net income Net income to average PiF (RHS)
1,436 1,466 1,493 1,524 1,536 1,611
10%
15%
20%
25%
30%
Mar 11 Sep 11 Mar 12 Sep 12 Mar 13 Sep 13
PiF Sales to PiF (RHS)
($m)
($m)
($m)
52
43% 45% 47% 47%
22% 22% 22% 23%
35% 33% 31% 30%
Mar 12 Sep 12 Mar 13 Sep 13
Bank Aligned IFA
Insurance sales by channel
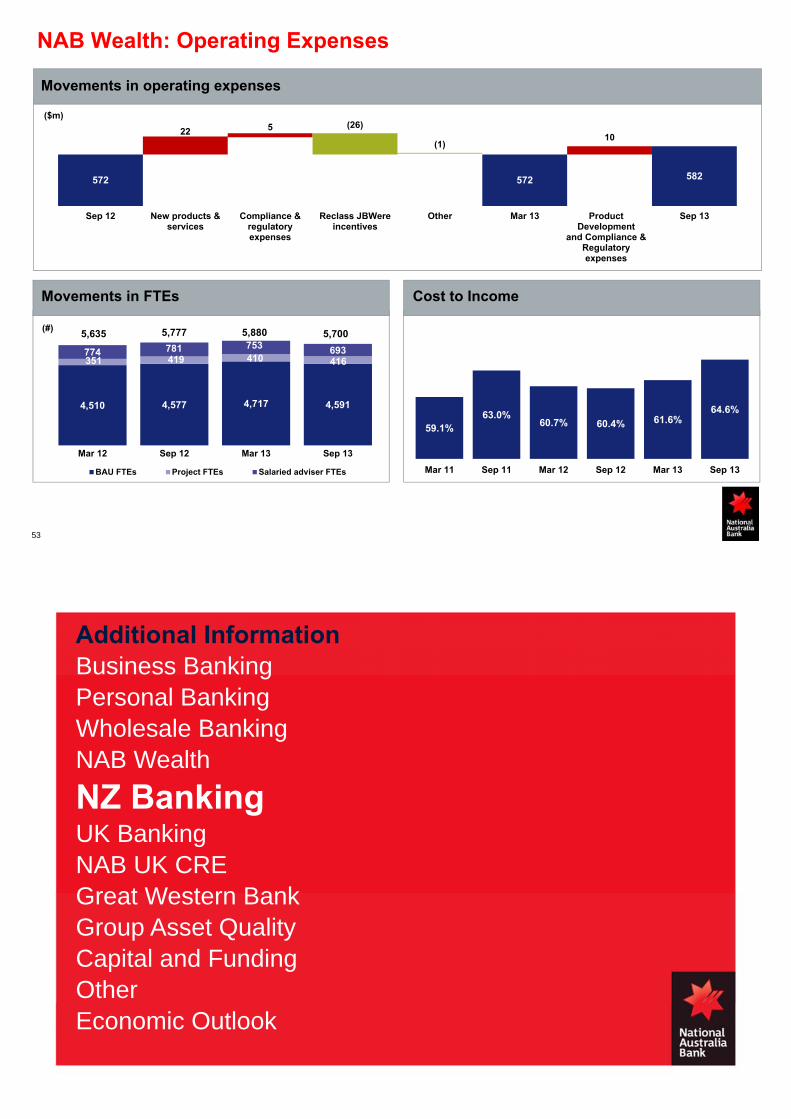
NAB Wealth: Operating Expenses
(#)
($m)
Movements in operating expenses
Movements in FTEs Cost to Income
59.1%63.0%
60.7% 60.4% 61.6%64.6%
Mar 11 Sep 11 Mar 12 Sep 12 Mar 13 Sep 13
4,510 4,577 4,717 4,591
351 419 410 416774 781 753 693
Mar 12 Sep 12 Mar 13 Sep 13
BAU FTEs Project FTEs Salaried adviser FTEs
5,7005,635 5,777 5,880
53
572 572 582
22 510
(26)
(1)
Sep 12 New products &services
Compliance ®ulatoryexpenses
Reclass JBWereincentives
Other Mar 13 ProductDevelopment
and Compliance &Regulatoryexpenses
Sep 13
Additional InformationBusiness BankingPersonal BankingWholesale BankingNAB Wealth
NZ BankingUK BankingNAB UK CREGreat Western BankGroup Asset QualityCapital and FundingOtherEconomic Outlook

2.24 2.242.35
2.332.38 2.40
2.33
Sep 10 Mar 11 Sep 11 Mar 12 Sep 12 Mar 13 Sep 13
New Zealand Banking
(NZ$m) (%)
(NZ$m)(NZ$m)
Cash earnings Net interest margin
Revenue v expense growth B&DD charge and B&DD as % of GLAs
385 356 387 401
Mar 12 Sep 12 Mar 13 Sep 13
3.6%(7.5%) 8.7%
944 937 981 984
375 388 395 396
Mar 12 Sep 12 Mar 13 Sep 13
Revenue Expenses
% Cost to income ratio
40.2%39.7% 41.4% 40.3%
55
34
64 5643
0.12%
0.22%0.19%
0.14%
Mar 12 Sep 12 Mar 13 Sep 13
B&DD charge B&DD as % of GLAs (annualised)
September 13 v March 13
September 13 v September 12
2.40%2.33%
(0.03%)(0.03%)
(0.02%) 0.01% 0.00% 0.00%
Mar 13 Lending margin Deposits Funding & LiquidityCosts
Liability Mix Lending Mix Other Sep 13
2.39% 2.36%
(0.04%)
(0.03%)(0.01%) (0.01%)0.04% 0.02%
Sep 12 Lending margin Deposits Funding & LiquidityCosts
Liability Mix Lending Mix Other Sep 13
56
Customer margin down 7bps
Customer margin down 1bp
New Zealand Banking: Net interest margin

New Zealand Banking: Volumes and market share
28.0 28.6 29.2 30.5
Mar 12 Sep 12 Mar 13 Sep 13
4.5%2.1% 2.1%(NZ$bn) (NZ$bn)
15.9 16.5 17.2 18.7
17.6 18.9 19.9 21.2
33.5 35.4 37.1
Mar 12 Sep 12 Mar 13 Sep 13
BNZ Partners BNZ Retail
(NZ$bn)
Business lending1 Retail lending1
Retail deposits1
7.5%5.7%
(1) Average volumes (2) RBNZ (historical market share rebased with latest revised RBNZ published data)
4.8%
27.6 27.8 28.4 29.2
1.5 1.5 1.51.5
29.1 29.3 29.930.7
Mar 12 Sep 12 Mar 13 Sep 13
Housing Unsecured Personal
2.7%0.7% 2.0%
57
39.9
Market share2
12%
14%
16%
18%
20%
22%
Mar 12 Sep 12 Mar 13 Aug 13
Housing Agribusiness Retail deposits
90+DPD assets to GLAs ratio is broadly flat on prior half
Gross impaired assets and 90+ DPD to GLAs were 1.09% at Sep 13, lower than 1.21% at Sep 12
Impairments continue to fall in business and retail due to favourable interest rate environment and improving economic conditions
Exposures in the commercial property, dairy farming and kiwifruit sectors are the main industry concerns
New Zealand Banking: Asset quality and LVR
(NZ$m)
(%)
Total 90+ DPD and GIAs as % GLAs
Net write-offs
0.24 0.27
0.180.22 0.25 0.24 0.23 0.22
Mar 10 Sep 10 Mar 11 Sep 11 Mar 12 Sep 12 Mar 13 Sep 13
Net write-offs to GLAs (annualised)
58
15.4%20.9% 21.5% 22.1% 18.6%
BNZ Peer 1 Peer 2 Peer 3 Peer 4
LVR Proportion (>80%) - June 131
(1) June 13 is the latest available LVR peer comparison
1018 9721099
860744 710 681 678
0.00%
0.60%
1.20%
1.80%
2.40%
Mar 10 Sep 10 Mar 11 Sep 11 Mar 12 Sep 12 Mar 13 Sep 13
90+ DPD and GIAs Total 90+ DPD and GIAs as % GLAs (RHS)

59
New Zealand mortgages: Key metrics
New Zealand Mortgages Sep 13 Mar 13 Sep 12
Low Document Loans 0.23% 0.27% 0.26%
Proprietary 100% 100% 100%
Third Party Introducer 0.0% 0.0% 0.0%
Variable rate lending drawn balance 46.6% 52.7% 57.7%
Fixed rate lending drawn balance 49.4% 43.1% 38.0%
Line of credit drawn balance 4.0% 4.2% 4.3%
Interest only drawn balance1 23.0% 22.4% 21.7%
Insured % of Total HL Portfolio2 12.5% 12.3% 11.8%
Loan to Value (at origination) 64.7% 64.3% 63.7%
Average loan size NZ$ (‘000) 272 265 258
90 + days past due 0.20% 0.22% 0.26%
Impaired loans 0.21% 0.32% 0.35%
Specific provision coverage 35.2% 32.1% 39.0%
Loss rate 0.07% 0.09% 0.10%
(1) Excludes Line of Credit(2) Insured includes both LMI and Low Equity Premium
60
New Zealand Banking: Commercial Real Estate
Region Auckland Other Regions Total
Location % 39% 61% 100%
Loan Balance < NZ$5m 11% 25% 36%
Loan Balance > NZ$5m<NZ$10m 6% 7% 13%
Loan Balance > NZ$10m 22% 29% 51%
Loan tenor < 3 yrs 36% 52% 88%
Loan tenor > 3 < 5 yrs 2% 5% 7%
Loan tenor > 5 yrs 1% 4% 5%
Average loan size NZ$m 4.5 2.8 3.4
Security Level1 Fully Secured 24% 39% 63%
Partially Secured 13% 19% 32%
Unsecured 2% 3% 5%
90+ days past due 0.22% 0.61% 0.83%
Impaired Loans 0.16% 0.86% 1.02%Specific Provision Coverage 67.6% 42.4% 46.3%
Trend Sep 13 Mar 13 Sep 12 Mar 12
90+ days past due 0.83% 0.70% 0.81% 0.56%
Impaired Loans 1.02% 1.36% 1.31% 1.34%
Specific Provision Coverage 46.3% 35.8% 22.9% 17.2%
Total NZ$7.2bn11.6% of NZ Gross Loans & Acceptances
(1) Fully Secured represents loans of up to 70% of the Market Value of Security. Partially Secured are over 70%, but not Unsecured. Unsecured is primarily Negative Pledge lending
Office34%
Tourism & Leisure
4%
Land8%
Residential7%
Industrial16%
Other7%
Retail24%

Additional InformationBusiness BankingPersonal BankingWholesale BankingNAB WealthNZ Banking
UK BankingNAB UK CREGreat Western BankGroup Asset QualityCapital and FundingOtherEconomic Outlook
UK Banking
(£m) (%)
(£bn)
11.8 11.3 10.3 9.4
6.1 5.8
0.3 0.2
17.9 17.1
10.6 9.6
Mar 12 Sep 12 Mar 13 Sep 13
Other business Commercial property
(9.4%)
(4.5%)(38.0%)
(£bn)(£bn)
14.3 15.0 15.6 15.8
1.5 1.3 1.2 1.315.8 16.3 16.8 17.1
Mar 12 Sep 12 Mar 13 Sep 13Housing Unsecured
1.8%3.2% 3.1%
Personal lending1
Costs
Business lending1,2 Customer deposits1
Net interest margin
Cost to Income Ratio (excluding Conduct Issues)%
62(1) Average volumes(2) On 5 October UK CRE was separated from UK Banking
2.091.97
2.062.19
Mar 12 Sep 12 Mar 13 Sep 13
323 328
22 28
348 349 345 356
Mar 12 Sep 12 Mar 13 Sep 13
Costs excluding Conduct Issues Conduct Issues (excl Non-Cash items)
58.8% 63.1% 65.9% 66.1%
17.5 17.7 17.9 18.2
7.6 7.9 7.1 5.9
25.1 25.6 25.0 24.1
Mar 12 Sep 12 Mar 13 Sep 13Deposits Term Deposits
(3.6%)2.0% (2.3%)

UK Banking: Net interest margin
September 13 v March 13
September 13 v September 12
Customer margin up 4bps
Customer margin down 5bps
63
2.03%2.12%
(0.16%)
(0.07%)(0.01%)0.12%
0.09%
0.09% 0.02% 0.01%
Sep 12 Transfer to NABUK CRE
Lending Margin Deposits Funding &Liquidity Costs
Liability Mix Lending Mix Other FSCS Levy Sep 13
2.06%
2.19%
(0.01%) (0.02%)(0.02%)
0.09%0.02%
0.07%
Mar 13 Lending Margin Deposits Funding & LiquidityCosts
Liability Mix Lending Mix FSCS Levy Sep 13
UK Banking: Funding Mix and Capital Ratios
Clydesdale Bank PLC Stable Funding Index1
Interest rate earned on ~£8bn of free funds3
Clydesdale Bank PLC Core Tier 1 Ratio2
64
0
100
200
300
400
500
600
Sep 07 Sep 08 Sep 09 Sep 10 Sep 11 Sep 12 Sep 13
5 year average rolling swap rate
2 year average rolling swap rate
(bps)
76.0% 78.0%91.6%
90.2%
13.4% 14.3%
16.6% 18.3%89.4% 92.3%
108.2% 108.5%
Mar 12 Sep 12 Mar 13 Sep 13
CFI TFI
9.2% 8.4%10.4%
10.5%
Mar 12 Sep 12 Mar 13 Sep 13
(1) Stable funding index (SFI) based on spot balances (2) On a UK Prudential Regulation Authority basis (3) Free funds are shareholders equity and non-interest bearing deposits. These flows are hedged over a 2 and 5 year period to reduce volatility from
movements in benchmark interest rates
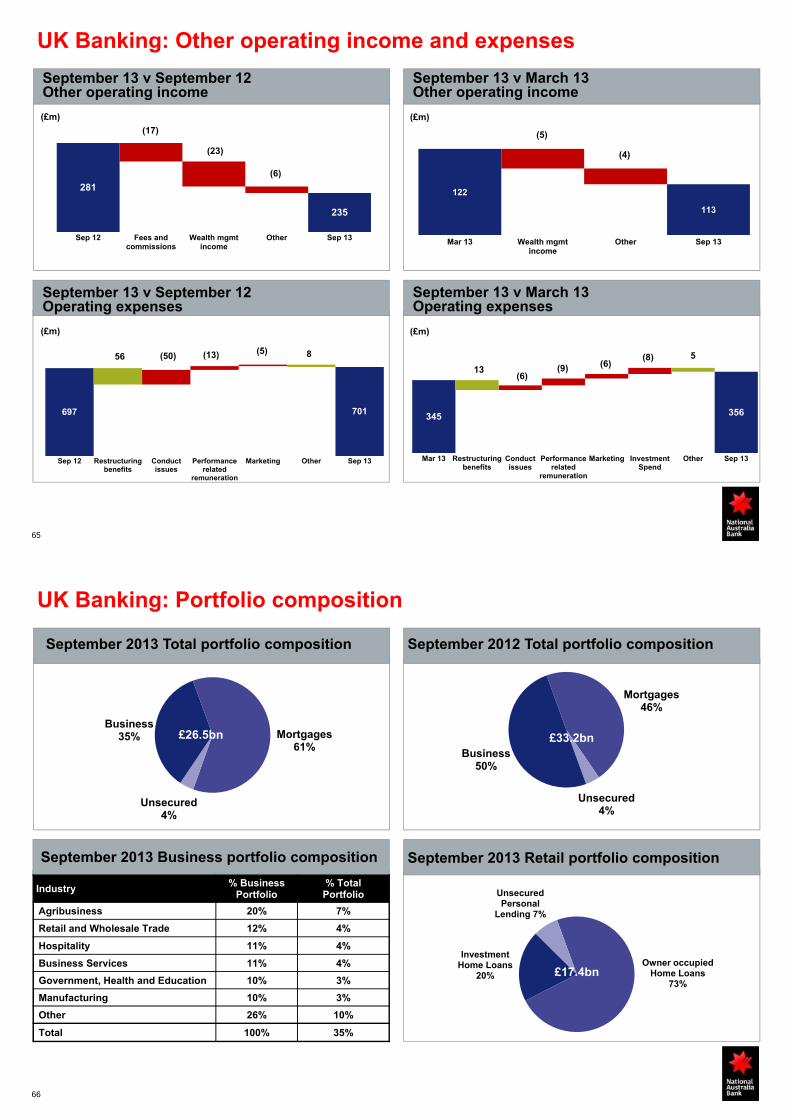
UK Banking: Other operating income and expenses
281
235
(17)
(23)
(6)
Sep 12 Fees andcommissions
Wealth mgmtincome
Other Sep 13
122
113
(5)
(4)
Mar 13 Wealth mgmtincome
Other Sep 13
(£m) (£m)
September 13 v March 13 Other operating income
September 13 v September 12Other operating income
697 701
(50) (13) (5)56 8
Sep 12 Restructuringbenefits
Conductissues
Performancerelated
remuneration
Marketing Other Sep 13
(£m) (£m)
September 13 v March 13 Operating expenses
September 13 v September 12Operating expenses
65
345 356
(6)(9) (6)
(8)13
5
Mar 13 Restructuringbenefits
Conductissues
Performancerelated
remuneration
Marketing InvestmentSpend
Other Sep 13
Mortgages 46%
Unsecured 4%
Business 50%
UK Banking: Portfolio composition
September 2013 Total portfolio composition
September 2013 Business portfolio composition
September 2012 Total portfolio composition
Owner occupiedHome Loans
73%
Investment Home Loans
20%
Unsecured Personal
Lending 7%
£17.4bn
66
£33.2bn £33.2bn
September 2013 Retail portfolio composition
Mortgages 61%
Unsecured 4%
Business 35% £26.5bn
Industry% Business
Portfolio% Total
Portfolio
Agribusiness 20% 7%
Retail and Wholesale Trade 12% 4%
Hospitality 11% 4%
Business Services 11% 4%
Government, Health and Education 10% 3%
Manufacturing 10% 3%
Other 26% 10%
Total 100% 35%

(%)
UK Banking: Asset quality
90+ DPD and GIAs as a % of GLAs1
0.97
2.64 2.55 2.893.79
1.72 1.60
0.80 0.570.79
0.97
0.67 0.59
3.443.12
3.68
4.76
2.39 2.19
Mar 11 Sep 11 Mar 12 Sep 12 Mar 13 Sep 13
GIA as % of GLAs 90+ DPD as % of GLAs
(%)
90+ DPD as a % of total GLAs by product1
0.00%
0.20%
0.40%
0.60%
Mortgages Business Loans Personal
Mar 11 Sep 11 Mar 12 Sep 12 Mar 13 Sep 13
67
Coverage Ratio1
0.0
0.5
1.0
1.5
2.0
2.5
3.0
Sep 09 Mar 10 Sep 10 Mar 11 Sep 11 Mar 12 Sep 12 Mar 13 Sep 13
Coverage ratio (Total Provisions to GLAs)
Gross Impaired Assets1
0.0%
0.5%
1.0%
1.5%
2.0%
2.5%
3.0%
3.5%
4.0%
0
200
400
600
800
1,000
1,200
1,400
Mar 11 Sep 11 Mar 12 Sep 12 Mar 13 Sep 13
Gross impaired assets Gross impaired assets as % of GLAs
(1) On 5 October 2012 UK CRE was separated from UK Banking
(£m)
6868
UK Mortgages Sep 13 Mar 13 Sep 12
Owner Occupied 78.3% 79.6% 79.8%
Investment 21.7% 20.4% 20.2%
Low Document 0.0% 0.0% 0.0%
Proprietary 60.0% 63.3% 65.1%
Third Party Introducer 40.0% 36.7% 34.9%
Variable rate lending drawn balance 56.5% 60.5% 62.9%
Fixed rate lending drawn balance 35.3% 30.5% 27.5%
Line of credit drawn balance 8.2% 9.0% 9.6%
Interest only drawn balance1 40.9% 42.3% 43.5%
LMI Insured % of Total HL Portfolio 1.1% 1.1% 1.2%
Loan to Value (at Origination) 63.3% 63.1% 62.9%
Loan to Value Indexed 51.5% 53.2% 53.6%
Average loan size £ (‘000) 104 102 100
90+ days past due 0.41% 0.50% 0.51%
Impaired loans 0.47% 0.45% 0.46%
Specific provision coverage 23.8% 22.0% 20.0%
Loss rate 0.06% 0.06% 0.09%
UK mortgages: Key metrics
(1) Excludes Line of Credit

Restructuring – provision utilisation and benefits profile
£mActual FY13
Expected FY13
Expected FY14
Expected FY15
Actual 62 47 75 86
Annualised run rate 80 64 76 86
Total Cumulative FTE 1,422 1,276 1,403 1,432
Restructuring project is now substantiallycomplete with programme benefits delivered12 months ahead of schedule
£106m of the original £139m provisionutilised to date
Timing of provision utilisation currently lagsrestructuring activity
Cost benefits delivered of £62m in FY13(£80m on an annual run-rate basis)
FTEs were reduced by 1,422 between Sep2011 and Sep 2013 (exceeding the planned2015 total of c1,400)
69
Benefits profile
£mRestructuring
costsProvision
Utilised Remaining
Restructuring provisions 139 106 33
Software write-off 36
Total 175
1
1
(1) Incorporates benefits and FTE reductions related to pre-existing restructuring programs in Business & Private Bank
1
UK Banking: Conduct Issues
7070
• Claims related to legacy issues associated with mis-selling of products remain a key issue for the UK banking industry
• Uncertainty in relation to these matters is likely to continue for some time
• Additional £67m charge taken in 2H13 cash earnings (£104m in FY13) with £28m reported in UK and rest in Group Corporate Centre
• PPI provision has been increased by £130 million to £152 million and remains under review (details over page)
• Mortgage repayment irregularities relate to a mortgage payment system error resolved in 2010. Costs include both customer redress and associated penalties
• CPP Scheme of Arrangement refers to Card Protection Plan Limited products sold to UK Banking customers
• Interest Rate Hedging Products (IRHPs) refers to review of the sales of interest rate hedging products. Provisions of £36m raised in FY13 (in Group Corporate Centre). Started contacting customers, but determination of redress is complex and difficult to estimate.
• “Other matters” refers to matters subject to confidentiality agreements.
Issue (£m)Charge Remaining
Provision 1H13 2H13 FY13
Mortgage Repayments Irregularities 13 24 37 16
CPP Scheme of Arrangement 9 4 13 12
UK cash earnings impact 22 28 50 28
Interest Rate Hedging Products 15 21 36 49
Other matters 0 18 18 36
Group cash earnings impact 37 67 104 113
Payment Protection Insurance (PPI) 0 130 130 152
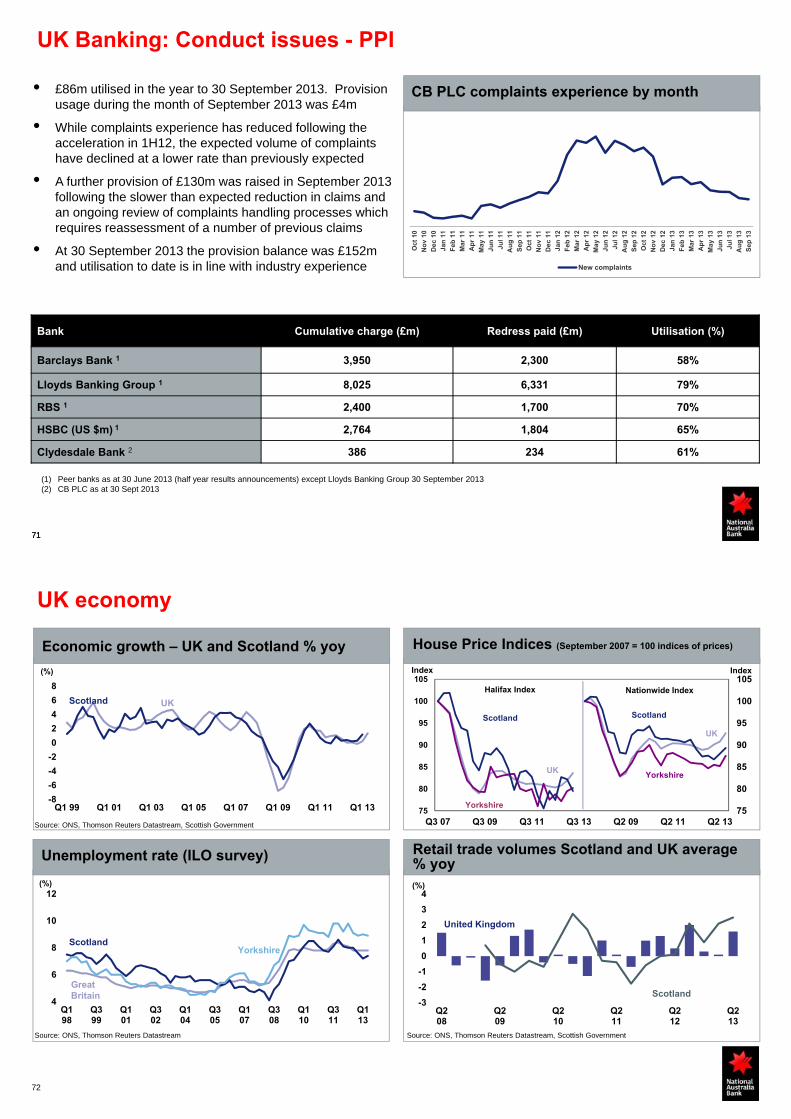
UK Banking: Conduct issues - PPI
71
• £86m utilised in the year to 30 September 2013. Provision usage during the month of September 2013 was £4m
• While complaints experience has reduced following the acceleration in 1H12, the expected volume of complaints have declined at a lower rate than previously expected
• A further provision of £130m was raised in September 2013 following the slower than expected reduction in claims and an ongoing review of complaints handling processes which requires reassessment of a number of previous claims
• At 30 September 2013 the provision balance was £152m and utilisation to date is in line with industry experience
(1) Peer banks as at 30 June 2013 (half year results announcements) except Lloyds Banking Group 30 September 2013 (2) CB PLC as at 30 Sept 2013
Bank Cumulative charge (£m) Redress paid (£m) Utilisation (%)
Barclays Bank 1 3,950 2,300 58%
Lloyds Banking Group 1 8,025 6,331 79%
RBS 1 2,400 1,700 70%
HSBC (US $m) 1 2,764 1,804 65%
Clydesdale Bank 2 386 234 61%
CB PLC complaints experience by month
Oct
10
No
v 10
Dec
10
Jan
11
Feb
11
Mar
11
Ap
r 11
May
11
Jun
11
Jul 1
1
Au
g 1
1
Sep
11
Oct
11
No
v 11
Dec
11
Jan
12
Feb
12
Mar
12
Ap
r 12
May
12
Jun
12
Jul 1
2
Au
g 1
2
Sep
12
Oct
12
No
v 12
Dec
12
Jan
13
Feb
13
Mar
13
Ap
r 13
May
13
Jun
13
Jul 1
3
Au
g 1
3
Sep
13
New complaints
71
UK economy
Economic growth – UK and Scotland % yoy House Price Indices (September 2007 = 100 indices of prices)
Unemployment rate (ILO survey) Retail trade volumes Scotland and UK average % yoy
72
-8
-6
-4
-2
0
2
4
6
8
Q1 99 Q1 01 Q1 03 Q1 05 Q1 07 Q1 09 Q1 11 Q1 13
Scotland UK
(%)
75
80
85
90
95
100
105
75
80
85
90
95
100
105
Q3 07 Q3 09 Q3 11 Q3 13 Q2 09 Q2 11 Q2 13
Scotland
UK
Yorkshire
Yorkshire
Scotland
UK
Halifax Index Nationwide Index
4
6
8
10
12
Q198
Q399
Q101
Q302
Q104
Q305
Q107
Q308
Q110
Q311
Q113
Scotland
Great Britain
Yorkshire
(%)
-3
-2
-1
0
1
2
3
4
Q208
Q209
Q210
Q211
Q212
Q213
United Kingdom
Scotland
(%)
Index Index
Source: ONS, Thomson Reuters Datastream, Scottish Government
Source: ONS, Thomson Reuters Datastream, Scottish GovernmentSource: ONS, Thomson Reuters Datastream

Additional InformationBusiness BankingPersonal BankingWholesale BankingNAB WealthNZ BankingUK Banking
NAB UK CREGreat Western BankGroup Asset QualityCapital and FundingOtherEconomic Outlook
NAB UK CRE: Commercial Real Estate
74
Total £4bn¹
Office17%
Tourism & Leisure
6%
Residential38%
Industrial9%
Other4%
Land7%
Retail19%
Region North East South West Total
Location % 29% 29% 15% 27% 100%
Loan Balance2 < £2m 13% 14% 6% 14% 47%
> £2m < £5m 7% 8% 2% 5% 22%
> £5m 9% 7% 7% 8% 31%
Average loan tenor < 3 yrs 16% 15% 8% 14% 53%
Average loan tenor > 3 < 5 yrs 3% 4% 2% 2% 11%
Average loan tenor > 5 yrs 10% 10% 5% 11% 36%
Average loan size (£m) spot £0.8m £0.7m £1.08m £0.74m £0.78m
Security Level3 Fully Secured 18% 13% 11% 17% 59%
Partially Secured 10% 15% 4% 10% 39%
Unsecured 1% 1% 0% 0% 2%
Sep 13 Mar 13
90+ days past due (£m) 127 185
90+ days past due (%) 3.18% 3.86%
Impaired loans (£m) 979 1,051
Impaired Loans (%) 24.39% 21.78%
Specific Provision Coverage 37.76% 31.53%
(1) Total portfolio of £4.0 billion includes £0.1bn of non-CRE assets (2) Distribution based on loan balance(3) Fully Secured represents loans of up to 70% of the market value of security, Partially Secured are over 70%, but not Unsecured

Additional InformationBusiness BankingPersonal BankingWholesale BankingNAB WealthNZ BankingUK BankingNAB UK CRE
Great Western BankGroup Asset QualityCapital and FundingOtherEconomic Outlook
76
(US$m)(US$bn)
(US$m)
Great Western Bank
Cash earnings
Loan portfolio composition B&DD charge and asset quality metrics
(US$bn)
5.8 6.1
0.5 0.5 0.4 0.3
5.74.9
Mar 12 Sep 12 Mar 13 Sep 13
GLAs (ex acq workout) Acquired workout loans
Gross loans & acceptances
11 91314
Mar 12 Sep 12 Mar 13 Sep 130.0%
1.0%
2.0%
3.0%
B&DDs 90DPD + Impaired Assets / GLAs (ex covered loans)
1.2 1.4 1.4 1.6
4.24.8 4.8 4.8
Mar 12 Sep 12 Mar 13 Sep 130%
5%
10%
15%
20%
25%
Agri Other Agri as % of total (RHS)
50 50 55 58
Mar 12 Sep 12 Mar 13 Sep 13

Additional InformationBusiness BankingPersonal BankingWholesale BankingNAB WealthNZ BankingUK BankingNAB UK CREGreat Western Bank
Group Asset QualityCapital and FundingOtherEconomic Outlook
Group portfolio
Housing Loans55%
Term Lending31%
Acceptances6%
Overdrafts3%
Leasing2%
Credit Cards2%Other
1%
Business Banking
38%
NZ Banking10%
Corporate Functions
(includes SGA) 1%
Personal Banking
32%
NAB UK CRE1%
UK Banking9%
Wholesale Banking 4%
MLC, NAB Wealth
4%
GWB1%
Gross loans and acceptances by business unit as at September 2013
Gross loans and acceptances by product as at September 2013
90+ DPD & gross impaired assets as a % of gross loans and acceptances by product
78
0.0%
0.5%
1.0%
1.5%
2.0%
Mar 10 Sep 10 Mar 11 Sep 11 Mar 12 Sep 12 Mar 13 Sep 13
Mortgages Impaired Business Impaired Mortgages 90+ DPD
Business 90+ DPD Unsecured 90+ DPD
Imp
aire
d90
+ D
PD

Group gross loans and acceptances
Note: These charts use spot exchange rates. Changes in exchange rates relative to the Australian dollar since 2008 have partly affected growth rates
Retail - secured
Non Retail
-10 -5 0 5 10 15 20
Sep 13 Mar 13 Sep 12 Mar 12 Sep 11 Mar 11
Retail - unsecuredRetail - unsecured
($bn)
($bn)
Industry balances Gross loans and acceptances by geography
Retail portfolio – outstandings volumeGroup asset composition –growth by product segment
79
-2%
2%
6%
10%
14%
18%
-
50
100
150
200
250
300
350
Sep
-10
Mar
-11
Sep
-11
Mar
-12
Sep
-12
Mar
-13
Sep
-13
($bn)
Group Retail Outstandings 12 Month Rolling Growth Rate
Australia75.2%
Europe11.3%
New Zealand10.6%
United States1.5%
Asia1.4%
0 40 80 120 160 200 240 280
Real estate - mortgage
Commercial property services
Other commercial and industrial
Agriculture, forestry, fishing & mining
Financial, investment and insurance
Asset and lease financing
Personal lending
Manufacturing
Real estate - construction
Government and public authorities
Sep 12 Sep 13
Group portfolio – change over three year period
Housing Loans50%
Term Lending28%
Acceptances11%
Overdrafts3%
Leasing4%
Credit Cards2%
Other 2%
September 2013 – Gross loans and acceptances by product
September 2013 – Gross loans and acceptances by geography
September 2010 – Gross loans and acceptances by product
September 2010 – Gross loans and acceptances by geography
Housing Loans55%
Term Lending31%
Acceptances6%
Overdrafts3%
Leasing2%
Credit Cards2%Other
1%
80
Australia74.7%
Europe13.8%
New Zealand9.4%
United States1.6%
Asia0.5%
Australia75.2%
Europe11.3%
New Zealand10.6%
United States1.5%
Asia1.4%

Group provision balances and coverage ratios
($m)
3,058 3,142 3,049 2,959
Mar 12 Sep 12 Mar 13 Sep 13
1,3371,641 1,731 1,645
179
174 176 177 118
168 103 2081,634
1,983 2,010 2,030
Mar 12 Sep 12 Mar 13 Sep 13
Business ≤$25m Retail Single Names >$25m
($m)
1,155 1,098 976
1,162
0.0%
0.2%
0.4%
0.6%
0.8%
1.0%
Mar 12 Sep 12 Mar 13 Sep 13
Net write-off volumes
Net write-offs as a % of Gross Loans and Acceptances (annualised) (RHS)
($m)
Net write-off volumes
Collective provision balances Specific provision balances
81
Coverage ratios (with and without GRCL top-up)
GRCL top-up (pre-tax) as a % of Credit Risk Weighted AssetsCollective Provisions as a % of Credit Risk Weighted Assets
Basel IIIBasel II
1.02% 1.05% 1.04% 0.99% 0.94%
0.30% 0.25% 0.25% 0.23% 0.22%
1.32% 1.30% 1.29% 1.22% 1.16%
0.0%
0.5%
1.0%
1.5%
Mar 12 Sep 12 Mar 13 Mar 13 Sep 13
Group provision movements
Collective provision Specific provision
82
1,073 1,029 994 933
431329 377
367
793
746
336 363
349 343
233
228 224 253
212
268 258 224
246222
191156
70 320320
320
Mar 12 Sep 12 Mar 13 Sep 13
Group economic cycleadjustment
Other
Wholesale Banking
NZ Banking
NAB UK CRE
UK Banking
Personal Banking
Business Banking
3,0583,142
3,049 2,959
937 961 966
700
37 43 50
48
355
672
216
270
489690152
147 141 132
21
29 37 71
132
131 111 119
Mar 12 Sep 12 Mar 13 Sep 13
Other
Wholesale Banking
NZ Banking
NAB UK CRE
UK Banking
Personal Banking
Business Banking
1,634
1,983 2,010 2,030
($m) ($m)

8383
Eligible Provisions and Regulatory Expected Loss
($m)Sep 13 Mar 13
Defaulted Non-Defaulted Defaulted Non-Defaulted
Eligible Provisions
Collective Provision 460 2,499 481 2,568
Specific Provisions 2,030 2,010
General Reserve for Credit Losses 539 544
Collective provision on standardised portfolio (70) (564) (62) (524)
Specific provisions on standardised portfolio (302) (259)
Partial Write Offs on IRB portfolio 1,512 3,084
Total Eligible Provisions 3,630 2,474 5,254 2,588
Regulatory Expected Loss 4,298 2,345 5,858 2,444
Shortfall in EP over EL (100% CET1 Deduction) 668 - 604 -
Surplus in EP over EL (Tier 2 capital for non-defaulted) - 129 - 144
Mortgages61%
Unsecured5%
Other Business
33%
Commercial Property
1%
8484
Group lending mix
UK Banking portfolio breakdown – total £26.5bn
(1) Includes Business Banking Asia gross loans and acceptances of $4.5bn at September 2013 (2) Includes Personal Banking, Business Banking and NAB Wealth
Australian portfolio breakdown – total $384.5bn1
Mortgages 61%
Term Loans -Business 26%
Bills 8%
Personal Loans and Other 1%
Credit Cards 2%
Overdraft 2%
NZ Banking portfolio breakdown – total NZ$62.1bn
NSW 33%
Vic 31% Qld 20%
SA 5%
WA 11%
Australian mortgages2
Personal Lending 3%Other
Commercial 11%
Manufacturing 4%
Retail and Wholesale Trade 4%
Agriculture, Forestry and Fishing 19%
Commercial Property 12%
Mortgages 47%

85
Agricultural and Mining exposures
Agriculture, Forestry and Fishing exposures Mining exposure
Agriculture portfolio asset quality1
Impaired assets and 90+DPD <1% of GLAs
Agriculture, Forestry and Fishing EAD $37.2bn September 2013
Australia 57%
NZ 32%
UK 7%
US 4%
EAD $20.3bn September 2013
Well secured portfolio
Highly diversified portfolio by geography and type
Strong Agri banking network with over 600 specialist bankers provides underwriting advantage
Fully Secured
79%
Partially secured
20%
Unsecured1%
Australian Agriculture portfolio - September 2013
Gold 5%
Mining 36%
Mining Services
27%
Oil & Gas 32%
EAD $9.55bn September 2013
(1) Fully secured is where the loan amount is less than 100% of the bank extended value of security; partially secured is where the loan amount is greater than 100% of the bank extended value of security; unsecured is where no security is held and negative pledge arrangements are normally in place. Bank extended value is calculated as a discount to market value based on the nature of the underlying security
Australian Agricultural exposures
Dairy 7%
Grain 10%
Other Crop & Grain 9%
Cotton 8%
Vegetables 3%
Beef 18%
Sheep/Beef 5%
Sheep 2%Other Livestock
1%Poultry 1%
Mixed 25%
Services 11%
86
(1) Measured as balance outstanding at September 2013 per APRA Commercial Property ARF 230 definitions(2) Excludes SGA (3) Includes SGA, Asia and UK Banking
Group Commercial Property by type Group Commercial Property by geography
Commercial Real Estate – Group Summary1
Aus NAB UK CRE NZ USA2 Other3 Total
TOTAL CRE (A$bn) 44.8 6.9 6.4 1.4 1.2 60.7
Increase/(decrease) on Mar 13 (A$bn) (0.4) (0.1) 1.0 0.2 (0.1) 0.6
% of GLAs 11.4% 98.6% 11.6% 17.6% 2.2% 11.6%
Change in % on March 2013 (0.3%) 2.5% 0.4% (3.1%) (0.4%) (0.4%)
Total $60.7bn11.6% of Gross Loans & Acceptances
Australia73.8%
New Zealand10.5%
USA2.2%
Asia1.2%
SGA0.3%
United Kingdom
12.0%Office27.3%
Tourism & Leisure
4.9%
Residential12.0%
Industrial14.0%
Other6.8%
Land8.3%
Retail26.7%

Additional InformationBusiness BankingPersonal BankingWholesale BankingNAB WealthNZ BankingUK BankingNAB UK CREGreat Western BankGroup Asset Quality
Capital and FundingOtherEconomic Outlook
88
Credit RWA movement
($bn)
Credit RWA movement March 2013 to September 2013
88
307.5314.7
14.7
(3.4)(0.1) (4.0)
Mar 13 Net reduction Methodology changesand data validation
Credit quality andportfolio mix
FX Sep 13

Group Basel III Common Equity Tier 1 Ratios
(%)
7.908.22 8.43
9.79 10.19 10.35
11.58 11.71 11.80
Common Equity Tier 1 Tier 1 Total Capital BIS Equivalent
9.57
Sep 12 1 Mar 13 Sep 13
9.99 10.25
89
(1) Estimated Basel III ratios
90
Asset funding – September 2013
(1) Other assets and liabilities comprises mainly trading derivatives(2) Repurchase agreements entered into are materially offset by reverse repurchase agreements with similar maturity profiles as part of normal
trading activities (3) Shareholder equity excludes preference shares and other contributed equity
Shareholders Equity3
76
107
79
Reverse Repurchase Agreements2Repurchase Agreements2 23
62
Core Assets
Life Insurance Assets
CFI 69%
TFI 20%
SFI 89%
Other Assets1
Assets Liabilities & Equity
808 808
527
19
Term Funding < 12 Months 29
Customer Deposits
Term Funding > 12 Months
Short Term Funding
Life Insurance Liabilities
Other Liabilities1
78
42
104
366
76
($bn)
Liquid AssetsShort Term Funding of Core Assets 28

91
Remain focused on growing customer deposits
($bn)
Business deposit growth2Household deposit growth2
(1) NZ and UK (incl CRE) in local currency, all other customer deposit growth less lending growth in AUD(2) APRA Monthly Banking Statistics (Aug 2013). Business deposits excludes financial corporation deposits and certificates of deposits
Customer deposits growth less lending growth – Mar 13 vs Sep 131 Group customer deposits by product – Sep 13
($bn)
155
150
127
138
90
100
110
120
130
140
150
160
Sep 09 Mar 10 Sep 10 Mar 11 Sep 11 Mar 12 Sep 12 Mar 13 Aug 13
NAB Peer 1 Peer 2 Peer 3
Indexed Sep 09 = 100132
100
125
130
90
100
110
120
130
140
Sep 09 Mar 10 Sep 10 Mar 11 Sep 11 Mar 12 Sep 12 Mar 13 Aug 13
NAB Peer 1 Peer 2 Peer 3
Indexed Sep 09 = 100
79
118
170
Savings & Investments 2 year CAGR
9.2% Transaction2 year CAGR
7.5%
Term deposits2 year CAGR
8.4%
-1.7
-0.9
-0.2
-0.10.7
1.8 7.0
2.4 Total
BB
NZ (NZD bn)
UK (incl CRE) (£bn)
Other
Wealth
WB
PB (incl UBank)
Funding profile remains robust
92
Term Wholesale Funding Issuance & Maturity Profile
(1) Weighted average maturity of 3.9 years includes senior, secured and sub debt with more than 12 months remaining term to maturity(2) Source: Bank covered bond investor reports & APRA Monthly Banking Statistics as at 31 August 2013. Remaining capacity based on
current rating agency over collateralisation (OC) & legislative limit
• The weighted average remaining maturity of the Group’s term funding index qualifying senior, secured and subordinated debt (includes debt with > 12 months remaining term to maturity) is 3.9 years (3.7 years as at September 2012)
•The weighted average remaining maturity of the Group’s senior, secured and subordinated debt is 3.2 years (3.1 years as at September 2012)
•The weighted average remaining maturity of the Group’s covered bond debt is 5.9 years. The weighted average maturity of covered bonds raised by the Group over the 2013 financial year was approximately 7.6 years
•The FY14 Term funding requirement is driven by the need to refinance term debt that has less than 12 months remaining to maturity during FY15
Robust Funding Profile
05
101520253035
Sep 10 Sep 11 Sep 12 Sep 13 Sep 14 Sep 15 Sep 16 Sep 17 Sep 18 Beyond…
Non-Government Guaranteed - Unsecured Non-Government Guaranteed - Secured (Total A$25bn) Government Guaranteed (Total A$5bn)
Weighted average maturity 3.9 years1
MaturitiesIssuance
($bn)
Australian Covered Bond issuance2
12 13 15 15
25 1828 29
32%
44%36%
34%
0%
10%
20%
30%
40%
50%
NAB Peer 1 Peer 2 Peer 3
Issued Remaining capacity % of capacity utilised
($bn)

Diversified and flexible funding issuance
Secured Public 27%
Subordinated Debt 4%
Senior Public Offshore 34%
Private Placements
15%
Senior Public Domestic 20%
NAB 88%
BNZ 7%
CYB 3%
NWMH 2%
USA 19%
UK 14%
Europe 25%
Asia (ex Japan) 12%
Other 2%
Australia & New
Zealand 28%
USD 38%(Total Portfolio
30%)
AUD 31%(Total Portfolio
25%)
GBP 8%(Total Portfolio
9%)
Other 5%(Total Portfolio
14%)
EUR 18%(Total Portfolio
22%)
Investor location ($25.8bn)Currency ($25.8bn)
Issuer ($25.8bn) Type ($25.8bn)
93
Wholesale Term Issuance Curves1
Wholesale funding costs
Average Long Term Wholesale Funding Costs2
(1) Source: NAB Group Treasury. Curves based on AUD Major Bank Wholesale Unsecured Funding rate (3 years and 5 years)(2) NAB Ltd Term Wholesale Funding Costs >12 Months at issuance (spread at 3 month BBSW). Average cost of new issuance is on a 6 month rolling basis
Forecast assumptions as follows: - new issuance at 85bps: Average new issuance cost if funding costs continue to improve- new issuance at 145bps: 2013 average portfolio cost - new issuance at 100bps: blended onshore and offshore market levels as at 30 September 2013 (5 year)94
(bps)
0
20
40
60
80
100
120
140
160
180
200
220
Mar 12 Jun 12 Sep 12 Dec 12 Mar 13 Jun 13 Sep 13
3 Year 5 Year
20
40
60
80
100
120
140
160
180
200
Sep07
Sep08
Sep09
Sep10
Sep11
Sep12
Sep13
Sep14
Sep15
Sep16
(bps)
WAC of Term Funding Portfolio
Forecast WAC of Portfolio (New Issuance @ 85bps)
Forecast WAC of Portfolio (New Issuance @ 145bps)
Forecast WAC of Portfolio (New Issuance @ 100bps)
New Issuance WAC (Rolling 6m average)

Cost of funding an Australian variable rate mortgage
95
0
20
40
60
80
100
120
140
160
180
Pre-Crisis Dec 07 Jun 08 Dec 08 Jun 09 Dec 09 Jun 10 Dec 10 Jun 11 Dec 11 Jun 12 Dec 12 Jun 13
Liquidity & Other Wholesale Costs
Term Funding
Customer Deposits
Bank Bill / Overnight Index Swap Spread
Funding cost over the RBA cash rate (bps)
Mar 08 Sep 08 Mar 09 Sep 09 Mar10 Sep 10 Mar 11 Sep 11 Mar 12 Sep 12 Mar 13 Sep 13
9696
Risk Weighted Assets
Asset Class ($m)
Sep 13 Mar 13
RWAs
Basel III
RWA/EAD % RWAs
Basel III
RWA/EAD %
Corporate & Business 178,563 45% 178,873 47%
Mortgages 59,527 20% 58,062 20%
Retail 13,799 42% 14,341 44%
Standardised1 44,973 44% 39,809 41%
Credit Value Adjustment (Basel III) 10,035 n/a 10,343 n/a
Other Assets 7,777 85% 6,089 63%
Total Credit RWAs 314,674 37% 307,517 38%
Market RWAs 5,191 5,899
Operational RWAs 34,749 33,332
IRRBB RWAs 7,464 4,643
Total RWAs 362,078 351,391
(1) The majority of the Group’s standardised portfolio is the Clydesdale Bank PLC banking operations

Additional InformationBusiness BankingPersonal BankingWholesale BankingNAB WealthNZ BankingUK BankingNAB UK CREGreat Western BankGroup Asset QualityCapital and Funding
OtherEconomic Outlook
Specialised Group Assets
($bn)
18.015.0
8.0 7.210.0 9.0
Mar 11 Sep 11 Mar 12 Sep 12 Mar 13 Sep 13
($m)
21 20
71
14 (8) (2)
Mar 11 Sep 11 Mar 12 Sep 12 Mar 13 Sep 13
B&DD charge RWAs1
($m) ($bn)
90+ DPD and GIAs as % of GLAs Gross loans & acceptances (average)90+ DPD and GIAs as % of GLAs Gross loans & acceptances (average)
(1) The increase of RWAs from September 12 to September 13 includes $2.6bn which is primarily due to a change in treatment under APS 120 on the Structured Asset Management Portfolio, but with no impact on underlying capital - the transactions creating the RWA increase were previously capital deductions98
0
1
2
3
4
5
6
Mar 11 Sep 11 Mar 12 Sep 12 Mar 13 Sep 13
0.0%
2.0%
4.0%
6.0%
8.0%
10.0%
12.0%
0
200
400
600
800
Mar 11 Sep 11 Mar 12 Sep 12 Mar 13 Sep 13
90+ DPD and GIAs (LHS) 90+ DPD and GIAs as % of GLAs (RHS)

Total Commitments
(A$bn)
Total Provisions (specific & collective)
(A$m)
Average Contractual
Tenor(years)
RWAs (A$bn)
Number of Clients
Close Review Commitments
(A$bn)
Leveraged Finance UK
0.4 57.1 2.6 0.9 18 0.3
Corporate UK1 1.0 93.7 2.2 1.6 22 0.6
Structured Asset Finance UK
1.3 3.8 16.3 1.1 12 0.1
Private Portfolio USA
0.3 0.1 14.9 0.2 7 -
Total Loans & Advances
3.0 154.7 9.5 3.8 59 1.0
Structured Asset Management2 2.9 76.0 10.8 5.2 20 0.5
Total 5.9 230.7 10.1 9.0 79 1.5
(1) Of which:
Property UK 0.2 69.8 0.5 0.3 12 0.2
(2) Held To Maturity Assets
SGA Portfolio Composition as at September 2013
99
100
NAB’s operational focus in Asia
Hong Kong branch > Institutional and Corporate,
Financial Institutional Group, Trade, Markets, Private Wealth
Tokyo branch & Osaka sub-branch> Institutional and Corporate,
Financial Institutional Group, Trade, Markets and Private Wealth
Beijing NAB and NAB Wealth representative officesShanghai branch > Institutional and Corporate, Financial Institutional Group, Migrant BankingFuzhou/Shanghai 16.8% stake in China Industrial International Trust
Mumbai branch > Institutional and Corporate, Trade, Markets and Private Wealth
Singapore branch> Institutional and
Corporate, Financial Institutional Group, Trade, Markets and Private Wealth
Indonesia representative office> Supporting offshore Trade,
Markets and Institutional Banking
Branch or sub-branchRepresentative office(s)
Product Focus
Customer Focus
Geographic Focus
• Trading partners of Japan, China, India and Indonesia
• Liquidity/Treasury hubs of Singapore and Hong Kong
• Linking the flows of these markets with Australia and New Zealand
• Corporates and Institutions in key industries – Food/Agriculture, Resources/Infrastructure
• Major Financial Institutional in the region
• Australian Corporates linked to Asia, and Asian Corporates with interests in Australia
• Wealthy individuals and families with links between NAB’s domestic markets and Asia
• Local cash rich deposit customers
• Corporate Finance and Trade Finance • FX products, Interest rate and
Commodity Risk Management• Multi-currency mortgages• Institutional and Retail deposits
Investment stake

Additional InformationBusiness BankingPersonal BankingWholesale BankingNAB WealthNZ BankingUK BankingNAB UK CREGreat Western BankGroup Asset QualityCapital and Funding
Other
Economic Outlook
Economic outlook
77%
11%
1%
11%
United Kingdom
New Zealand
United States
(%) represent share of 30 September 2013 GLAs including acceptances, Australia includes Asia
Australia
• Economy facing structural change as mining shifts from the investment to exports phase
• Business and consumer indicators have strengthened but confidence alone is not enough
• Consumer deleveraging has already seen weak domestic demand and rising unemployment
• Outlook is still for low inflation
• Expect GDP growth of 2.3% in 2013; 2.5% in 2014 & 2.9% in 2015
• Unemployment expected to drift up, keeping housing activity in check
• RBA has become less dovish but with the big picture unmoved, we believe another rate cut will be needed
China
102
• Economic growth resumes
• Recovery evident in key group regions, not restricted to South East England
• Output still below early 2008 level
• Property market picking up, especially around London. Other regions lagging
• Credit growth still modest as de-leveraging continues in business
• Business investment still weak- need more confidence to commit
• Interest rates expected to stay low
• Christchurch rebuild boosting activity
• Bulk of economy seeing an upturn
• Commodity prices rising again
• Housing upturn, especially in Auckland
• Modest drawn-out economic recovery
• Housing, credit, job levels all recovering
• Interest rates expected to stay low plus quantitative easing still ongoing - political risks over budget and debt overhang economy
• Fears of sharp slowing have receded as solid growth continues
• Government keen to rebalance toward more consumption
• Economic growth expected to gradually slow to under 7.5%
• Concern over shadow banking and local government lending
• Exports hit by slow growth in key markets
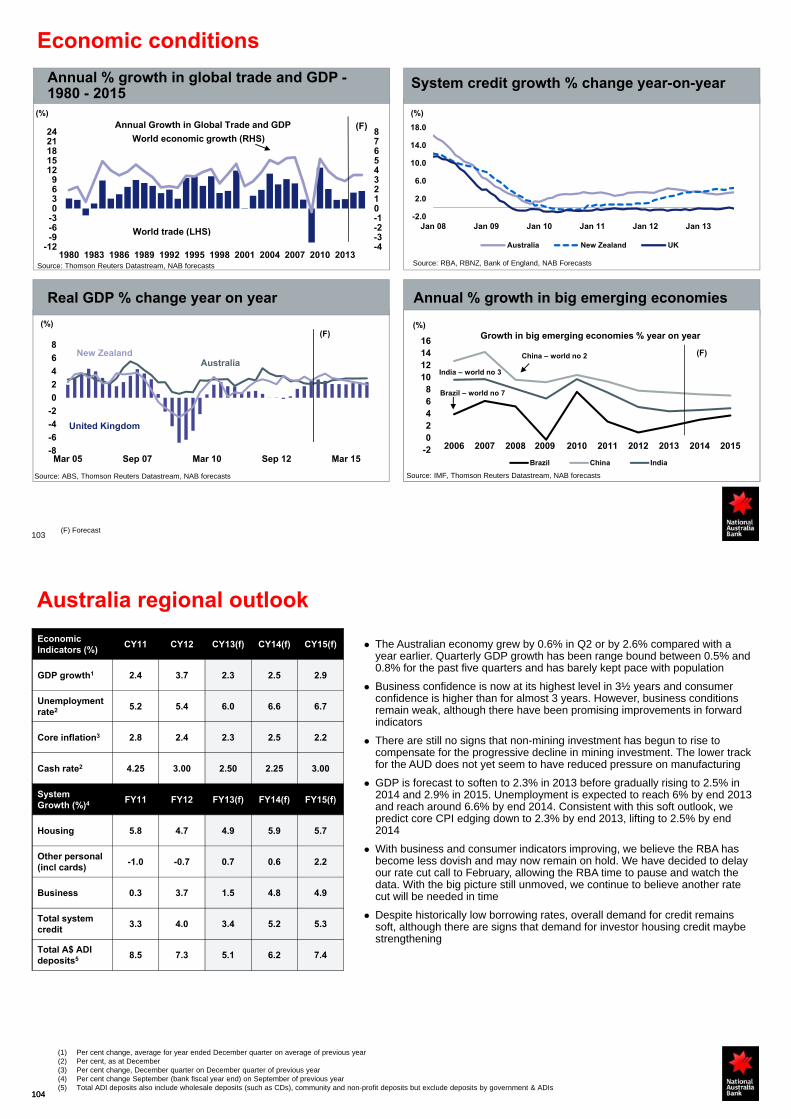
Economic conditions
Annual % growth in global trade and GDP -1980 - 2015
Real GDP % change year on year Annual % growth in big emerging economies
System credit growth % change year-on-year
103
Source: RBA, RBNZ, Bank of England, NAB Forecasts
Source: ABS, Thomson Reuters Datastream, NAB forecasts
Source: Thomson Reuters Datastream, NAB forecasts
-2.0
2.0
6.0
10.0
14.0
18.0
Jan 08 Jan 09 Jan 10 Jan 11 Jan 12 Jan 13
Australia New Zealand UK-4-3-2-1012345678
-12-9-6-30369
1215182124
1980 1983 1986 1989 1992 1995 1998 2001 2004 2007 2010 2013
World trade (LHS)
World economic growth (RHS)(F)Annual Growth in Global Trade and GDP
-8
-6
-4
-2
0
2
4
6
8
Mar 05 Sep 07 Mar 10 Sep 12 Mar 15
United Kingdom
(F)
New ZealandAustralia
-202468
10121416
2006 2007 2008 2009 2010 2011 2012 2013 2014 2015
Brazil China India
China – world no 2
India – world no 3
Growth in big emerging economies % year on year
Brazil – world no 7
(F)
(F) Forecast
(%)(%)
(%)(%)
Source: IMF, Thomson Reuters Datastream, NAB forecasts
104
Australia regional outlook
The Australian economy grew by 0.6% in Q2 or by 2.6% compared with a year earlier. Quarterly GDP growth has been range bound between 0.5% and 0.8% for the past five quarters and has barely kept pace with population
Business confidence is now at its highest level in 3½ years and consumer confidence is higher than for almost 3 years. However, business conditions remain weak, although there have been promising improvements in forward indicators
There are still no signs that non-mining investment has begun to rise to compensate for the progressive decline in mining investment. The lower track for the AUD does not yet seem to have reduced pressure on manufacturing
GDP is forecast to soften to 2.3% in 2013 before gradually rising to 2.5% in 2014 and 2.9% in 2015. Unemployment is expected to reach 6% by end 2013 and reach around 6.6% by end 2014. Consistent with this soft outlook, we predict core CPI edging down to 2.3% by end 2013, lifting to 2.5% by end 2014
With business and consumer indicators improving, we believe the RBA has become less dovish and may now remain on hold. We have decided to delay our rate cut call to February, allowing the RBA time to pause and watch the data. With the big picture still unmoved, we continue to believe another rate cut will be needed in time
Despite historically low borrowing rates, overall demand for credit remains soft, although there are signs that demand for investor housing credit maybe strengthening
Economic Indicators (%)
CY11 CY12 CY13(f) CY14(f) CY15(f)
GDP growth1 2.4 3.7 2.3 2.5 2.9
Unemployment rate2 5.2 5.4 6.0 6.6 6.7
Core inflation3 2.8 2.4 2.3 2.5 2.2
Cash rate2 4.25 3.00 2.50 2.25 3.00
System Growth (%)4 FY11 FY12 FY13(f) FY14(f) FY15(f)
Housing 5.8 4.7 4.9 5.9 5.7
Other personal (incl cards)
-1.0 -0.7 0.7 0.6 2.2
Business 0.3 3.7 1.5 4.8 4.9
Total system credit
3.3 4.0 3.4 5.2 5.3
Total A$ ADI deposits5 8.5 7.3 5.1 6.2 7.4
104
(1) Per cent change, average for year ended December quarter on average of previous year(2) Per cent, as at December(3) Per cent change, December quarter on December quarter of previous year(4) Per cent change September (bank fiscal year end) on September of previous year(5) Total ADI deposits also include wholesale deposits (such as CDs), community and non-profit deposits but exclude deposits by government & ADIs

UK regional outlookModerate economic growth has resumed in the UK with GDP expanding by 0.4% and 0.7% in the first two quarters of 2013. This follows a long period of weak economic activity. Output in mid-2013 was still below its early 2008 level and our forecasts only show the UK economy returning to its pre-GFC size at the end of next year. Activity is rising in Scotland and Northern England, the upturn is not restricted to Southern England
The recovery is being led by the housing market and consumer spending – so far it is not the business investment-export led upturn that the government has been seeking. As domestic spending lifts, however, that should improve business confidence and make firms more willing to take on risks and invest. Some of the latest surveys have shown evidence of such an improvement in sentiment but this is still to be delivered in the investment data
Property markets have started to improve, particularly in South East England where house price inflation is now quite strong. House price gains are lagging in Northern regions of England and Scotland, not unusual as UK housing cycles tend to start in the South East England and move out later to other regions. Housing market surveys show improved activity volumes in Northern England, even if prices are still flat. Nationally, the commercial property market has stabilised but most of what strength there is can be found around London
Business conditions remain subdued with the economy shrinking in late 2012 and growth was only modest in the early months of 2013. The level of output remains well below its early 2008 level. After this very disappointing record, we expect to see a sustained period of growth through the next few years but the pace of expansion is likely to be fairly modest
Credit growth remains subdued, despite government housing incentives that should boost mortgage demand. Housing loan repayments continue at a high rate and the business sector is still de-leveraging. We are forecasting only a modest lift in system credit growth as both economic growth and borrower demand remain constrained by the legacy of high debts incurred prior to the onset of the recession
Economic Indicators (%) CY11 CY12 CY13(f) CY14(f) CY15(f)
GDP growth1 1.1 0.1 1.5 2.4 2.2
Unemployment2 8.3 7.8 7.8 7.7 7.5
Inflation3 4.5 2.7 2.2 2.5 2.4
Cash rate2 0.5 0.5 0.5 0.5 1.0
System Growth (%) 4 FY11 FY12 FY13(f) FY14(f) FY15(f)
Housing 0.7 0.8 0.6 1.0 1.5
Consumer -1.0 -1.4 1.2 3.5 4.0
Business -2.5 -3.1 -2.8 -1.4 0.6
Total lending -0.6 -0.8 -0.6 0.4 1.4
Retail deposits 3.1 3.7 5.6 5.7 6.0
105
(1) Per cent change, average for year ended December quarter on average of previous year(2) Per cent, as at December(3) Per cent change, December quarter on December quarter of previous year(4) Per cent change September (bank fiscal year end) on September of previous year
106
NZ regional outlook
While part of the strength in the New Zealand economy reflects the rebuilding in Christchurch after the earthquakes, there is also a broad-based upturn under way across the economy. Business confidence has risen to its highest level for over a decade with strong readings across all key regions and sectors. Employment, profits and investment intentions all look solid in the latest surveys
After dipping earlier in the year, commodity export prices have risen back above their previous peaks (high dairy prices), taking the terms of trade back to a near 40 year high. Dairy incomes should be supported by high prices and a recovery in output from last year’s drought affected production
The stronger housing market and lift in retail trade comes after a long period of stagnation that set in around 2007. It took until the latter half of 2012 for median house prices to regain their 2007 peaks but the market has been rising with sales volumes up by over 15%, prices up by around 8% (mainly reflecting pressure in Auckland and Christchurch) and houses selling faster. The impact of the central bank’s LVR restrictions on the market remains to be seen. The upturn in the housing market has flowed into higher credit demand with the stock of housing lending rising by 5.7% over the year to August after a long period of slow growth
Consumer spending has also started rising quite strongly with core retail sales volumes (excluding car related purchases) up by around 4.5% in the June quarter as compared to the prior year quarter and the retail sector showing high levels of confidence in recent surveys. Consumer credit growth remains sluggish (around 1% year on year)
With the economy expected to continue growing quite strongly and surveys showing fairly modest amounts of spare productive capacity, the RBNZ should start lifting its policy interest rate in early 2014 and by the end of next year the cash rate should be up to 4% as the process of “normalising” interest rates proceeds gradually
Economic Indicators (%)
CY11 CY12 CY13(f) CY14(f) CY15(f)
GDP growth1 1.4 2.7 2.8 3.2 2.2
Unemployment2 6.3 6.8 6.3 5.7 5.6
Inflation3 1.8 0.9 1.3 2.0 2.8
Cash rate2 2.5 2.5 2.5 4.0 4.5
System Growth (%) 4 FY11 FY12 FY13(f) FY14(f) FY15(f)
Housing 1.6 1.6 4.6 6.1 5.7
Personal -1.6 0.1 1.5 2.1 3.5
Business -0.7 2.2 3.1 3.4 4.0
Total lending 0.5 1.8 3.8 4.8 5.0
Household retail deposits
7.0 9.0 8.8 8.6 7.1
(1) Per cent change, average for year ended December quarter on average of previous year(2) Per cent, as at December(3) Per cent change, December quarter on December quarter of previous year(4) Per cent change September (bank fiscal year end) on September of previous year

107
Real dwelling prices1993 = 100
Characteristics of the Australian mortgage marketResidential property prices have lifted in recent months and expectations of future increases have strengthened – especially in Sydney and MelbourneWhile there is much discussion about “bubbles”, we do not believe that to be the case given still subdued credit demand and soft income growthIf interest rates remain low and given supply shortages we could see some improvement to house prices and housing credit growth, but rising unemployment is likely to keep price increases well containedWhile Australia’s household debt service burden remains at historically high levels, it has improved marginallyAround 80% of Australian mortgages are at variable rates, making the most common mortgage rate very sensitive to changes in monetary policy
Household debt-to-income ratio
Mortgage interest rates
107
0
2
4
6
8
10
0
2
4
6
8
10
2001 2003 2005 2007 2009 2011 2013
Australian standard variable rate
US 30-year fixed interest rate
(%)
Source: RBA Financial System, US Federal Reserve
0
10
20
30
40
50
0
30
60
90
120
150
1986 1989 1992 1995 1998 2001 2004 2007 2010 2013
Total (LHS)
Housing (LHS)
Household debt to housing assets (RHS)
IndexIndex
Source: ABS, NAB, RBAIncome is disposable income after tax and before interest paymentsHousehold sector excludes unincorporated enterprises
50
100
150
200
250
1986 1990 1994 1998 2002 2006 2010
Capital cities
Index
Source: ABS, deflated by private household consumption deflator
108
For further information visit www.nab.com.au or contact:
Ross Brown Brian WalshExecutive General Manager, Investor Relations General Manager, Corporate CommunicationsMobile | +61 (0) 477 302 010 Mobile | +61 (0) 411 227 585
Natalie Coombe Meaghan TelfordSenior Manager, Investor Relations Head of Corporate Affairs, Group MediaMobile | +61 (0) 477 327 540 Mobile | +61 (0) 457 551 211