IMPLICATIONS OF UKPDS GSK Advisory Board 24 May 2003 Dr. J. R. Conway.
45
IMPLICATIONS OF UKPDS GSK Advisory Board 24 May 2003 Dr. J. R. Conway
-
Upload
juliet-norris -
Category
Documents
-
view
214 -
download
0
Transcript of IMPLICATIONS OF UKPDS GSK Advisory Board 24 May 2003 Dr. J. R. Conway.

IMPLICATIONS OF UKPDS
GSK Advisory Board
24 May 2003
Dr. J. R. Conway

Worldwide rates of diabetes mellitus: predictions
Worldwide rates of diabetes mellitus: predictions80
70
60
50
40
30
20
10
0
Prevalence (millions)
North America
Europe Southeast
Asia
Year199520002025
World Health Organization. 1997.Canadian Diabetes Association, 1998 website.

Frequency of diagnosed and undiagnosed diabetes and IGT, by age (U.S. data - Harris)
2.2 Million Canadians Have Diabetes Mellitus
0
5
10
15
20
25
30
35
40
20-34 35-44 45-54 55-64 65-74
% ofpopulation
IGTUndiagnosed diabetesDiagnosed diabetes
Harris. Diabetes Care 1993;16:642-52.

Haffner Am J Cardiol 1999;84:11J-4J.
Framingham study: diabetes and CAD mortalityat 20-year follow-up
Cardiovascular Disease Risk is Increased 2 to 4 Times
17.4
8.5
17.0
3.602468
101214161820
Annual CAD Deaths per 1,000
Persons
Men Women
Diabetics Nondiabetics
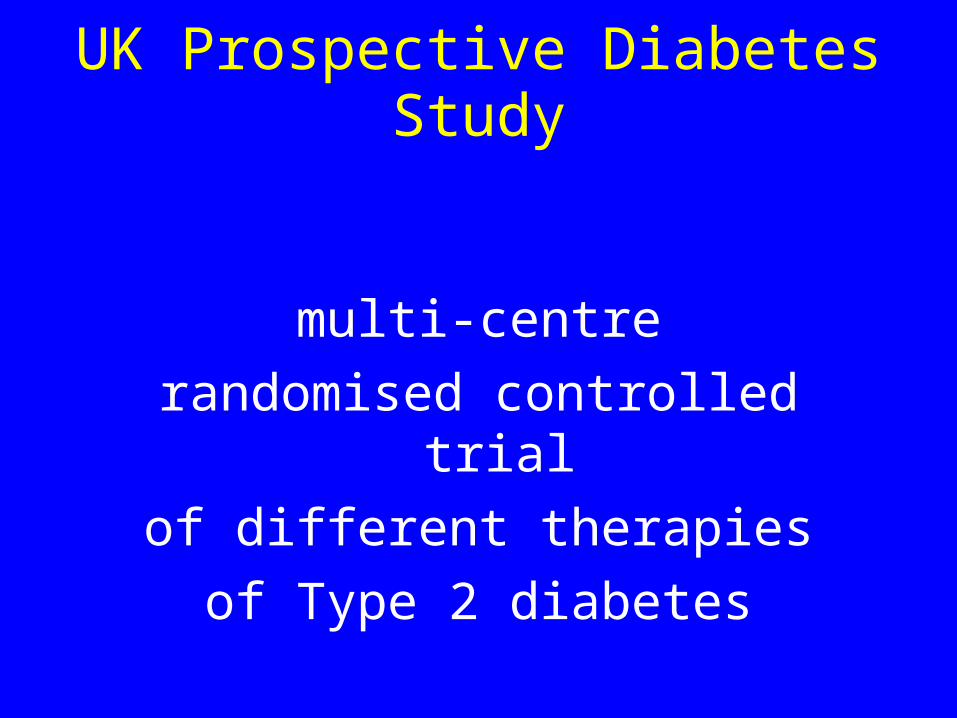
UK Prospective Diabetes Study
multi-centre
randomised controlled trial
of different therapies
of Type 2 diabetes

Does an intensive glucose Does an intensive glucose control policy reduce the risk of control policy reduce the risk of
complications of diabetes?complications of diabetes?
UK Prospective Diabetes StudyUK Prospective Diabetes Study

Blood Glucose Control Study : Aims
to determine whether • improved glucose control of Type 2 diabetes
will prevent clinical complications
• therapy with– sulphonylurea - first or second generation
– insulin
– metformin– has any specific advantage or disadvantage

Patient Characteristics5102 newly diagnosed Type 2 diabetic patients
age 25 - 65 years mean 53 y
gender male : female 59 : 41%
ethnic group Caucasian 82%Asian 10%
Afro-caribbean 8%Body Mass Index mean 28 kg/m2
fasting plasma glucose (fpg) median 11.5 mmol/L
HbA1c median 9.1 %hypertensive 39%

Randomisation of Treatment Policies
342 allocated to
metformin
Conventional Policy30% (n=1138)
Intensive Policy70% (n=2729)
Sulphonylurean=1573
Insulinn=1156
Main Randomisationn=4209 (82%)
3867

Actual Therapy
Years from randomisation
1 2 3 4 5 6 7 8 9 10 11 120
20
40
60
80
100
pro
po
rtio
n o
f p
atie
nts
diet alone
1 2 3 4 5 6 7 8 9 10 11 12
intensivepharmacologicaltherapy
diet aloneadditional non-intensivepharmacological therapy
Intensive Policyaim for < 6 mmol/L
Conventional Policyaccept < 15 mmol/L

Any Diabetes Related EndpointAny Diabetes Related Endpoint
1401 of 3867 patients (36%)
First occurrence of any one of:
• diabetes related death
• non fatal myocardial infarction, heart failure or angina
• non fatal stroke
• amputation
• renal failure
• retinal photocoagulation or vitreous haemorrhage
• cataract extraction or blind in one eye

Microvascular Endpoints (cumulative)Microvascular Endpoints (cumulative)
p=0.0099
0%
10%
20%
30%
0 3 6 9 12 15
% o
f pat
ient
s w
ith a
n ev
ent
Years from randomisation
Intensive
Conventional
Risk reduction 25%(95% CI: 7 % to 40%)
renal failure or death, vitreous haemorrhage or photocoagulation346 of 3867 patients (9%)

HbA1c cross-sectional, median values
06
7
8
9
0 3 6 9 12 15
HbA
1c (%
)
Years from randomisation
Conventional
Intensive
6.2% upper limit of normal range

Beta cell function in the UKPDS
Years from diagnosis
Bet
a ce
ll f
un
ctio
n (
%)
100
90
80
70
60
50
40
30
20
10
0–12 –10 –8 –6 –4 –2 0 2 4 6
Holman RR et al. Diabetes Res Clin Pract 1998;40(suppl):S21–S25

WHAT’S THE PROBLEM
• It used to be easydiet+DiaBeta/glyburidemetformin
do as you’re told• We must reach glucose targets
-CDA guidelines; UKPDS; Kumamotosee you later
•It doesn’t workpoor controlvascular complications

A BIG ISSUE
•glyburide works-then fails
•metformin works-then fails
•insulin, using standard regimens, works-then fails
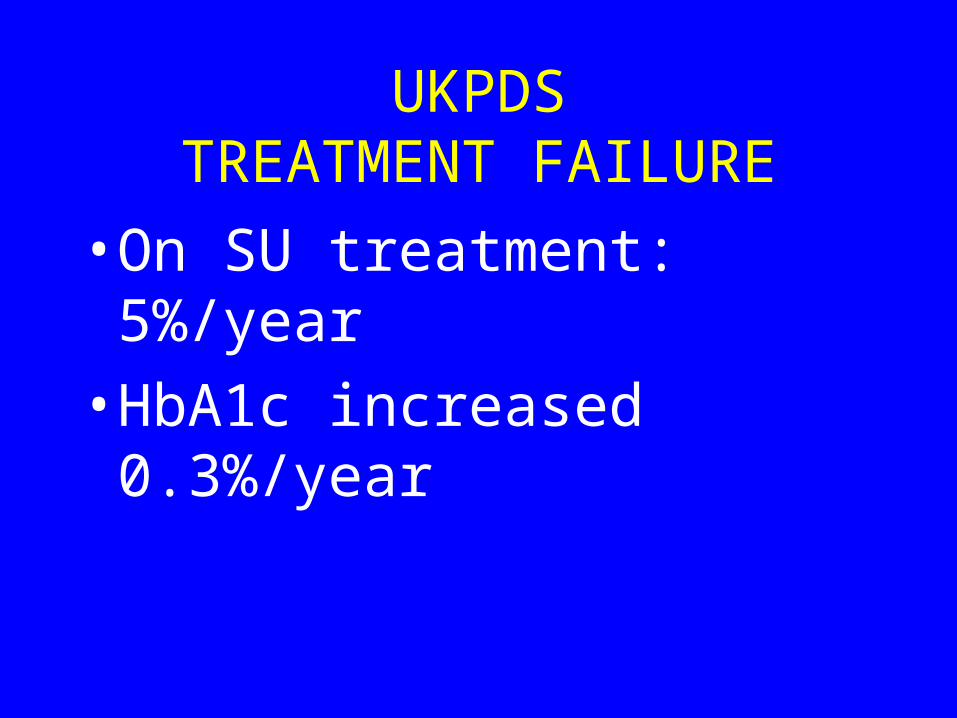
UKPDSTREATMENT FAILURE
• On SU treatment: 5%/year
• HbA1c increased 0.3%/year
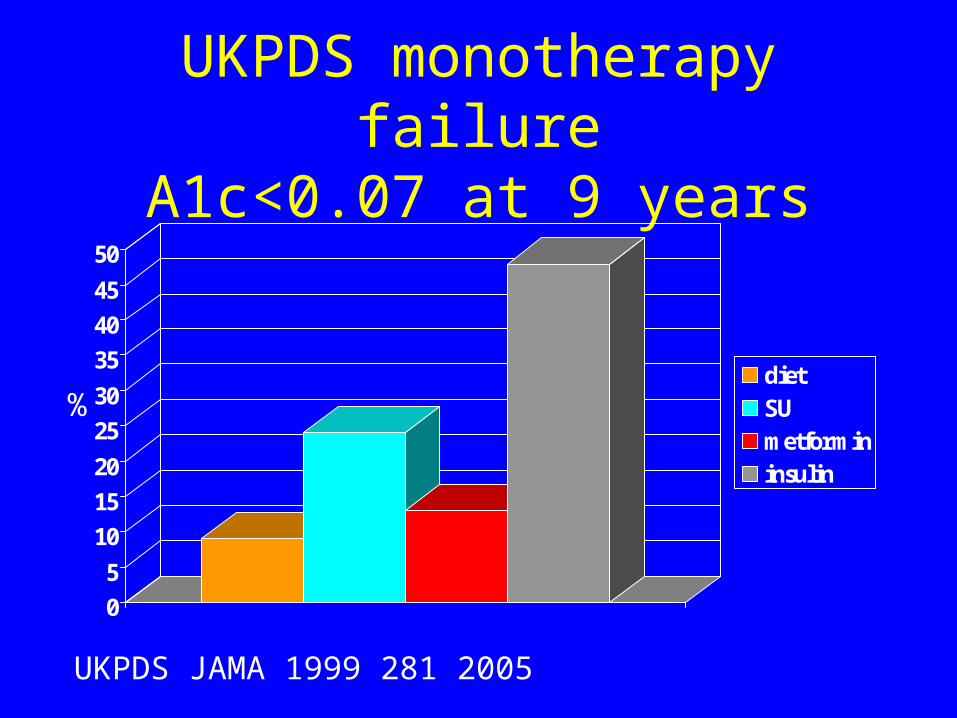
UKPDS monotherapy failureA1c<0.07 at 9 years
0
5
10
15
20
25
30
35
40
45
50
dietSUmetformininsulin
%
UKPDS JAMA 1999 281 2005
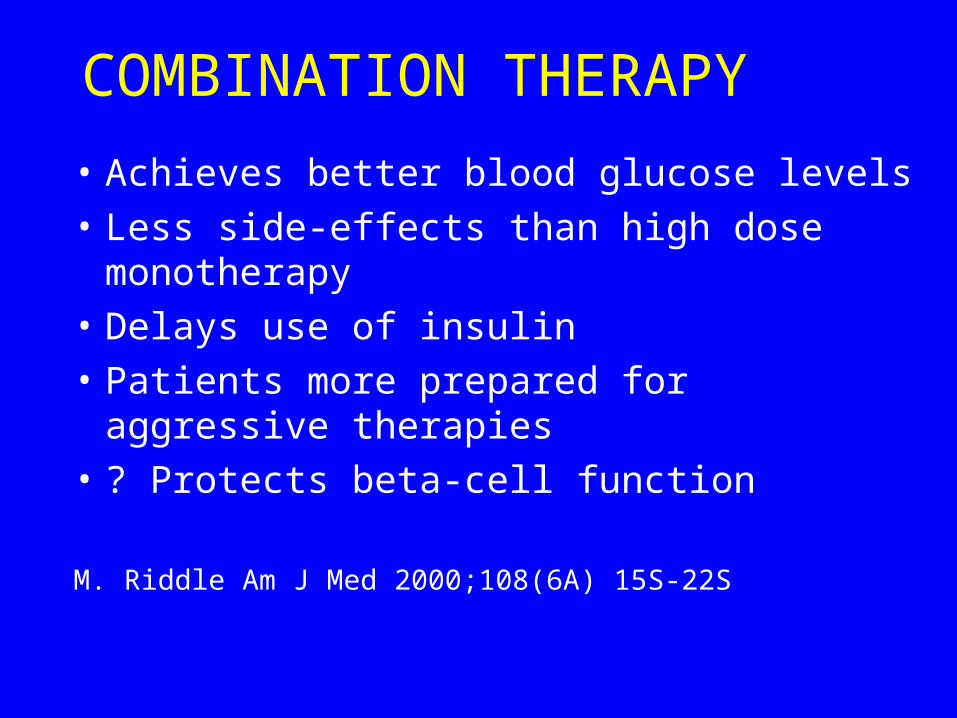
COMBINATION THERAPY
• Achieves better blood glucose levels
• Less side-effects than high dose monotherapy
• Delays use of insulin
• Patients more prepared for aggressive therapies
• ? Protects beta-cell function
M. Riddle Am J Med 2000;108(6A) 15S-22S

Insulin resistance: an underlying problem
Insulin resistance
Insulin production
Glucose level
Time
Non-diabetes
Pre-diabetes
Type 2diabete
sOpara JU, Levine JH, South Med J. 1997;90:1162-1168.

Type 2 Diabetes: Underlying Defects
Type 2 diabetes
Beta-cell functionInsulin resistance
Other defects:
lipolysisrelease of NEFA
hepatic glucose production
Adapted from Matthaei et al. Endocrine Reviews 2000;21:585-618.Adapted from Frayn. Br J Nutr 2000;83(suppl 1): S71-S77.
Pathophysiology

Pathophysiology of Type 2 Diabetes
Adapted from Saltiel et al. Diabetes 1996; 45:1661-1669.
Liver
PancreasPeripheral Tissues
(Muscle and Adipose)
Increased glucoseproduction
Glucose
Impaired insulinsecretion
Receptor + postreceptor defects
Insulinresistance
Pathophysiology

Metabolic syndrome
Obesity
Atherosclerosisrisk
Insulinresistance
Diabetes
DyslipidaemiaDyslipidaemia
Hyper-tension

THE ARGUMENT
• Insulin insufficiency
• Insulin resistance

Insulin resistance: an underlying problem
Insulin resistance
Insulin production
Glucose level
Time
Non-diabetes
Pre-diabetes
Type 2diabete
sOpara JU, Levine JH, South Med J. 1997;90:1162-1168.

Treatment: stepwise approach
1
2
3
4
5
Combination oforal medicines
Oral plus insulin
Insulin
One oral medicine
Diet &exercise
+
++

% of Patients Uncontrolled (HbA1c % of Patients Uncontrolled (HbA1c 115% N) 115% N)
Diet OnlyDiet Only(n=506) (n=506)
Oral Monotherapy Oral Monotherapy (n=740)(n=740)
Dual OralDual OralTherapy(n=98)Therapy(n=98)
InsulinInsulin(n=903)(n=903)
00
50%50%
100%100%General Population (non-Aboriginal; n=2015)General Population (non-Aboriginal; n=2015)
Aboriginal (n=232)
NSNS
p = 0.017p = 0.017p < 0.05p < 0.05
NSNS60.9%
54.5%
44.1%
59.2% 56.9%
68.2%
24.8%20.0%
Prevalence of Uncontrolled Glucose Levels in an Alberta Prevalence of Uncontrolled Glucose Levels in an Alberta Aboriginal and Non-Aboriginal Population (N=2,247)Aboriginal and Non-Aboriginal Population (N=2,247)

Table 3:UNCONTROLLED DIABETES
DURATION on THERAPY
0
1
2
3
4
5
6
7
8
9
<65 >65 <65 >65 <65 >65
NON-ABORIGINALABORIGINAL
yearsyears*
* p<0.001* p<0.001
MONO DUAL INSULINMONO DUAL INSULIN
**
** p=0.009** p=0.009
age

Thiazolidinediones:
• Rosiglitazone -Avandia
• Pioglitazone -Actos

Peroxisome Proliferator Activated Receptors (PPAR) are
Ligand-Activated Nuclear Receptors
ThyroidHormones
SteroidHormones
Thyroid Steroid
RAR RXR
Receptors Orphans
retinoic acid
PPAR PPAR PPAR
peroxisome proliferator activated receptors (PPAR)

Murphy K et al. Endocrine Society Meeting 2000; Poster 450.
Long-term rosiglitazone monotherapy:Mean change in HbA1c
Long-term rosiglitazone monotherapy:Mean change in HbA1c
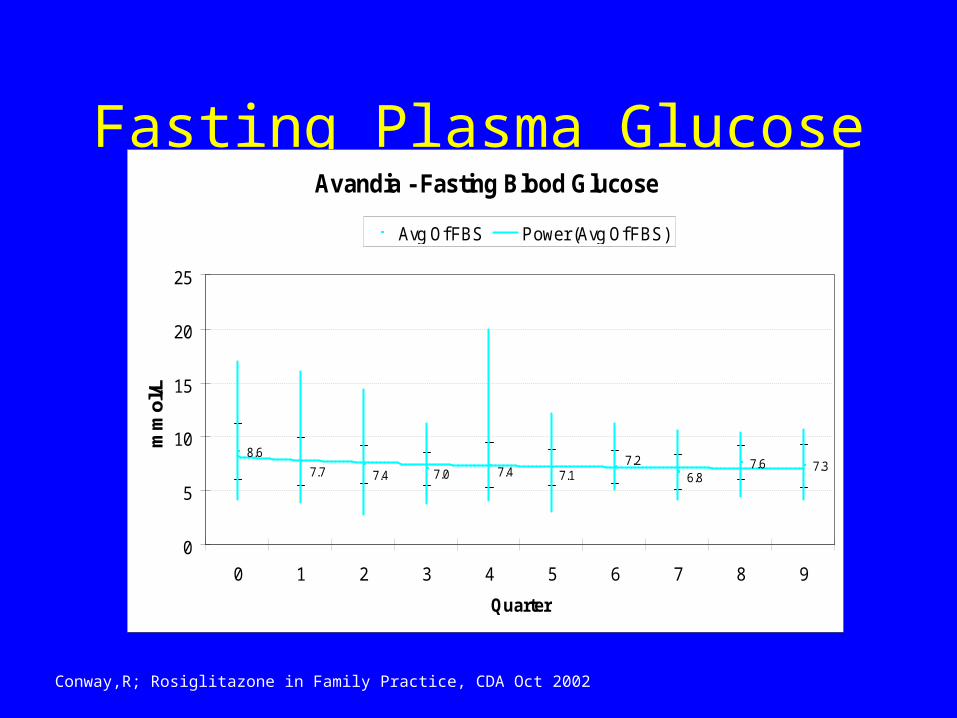
Fasting Plasma GlucoseAvandia - Fasting Blood Glucose
8.67.6 7.37.7 7.4 7.0 7.4 7.1
7.26.8
0
5
10
15
20
25
0 1 2 3 4 5 6 7 8 9
Quarter
mm
ol/L
Avg Of FBS Power (Avg Of FBS)
Conway,R; Rosiglitazone in Family Practice, CDA Oct 2002

HbA1c over 40 monthsRosiglitazone - Glycosylated Hemoglobin
0.0810.074 0.072 0.070 0.072 0.071 0.071 0.069
0.074 0.072
0
0.02
0.04
0.06
0.08
0.1
0.12
0.14
0.16
0 1 2 3 4 5 6 7 8 9
Quarter
Avg Of HGBA1C Power (Avg Of HGBA1C)
Conway,R; Rosiglitazone in Family Practice, CDA, Oct 2002

-1.5
-1
-0.5
0
0.5
1
Mea
n C
han
ge
fro
m B
asel
ine
in H
bA
1C (
%)
BMI < 25 BMI 25–30 BMI > 30
Months
BMI > 30 kg/m2: Extension study (18 months)BMI > 30 kg/m2: Extension study (18 months)
Glycemic parameters by body mass index (BMI):Rosiglitazone added to metformin
Glycemic parameters by body mass index (BMI):Rosiglitazone added to metformin
MET + placebo
MET + RSG 4 mg/day
MET + RSG 8 mg/day
Hb
A1c
(%
)
Effect of BMI: Double-blind studies (26 weeks)Effect of BMI: Double-blind studies (26 weeks)
0 3 6 9 12 15 180.0
7.0
7.5
8.0
8.5
9.0
9.5
Patients completing 18 months on metformin + RSG therapy (N = 124)

Long-Term Durability of Rosiglitazone as Monotherapy or
in Combination Therapy in Patients with Type 2 Diabetes
Gould E, Cobitz, A.
Presented at 84th Annual
Meeting of the Endocrine Society, San Francisco, CA, June 19-22, 2002
#P1-60

ResultsEffect Avandia Montherapy on HbA1c
Open-label 42-month Completer Analysis*
*Patients who received Avandia 8 mg qd and 4 mg bid for at least 42 months during 2 double-blind, 26-week, placebo-controlled trials and their open label extensions. Completer analysis limited by potential bias towards responders to treatment, and small numbers of patients at various time points.
1. Gould E,et al. Presented at 84th Annual Meeting of the Endocrine Society, San Francisco, CA, June 19-22, 2002 #P1-60

ResultsEffect of Avandia+ Metformin on HbA1c
Open-label 30-month Completer Analysis*
*Patients who received Avandia 4 mg bid plus 2.5 g/day of metformin for at least 30 months during 1 double-blind, 26-week, placebo-controlled trial and its open label extension. Completer analysis limited by potential bias towards responders to treatment, and small numbers of patients at various time points.1. Gould E,et al. Presented at 84th Annual Meeting of the Endocrine Society, San Francisco, CA, June 19-22, 2002 #P1-60

ResultsEffect of Avandia + SU on HbA1c
Open-label 30-month Completer Analysis*
*Patients who received Avandia 2 mg bid plus glyburide for at least 30 months during 1 double-blind, 26-week, placebo-controlled trial and its open label extension. Completer analysis limited by potential bias towards responders to treatment, and small numbers of patients at various time points.1. Gould E,et al. Presented at 84th Annual Meeting of the Endocrine Society, San Francisco, CA, June 19-22, 2002 #P1-60

WHAT HAS CHANGED
• We must treat the Metabolic Syndrome (insulin resistance)
-glucose levels-blood pressure
-lipids

ORAL AGENTS
Dose Response

Riddle M. Combining sulfonylureas and other oral agents. Am J of Med. 2000; 106(6A):16S-22S.
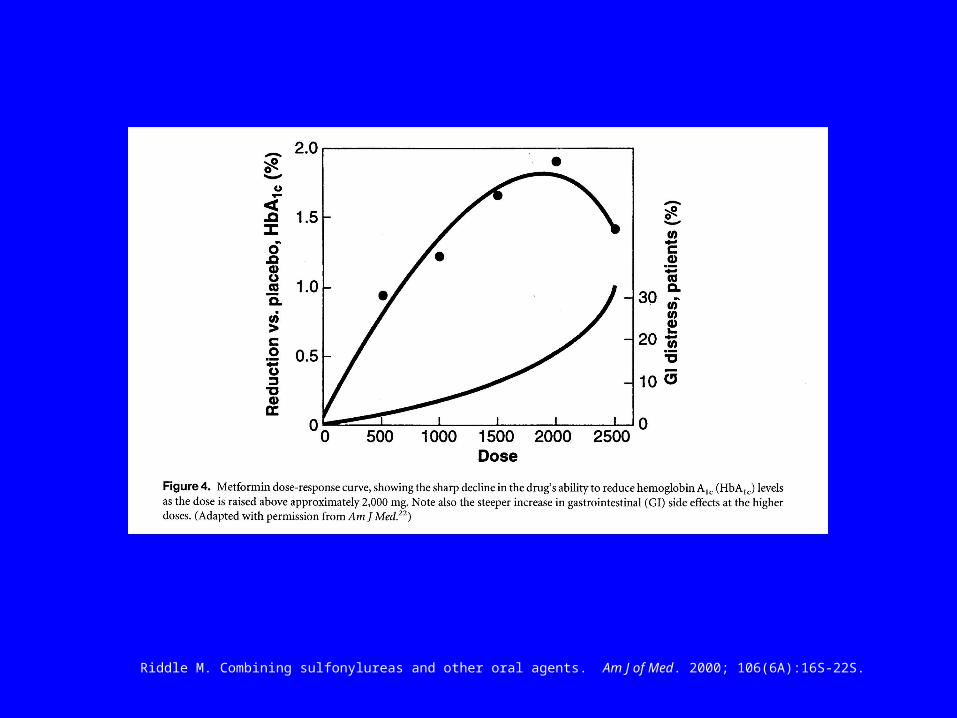
Riddle M. Combining sulfonylureas and other oral agents. Am J of Med. 2000; 106(6A):16S-22S.

Beta cell function in the UKPDS
Years from diagnosis
Bet
a ce
ll f
un
ctio
n (
%)
100
90
80
70
60
50
40
30
20
10
0–12 –10 –8 –6 –4 –2 0 2 4 6
Holman RR et al. Diabetes Res Clin Pract 1998;40(suppl):S21–S25

NON-EVIDENCE-BASED THOUGHTS
• Use two agents early-on in treatment
• Consider a ‘glitazone’ +metformin, or
fast-acting insulin secretor

A Peek at the Future
• Fast-acting insulin secretors:gliclazide MR/repaglinide/nateglinide
• Metformin
• TZDrosiglitazone/pioglitazone
• Statin
• ACE/ARB
• Insulin