Optimal Voltage Control Scheme on an Observer- Based For ...
Implementation of an Unconventional Voltage Slide Scheme
I. L. van der Merwe Eskom RSA
J. Cloete Eskom Enterprises RSA
N. Fischer Schweitzer Engineering Laboratories, Inc.
Presented at the 59th Annual Georgia Tech Protective Relaying Conference
Atlanta, Georgia April 27–29, 2005
Previously presented at the 58th Annual Conference for Protective Relay Engineers, April 2005
Originally presented at the 31st Annual Western Protective Relay Conference, October 2004

1
IMPLEMENTATION OF AN UNCONVENTIONAL VOLTAGE SLIDE SCHEME
I.L. van der Merwe Chief Engineer
Distribution Technology Eskom RSA
J. Cloete Senior Advisor
Technology Services InternationalEskom Enterprises RSA
N. Fischer Senior Power Engineer Schweitzer Engineering Laboratories, Inc USA
ABSTRACT Eskom experienced a voltage collapse condition in part of its subtransmission network. The network consists of a number of subtransmission substations that are interconnected and fed from three transmission substations. The voltage collapse condition occurred after a protection operation cleared a fault on one of the 132 kV lines feeding the network from one of the transmission substations. When the fault was cleared, the reactive power requirement of the load was beyond the capability of the network and resulted in a declining voltage at the load, which led to a total voltage collapse in some parts of the network.
Network studies have shown that the source is relatively weak and that a voltage collapse will occur again if any one of a number of lines from the source transmission substations is tripped out due to a fault. It is also impossible to take any of these feeders out of service for maintenance purposes. The severity of the voltage collapse depends on the specific incoming feeder that trips. It will also be more or less severe at a specific substation depending on which line from the transmission substations trips. This network is a time bomb waiting for a trigger to explode. The voltage collapse will affect at least 20 subtransmission substations in this network, approximately 100,000 customers and approximately 270 MVA total installed load. Therefore, during such a voltage collapse condition, it is desirable to supply as much load as possible.
From a solution point of view, constructing additional lines feeding into the network from the transmission substations would solve the problem. However, the load in the area is of such a nature that it is not possible to economically justify the construction of new lines.
Some solutions were studied and are mentioned in the paper. The paper finally focuses on one specific solution that was selected as being the most appropriate and cost effective. In summary, this solution is an undervoltage load-shedding scheme. The system studies showed that a conventional definite-time undervoltage load-shedding scheme would not provide much benefit. A unique undervoltage algorithm was developed so that load could be shed at selected substations based on the voltage depression at that substation, while still supplying a large part of the network. This unique algorithm was required because voltage at specific substations greatly differs depending on the various contingencies of incoming feeders tripping.
The algorithm uses inverse time to shed load based on the severity of the voltage collapse at a specific substation. A modern numerical relay enabled the user to freely program unique algorithms, and could also be used to perform tripping. The paper discusses this solution and its implementation.
1. INTRODUCTION In short, a voltage slide occurs when a disturbance causes a progressive and uncontrollable decline in voltage. Conversely, a system is stable when it is capable of restoring itself after a disturbance that might trigger and lead to voltage instability and slide.

2
Power system stability has been a hotly debated issue of late. The reasons for this debate are the recent large-scale outages in many countries, but also smaller scale or localized outages in some utilities. In most cases, engineers were not aware of the looming “danger” and therefore very little was done to mitigate such conditions. Engineers want to believe that their utility’s network is designed conservatively and issues such as power system instability, voltage instability and voltage slide and collapse are only described in textbooks—they do not occur frequently in real power networks. However, history is proving them wrong, and voltage slide and voltage collapse are becoming real problems in modern networks. Recent blackouts in various countries around the world partly prove this statement, even though all these blackouts were not solely caused by voltage slides.
Koessler [1] suggests that voltage collapse may occur at any point in a healthy network, because it is primarily dependent on the reactive power requirements of the load and the available reactive power at a specific point in the network. It does not generally occur in conjunction with an underfrequency condition, because the frequency normally stays healthy during a voltage collapse condition. Frequency instability is also related to angular dynamics of generators in relation to each other, whereas voltage collapse is independent of generator frequency response.
One of the factors that greatly impacts both the simulation of voltage collapse conditions, as well as the implementation of mitigation techniques, is the diversity of the load. Generally the loads are fairly unknown, and rough estimations and assumptions have to be made in order to model the loads.
2. BASIC THEORY OF VOLTAGE COLLAPSE Control systems have developed and become extremely sophisticated, enabling much faster reaction time and closer control of power system stability parameters. Transformer load-tap-changers (LTCs) have become more sophisticated, and try to maintain the voltage at statutory levels, especially near loads. The combination of complex power networks and sophisticated control systems has compounded the problem in many cases, because it is becoming more difficult to predict the power network response to a disturbance. Loads have drastically increased in complexity, compounding the problem even further. The result is a highly nonlinear network with a complex response to a system disturbance [2].
Voltage collapse generally occurs in heavily loaded networks and/or systems with long lines. Under heavy-load conditions, the power requirements of the load might exceed the capability of the power network, and the generator control system may be incapable of controlling the reactive power flow requirement on the system. In such cases, it becomes more difficult to maintain the voltage at the desired level and the voltage level may start to decrease. A small disturbance at this stage may lead to a further voltage slide and subsequent total collapse [1] [2] [3].
Alternatively, this phenomenon may be initiated when a line or generator feeding a heavily loaded network trips. Such a plant outage results in a situation where the reactive power available on the network is less than the reactive power requirements of the network, i.e., the reactive power absorbed is greater than the reactive power generated. This situation could also occur if the reactive power available is approximately equal to the reactive loads plus the losses on the network, but voltages are allowed to decrease. If the reactive power available and reactive loads are finely balanced in a network, the smallest disturbance resulting in a voltage decrease could trigger a voltage slide, which could lead to a total collapse if there is no reactive power reserve [1] [3].

3
When a voltage slide condition occurs, the voltage gradually starts to drop throughout the network. The time-voltage response is directly related to a large number of variables, for example time constant of the network, load at the time, load characteristics, generator characteristics, generator control system response, transformer LTC response, etc. If there is no intervention, the system voltage might stabilize or even recover for a short period while the generators and LTC control systems attempt to restore the voltage to normal [2]. However, once sufficient time has passed and the reactive power required on the network still exceeds the reactive power generated, the voltage will slide further and lead to a total voltage collapse. At this point, some protective relays may start to operate, disconnecting some load from the network.
For an underfrequency condition to occur, the active power required by the power system has to be greater than the active power generated by the power system. This results in a decrease of the system frequency across the entire power system. A voltage collapse is the result of the reactive power required by a load being higher than the reactive power being shipped to the load. Therefore, a voltage collapse is generally a localized phenomenon and not a system phenomenon.
Determining how close a part of the power system is to a voltage collapse or to the critical voltage entails not only measuring the magnitude of the voltage itself but also knowing:
• The amount of active and reactive power being absorbed or generated by the load • The network parameters, for example, source impedance and line impedance
In general, loads consist of a combination of the following three types: • Constant current load • Constant active and reactive power load • Constant impedance load
Because the load can be any combination of the above mentioned load types at any moment in time, these cannot be predetermined for a specified part of a power system. Of greater importance is to know whether the load is inductive (absorbing reactive power) or capacitive (generating reactive power). The reason for this is that an inductive load causes an increase in the voltage drop across a transmission line, resulting in a lower voltage at the load. However, a capacitive load can cause a negative voltage drop across a transmission line and may result in a higher voltage at the load end, leading to a false sense of security. The P-V curves in Figure 1 show a profile of the load voltage with respect to the amount of power drawn for a leading and lagging power factor. From these graphs it can be seen that if load is inductive, the magnitude of voltage is generally a good indication of how close to a voltage collapse the load is but the same cannot be said for a capacitive load. This means that not only does the magnitude of the voltage have to be monitored, but the nature of the load also has to be monitored to calculate the critical voltage of the load. Because most loads on the Eskom subtransmission system where the voltage collapse occurred are inductive, this paper concentrates on inductive loads. Therefore, the voltage magnitude alone will give a good indication of how close the system is to collapsing or reaching the critical voltage level. Guzmán et al. [4] describes a wide-area protection system (WAPS) that can be used to determine the minimum stable voltage of a system.

4
Figure 1 P-V Curves for an Inductive and Capacitive Load
The need is, therefore, to measure the voltage at each of the substations where a possibility of a voltage collapse exists. These voltages need to be monitored in order to determine the degree of voltage collapse and the effectiveness of the corrective action taken.
It is essential that all voltage collapse incidents be recorded in order to evaluate the effectiveness of the implemented solution and keep track of the number of voltage collapses in the system. It is also essential to have the correct voltage levels available during the restoration process to ensure safe restoration of the system.
Because there is no history of the implementation of a scheme or the implementation of any relays to detect and react to a voltage collapse in Eskom, various theoretical models were simulated to represent the network.
3. SIMULATION/MODELING TECHNIQUES For general power network stability studies, issues such as frequency response of the network, power swing and pole slipping are generally studied. In such cases, crude assumptions could be made with regard to the load characteristics and the modeling of the generator and its control system. Detailed models for the latter two are precisely what are required when studying the voltage-time response of a power network during a voltage slide condition. A steady-state model of the power network, loads, and generators is required to perform load flow studies. Voltage slide is caused when the steady-state performance of the power network and its components are lost [2]. Dynamic models are required for each, to perform dynamic studies.
An uncontrolled voltage slide or collapse has always been a difficult phenomenon to simulate. This is especially true for large complex networks with similarly complex loads. Koessler [1]

5
suggests that the first step in investigating voltage slide conditions is to perform a conventional steady-state load flow study. This indicates the existence of voltage slide for certain contingencies. Further investigation and dynamic studies are required to develop detailed responses of the power network for the specific contingencies. A very detailed and accurate model of the generators, their governor response to load variation, an accurate model of the network, and a detailed model of the load are typically necessary in order to get accurate results. In many cases, it is impossible to develop a complete and accurate model because of the network and load complexity.
In the case described in this paper, no detailed models existed for the power network, generators or loads; these would have to be built from scratch. The network is fairly large with approximately 100,000 customers. Collection of load, generator, and power network data would take several weeks, a task that could not be justified, especially because the accuracy of the collected data could be unreliable. A compromise had to be made regarding the simulation of the voltage slide and collapse conditions. An investigation showed that a steady-state analysis of the power network, load flow, and voltage profile would provide more useful information than proper dynamic studies with inaccurate dynamic models of the power network, generators, and loads. By using the steady-state analysis, the lost information was basically the voltage profile during the slide condition. The steady-state analysis primarily provided the end-state values of load and voltage of the power network after the voltage collapsed. Koessler [1] also mentions that steady-state load flow studies with constant power loads can provide a useful alternative to dynamic voltage-time studies, at least indicating which contingencies may provide voltage slide conditions.
For the purpose of this paper, no dynamic or line data could be obtained to simulate the actual power system where the voltage collapse occurred. Therefore, a theoretical model from Kundur [5] was used to illustrate the effect of losing a transmission line on the voltage stability of a power system. The power system shown in Figure 2 was modeled in a real-time digital simulator (RTDS). This model is used to illustrate how a voltage collapse occurs after a transmission line is taken out of service. The voltage on bus 10 represents the subsystem voltage and the voltage at bus 11 represents the load voltage. In addition to monitoring the subsystem and load voltages, the model also monitors the system frequency. The tap changer on Transformer 6 is set to maintain the load voltage between 0.93 and 1.07 per unit. The transformer is allowed to tap every 5 seconds.

6
G1
G2
G3T1
T2
T3
T4
T5 T6
LINE 1LINE 2
LINE 3
LINE 4
LINE 5
LINE 6 LINE 7
ULTC
M1
DynamicLoad
1
2
3
8
5
6 7
9 10 11
Subsystem
Figure 2 Power System Model to Demonstrate the Effect of the Loss of a Transmission Line on
the Voltage of the Power System
The load is modeled so that the active and reactive power drawn is constant until the applied voltage reaches a value of 0.4 per unit, at which time the load becomes a constant impedance load. Figure 3 shows the response of the system voltage and frequency, bus 10, and the load voltage, bus 11, after line 2 is taken out of service.
From the graphs in Figure 3, two important observations can be made:
1) The load voltage, bus 11, does not reflect the voltage of the subsystem, bus 10.
2) The subsystem frequency remains constant while the subsystem voltage is collapsing.
From the first observation, it can be said that if undervoltage load shedding were to be implemented, measurements should be made at bus 10 and not at bus 11. From the second observation, it can be said that underfrequency load shedding cannot be used in this instance.

7
Figure 3 Power System Model Response Voltages
4. MITIGATION TECHNIQUES It has been mentioned that the balance of reactive power sources and loads is key to being able to sustain voltage at the required levels. If this balance is upset, a voltage slide condition might be triggered. It is stressed by Hawkins [6] that this balance may also be the key to successful voltage slide mitigation. It will become clear that the purpose of most mitigation techniques described by Taylor [7] and Henville et al. [8] is to achieve exactly that. In summary, the first step in addressing the problem is to improve or remove the elements that may contribute to the conditions that cause the collapse.
Improve Protection Performance
When a voltage slide occurs on a power system, the voltage on the system decreases and the current through a line increases due to the load, especially if the load is a constant active and reactive power load. This decrease in voltage and increase in current might appear to a distance relay as a low-magnitude, three-phase fault. An undesirable trip may result if the backup zones of a distance relay are set such that, during an undervoltage condition, the impedance calculated by the relay lies within one of the backup distance zones. Therefore, if a system is prone to voltage slides, the backup protection zones should be set such that during an undervoltage condition, no undesirable trip is issued. To do this properly, detailed system studies need to be conducted. If the protection scheme uses backup phase-overcurrent relays, these should also be set so that they do not operate under the same conditions as described above. Backup ground distance and overcurrent relays are immune to system undervoltage conditions.
Auto reclosing is another instrument that can be used by protection engineers to avoid a voltage slide from becoming a voltage collapse by reducing the dead time (open interval time) of a circuit breaker after a fault condition is cleared. If there is a known system contingency on the power system, such as a primary transmission line out of service for maintenance purposes, and there is a high possibility of the system experiencing a voltage slide if another line were taken out of service temporarily due to a fault condition, then the dead time of the recloser could be adjusted

8
to 1 second instead of 3 seconds. This would reduce the amount of time that the power system is subjected to an undervoltage condition.
An enhancement to the auto recloser could be that if the relay detects an undervoltage condition for a set amount of time, typically longer than the normal fault clearing time, the auto recloser switches from a normal reclose mode to a fast auto reclose mode. Once the system voltage returns back to normal for a fixed amount of time, the recloser transitions from a fast auto reclose mode back to a normal auto reclose mode.
On the Eskom 132 kV distribution system, tripping is generally three-pole compared to single-pole on the 230 and 400 kV systems. It is suggested that single-pole tripping be considered on this network because during a single-pole open condition, not only can active power still be transferred, but also the reactive power losses are lower. The same cannot be said for a three-pole open condition. A further advantage of single-pole tripping is that the dead time (open interval) is significantly shorter than the three-pole open interval time.
On distribution systems, LTCs are used to maintain customer voltage levels within prescribed levels as system conditions change. Typically, as load increases, the LTC will raise the tap position so as to maintain the voltage level within the prescribed level. When the power system experiences an undervoltage condition, the LTC will raise the tap position of the transformer so as to maintain the voltage level. Assuming that no change in the load occurs during this time, the load being supplied from the transformer may be considered a constant power load. As the primary power system voltage drops, the current in the primary power system increases, resulting in an even greater voltage decrease on the primary side of the transformer. Therefore, it can be said that the load tap change aids the voltage collapse of the power system. To prevent the LTC from contributing to a voltage collapse during an undervoltage condition, the LTC should be blocked from operating during this time. An undervoltage element (relay) can be used to block the LTC from operation when the primary voltage is below a threshold, and unblock once the primary system voltage has returned to normal operating levels after a fixed amount of time.
Strengthening the Network’s Reactive Sources
Switched capacitor banks are a means of providing reactive power support to maintain voltage levels within acceptable limits. The speed at which these devices need to be inserted is dependent on the rate at which the voltage slide is occurring. The faster the slide, the more rapidly the device needs to be inserted. This means that switching has to be automatic to be effective. If the voltage slide is slower, manual switching may be considered.
In an automatic capacitor-switched scheme, typically an undervoltage relay will be used to switch-in a capacitor bank; however, the bank must also not be switched-in when the system is experiencing a temporary undervoltage condition due to a system fault. Therefore, the undervoltage device should not monitor an individual phase voltage but rather the voltage on all three phases, or monitor the positive-sequence phase voltage and the zero- or negative-sequence voltage. If the relay senses a depression in the positive-sequence voltage and an increase in the zero- or negative-sequence voltage, it will not switch-in the capacitor bank because the depression is due to a fault. This is one possible suggestion of how to prevent the capacitor bank from being switched-in under fault conditions. It is also advisable to time-delay the output of the undervoltage relay by the normal fault clearing time of the system.
Another factor to take into consideration when using switched capacitor banks is that once the power system has returned to normal, the voltage should remain within the tolerable limit.

9
Load Shedding
Load shedding is considered a final option for preventing a voltage slide from becoming a voltage collapse. Depending on the rate of the voltage slide, load may either be shed manually or automatically.
Manual Load Shedding
If the rate of the voltage slide is slow, i.e., minutes, manual load shedding can be implemented to prevent the system from experiencing a voltage collapse. This method is typically applied when there is inadequate generation available or when there is not enough reactive power reserve. This method requires a predetermined plan of action, which system operators need to execute in a predetermined order. System studies need to be performed to determine which loads should be shed first. This method has a major disadvantage in that it places a huge burden on the operations personnel to recognize a voltage slide and act quickly enough to prevent a voltage collapse.
Automatic Load Shedding
When a voltage slide is caused by the sudden loss of a critical transmission line or reactive power source, the speed of the voltage slide may be quite rapid, i.e., seconds. For this scenario, manual load shedding is no longer a viable option. Therefore, automatic load shedding has to be used to rapidly slow the voltage slide and prevent a voltage collapse. To determine which loads to shed first, perform a detailed system study, similar to the manual load-shedding scheme. Typically, an undervoltage detector is used to initiate automatic load shedding. However, these undervoltage detectors must be appropriately time-delayed or supervised so that they do not operate while the system is experiencing a fault condition. In general, the undervoltage element detectors are set to initiate automatic load shedding only if the voltage is between 85 and 95 percent of nominal for a time period greater than the fault clearing time. If the system has switched automatic capacitor banks, these should be given time to switch-in first and provide reactive power support to the voltage before proceeding with load shedding. In this case, it may be possible to allow load shedding only if the system has an undervoltage condition for a predefined amount of time and the switched capacitor banks are in service. Accurately developing the setting for the undervoltage relay, pickup value, and time delay usually requires intensive network study.
To prevent any negative interaction between manual and automatic load-shedding schemes, the reaction time for the automatic scheme should be such that manual action within such a time frame is unreasonable.
5. DESCRIPTION OF THE ESKOM PROBLEM Especially with a heavily interconnected network, it is not always possible to study all the different contingencies. In this case, it was a known fact that the network under discussion was weak. The extent of the problem was unknown; however, if left unchanged, the network would experience a voltage slide. Network strengthening was difficult to motivate and justify financially, especially because no new revenue would be generated for the company.
Summary of the Eskom Network
Eskom’s generation capacity consists of various coal-fired power stations (mostly located in the northeast of the country), a nuclear power station in the southwest, and a number of small hydro power stations. The total generation capacity is 42 GW. An interconnected transmission network

10
(220 to 765 kV) transports electric power to the various load centers throughout the country. A map of the country with most of the generation stations and transmission lines is provided in Figure 4. From the transmission substations, an interconnected 132 kV subtransmission network (not shown in Figure 4) distributes electric power even closer to the loads, and radial feeders at 66 and 88 kV distribute the power to where the voltage is stepped down to mostly 11 and 22 kV for distribution to customers.
The nature of the network is such that the interconnected 132 kV subtransmission network is seldom in parallel with the transmission network, but there are multiple in-feed points. This results in an interconnected transmission network, but also localized interconnected subtransmission networks inside, where further radial lines supply the last mile. From this it may be concluded that voltage slide conditions, caused by a disturbance (for example, a line tripping) on the interconnected subtransmission network, are localized and contained in that network. It is highly unlikely for the voltage slide condition to spread to other parts of the transmission network.
Figure 4 Map of South Africa Indicating Generation Stations and Transmission Network
LESOTHO
NAMIBIA
BOTSWANA
ZIMBABWE
MOZAMBIQUE
11
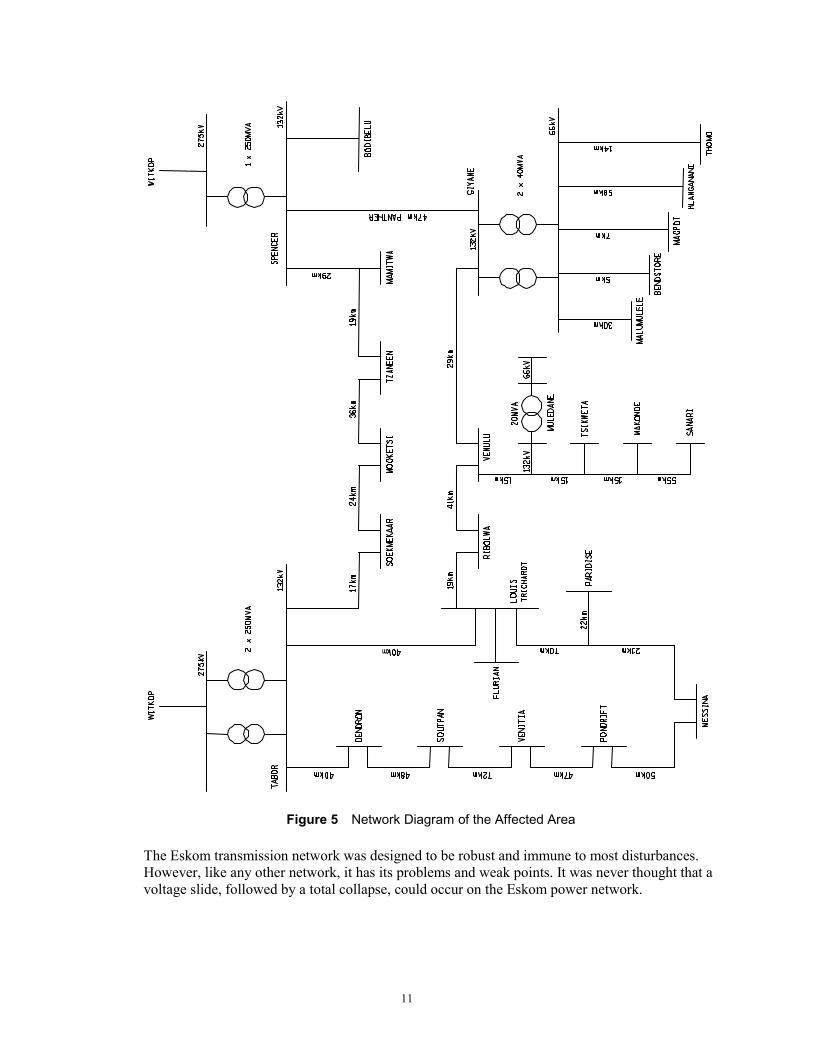
Figure 5 Network Diagram of the Affected Area
The Eskom transmission network was designed to be robust and immune to most disturbances. However, like any other network, it has its problems and weak points. It was never thought that a voltage slide, followed by a total collapse, could occur on the Eskom power network.

12
The Troublesome Network
The specific network is shown in Figure 5 and is generally referred to as the 132 kV Tabor-Spencer network. Note that this is a simplified diagram of the network. It consists of 25 distribution substations with voltages from 132 to 66 kV, and three transmission substations with incoming voltage of 275 kV. The network is fairly heavily loaded, and only a few transmission lines are supplying the network. The total installed load on this network is approximately 270 MVA and the number of customers connected to the network is approximately 100,000. Some of the customers are very important for the economic sustainability of the region: they include some citrus and vegetable farmers (for example ZZ2, the largest tomato producer in SA) who are dependent on electricity for irrigation, processing of their product and cool storage facilities, and Venitia mine, which produces approximately 60% of the profit of the well known De Beers diamond company, one of the largest diamond producers in the world.
The Trouble
During 1999, Eskom’s northern distribution region experienced a voltage slide on a part of its network in the northern part of the country. The occurrence of a voltage slide was only found later during the post-fault investigation. The incident was triggered by a protection operation on the 275 kV Witkop-Tabor power line within the network shown in Figure 5. The protective relays operated correctly, but the line failed to auto-reclose successfully. The removal of the line from the power system resulted in an overloaded and weakened system, causing the disturbance required for the collapse. The power transfer requirement over the rest of the network was such that it pushed the system past the critical voltage point (bifurcation point), causing the voltage collapse. At the time of the voltage collapse the power factor on the Tabor network was approximately 0.96. An example of a P-V curve for a power factor of 0.96 is shown in Figure 6; the active power (load) is normalized against a critical voltage with a unity power factor. The cause of the voltage slide and subsequent collapse was attributed to the fact that power transfer requirements on portions of the 132 kV network became so large that the system voltage to power transfer ratio exceeded the critical value on the P-V curve and moved into the unstable region. The reactive power available on the network was exceeded by the reactive power demand. The network complied with the criteria for a voltage slide.

13
0 0.2 0.4 0.6 0.8 10
0.2
0.4
0.6
0.8
1
Load (p.u)
Vol
tage
(p.u
)
Load
Stable Region
Critical Voltage
Unstable Region
Figure 6 Voltage to Power Transfer Ratio Curve Showing the Stable and Unstable Regions
With the Witkop-Tabor line out of service, the 132 kV network from Spencer substation was loaded beyond its capacity. During this time, the voltage started to slide, causing the Tabor transformer tap changer to tap to maximum boost tap, locking out in this position. This was in an attempt to restore the voltage to within statutory limits. During this time, the backup overcurrent protection on two feeders tripped incorrectly on overload because the Witkop-Tabor line was out of service, causing an almost total blackout to the network shown in Figure 5. The backup overcurrent relay, on the Venulu feeder at Giyani substation, tripped due to incorrect settings. The relay was set to pick up at 300 A, where 500 A would have been an appropriate setting based on the thermal rating of the line. The Mamitwa feeder at Spencer substation also tripped due to incorrectly applied settings. The latter two trips caused a blackout to most of the network. Subsequent network studies showed that if these two feeders had not tripped, the voltage on the network would have collapsed in any case, and the loads would not have been supplied, thus the need for undervoltage load-shedding protection.
The Studies
Detailed load models are required in order to perform dynamic system studies. Generators and their controls also have to be modeled in detail. Because the load model was unknown, a constant power load was selected for the model and static studies were performed. The result of opting only for static system studies is that it was not possible to determine the time response of the voltage versus time. However, the level that the voltage would reach if it was allowed to slide to steady-state could be calculated.
14
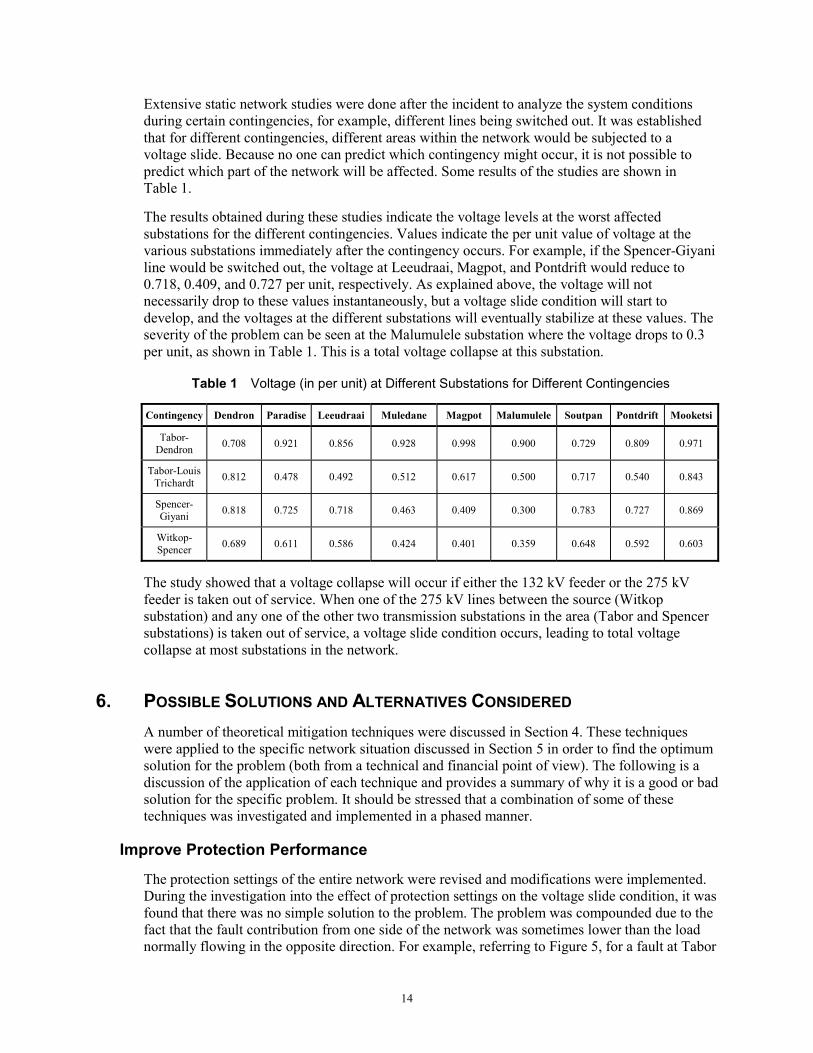
Extensive static network studies were done after the incident to analyze the system conditions during certain contingencies, for example, different lines being switched out. It was established that for different contingencies, different areas within the network would be subjected to a voltage slide. Because no one can predict which contingency might occur, it is not possible to predict which part of the network will be affected. Some results of the studies are shown in Table 1.
The results obtained during these studies indicate the voltage levels at the worst affected substations for the different contingencies. Values indicate the per unit value of voltage at the various substations immediately after the contingency occurs. For example, if the Spencer-Giyani line would be switched out, the voltage at Leeudraai, Magpot, and Pontdrift would reduce to 0.718, 0.409, and 0.727 per unit, respectively. As explained above, the voltage will not necessarily drop to these values instantaneously, but a voltage slide condition will start to develop, and the voltages at the different substations will eventually stabilize at these values. The severity of the problem can be seen at the Malumulele substation where the voltage drops to 0.3 per unit, as shown in Table 1. This is a total voltage collapse at this substation.
Table 1 Voltage (in per unit) at Different Substations for Different Contingencies
Contingency Dendron Paradise Leeudraai Muledane Magpot Malumulele Soutpan Pontdrift Mooketsi
Tabor-Dendron 0.708 0.921 0.856 0.928 0.998 0.900 0.729 0.809 0.971
Tabor-Louis Trichardt 0.812 0.478 0.492 0.512 0.617 0.500 0.717 0.540 0.843
Spencer-Giyani 0.818 0.725 0.718 0.463 0.409 0.300 0.783 0.727 0.869
Witkop-Spencer 0.689 0.611 0.586 0.424 0.401 0.359 0.648 0.592 0.603
The study showed that a voltage collapse will occur if either the 132 kV feeder or the 275 kV feeder is taken out of service. When one of the 275 kV lines between the source (Witkop substation) and any one of the other two transmission substations in the area (Tabor and Spencer substations) is taken out of service, a voltage slide condition occurs, leading to total voltage collapse at most substations in the network.
6. POSSIBLE SOLUTIONS AND ALTERNATIVES CONSIDERED A number of theoretical mitigation techniques were discussed in Section 4. These techniques were applied to the specific network situation discussed in Section 5 in order to find the optimum solution for the problem (both from a technical and financial point of view). The following is a discussion of the application of each technique and provides a summary of why it is a good or bad solution for the specific problem. It should be stressed that a combination of some of these techniques was investigated and implemented in a phased manner.
Improve Protection Performance
The protection settings of the entire network were revised and modifications were implemented. During the investigation into the effect of protection settings on the voltage slide condition, it was found that there was no simple solution to the problem. The problem was compounded due to the fact that the fault contribution from one side of the network was sometimes lower than the load normally flowing in the opposite direction. For example, referring to Figure 5, for a fault at Tabor

15
substation, the fault contribution from Dendron substation is only 29.3 amps compared to the load transfer on the Tabor-Dendron line, which is normally 170 amps.
A thorough study of the protective relay settings showed that the applied settings were correct, and no changes were required (excluding the two cases of settings errors discussed before). The study also reviewed other system constraints and considerations, such as emergency thermal limits on lines, grading of zone 2 and 3 distance elements with back-up overcurrent, and earth fault protection, etc.
Strengthening the Network
With reference to Figure 5, network studies showed that with the existing network, the maximum load transfer for a constant power load is 281.5 MW while the system is healthy (before a voltage collapse takes place). When the Tabor-Dendron line is opened, the maximum power transfer is 230.5 MW, and with the Tabor-Dendron line switched back in and the Tabor-Louis Trichardt line switched out it is 192.5 MW.
Because the 132 kV distribution lines in the network are reasonably long and some were constructed using relatively thin conductor, adding another 132 kV line to the network will not necessarily solve the problem. A close-to-ideal situation is to place a 275 kV substation somewhere in the center of the network. However, this means constructing an additional transmission substation, which unfortunately is not economically viable because it is cost excessive.
As a long-term solution, Eskom decided to construct an additional 132 kV line between Tabor and Louis Trichardt substations. This would provide a stable system for all distribution-related contingencies; however, it would not be effective for any of the 275 kV lines taken out of service. This new line would increase the maximum load transfer capabilities of the network to 288.9 MW for healthy conditions and to 241.8 MW for the Tabor-Dendron line when opened (previously only 230.5 MW).
Installations of shunt capacitor banks or static var compensators (SVCs) were also considered. According to Koessler [1], installing shunt capacitor banks or SVCs will not completely mitigate a voltage slide condition; it will merely start sliding at a higher voltage value. If the value at which the voltage collapse commences becomes comparable with operating voltages, it will not be possible to detect a possible voltage slide and react to it. According to Hawkins [6], using reactive compensation, such as SVCs and capacitor banks, will provide much less warning of a pending voltage slide condition. The margin between stable system and voltage slide may become smaller. This was also shown in Section 2.
Human Intervention
As mentioned previously, one of the best ways of mitigating a voltage slide condition is to shed load manually. There are two minimum criteria that should be complied with in order to implement such a solution:
1) There should be Supervisory Control and Data Acquisition (SCADA) access to all substations in the network where load must be shed.
2) Controllers should have full authority and control over these circuit breakers in order to switch them out for the purpose of load shedding and therefore voltage recovery.

16
However, manual load shedding cannot be practically implemented in this network for the following reasons:
• The power system controller must be able to distinguish between a voltage collapse and low voltage conditions on the system.
• The power system controller has to be able to react and shed load within 3 to 18 seconds. • The controller might overreact and shed too much load, leading to overvoltage conditions. • As can be seen from the results of the studies, the controller needs to know where to
switch out load during which contingency. With the time available to make a decision so limited, it is highly unlikely that the controller will make the correct decision.
Automatic Load Shedding
If voltages are measured at all substations and load is shed automatically to enable voltage recovery, a total collapse can be prevented. The problem with this principle is that until recently it was common practice to measure the voltage and apply a definite-time undervoltage element. This does not allow for the different contingencies as explained in Section 5, and it would result in an extremely inflexible solution and quite possibly over shedding for every voltage slide condition.
An alternative option considered is a very expensive network-monitoring scheme that requires fast and reliable telecommunication between all substations in the network and a central point from where the system is controlled. This typically requires high-bandwidth microwave radio links or fiber cables to be installed in the entire network. As a compromise, this can be implemented at a reduced number of substations. However, the result is not the best and most flexible solution. Very little of this telecommunication infrastructure currently exists, making it a costly solution.
7. THE SOLUTION The simulated results and their interpretation are complex and not dependent on the system response in real time. The timing of the solution is dependent on tap changers operating and other variables described below. It is independent of how long the system takes to reach a certain voltage level while sliding.
Basically, the solution consists of two components:
1) Inherent load shedding when motors and other voltage-sensitive loads automatically start to disconnect themselves from the power network as the voltage begins to slide
2) The undervoltage load-shedding schemes
As mentioned before, comprehensive network studies were performed for various contingencies and the data put in tabular format in Table 1.
Table 2 is partly a copy of Table 1. As in Table 1, values indicated in the first line of the contingency indicate the per unit value of voltage at the various substations immediately after the contingency occurs. The next line indicates the action taken and the per unit value of the voltage at the remaining substations.

17
Table 2 Voltage (in per unit) at Different Substations for Different Contingencies and Different Load Shed at One or More Substations
Contingency Dendron Paradise Leeudraai Muledane Magpot Malumulele Soutpan Pontdrift Mooketsi
Tabor-Dendron 0.708 0.921 0.856 0.928 0.998 0.900 0.729 0.809 0.971
Trip 1.001 0.993 0.983 1.049 1.000 0.966 0.980 1.010
Tabor-Louis Trichardt 0.812 0.478 0.492 0.512 0.617 0.500 0.717 0.540 0.843
0.910 Trip 0.730 0.738 0.831 0.800 0.835 0.754 0.928
Trip 0.866 0.947 0.900 0.933 0.880 0.976
Spencer-Giyani 0.818 0.725 0.718 0.463 0.409 0.300 0.783 0.727 0.869
0.850 0.771 0.766 0.540 0.513 Trip 0.819 0.773 0.894
0.913 0.881 0.859 0.697 Trip 0.819 0.861 0.944
0.954 0.918 0.918 0.801 0.937 0.917 0.976
Witkop-Spencer 0.689 0.611 0.586 0.424 0.401 0.359 0.648 0.592 0.603
0.750 0.688 0.667 0.532 Trip Trip 0.716 0.670 0.674
0.883 0.851 Trip Trip 0.869 0.861 0.820
For example, taking the Tabor-Louis Trichardt contingency (i.e., the Tabor-Louis Trichardt line is switched out), the voltage at Leeudraai, Magpot, and Pontdrift slides to 0.492, 0.617, and 0.54 per unit, respectively. If load is shed at Paradise substation (second line of Tabor-Louis Trichardt contingency in Table 2), the voltage increases at most substations. The voltage at Leeudraai, Magpot, and Pontdrift increases to 0.73, 0.738, and 0.754 per unit from the values mentioned above. If additional load is shed at Leeudraai substation, the voltage at Magpot and Pontdrift increases to 0.947 and 0.88 per unit respectively. This is a substantial increase in voltage, merely by intelligently shedding load.
The results from the power network studies indicate that if the total load is shed at each of the following substations, during the contingencies indicated in Table 2, the system can be restored to a healthy condition with reasonable success.
• Dendron substation • Paradise substation • Leeudraai substation • Magpot substation • Malumulele substation • Muledane substation
As mentioned before, during the initial stages of a voltage slide, motor contactors will drop out, thereby achieving a form of natural load shedding when most motor loads automatically trip. If this is sufficient to ensure voltage recovery, no further action is required.
Initial studies showed that what was required, was a characteristic that would work on an inverse definite-minimum-time principle, i.e., the lower the voltage, the faster the relay should operate. An investigation into the results of Table 2 and a subsequent curve-fitting exercise resulted in a

18
characteristic provided in Equation (1). It was determined that if each of the relays was programmed with this characteristic, all schemes would coordinate irrespective of the scenario.
DW)VV(
STTT R
n
m +−−
⋅= (1)
Where TT = operating time Tm = 0.18 S = 0.3 Vn = 132/√3 kV R = 0.017 W = 1 D = 2
This characteristic will react fast during deep voltage dips and will fine-tune the system for voltages close to 85%. Figure 7 shows the corresponding characteristic.
0 0.1 0.2 0.3 0.4 0.5 0.6 0.7 0.82
3
4
5
6
7
8
9
10
11
12
13
14
15
Voltage drop vs. timeSystem voltage vs. time
Voltage in p.u.
Trip
tim
e in
seco
nds
Figure 7 Undervoltage Load-Shedding Operating Curve
We used the operating time versus voltage curve in Figure 7 to obtain the operating times shown in Table 3 for the different scenarios. Table 3 should be studied in conjunction with Table 2.

19
Table 3 Tripping Times (in seconds) of Undervoltage Schemes
Substation Contingency
Dendron Paradise Leeudraai Muledani Magpot Malumulele
Tabor-Dendron 12.108 None None None None None
None 7.84 7.87 8.00 9.13 7.92 Tabor-Louis Trichardt
None Tripped 13.97 14.98 None None
Spencer-Giyani None 13.45 12.83 7.70 7.47 7.13
None 24.91 22.17 8.22 8.01 Tripped
None None None 11.47 Tripped Tripped
Witkop-Spencer 11.09 9.03 8.68 7.53 7.44 7.29
17.07 11.05 10.27 8.15 Tripped Tripped
An example is used in order to explain Table 3. For the Tabor-Dendron contingency, a value of 12.108 seconds is indicated. This means that the Dendron load will be shed after 12.108 seconds. “None” in the columns for Paradise, Leeudraai, Muledani, Magpot, and Malumulele substations means that no tripping has to take place. As shown in Table 2, only tripping of the Dendron load is required to recover the system from voltage slide.
A second example is the Tabor-Louis Trichardt contingency. “None” is shown in the Dendron column, meaning that the Dendron load will not be tripped. Table 2 shows that the voltage in the first line is 0.812 per unit for Dendron substation, resulting in a relatively long tripping time. The tripping times for Paradise and Leeudraai substations are the shortest and differ by only 30 ms. This provides a slight problem, because only Paradise should be tripped for the first line of the contingency. However, they are so close to each other that, in all probability, they will both trip for the first line of the contingency. The grading margin for Malumulele substation for the Tabor-Louis Trichardt contingency is very small, i.e., only 80 ms between the tripping of Paradise substation and Malumulele substation. This is the only contingency that might effectively over trip (trip too much load). Over tripping might occur in that, from Table 2, tripping of load is required at only Paradise and Leeudraai substations. However, the tripping margin of 80 ms between Paradise, Leeudraai, and Malumulele substations from Table 3 indicates that load at Malumulele substation may be tripped as well.
Protection Scheme Requirements
In order for the undervoltage load-shedding scheme to work properly and to not negatively impact other protection systems, it should comply with a number of critical requirements. It should not operate within 4 seconds after the voltage started to slide below the settings. This will allow a faulted line to trip and successfully reclose. If a line recloses successfully, subsequent to a fault, the low voltage will not persist. If the voltage recovers at any time while the relay is timing, the relay should reset and no tripping should occur. However, if the auto-reclose was not successful, the low voltage will persist and then action is required without any further delay. Transformer LTC settings are such that they will start tapping after a period of 20 seconds. At this point, the undervoltage load-shedding scheme should refrain from operating because the network equilibrium will be altered. If the load-shedding scheme cannot restore the voltages within 20 seconds, the network is doomed to failure and a total shut down of that part of the network is a certainty.

20
Limitations on operating values are just as important. No operation should occur for voltage values less than 20% of rated voltage. This would constitute a loss of supply where there is no need for load reduction. The relay should also not operate for voltages of more than 85% of nominal, because this constitutes a “healthy supply,” and transformer LTC operation may increase the voltage to acceptable levels.
Relay manufacturers were approached to suggest relays that may be able to conform to the following guideline specifications:
• Measurement range: 0.1 to 1.2 per unit voltage • Measurement accuracy: 2% • Minimum time before operation: 4 seconds • Maximum operating time before lockout: 20 seconds • Minimum operating voltage: 0.2 per unit • Maximum operating voltage: 0.85 per unit
• Operating curve: DW)VV(
STTT R
n
m +−−
⋅=
• Event recording required • Remote access (the control center should be able to switch the scheme on and off)
8. IMPLEMENTATION The next step was to find a hardware platform on which the inverse-time undervoltage characteristic could be implemented. At the time, no relay could be found with the same or similar characteristic. All relays investigated had definite-time undervoltage characteristics and no programmable characteristics. At about the same time a flexible numerical relay was introduced that allowed the programming of user definable curves. This allowed the user to program unique curves in the protective relay. The output from these unique algorithms may be used in the relay logic, including tripping logic.
A specification was compiled, an enquiry issued, and protection schemes purchased. These schemes were installed on site and have been in operation for 1 year. Since the schemes were installed, no voltage slide condition has occurred and therefore, the relays and algorithm have not been tested in practice.
The algorithm implemented in the relay is shown below (the # sign is used to indicate to the relay that comments are being entered):
1: # INVERSE TIME UNDERVOLTAGE ELEMENT 2: # ENTER THE CONSTANTS HERE 3: PMV01:= 0.180000 # Time multiplier TM 4: PMV02:= 0.300000 # S 5: PMV03:= 0.017000 # R 6: PMV04:= 1.000000 # W 7: PMV05:= 2.000000 # Fixed delay time D 8: PMV06:= 0.150000 # Plug setting in per unit. (The voltage drop has to be greater than 15% before the element will pick up) 9: PMV07:= 76.200000 # System nominal line to neutral voltage in kV (132/√3) 10: PMV08:= 0.2 * PMV07 # Minimum voltage above which line is considered to be alive (20% of nominal in this case)
Continued on Next Page

21
Continued from Previous Page
11: PMV09:= 400 # Relay processing intervals in 1 second (Programmable logic is run 8 times a power system cycle or 400 times in 1 second at 50 Hz) 12: # EQUATION 13: PMV10:=(PMV07 - V1M) / PMV07 / PMV06) # Plug setting multiplier 14: PMV11:= EXP (PMV03 * LN (PMV10)) - PMV04 # Denominator 15: PMV12:= PMV01 * PMV02 # Numerator 16: PMV13:= (PMV11 / PMV12) + PMV05 # complete equation 17: PSV01:= (PMV10 > 1.000000) AND (V1M > PMV08) AND NOT LOP 18: PMV14:= (1.000000 / PMV13 / PMV09) # incremental change in 1 processing interval 19: PMV15:= (PMV14 + PMV15) * PSV01 * PSV02 + 1.010000 * PSV01 * PSV03 20: PSV02:= PMV15 < 1.000000 21: PSV03:= PMV15 > 1.000000 # Use this variable to issue the trip output. 22: PMV16:= V1M # Added for observation by the user and does not need to be programmed
The stated Eskom expression is provided in Equation (1). Explanations for equation logics are as follows.
Line 13
This calculates the plug setting multiplier value as defined by Eskom. To calculate the plug setting multiplier, the difference between the actual positive-sequence system voltage and the nominal positive-sequence system voltage is obtained. This difference value is then divided by the nominal positive-sequence voltage of the system to convert it to a per unit value. The per unit value is then divided by the pickup value (plug setting). The reason for using positive-sequence voltage is that this will compensate for any phase voltage unbalance during heavy load conditions on untransposed lines.
Line 14
This calculates the denominator value of the equation. The relay does not support complete exponential math but it does support the natural logarithmic function (ln) and the natural anti-logarithmic function (e). But a function such as (AB) can be expressed using natural logarithms and anti-logarithms as follows:
AB := e (B• ln (A)) (2)
For the relay to distinguish between the letter “e” and the natural anti-logarithm “e” the natural anti-logarithm is expressed by EXP.
Line 15
The numerator value is calculated in this step and is a straightforward multiplication of the time multiplier by a constant that defines the curve characteristic.
Line 16
Implementation of the equation as defined by Equation (1).
Line 17
This is a check function to see if the voltage drop is above the minimum threshold and to verify that the line is not de-energized, i.e., out of service. The variable is set to a logical 1 if the voltage drop is greater than the minimum pickup value and the line is not out of service. This function

22
also supervises the undervoltage element with the loss-of-potential (LOP) logic. This means, if the relay experiences an LOP, this function is inhibited because it may lead to a misoperation of this element.
Line 18
This calculates how far the “disk” will travel in one processing interval. The total/maximum distance that the disk can travel is equal to 1 per unit. Imagine an old electromechanical relay disk as shown in Figure 8. If you were to measure the distance that this disk travelled in one processing interval as a ratio to the total distance, you would get the same answer.
0 1Distance traveled in 1
processing interval
Start Finish
Figure 8 Graphical Representations Showing the Distance Traveled by an
Electromechanical Induction Disk Relay
Line 19
A mathematical “OR” function is created here. In the first part of the “OR” function, a mathematical summation is implemented where the incremental value is summed with the previous accumulator value if the accumulated value is less than 1 and the operating condition is true. The second part of the “OR” function is used to set the value of the counter above the pickup value and keep the counter at this value once the counter has reached the pickup value and the operating condition is still true.
Line 20
This equation is used to enable the first part of the “OR” function in Line 19. The output from this logic is true while the accumulator has not yet reached its final value and the operating conditions are still true. At the same time, this will reset the accumulator back to zero if the operating conditions deassert. (Plug setting multiplier greater than one (PMV10 > 1.0) and line in service, i.e., voltage magnitude greater than 20% of nominal.)

23
Line 21
This equation is used to enable the second part of the “OR” function in Line 19. The output from this logic is true when the accumulator has reached its final value and the operating conditions are still true. The output of this logic is used as the final output of the inverse-time undervoltage element. At the same time, it will also reset the accumulator to zero if the operating conditions reset.
9. CONCLUSIONS From this paper it can be seen that voltage slides and collapses have moved from the realm of textbooks into the actual power system. This means that power system engineers now have to not only be able to detect voltage slides, but prevent them from evolving into total voltage collapse. In addition to this, engineers also have to know at what minimum voltage level they may safely operate their system, and still be able to deal with a disturbance or contingency on the power system.
To detect the presence of a voltage slide or determine the minimum safe operating voltage level is not a simple matter, as it does not necessarily depend only on the voltage magnitude, but is also dependent on the type of load being supplied and the system parameters, such as the source impedance. This means that to detect the presence of a voltage slide or to determine the minimum safe operating voltage of a power system, engineers have to know detailed data about the type of load being supplied and the power system parameters. Because the power system configuration and loads on a power system change dynamically, not only does the power system voltage magnitude have to be monitored in real time, but the load and system configuration also have to be monitored in real time. This is no trivial matter, and data from one measuring point alone cannot be used to determine all the required information.
This paper has discussed one solution of detecting a voltage slide and preventing a total voltage collapse. The paper does not address the concern of determining a safe, minimum operating voltage of a power system. The solution offered herein applies to a particular network and load condition. In this particular case, an inverse-time undervoltage element is used to perform undervoltage load shedding. This scheme is coordinated with the dead time of the line reclosers so that the element does not initiate load shedding while the system has a line out of service temporarily. The advantage of an inverse-time undervoltage element versus a definite-time undervoltage element is that the pickup value for the inverse-time element can be set more sensitively than that of the definite-time element. It is also able to react much faster to a more severe undervoltage condition than a definite-time element. The effectiveness of this scheme cannot be confirmed because since implementation, the scheme has not been called into operation. It must also be mentioned that the presently implemented scheme can be improved.
One of the improvements suggested is to compensate the voltage magnitude with a percentage of the reactive power flowing in the line and present this compensated voltage magnitude to the inverse-time undervoltage element. The reasoning behind the compensated voltage is that if the line is exporting reactive power, it is providing voltage support to the system; therefore, this line should be kept in service for as long as possible. In this case, the compensated voltage will have a higher magnitude than the uncompensated voltage. In a similar fashion, if the line is importing reactive power, the compensated voltage magnitude will be lower than the uncompensated voltage. This modification will assure that bad loads, i.e., those that absorb reactive power, are shed before the good loads, i.e., those that export reactive power.

24
10. ACKNOWLEDGEMENTS The authors wish to thank the following persons for their valuable contributions:
• Franco de Villiers, for performing numerous PSS/E studies. • Keith Harley, for coauthoring the original Undervoltage Load Shedding Scheme Report
in September 2001 with Jan Cloete, one of the coauthors of this paper.
11. REFERENCES [1] R.J. Koessler, “Voltage Instability/Collapse—An Overview,” Voltage Collapse (Digest No:
1997/101), IEE Colloquium, April 24, 1997.
[2] I. Dobson et al., “Voltage Collapse in Power Systems,” IEEE transaction 8755-3993/92, Source: Internet, 1992. http://eceserv0.ece.wisc.edu/~dobson/PAPERS/dobsonCDM92.pdf
[3] H.K. Clark, “The Voltage Collapse Phenomenon,” Power Technologies, Inc.
[4] A. Guzmán et al., “Local and Wide-Area Network Protection Systems Improve Power System Reliability,” Presented at the 31st Annual Western Protective Relay Conference, Spokane, WA, October 19–21, 2004.
[5] P. Kundur, “Power System Stability and Control,” McGraw-Hill.
[6] N.T. Hawkins, “Voltage Collapse and Its Avoidance,” Voltage Collapse (Digest No: 1997/101), IEE Colloquium, April 24, 1997.
[7] C.W. Taylor, “Power System Voltage Stability,” McGraw-Hill 1994.
[8] C. Henville, et al., Prepared by Working Group K12 of the Substation Protection Subcomittee, “Voltage Collapse Mitigation,” Report to IEEE Power System Relaying Committee, Source: Internet, December 1996. http://www.pes-psrc.org/Reports/Voltage%20Collapse%20Mitigation.pdf
[9] M.V. Venkatasubramanian, (Washington State University), “Analysing Blackout Events: Experience From the Major Western Blackouts in 1996,” Power System Engineering Research Center White Paper 301, Source: Internet, August 2003. http://www.tech.purdue.edu/eet/Courses/eet331/blackout/PSERC_White_Paper_WesternUS_Blackouts.pdf
12. BIOGRAPHIES Izak van der Merwe obtained his B. Eng (Electrical) degree from the University of Stellenbosch in 1991. He started to work for Eskom in 1993 as a Protection Field Engineer. He is currently a Chief Engineer: Protection Specialist in Resources and Strategy, a Corporate Division of Eskom Holdings Limited. He is responsible for Distribution Division National Contracts for protection schemes and equipment, general protection technology direction setting and technology management, and the implementation of Distribution Automation and Substation Automation in Eskom’s Distribution Division. He has authored a number of protection and substation automation related papers. He is a Registered Professional Engineer in South Africa.

25
Jan Cloete obtained his Diploma in 1990 at the Witbank Technical College, South Africa. He has 25 years experience in the electricity utility environment with Eskom and has served as Technician in the power system protection field in the Generation, Transmission and Distribution Divisions of Eskom. He is presently a Senior Advisor in PTM, a division of Eskom Enterprises. He is seconded to the Northern Distribution Region of Eskom's Distribution Division, where he is the Head of Protection Planning in the Electricity Delivery Network Services Department in the Region.
Normann Fischer joined Eskom as a Protection Technician in 1984. He received a Higher Diploma in Technology, with honors, from the Witwatersrand Technikon, Johannesburg, in 1988 and a B.Sc. in Electrical Engineering, with honors, from the University of Cape Town in 1993. He was a Senior Design Engineer in Eskom’s Protection Design Department for three years, then joined IST Energy as a Senior Design Engineer in 1996. In 1999, he joined Schweitzer Engineering Laboratories as a Power Engineer in the Research and Development Division. He was a registered professional engineer in South Africa and a member of the South Africa Institute of Electrical Engineers.
Previously presented at the 2005 Texas A&MConference for Protective Relay Engineers.
© 2005 IEEE – All rights reserved.20050106 • TP6181-01