Implementation of a tension-stiffening model for the cracking nonlinear analysis of RC elements in...
6
Papers on XC, 2016 Implementation of a tension-stiffening model for the cracking nonlinear analysis of reinforced concrete elements in the finite element OSS XC Ana Ortega 1 , Luis C. P´ erez Tato 2 Abstract The development of a smeared-crack model offers a general crack-modeling method that is independent of the structural configuration. It treats cracking as a constitutive material behaviour rather than a geometric discontinuity and lends itself well to implementation in large finite element codes. This paper deals with the implementation in XC of a constitutive model for reinforced concrete elements that takes into account the increase in stiffness of a cracked member due to the development of tensile stresses in the concrete between the cracks, effect known as tension-stiffening. The nonlinear analysis in XC of fiber-like sections with this constitutive model allows for a more general, direct and intuitive evaluation of the crack amplitude than applying the mostly specific formulae developed in the standards. The numerical results obtained by the program compare extremely well with existing designing results issued by other applied methods. 1 structural engineer - [email protected] 2 structural engineer - [email protected] Contents 1 Introduction 1 2 Crack control according to Eurocode-2, evaluation of the crack amplitude. 1 3 Tension-stiffening concrete constitutive model 2 4 Implementation of the model in XC 2 5 Verification 3 6 Conclusions. Further work 4 References 4 1. Introduction The development of a smeared-crack model offers a general crack-modelling method that is independent of the structural configuration. It treats cracking as a constitutive material behaviour rather than a geometric discontinuity. Quite a few models that modify the constitutive equation of steel or concrete after cracking have been proposed for nonlinear finite element analysis of reinforced concrete struc- tures. The model that is to be implemented in XC, taken for reference [8], modifies the descending branch of the ten- sile stress-strain curve of concrete to take into account the tension-stiffening effect in an average way. 2. Crack control according to Eurocode-2, evaluation of the crack amplitude. If a continuously increasing tension is applied to a tension member, the first crack will form when the tensile strength of the weakest section in the member is exceeded. The for- mation of this crack leads to a local redistribution of stresses within the section. At the crack, all the tensile force will be transferred to the reinforcement, and the stress in the concrete immediately adjacent to the crack must clearly be zero. With increasing distance from the crack, force is transferred by bond from the reinforcement to the concrete until, at some distance, l t , from the crack, the stress distribution within the section remains unchanged from what it was before the crack formed. As further load is applied, a second crack will form at the next weakest section, though it will not form within l t of the first crack since the stresses within this region will have been reduced by the formation of the first crack. Figure 1. Definition of the crack width As shown in figure 1 the crack width is the difference between
-
Upload
luis-claudio-perez-tato -
Category
Engineering
-
view
61 -
download
3
Transcript of Implementation of a tension-stiffening model for the cracking nonlinear analysis of RC elements in...

Papers on XC, 2016
Implementation of a tension-stiffening model for thecracking nonlinear analysis of reinforced concreteelements in the finite element OSS XC
Ana Ortega1, Luis C. Perez Tato2
AbstractThe development of a smeared-crack model offers a general crack-modeling method that is independent ofthe structural configuration. It treats cracking as a constitutive material behaviour rather than a geometricdiscontinuity and lends itself well to implementation in large finite element codes. This paper deals with theimplementation in XC of a constitutive model for reinforced concrete elements that takes into account theincrease in stiffness of a cracked member due to the development of tensile stresses in the concrete between thecracks, effect known as tension-stiffening. The nonlinear analysis in XC of fiber-like sections with this constitutivemodel allows for a more general, direct and intuitive evaluation of the crack amplitude than applying the mostlyspecific formulae developed in the standards. The numerical results obtained by the program compare extremelywell with existing designing results issued by other applied methods.
1structural engineer - [email protected] engineer - [email protected]
Contents
1 Introduction 1
2 Crack control according to Eurocode-2, evaluation ofthe crack amplitude. 1
3 Tension-stiffening concrete constitutive model 2
4 Implementation of the model in XC 2
5 Verification 3
6 Conclusions. Further work 4
References 4
1. IntroductionThe development of a smeared-crack model offers a generalcrack-modelling method that is independent of the structuralconfiguration. It treats cracking as a constitutive materialbehaviour rather than a geometric discontinuity.
Quite a few models that modify the constitutive equationof steel or concrete after cracking have been proposed fornonlinear finite element analysis of reinforced concrete struc-tures. The model that is to be implemented in XC, takenfor reference [8], modifies the descending branch of the ten-sile stress-strain curve of concrete to take into account thetension-stiffening effect in an average way.
2. Crack control according to Eurocode-2,evaluation of the crack amplitude.
If a continuously increasing tension is applied to a tensionmember, the first crack will form when the tensile strength
of the weakest section in the member is exceeded. The for-mation of this crack leads to a local redistribution of stresseswithin the section. At the crack, all the tensile force will betransferred to the reinforcement, and the stress in the concreteimmediately adjacent to the crack must clearly be zero. Withincreasing distance from the crack, force is transferred bybond from the reinforcement to the concrete until, at somedistance, lt , from the crack, the stress distribution within thesection remains unchanged from what it was before the crackformed. As further load is applied, a second crack will format the next weakest section, though it will not form within ltof the first crack since the stresses within this region will havebeen reduced by the formation of the first crack.
Figure 1. Definition of the crack width
As shown in figure 1 the crack width is the difference between
Implementation of a tension-stiffening model for the cracking nonlinear analysis of reinforced concrete elements inthe finite element OSS XC — 2/6
the steel and concrete elongations over the length 2lt , wherelt is the �transmission length� necessary to increase the con-crete strength from 0 to the tensile strength fctm. Since nocrack can form within lt of an existing crack, this defines theminimum spacing of the cracks. The maximum spacing is2lt , since if a spacing existed wider than this, a further crackcould form.
The development of formulae for the prediction of crackwidths given in clause 7.3.4 of EN 1992-1-1 follows fromthe description of the cracking phenomenon given above. Ifit is assumed that all the extension occurring when a crackforms is accommodated in that crack, then, when all the crackshave formed, the crack width will be given by the followingrelationship, which is simply a statement of compatibility:
w = Srmεm
where w is crack width, Srm is the average crack spacingand εm is the average strain. The average strain can be morerigorously stated to be equal to the strain in the reinforcement,taking account of tension stiffening, εsm, less the averagestrain in the concrete between cracks, εcm . Since, in design,it is a maximum width of crack which is required rather thanthe average, the final formula given in EN 1992-1-1 is
wk = Sr,max(εsm − εcm)
In order to asses the mean strain in reinforcement takinginto account the effects of tension stiffening, we have imple-mented in XC a constitutive model of concrete that modifiesits tensile range so that the tension stiffening effect is consid-ered in an average way.
3. Tension-stiffening concreteconstitutive model
Stramandinoli and La Rovere have proposed �An efficienttension-stiffening model for nonlinear analysis of reinforcedconcrete members� [8]. The model uses an explicit formula-tion for the concrete stress–strain curve and thus can be easilyimplemented into a finite element code.
In the proposed model, concrete is assumed to behave likea linear-elastic material until its tensile strength is reached,so that a straight line defines initially the stress–strain curve,while in the post-cracking range, an exponential decay curveis adopted until yielding of reinforcement takes place. Theexponential decay parameter (α) is a function of the memberreinforcement ratio (ρ) and of the steel-to-concrete modularratio (ν = Es/Ec ), and is derived taking as basis the CEBtension-stiffening model.
This exponential decay curve is defined by the followingequation:
σct = fcte−α( ε
εcr )
where,
fct is the concrete tensile strength;
εcr is the strain corresponding to the concrete tensile strength,
α is an exponential decay parameter.
The parameter α is derived by Stramandinoli and La Ro-vere taking as basis the CEB [1] model, and expressed as:
α = 0.017+0.255(νρe f )−0.106(νρe f )2 +0.016(νρe f )
3
where,
ρe f is the member effective reinforcement ratio ρe f =As/Ac,e f
ν is the steel-to-concrete modular ratio ν = Es/Ec
4. Implementation of the model in XCXC takes from OpenSees a material called �concrete02�,implemented by Filip Filippou, that allows for concrete tensilestrength.
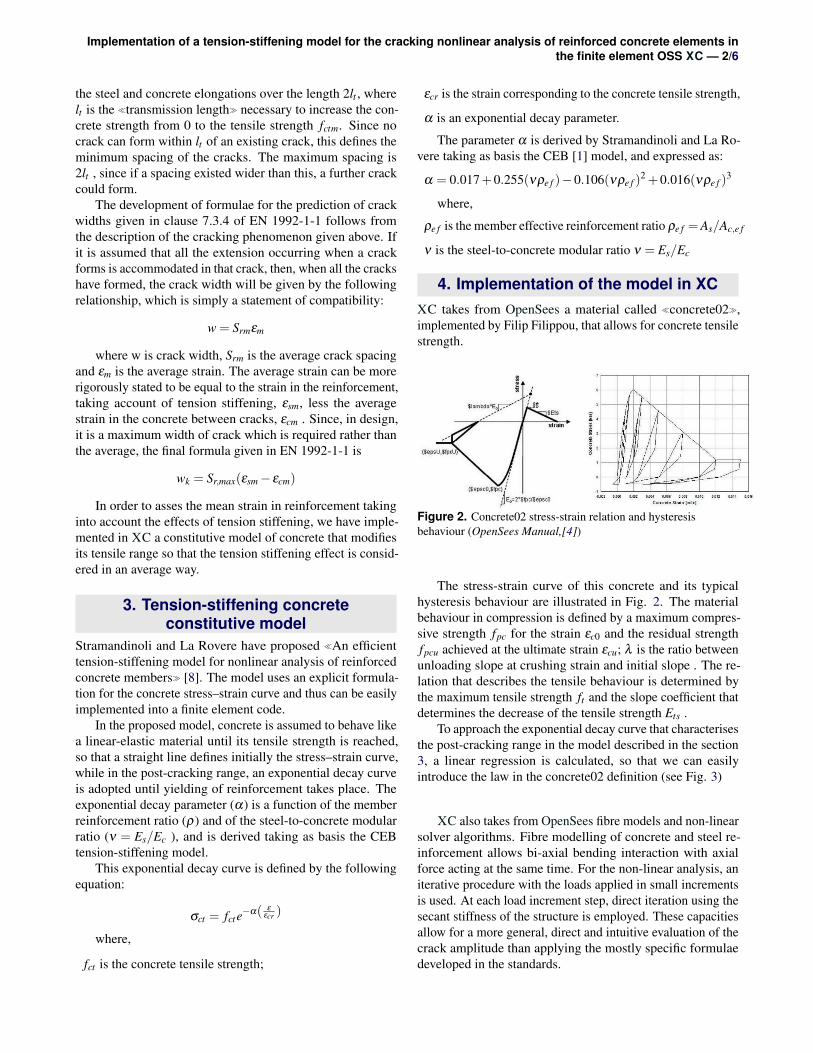
Figure 2. Concrete02 stress-strain relation and hysteresisbehaviour (OpenSees Manual,[4])
The stress-strain curve of this concrete and its typicalhysteresis behaviour are illustrated in Fig. 2. The materialbehaviour in compression is defined by a maximum compres-sive strength fpc for the strain εc0 and the residual strengthfpcu achieved at the ultimate strain εcu; λ is the ratio betweenunloading slope at crushing strain and initial slope . The re-lation that describes the tensile behaviour is determined bythe maximum tensile strength ft and the slope coefficient thatdetermines the decrease of the tensile strength Ets .
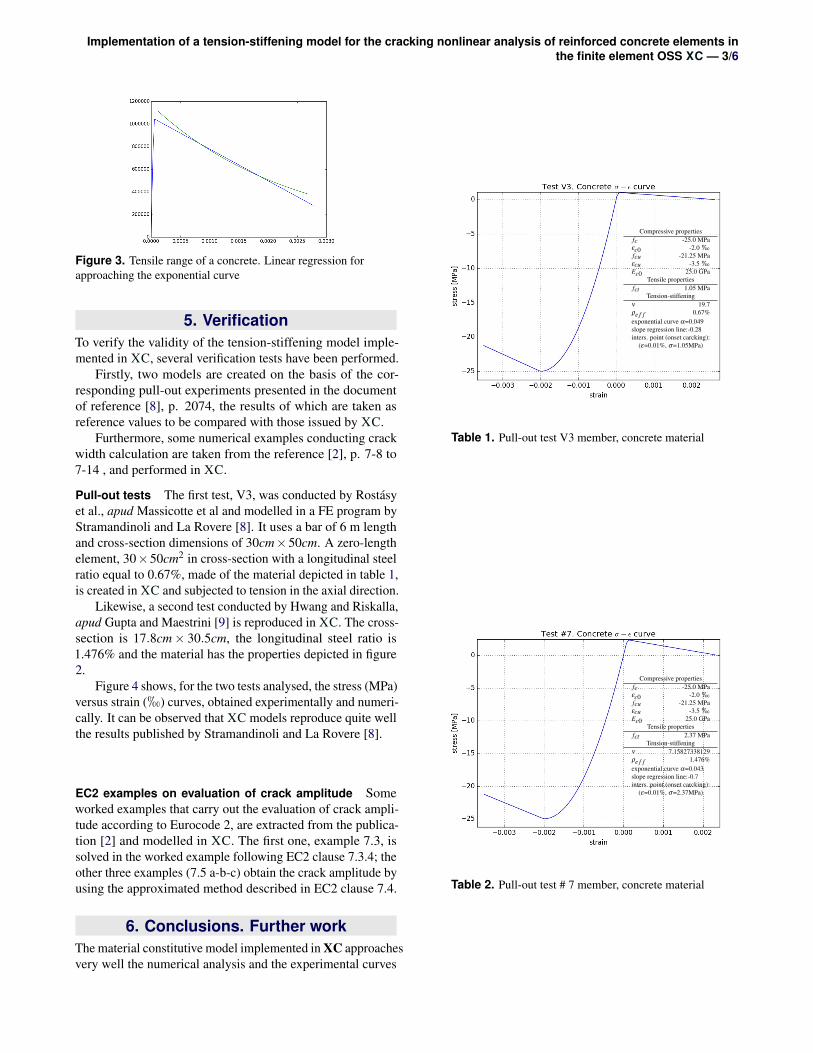
To approach the exponential decay curve that characterisesthe post-cracking range in the model described in the section3, a linear regression is calculated, so that we can easilyintroduce the law in the concrete02 definition (see Fig. 3)
XC also takes from OpenSees fibre models and non-linearsolver algorithms. Fibre modelling of concrete and steel re-inforcement allows bi-axial bending interaction with axialforce acting at the same time. For the non-linear analysis, aniterative procedure with the loads applied in small incrementsis used. At each load increment step, direct iteration using thesecant stiffness of the structure is employed. These capacitiesallow for a more general, direct and intuitive evaluation of thecrack amplitude than applying the mostly specific formulaedeveloped in the standards.
Implementation of a tension-stiffening model for the cracking nonlinear analysis of reinforced concrete elements inthe finite element OSS XC — 3/6
Figure 3. Tensile range of a concrete. Linear regression forapproaching the exponential curve
5. VerificationTo verify the validity of the tension-stiffening model imple-mented in XC, several verification tests have been performed.
Firstly, two models are created on the basis of the cor-responding pull-out experiments presented in the documentof reference [8], p. 2074, the results of which are taken asreference values to be compared with those issued by XC.
Furthermore, some numerical examples conducting crackwidth calculation are taken from the reference [2], p. 7-8 to7-14 , and performed in XC.
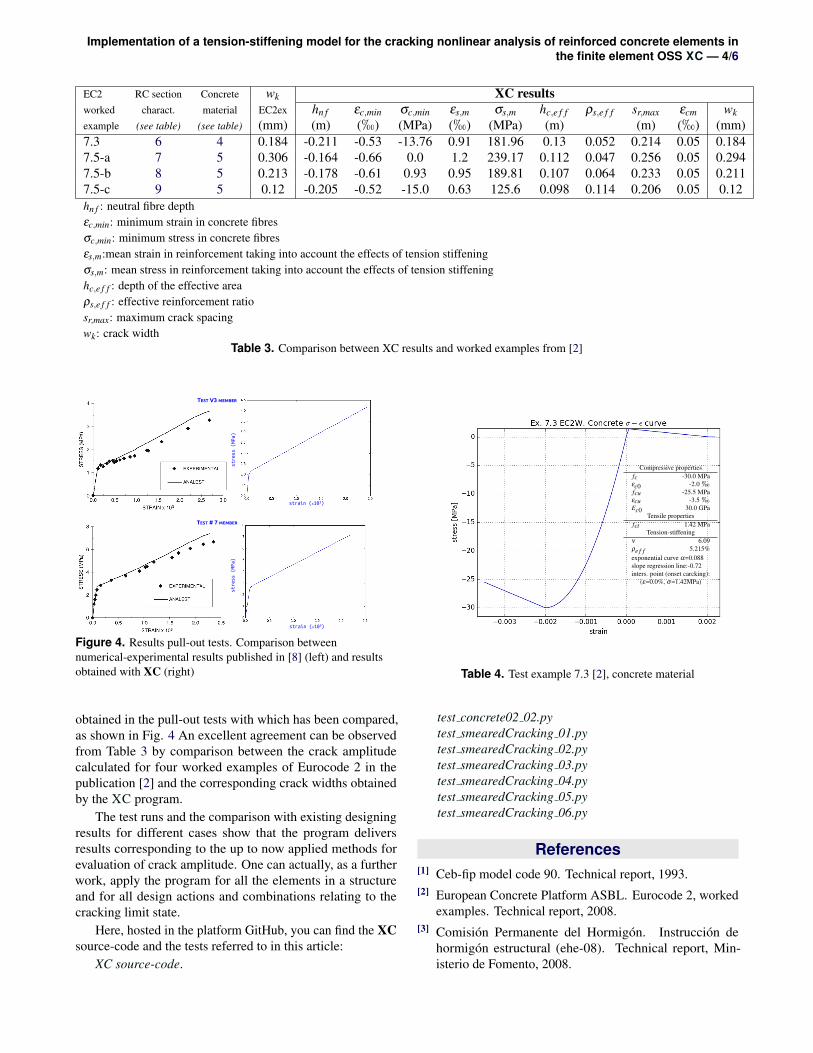
Pull-out tests The first test, V3, was conducted by Rostasyet al., apud Massicotte et al and modelled in a FE program byStramandinoli and La Rovere [8]. It uses a bar of 6 m lengthand cross-section dimensions of 30cm×50cm. A zero-lengthelement, 30×50cm2 in cross-section with a longitudinal steelratio equal to 0.67%, made of the material depicted in table 1,is created in XC and subjected to tension in the axial direction.
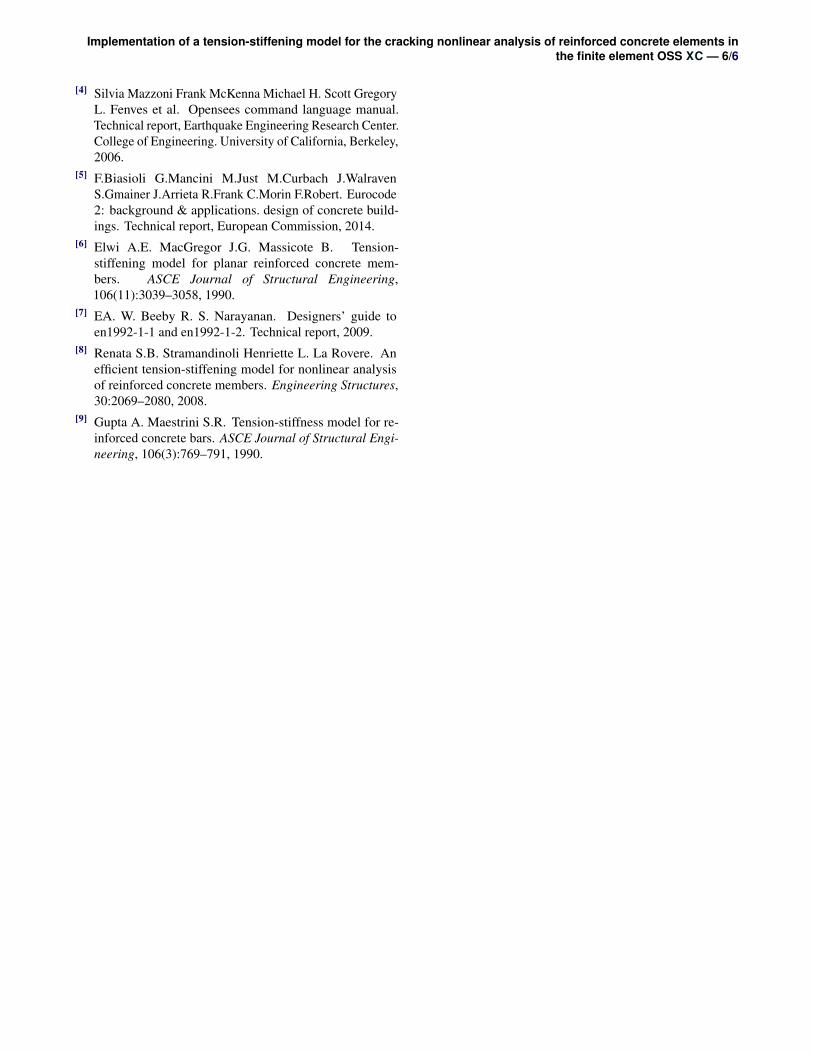
Likewise, a second test conducted by Hwang and Riskalla,apud Gupta and Maestrini [9] is reproduced in XC. The cross-section is 17.8cm × 30.5cm, the longitudinal steel ratio is1.476% and the material has the properties depicted in figure2.
Figure 4 shows, for the two tests analysed, the stress (MPa)versus strain (h) curves, obtained experimentally and numeri-cally. It can be observed that XC models reproduce quite wellthe results published by Stramandinoli and La Rovere [8].
EC2 examples on evaluation of crack amplitude Someworked examples that carry out the evaluation of crack ampli-tude according to Eurocode 2, are extracted from the publica-tion [2] and modelled in XC. The first one, example 7.3, issolved in the worked example following EC2 clause 7.3.4; theother three examples (7.5 a-b-c) obtain the crack amplitude byusing the approximated method described in EC2 clause 7.4.
6. Conclusions. Further workThe material constitutive model implemented in XC approachesvery well the numerical analysis and the experimental curves
Compressive propertiesfc -25.0 MPaεc0 -2.0 hfcu -21.25 MPaεcu -3.5 hEc0 25.0 GPa
Tensile propertiesfct 1.05 MPa
Tension-stiffeningν 19.7ρe f f 0.67%exponential curve α=0.049slope regression line:-0.28inters. point (onset carcking):
(ε=0.01%, σ=1.05MPa)
Table 1. Pull-out test V3 member, concrete material
Compressive propertiesfc -25.0 MPaεc0 -2.0 hfcu -21.25 MPaεcu -3.5 hEc0 25.0 GPa
Tensile propertiesfct 2.37 MPa
Tension-stiffeningν 7.15827338129ρe f f 1.476%exponential curve α=0.043slope regression line:-0.7inters. point (onset carcking):
(ε=0.01%, σ=2.37MPa)
Table 2. Pull-out test # 7 member, concrete material
Implementation of a tension-stiffening model for the cracking nonlinear analysis of reinforced concrete elements inthe finite element OSS XC — 4/6
EC2 RC section Concrete wk XC resultsworked charact. material EC2ex hn f εc,min σc,min εs,m σs,m hc,e f f ρs,e f f sr,max εcm wkexample (see table) (see table) (mm) (m) (h) (MPa) (h) (MPa) (m) (m) (h) (mm)7.3 6 4 0.184 -0.211 -0.53 -13.76 0.91 181.96 0.13 0.052 0.214 0.05 0.1847.5-a 7 5 0.306 -0.164 -0.66 0.0 1.2 239.17 0.112 0.047 0.256 0.05 0.2947.5-b 8 5 0.213 -0.178 -0.61 0.93 0.95 189.81 0.107 0.064 0.233 0.05 0.2117.5-c 9 5 0.12 -0.205 -0.52 -15.0 0.63 125.6 0.098 0.114 0.206 0.05 0.12hn f : neutral fibre depthεc,min: minimum strain in concrete fibresσc,min: minimum stress in concrete fibresεs,m:mean strain in reinforcement taking into account the effects of tension stiffeningσs,m: mean stress in reinforcement taking into account the effects of tension stiffeninghc,e f f : depth of the effective areaρs,e f f : effective reinforcement ratiosr,max: maximum crack spacingwk: crack width
Table 3. Comparison between XC results and worked examples from [2]
stress
(MPa)
strain ( x103)
strain ( x103)
stress
(MPa)
TEST # 7 MEMBER
TEST V3 MEMBER
Figure 4. Results pull-out tests. Comparison betweennumerical-experimental results published in [8] (left) and resultsobtained with XC (right)
obtained in the pull-out tests with which has been compared,as shown in Fig. 4 An excellent agreement can be observedfrom Table 3 by comparison between the crack amplitudecalculated for four worked examples of Eurocode 2 in thepublication [2] and the corresponding crack widths obtainedby the XC program.
The test runs and the comparison with existing designingresults for different cases show that the program deliversresults corresponding to the up to now applied methods forevaluation of crack amplitude. One can actually, as a furtherwork, apply the program for all the elements in a structureand for all design actions and combinations relating to thecracking limit state.
Here, hosted in the platform GitHub, you can find the XCsource-code and the tests referred to in this article:
XC source-code.
Compressive propertiesfc -30.0 MPaεc0 -2.0 hfcu -25.5 MPaεcu -3.5 hEc0 30.0 GPa
Tensile propertiesfct 1.42 MPa
Tension-stiffeningν 6.09ρe f f 5.215%exponential curve α=0.088slope regression line:-0.72inters. point (onset carcking):
(ε=0.0%, σ=1.42MPa)
Table 4. Test example 7.3 [2], concrete material
test concrete02 02.pytest smearedCracking 01.pytest smearedCracking 02.pytest smearedCracking 03.pytest smearedCracking 04.pytest smearedCracking 05.pytest smearedCracking 06.py
References[1] Ceb-fip model code 90. Technical report, 1993.[2] European Concrete Platform ASBL. Eurocode 2, worked
examples. Technical report, 2008.[3] Comision Permanente del Hormigon. Instruccion de
hormigon estructural (ehe-08). Technical report, Min-isterio de Fomento, 2008.

Implementation of a tension-stiffening model for the cracking nonlinear analysis of reinforced concrete elements inthe finite element OSS XC — 5/6
Compressive propertiesfc -33.0 MPaεc0 -2.0 hfcu -28.05 MPaεcu -3.5 hEc0 33.0 GPa
Tensile propertiesfct 1.55 MPa
Tension-stiffeningν 5.95ρe f f 4.74%exponential curve α=0.081slope regression line:-0.77inters. point (onset carcking):
(ε=0.0%, σ=1.55MPa)
Table 5. Tests example 7.5 [2], concrete material
example 7.3 EC2WTest example 7.3 EC2 Worked examples. Section definition
width:b = 0.40 mdepth:h = 0.60 m
Materials - mechanical properties:Concrete: C30-37 Modulus of elasticity: Ec = 32.84 GPaSteel: S450C Modulus of elasticity: Es = 200.00 GPa
Sections - geometric and mechanical characteristics:Gross section:
Agross = 0.240 m2
Inertia tensor (cm4):
75.26 0.00 0.000.00 72.00 0.000.00 0.00 32.00
C.O.G.: (0.000,0.000) m
Homogenized section:Ahomog. = 0.261 m2
Inertia tensor (cm4):
75.26 0.00 0.000.00 84.55 0.000.00 0.00 34.25
C.O.G.: (0.000,−0.014) m
Passive reinforcement:Total area As = 31.67 cm2 Geometric quantity ρ = 13.19h
Layers of main reinforcement:Id No bars φ area c. geom. eff. cover yCOG zCOG
(mm) (cm2) (h) (cm) (m) (m)
6 0.0 4.52 1.88 5.2 0.000 -0.2484 0.0 1.13 0.47 4.6 0.000 0.254
Table 6. Test example 7.3 EC2 Worked examples. Sectiondefinition (example 7.3 EC2W).
example 7.5 EC2W 0.3mmTest example 7.5 EC2 Worked examples - wk ≈ 0.3mm. Section definition
width:b = 1.00 mdepth:h = 0.50 m
Materials - mechanical properties:Concrete: C33 Modulus of elasticity: Ec = 33.59 GPaSteel: S450C Modulus of elasticity: Es = 200.00 GPa
Sections - geometric and mechanical characteristics:Gross section:
Agross = 0.500 m2
Inertia tensor (cm4):
2290.00 0.00 0.000.00 104.17 0.000.00 0.00 416.67
C.O.G.: (0.000,0.000) m
Homogenized section:Ahomog. = 0.532 m2
Inertia tensor (cm4):
2290.00 0.00 0.000.00 114.75 0.000.00 0.00 442.87
C.O.G.: (−0.000,−0.011) m
Passive reinforcement:Total area As = 53.09 cm2 Geometric quantity ρ = 10.62h
Layers of main reinforcement:Id No bars φ area c. geom. eff. cover yCOG zCOG
(mm) (cm2) (h) (cm) (m) (m)
10 0.0 5.31 1.06 5.3 -0.000 -0.187
Table 7. Test example 7.5 EC2 Worked examples - wk ≈ 0.3mm.Section definition (example 7.5 EC2W 0.3mm).
example 7.5 EC2W 0.2mmTest example 7.5 EC2 Worked examples - wk ≈ 0.2mm. Section definition
width:b = 1.00 mdepth:h = 0.50 m
Materials - mechanical properties:Concrete: C33 Modulus of elasticity: Ec = 33.59 GPaSteel: S450C Modulus of elasticity: Es = 200.00 GPa
Sections - geometric and mechanical characteristics:Gross section:
Agross = 0.500 m2
Inertia tensor (cm4):
2290.00 0.00 0.000.00 104.17 0.000.00 0.00 416.67
C.O.G.: (0.000,0.000) m
Homogenized section:Ahomog. = 0.542 m2
Inertia tensor (cm4):
2290.00 0.00 0.000.00 117.68 0.000.00 0.00 449.19
C.O.G.: (−0.000,−0.014) m
Passive reinforcement:Total area As = 69.02 cm2 Geometric quantity ρ = 13.80h
Layers of main reinforcement:Id No bars φ area c. geom. eff. cover yCOG zCOG
(mm) (cm2) (h) (cm) (m) (m)
13 0.0 5.31 1.06 5.3 -0.000 -0.187
Table 8. Test example 7.5 EC2 Worked examples - wk ≈ 0.2mm.Section definition (example 7.5 EC2W 0.2mm).
example 7.5 EC2W 0.1mmTest example 7.5 EC2 Worked examples - wk ≈ 0.1mm. Section definition
width:b = 1.00 mdepth:h = 0.50 m
Materials - mechanical properties:Concrete: C33 Modulus of elasticity: Ec = 33.59 GPaSteel: S450C Modulus of elasticity: Es = 200.00 GPa
Sections - geometric and mechanical characteristics:Gross section:
Agross = 0.500 m2
Inertia tensor (cm4):
2290.00 0.00 0.000.00 104.17 0.000.00 0.00 416.67
C.O.G.: (0.000,0.000) m
Homogenized section:Ahomog. = 0.568 m2
Inertia tensor (cm4):
2290.00 0.00 0.000.00 125.01 −0.000.00 −0.00 466.20
C.O.G.: (0.000,−0.022) m
Passive reinforcement:Total area As = 111.50 cm2 Geometric quantity ρ = 22.30h
Layers of main reinforcement:Id No bars φ area c. geom. eff. cover yCOG zCOG
(mm) (cm2) (h) (cm) (m) (m)
21 0.0 5.31 1.06 5.3 0.000 -0.187
Table 9. Test example 7.5 EC2 Worked examples - wk ≈ 0.1mm.Section definition (example 7.5 EC2W 0.1mm).
Implementation of a tension-stiffening model for the cracking nonlinear analysis of reinforced concrete elements inthe finite element OSS XC — 6/6
[4] Silvia Mazzoni Frank McKenna Michael H. Scott GregoryL. Fenves et al. Opensees command language manual.Technical report, Earthquake Engineering Research Center.College of Engineering. University of California, Berkeley,2006.
[5] F.Biasioli G.Mancini M.Just M.Curbach J.WalravenS.Gmainer J.Arrieta R.Frank C.Morin F.Robert. Eurocode2: background & applications. design of concrete build-ings. Technical report, European Commission, 2014.
[6] Elwi A.E. MacGregor J.G. Massicote B. Tension-stiffening model for planar reinforced concrete mem-bers. ASCE Journal of Structural Engineering,106(11):3039–3058, 1990.
[7] EA. W. Beeby R. S. Narayanan. Designers’ guide toen1992-1-1 and en1992-1-2. Technical report, 2009.
[8] Renata S.B. Stramandinoli Henriette L. La Rovere. Anefficient tension-stiffening model for nonlinear analysisof reinforced concrete members. Engineering Structures,30:2069–2080, 2008.
[9] Gupta A. Maestrini S.R. Tension-stiffness model for re-inforced concrete bars. ASCE Journal of Structural Engi-neering, 106(3):769–791, 1990.