Implementation Completion and Results Report...
61
Document of The World Bank FOR OFFICIAL USE ONLY Report No: ICR00004662 IMPLEMENTATION COMPLETION AND RESULTS REPORT 7816-IN ON A LOAN IN THE AMOUNT OF US$ 300 MILLION EQUIVALENT (INR 20,673 MILLION EQUIVALENT) TO THE Republic of India FOR THE ANDHRA PRADESH AND TELANGANA MUNICIPAL DEVELOPMENT PROJECT June 20, 2019 Social, Urban, Rural And Resilience Global Practice South Asia Region Public Disclosure Authorized Public Disclosure Authorized Public Disclosure Authorized Public Disclosure Authorized
Transcript of Implementation Completion and Results Report...
Document of
The World Bank FOR OFFICIAL USE ONLY
Report No: ICR00004662
IMPLEMENTATION COMPLETION AND RESULTS REPORT
7816-IN
ON A
LOAN
IN THE AMOUNT OF US$ 300 MILLION EQUIVALENT
(INR 20,673 MILLION EQUIVALENT)
TO THE
Republic of India
FOR THE
ANDHRA PRADESH AND TELANGANA MUNICIPAL DEVELOPMENT PROJECT
June 20, 2019
Social, Urban, Rural And Resilience Global Practice South Asia Region
Pub
lic D
iscl
osur
e A
utho
rized
Pub
lic D
iscl
osur
e A
utho
rized
Pub
lic D
iscl
osur
e A
utho
rized
Pub
lic D
iscl
osur
e A
utho
rized
CURRENCY EQUIVALENTS
(Exchange Rate Effective May 31, 2019)
Currency Unit = Indian Rupee (INR)
INR70 = US$1
US$1 = INR0.15
FISCAL YEAR
July 1 - June 30
Regional Vice President: Hartwig Schafer
Country Director: Junaid Kamal Ahmad
Senior Global Practice Director: Ede Jorge Ijjasz-Vasquez
Practice Manager: Catalina Marulanda
Task Team Leader: Raghu Kesavan
ICR Main Contributor: Jessica Schmidt
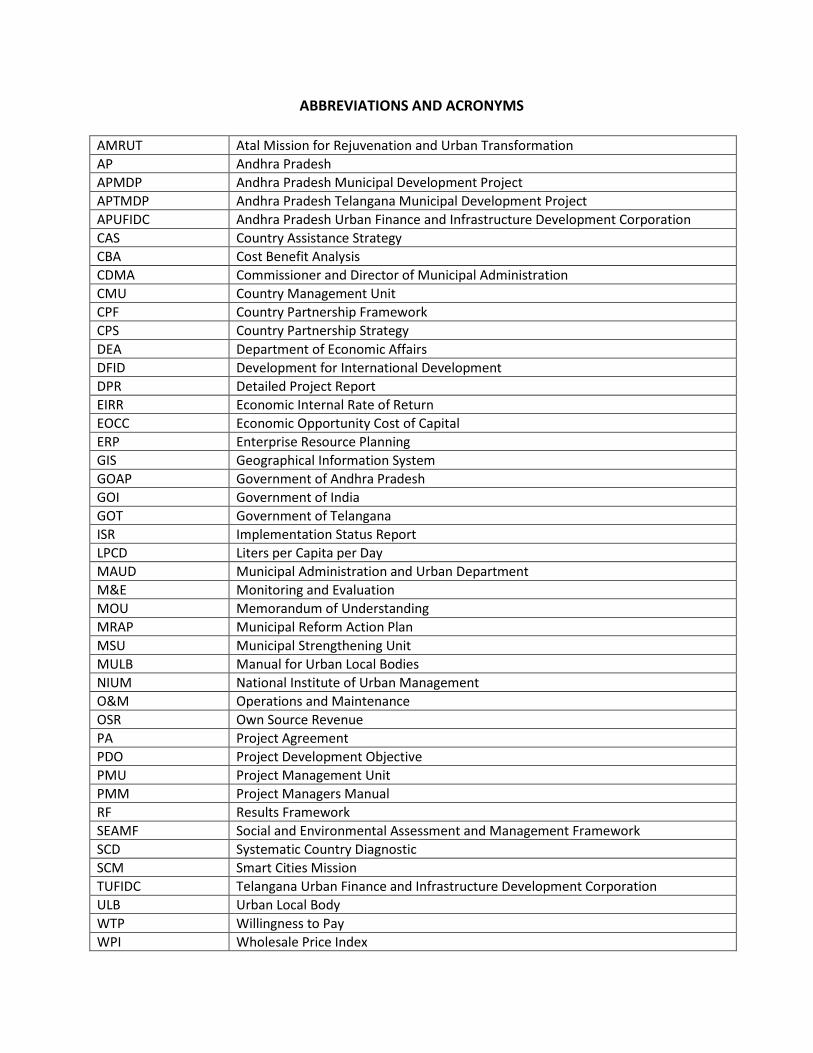
ABBREVIATIONS AND ACRONYMS AMRUT Atal Mission for Rejuvenation and Urban Transformation AP Andhra Pradesh APMDP Andhra Pradesh Municipal Development Project APTMDP Andhra Pradesh Telangana Municipal Development Project APUFIDC Andhra Pradesh Urban Finance and Infrastructure Development Corporation CAS Country Assistance Strategy CBA Cost Benefit Analysis CDMA Commissioner and Director of Municipal Administration CMU Country Management Unit CPF Country Partnership Framework CPS Country Partnership Strategy DEA Department of Economic Affairs DFID Development for International Development DPR Detailed Project Report EIRR Economic Internal Rate of Return EOCC Economic Opportunity Cost of Capital ERP Enterprise Resource Planning GIS Geographical Information System GOAP Government of Andhra Pradesh GOI Government of India GOT Government of Telangana ISR Implementation Status Report LPCD Liters per Capita per Day MAUD Municipal Administration and Urban Department M&E Monitoring and Evaluation MOU Memorandum of Understanding MRAP Municipal Reform Action Plan MSU Municipal Strengthening Unit MULB Manual for Urban Local Bodies NIUM National Institute of Urban Management O&M Operations and Maintenance OSR Own Source Revenue PA Project Agreement PDO Project Development Objective PMU Project Management Unit PMM Project Managers Manual RF Results Framework SEAMF Social and Environmental Assessment and Management Framework SCD Systematic Country Diagnostic SCM Smart Cities Mission TUFIDC Telangana Urban Finance and Infrastructure Development Corporation ULB Urban Local Body WTP Willingness to Pay WPI Wholesale Price Index
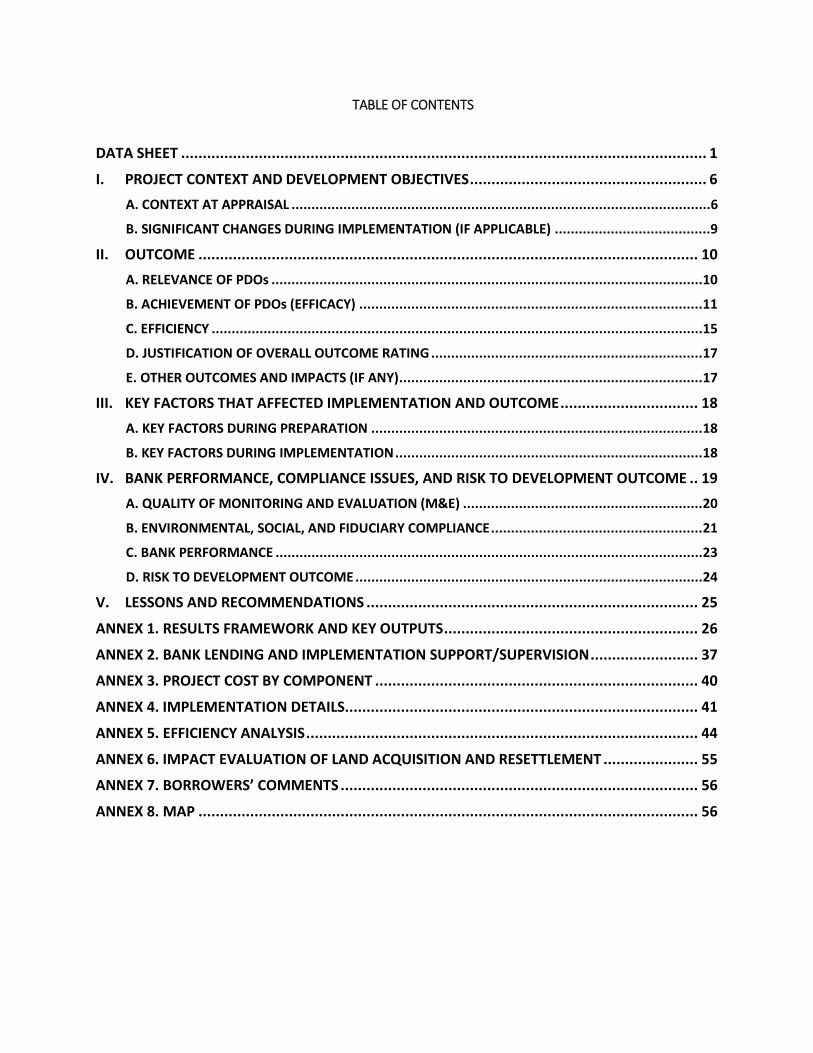
TABLE OF CONTENTS
DATA SHEET .......................................................................................................................... 1
I. PROJECT CONTEXT AND DEVELOPMENT OBJECTIVES ....................................................... 6
A. CONTEXT AT APPRAISAL .........................................................................................................6
B. SIGNIFICANT CHANGES DURING IMPLEMENTATION (IF APPLICABLE) .......................................9
II. OUTCOME .................................................................................................................... 10
A. RELEVANCE OF PDOs ............................................................................................................ 10
B. ACHIEVEMENT OF PDOs (EFFICACY) ...................................................................................... 11
C. EFFICIENCY ........................................................................................................................... 15
D. JUSTIFICATION OF OVERALL OUTCOME RATING .................................................................... 17
E. OTHER OUTCOMES AND IMPACTS (IF ANY) ............................................................................ 17
III. KEY FACTORS THAT AFFECTED IMPLEMENTATION AND OUTCOME ................................ 18
A. KEY FACTORS DURING PREPARATION ................................................................................... 18
B. KEY FACTORS DURING IMPLEMENTATION ............................................................................. 18
IV. BANK PERFORMANCE, COMPLIANCE ISSUES, AND RISK TO DEVELOPMENT OUTCOME .. 19
A. QUALITY OF MONITORING AND EVALUATION (M&E) ............................................................ 20
B. ENVIRONMENTAL, SOCIAL, AND FIDUCIARY COMPLIANCE ..................................................... 21
C. BANK PERFORMANCE ........................................................................................................... 23
D. RISK TO DEVELOPMENT OUTCOME ....................................................................................... 24
V. LESSONS AND RECOMMENDATIONS ............................................................................. 25
ANNEX 1. RESULTS FRAMEWORK AND KEY OUTPUTS ........................................................... 26
ANNEX 2. BANK LENDING AND IMPLEMENTATION SUPPORT/SUPERVISION ......................... 37
ANNEX 3. PROJECT COST BY COMPONENT ........................................................................... 40
ANNEX 4. IMPLEMENTATION DETAILS .................................................................................. 41
ANNEX 5. EFFICIENCY ANALYSIS ........................................................................................... 44
ANNEX 6. IMPACT EVALUATION OF LAND ACQUISITION AND RESETTLEMENT ...................... 55
ANNEX 7. BORROWERS’ COMMENTS ................................................................................... 56
ANNEX 8. MAP .................................................................................................................... 56
The World Bank ANDHRA PRADESH AND TELANGANA MUNICIPAL DEVELOPMENT PROJECT (P071250)
Page 1 of 57
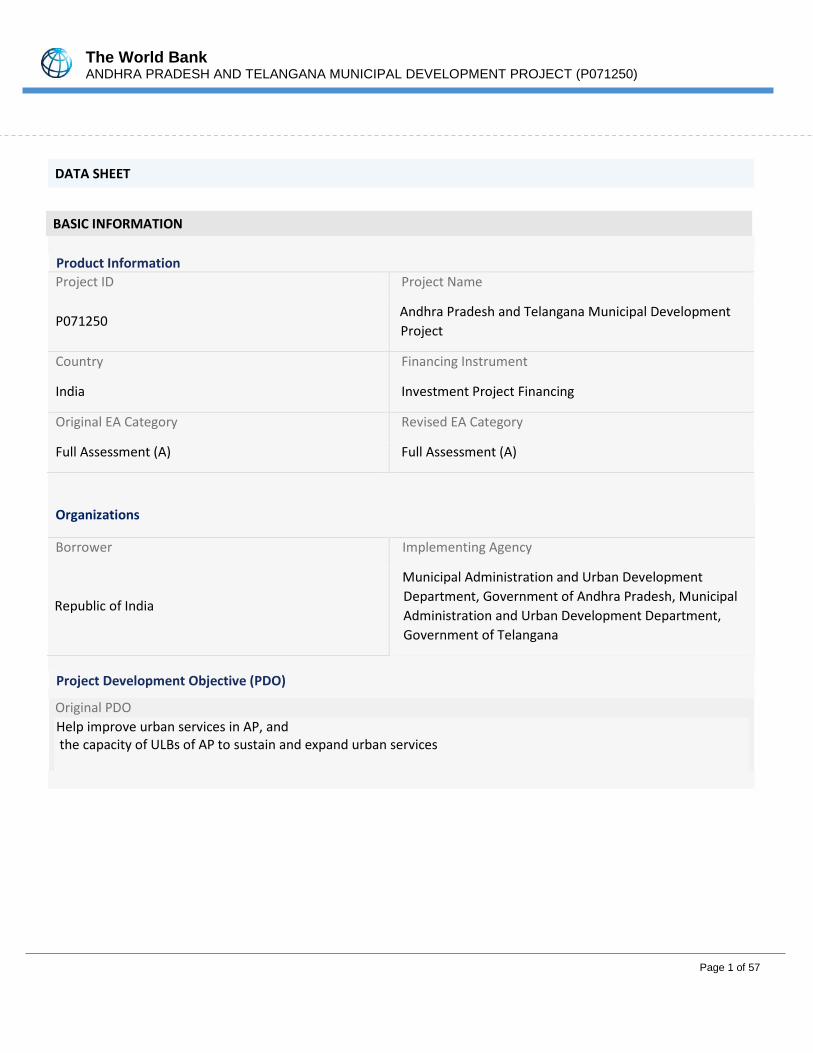
DATA SHEET
BASIC INFORMATION Product Information Project ID Project Name
P071250 Andhra Pradesh and Telangana Municipal Development Project
Country Financing Instrument
India Investment Project Financing
Original EA Category Revised EA Category
Full Assessment (A) Full Assessment (A)
Organizations
Borrower Implementing Agency
Republic of India
Municipal Administration and Urban Development Department, Government of Andhra Pradesh, Municipal Administration and Urban Development Department, Government of Telangana
Project Development Objective (PDO)
Original PDO Help improve urban services in AP, and the capacity of ULBs of AP to sustain and expand urban services
The World Bank ANDHRA PRADESH AND TELANGANA MUNICIPAL DEVELOPMENT PROJECT (P071250)
Page 2 of 57
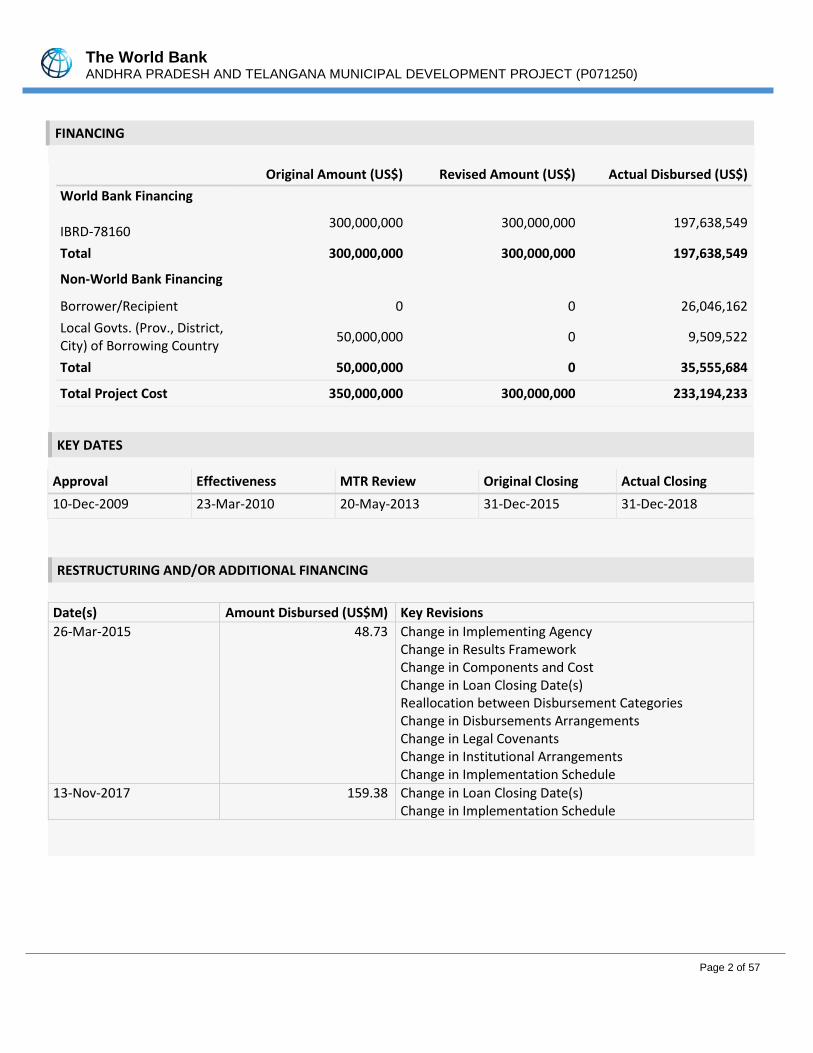
FINANCING
Original Amount (US$) Revised Amount (US$) Actual Disbursed (US$) World Bank Financing IBRD-78160 300,000,000 300,000,000 197,638,549
Total 300,000,000 300,000,000 197,638,549
Non-World Bank Financing 0 0 0
Borrower/Recipient 0 0 26,046,162 Local Govts. (Prov., District, City) of Borrowing Country 50,000,000 0 9,509,522
Total 50,000,000 0 35,555,684
Total Project Cost 350,000,000 300,000,000 233,194,233
KEY DATES
Approval Effectiveness MTR Review Original Closing Actual Closing 10-Dec-2009 23-Mar-2010 20-May-2013 31-Dec-2015 31-Dec-2018
RESTRUCTURING AND/OR ADDITIONAL FINANCING
Date(s) Amount Disbursed (US$M) Key Revisions 26-Mar-2015 48.73 Change in Implementing Agency
Change in Results Framework Change in Components and Cost Change in Loan Closing Date(s) Reallocation between Disbursement Categories Change in Disbursements Arrangements Change in Legal Covenants Change in Institutional Arrangements Change in Implementation Schedule
13-Nov-2017 159.38 Change in Loan Closing Date(s) Change in Implementation Schedule

The World Bank ANDHRA PRADESH AND TELANGANA MUNICIPAL DEVELOPMENT PROJECT (P071250)
Page 3 of 57
KEY RATINGS
Outcome Bank Performance M&E Quality
Moderately Satisfactory Moderately Satisfactory Modest
RATINGS OF PROJECT PERFORMANCE IN ISRs
No. Date ISR Archived DO Rating IP Rating Actual
Disbursements (US$M)
01 17-May-2010 Satisfactory Satisfactory 20.00
02 12-Dec-2010 Satisfactory Satisfactory 20.18
03 27-Jun-2011 Satisfactory Satisfactory 21.48
04 14-Dec-2011 Satisfactory Satisfactory 22.06
05 31-May-2012 Satisfactory Satisfactory 22.77
06 22-Dec-2012 Satisfactory Moderately Satisfactory 23.01
07 13-Mar-2013 Moderately Satisfactory Moderately Unsatisfactory 23.38
08 27-Sep-2013 Moderately Satisfactory Moderately Unsatisfactory 38.15
09 10-Mar-2014 Moderately Satisfactory Moderately Unsatisfactory 41.01
10 15-Sep-2014 Moderately Satisfactory Moderately Unsatisfactory 48.73
11 25-Apr-2015 Moderately Satisfactory Moderately Unsatisfactory 51.65
12 23-Jun-2015 Moderately Satisfactory Moderately Unsatisfactory 65.66
13 30-Dec-2015 Moderately Satisfactory Moderately Unsatisfactory 90.61
14 05-May-2016 Moderately Satisfactory Moderately Satisfactory 115.68
15 11-Oct-2016 Moderately Satisfactory Moderately Satisfactory 122.10
16 07-Jun-2017 Moderately Satisfactory Moderately Satisfactory 152.58
17 03-Nov-2017 Moderately Satisfactory Moderately Satisfactory 158.51
18 27-Apr-2018 Moderately Satisfactory Moderately Unsatisfactory 171.87
19 03-Jan-2019 Moderately Satisfactory Moderately Unsatisfactory 185.11
The World Bank ANDHRA PRADESH AND TELANGANA MUNICIPAL DEVELOPMENT PROJECT (P071250)
Page 4 of 57
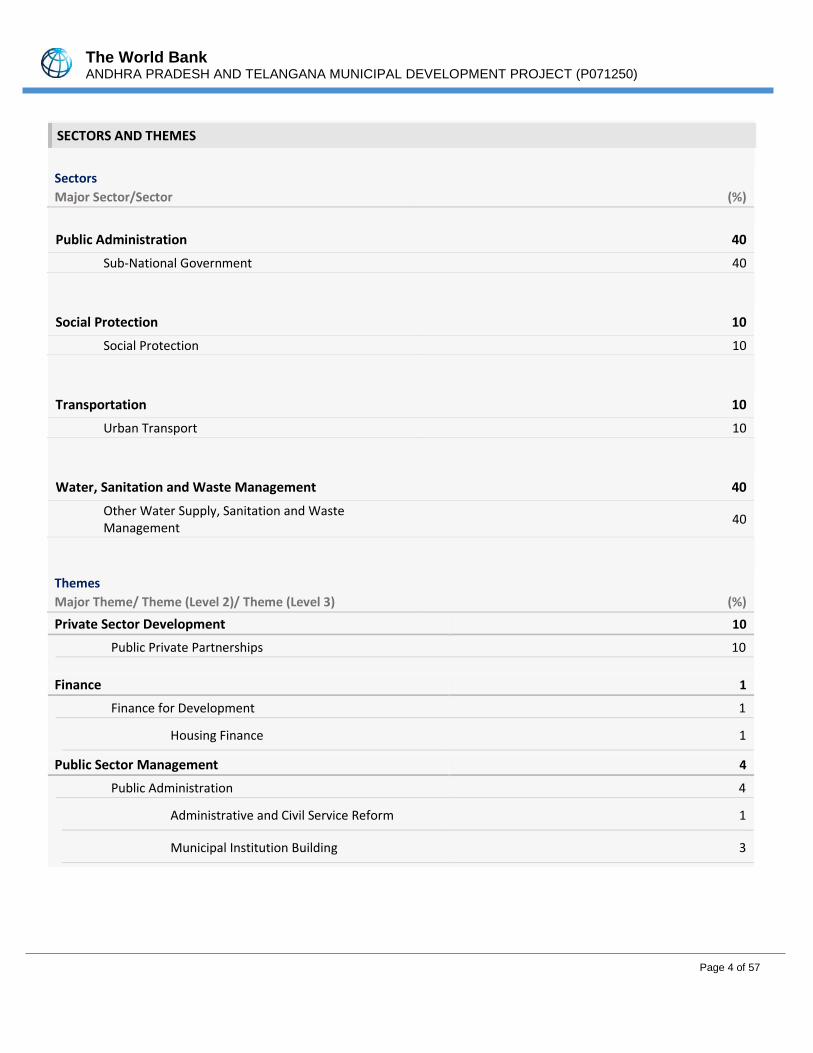
SECTORS AND THEMES
Sectors Major Sector/Sector (%)
Public Administration 40
Sub-National Government 40 Social Protection 10
Social Protection 10 Transportation 10
Urban Transport 10 Water, Sanitation and Waste Management 40
Other Water Supply, Sanitation and Waste Management 40
Themes Major Theme/ Theme (Level 2)/ Theme (Level 3) (%) Private Sector Development 10
Public Private Partnerships 10
Finance 1
Finance for Development 1 Housing Finance 1
Public Sector Management 4
Public Administration 4 Administrative and Civil Service Reform 1
Municipal Institution Building 3
The World Bank ANDHRA PRADESH AND TELANGANA MUNICIPAL DEVELOPMENT PROJECT (P071250)
Page 5 of 57
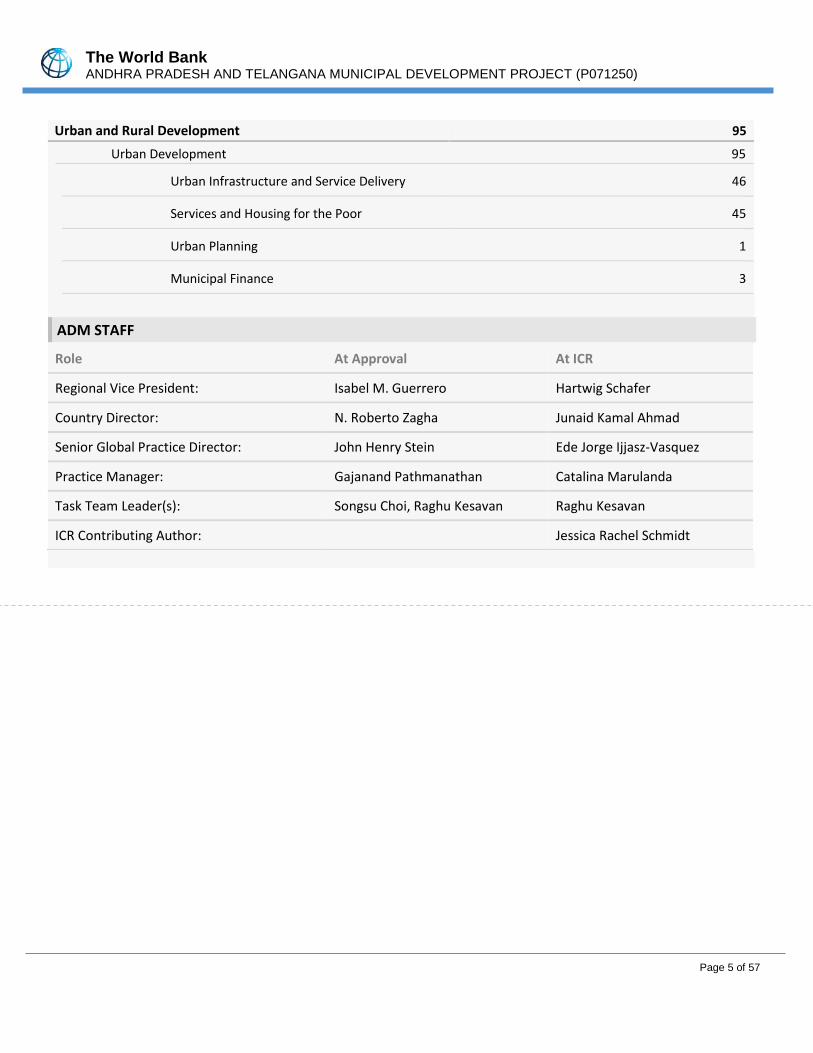
Urban and Rural Development 95 Urban Development 95
Urban Infrastructure and Service Delivery 46
Services and Housing for the Poor 45
Urban Planning 1
Municipal Finance 3
ADM STAFF
Role At Approval At ICR
Regional Vice President: Isabel M. Guerrero Hartwig Schafer
Country Director: N. Roberto Zagha Junaid Kamal Ahmad
Senior Global Practice Director: John Henry Stein Ede Jorge Ijjasz-Vasquez
Practice Manager: Gajanand Pathmanathan Catalina Marulanda
Task Team Leader(s): Songsu Choi, Raghu Kesavan Raghu Kesavan
ICR Contributing Author: Jessica Rachel Schmidt
The World Bank ANDHRA PRADESH AND TELANGANA MUNICIPAL DEVELOPMENT PROJECT (P071250)
Page 6 of 57
I. PROJECT CONTEXT AND DEVELOPMENT OBJECTIVES
A. CONTEXT AT APPRAISAL 1. India was on a high economic growth trajectory at appraisal, following two decades of economic reforms, but many cities continued to struggle with service provision. Economic growth in India was accompanied by corresponding increases in spending on health, education, drinking water, sanitation, rural and urban infrastructure, and employment programs. However, progress improving urban service delivery was limited. Cities struggled with inadequate levels of basic services, coupled with the pressure of the increasing pace of urbanization. Overall, local level service delivery remained poor, and improvements were not commensurate with the levels of public expenditures. 2. In 2009, Andhra Pradesh (AP), with a population of 76 million1, was India’s fifth most populous state. The urban population was 21 million, with over 70 percent of the population living in 44 cities of more than 100,000 residents. Urban economic growth had accelerated, and the number of urban centers had increased from 210 in 2001 to 353. However, provision of urban services such as roads, water, and sanitation had fallen behind growing demand. The piped water coverage ratio had declined by over 10 percent in AP cities between 1991 and 2001, and municipal sewerage systems served fewer than 20 percent of residents. These service deficiencies were partly due to AP’s climate and geography (e.g., low rainfall) but were largely a result of inadequate local financial and managerial capacity.
3. The 73rd and 74th Constitutional Amendments gave constitutional recognition to Urban Local Bodies (ULBs) and provided a basis for the State Legislatures to transfer responsibilities to ULBs. At appraisal, own source revenues (OSRs) of AP ULBs represented less than 1 percent of estimated value. ULBs were typically responsible for urban planning, water supply for domestic, industrial, and commercial purposes, and provision of urban amenities and public facilities. Property taxes and water tariffs were ULBs’ two main sources of revenue.
4. The Andhra Pradesh Municipal Development Project (APMDP, “the Project”) was well aligned with the
Government of India’s (GoI) 10th (2002-2007) and 11th Five-Year Plans (2007-2012), which for the first time highlighted urban infrastructure and management as a key national development priority. The Swajaldhara Program, which advocated for decentralization of water and sanitation functions under the oversight of the District Water and Sanitation Mission, was announced in 2002. In 2005, the Jawaharlal Nehru National Urban Renewal Mission (JNNURM), which provided grants for urban infrastructure and housing while requiring state and local institutional reforms, was launched by GoI. The Mission became the country’s largest source of financing for urban infrastructure investments. At appraisal, 215 projects had been approved in AP under JNNURM, totaling US$103 billion of GoI funding for large-scale projects in the state’s three largest urban areas: Hyderabad, Visakhapatnam, and Vijayawada. 5. By supporting local infrastructure and service delivery needs, as well as the institutional arrangements for promoting an enabling environment for long term sustainability, the Project contributed directly to the World Bank Group’s India Country Assistance Strategy (CAS) for 2009-12. In line with India’s 11th Five-Year Plan’s goal of
1 Office of the Registrar General & Census Commissioner. (2001) Census of India.
The World Bank ANDHRA PRADESH AND TELANGANA MUNICIPAL DEVELOPMENT PROJECT (P071250)
Page 7 of 57
comprehensive growth and service delivery, the Bank’s CAS aimed at helping India meet the challenges of: (i) achieving rapid and inclusive growth; (ii) ensuring the sustainability of development; and (iii) increasing the effectiveness of public service delivery. The Project directly contributed to Pillars 1 and 3 and complemented ongoing assistance to AP focused on the development of institutions and infrastructure.2 6. An earlier version of the Project was negotiated in July 2005, but a condition for Board presentation – a repeal of the Urban Land Ceiling Act by the state legislature – was met only in March 2008. Project design was then updated to take account of subsequent developments, including JNNURM, AP’s recent urbanization and development, completion of the U.K. Development for International Development-funded (DFID) AP Urban Services for the Poor Project, and the Bank’s increased emphasis on governance and accountability. This also meant that the 30 percent of sub-project investments that were ready for award (a GoI condition for negotiations) in 2005 had to be substantially revised. At Board presentation, a framework approach was adopted, with the remaining 70 percent of investments to be identified during implementation.
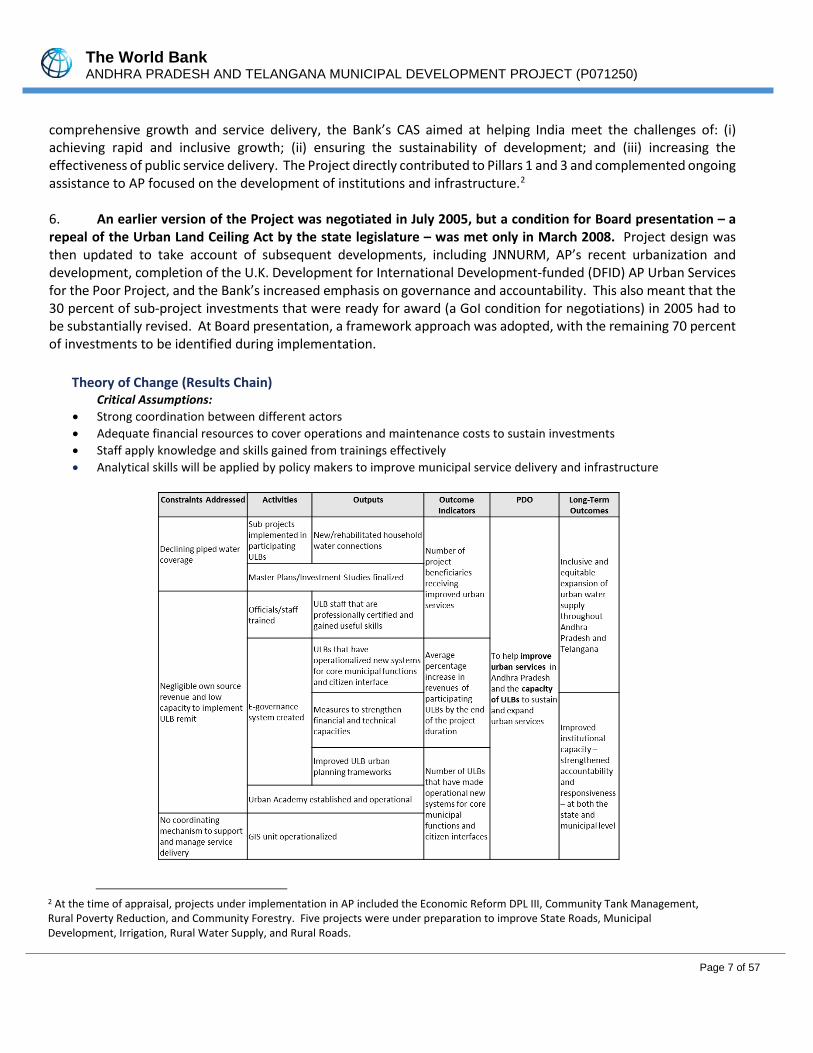
Theory of Change (Results Chain) Critical Assumptions:
• Strong coordination between different actors • Adequate financial resources to cover operations and maintenance costs to sustain investments • Staff apply knowledge and skills gained from trainings effectively • Analytical skills will be applied by policy makers to improve municipal service delivery and infrastructure
2 At the time of appraisal, projects under implementation in AP included the Economic Reform DPL III, Community Tank Management, Rural Poverty Reduction, and Community Forestry. Five projects were under preparation to improve State Roads, Municipal Development, Irrigation, Rural Water Supply, and Rural Roads.
The World Bank ANDHRA PRADESH AND TELANGANA MUNICIPAL DEVELOPMENT PROJECT (P071250)
Page 8 of 57
Project Development Objectives (PDOs) The original PDO was “to help improve urban services in Andhra Pradesh, and the capacity of ULBs to sustain and expand urban services.”
Key Expected Outcomes and Outcome Indicators The key outcome indicators included in the main text of the PAD were:
• Increase in residents’ satisfaction with municipal services in participating cities • Sub-project specific outcomes including the increase in hours of water supply per day, volume of liquid
or solid waste collected and sanitarily disposed of, number of water and sewer connections, and the number of people receiving significant such benefits
• Increase in ULB revenues • Number and quality of ULB service (assessment and plan) reports, signifying improvements in staff
capacity and systems 7. The Results Framework (RF) in Annex 3 of the PAD provided specific outcome indicators for each of the two PDO elements (i.e., improved urban services and improved capacity of ULBs), intermediate outcome indicators, and targets. The outcome indicators captured by the initial Implementation and Status Reports (ISR) measured: (i) residents’ satisfaction with urban services at participating ULBs; and (ii) revenue increases of participating ULBs, as sub-projects had not yet been identified. Intermediate indicators can be found in Annex 1.
Original Components as in the Loan Agreement 8. Component A: State Level Policy and Institutional Development Support (cost US$9.2 million, Bank financing US$ 8.8 million) (i) establishment of the Andhra Pradesh Urban Academy to provide monitoring, analysis, training and knowledge dissemination, related to urban development and management in AP to urban sector officials through the provision of works, goods, and technical assistance, and incremental costs financing; (ii) studies on urban finance, town planning procedures, and the implementation of programs of the Mission to Eliminate Poverty in Municipal Areas through the provision of technical assistance; and (iii) the establishment of a Geographic Information System (GIS) Cell to support the monitoring and planning of urban development through the provision of computer hardware and software and technical assistance. 9. Component B: Municipal Capacity Enhancement (cost US$14 million, Bank financing US$12.7 million) (i) enhancement of institutional capacity of ULBs in AP in the areas of urban finance, management, e-governance, development and planning, procurement, and engineering through the provision of training and technical assistance; and (ii) establishment of a program on GIS mapping and spatial planning through the provision of technical assistance. 10. Component C: Urban Infrastructure Investment (cost US$306 million, Bank financing US$259.7 million) financed sustainable, high-priority investments identified by ULBs through the provision of investment sub-loans, sub-grants, and technical assistance. To be eligible, ULBs had to demonstrate adequate financial capacity to sustainably finance and operate the facilities and an adequate plan to improve their financial and management capacity.
The World Bank ANDHRA PRADESH AND TELANGANA MUNICIPAL DEVELOPMENT PROJECT (P071250)
Page 9 of 57
11. Component D: Project Management Technical Assistance (cost US$20.0 million, Bank financing US$18.1 million) financed the provision of project design, implementation, monitoring, and audit support to state-level agencies and ULBs through the provision of technical assistance and incremental operating costs.
B. SIGNIFICANT CHANGES DURING IMPLEMENTATION (IF APPLICABLE)
12. In June 2014, AP formally bifurcated into two states; the inland northern area became a new state called Telangana, and remainder retained the name Andhra Pradesh. The events before and after the bifurcation delayed project implementation considerably. The bifurcation followed prolonged protests by residents of Telangana, who felt the region had been neglected with regard to water distribution, budget allocations, and jobs. The new state of Telangana had a population of 35 million and was comprised of 10 former districts of AP, including the former capital of Hyderabad. The bifurcation created delays for the Project, as sub-projects could not be approved until the loan split between the two states was determined and finalized. Project staff were re-assigned and re-trained. The Governments of Andhra Pradesh (GoAP) and Telangana (GoT) and World Bank responded to the bifurcation and the resulting circumstances by restructuring the Project two times during the implementation period. 13. Two national demand-driven service delivery programs were introduced in 2015: Smart Cities Mission (SCM) and Atal Mission for Rejuvenation and Urban Transformation (AMRUT). SCM’s stated objective is to promote sustainable and inclusive cities that provide core infrastructure, a clean and sustainable environment, and the application of Smart Solutions. AMRUT focuses on water and sewage infrastructure for urban transformation. SCM covers 100 cities, while AMRUT has selected 500 cities across the country. Four of the Project’s ULBs were selected for inclusion in these programs: Kakinada (AMRUT and SCM), Guntur (AMRUT), Anantapur (AMRUT), and Vizianagaram (AMRUT).
Restructurings 14. In March 2015, following the bifurcation, GoI and Bank Management decided that Bank projects under implementation in the erstwhile AP state would retain their original PDOs and continue with one (combined) Project code, but implementation arrangements would be modified to reflect the new situation. Accordingly, the Project underwent a Level Two restructuring to divide the Project between the two successor states of AP and Telangana, as well as to make adjustments based on the status of implementation at that time. The Project would now be implemented by two state governments. Other changes included: (i) renaming the Project as “Andhra Pradesh and Telangana Municipal Development Project” (APTMDP); (ii) extending the closing date to December 15, 2017; (iii) revising project activities including the deletion of state finance study in Component 1 and the addition of urban planning and sector specific studies; (iv) reallocating funds from Components C and D to Component B to fund the above studies; (v) revising the RF and disbursement schedule; and (vi) entering into a new Project Agreement with the State of Telangana. The restructuring’s overall disbursement mechanism remained the same and was amended to include additional institutions in the state of Telangana. The restructuring allocated US$174 million to AP and US$126 to Telangana, apportioning savings identified based on the priorities of the two states.3 15. The Project was extended again in November 2017 by 12 months to allow for completion of works and consultancy contracts that were in progress. The implementation schedule, disbursement estimates, and RF were
3 The revised amounts of the 2015 Restructuring are as follows: Component A: US$9.20 million to US9.18 million; Component B: US$14.00 million to US$26.51 million; Component C: US$306.00 million to US$298.93 million; Component D: US$20.00 million to US$14.63 million. The additional funds in Component B were used to fund sectoral plans and city plans in both States. Additional GIS mapping and planning activities of new ULBs were to be funded under Component B.
The World Bank ANDHRA PRADESH AND TELANGANA MUNICIPAL DEVELOPMENT PROJECT (P071250)
Page 10 of 57
updated to reflect the revised timeline. Revised PDOs and Outcome Targets 16. The PDO remained unchanged during project implementation. However, in order to reflect the participation of the two bifurcated states in the Project, the PDO was informally changed in mission documents as: “to help improve urban services in Andhra Pradesh and Telangana, and the capacity of ULBs to sustain and expand urban services.”
Revised PDO Indicators
17. PDO Indicators. The 2015 restructuring modified the PDO-level service delivery indicator from the percentage of resident satisfaction to instead measure the number of Project beneficiaries. This was meant to clarify Project results and for ease of measurement. It also added an indicator: “Number of ULBs that have made operational new systems for core municipal functions and citizens interface” to track achievement of the PDO element “to help improve the capacity of ULBs to sustain and expand urban services.” Annex 1 shows the original and new outcome and intermediate indicators, along with their target values.
Revised Components
N/A
Other Changes
18. Implementing Agency. Following the June 2014 bifurcation and the 2015 Project restructuring, responsibility for implementation was assigned to the respective Municipal Administration and Urban Departments (MAUD) of AP and Telangana. Rationale for Changes and their Implications for the Original Theory of Change 19. The changes made to the Project during the two restructurings did not change the PDO or affect the original Theory of Change.
II. OUTCOME A. RELEVANCE OF PDOs
Assessment of Relevance of PDOs and Rating 20. The PDO remains aligned to the World Bank Group’s 2018 India Systematic Country Diagnostic (SCD) as well as the 2018-2022 India Country Partnership Framework (CPF). The SCD identified supporting local government as a key priority for strengthening India’s service delivery system. Similarly, the CPF recognized the relationship between empowered local governments and improved quality of life. Focus Area 1: Promoting Resource-Efficient Growth aims to improve the livability and sustainability of cities (Objective 1.2) and Focus Area 3: Investing in Human Capital sets the goal for efficient and sustainable water and sanitation service delivery (Objective 3.3). 21. Urban development continues to be a priority for GoI, and as indicated earlier, the current administration (in office from May 2014 and reelected in May 2019) launched the SCM and AMRUT missions, with which the Project is well-aligned. The continuation of the national programs until at least 2021 indicates that GoI’s commitment to the urban sector remains strong.
The World Bank ANDHRA PRADESH AND TELANGANA MUNICIPAL DEVELOPMENT PROJECT (P071250)
Page 11 of 57
22. GoAP and GoT have emphasized strengthening institutions and addressing urbanization challenges in state-level policies. The 12th Five-Year Plan of AP states that urban planning is a critical challenge and identifies APTMDP-led initiatives in urban infrastructure4, master plans, use of remote sensing and GIS, ULB-level governance reforms, financial resources, and capacity building. GoT is currently developing Vision 2024 and has named ULB-level governance and infrastructure as two of its ten key sectors. The GoT MAUD’s 2018-2019 Action Plan commits to expanding or completing several sub-projects initiated under APTMDP including the digital door numbering system, establishing open air gymnasiums in 307 parks, preparation of GIS base maps and master plans, and e-governance in 72 ULBs. 23. Given the strong alignment of the PDO to the principal pillars of the India CPF 2018-2022, as well as its relevance to ongoing GoI and state-level programs, the relevance of the PDO is rated as High. B. ACHIEVEMENT OF PDOs (EFFICACY)
24. The PDO comprises two elements: (i) help improve urban services; and (ii) help improve the capacity of ULBs to sustain and expand urban services. As the PDO remained unchanged, and the outcome targets did not change significantly during the life of the Project, a split PDO evaluation has not been conducted.
PDO ELEMENT 1: HELP IMPROVE URBAN SERVICES
Table 1: Improvement of Urban Services – Achievement of Indicator Targets No. PDO Indicator Target Actual Achieved Status
1 Number of project beneficiaries receiving improved urban services
1,200,000 1,305,681 Achieved (108%)
No. Intermediate Indicator Target Actual Achieved Status
1 Value of urban investment sub-projects implemented successfully at participating ULBs
US$300 million
US$182 million Partially Achieved (61%)
2 New / rehabilitated piped household water connections provided to people in urban areas under the project
200,000 211,713 Achieved (106%)
25. Nine ULBs were initially selected for participation in the Project; six of these were in the subsequently bifurcated AP, while three were in the state of Telangana. At the time of the first restructuring, sub-projects in five Telangana ULBs were added. Table 2 summarizes the achievements of these sub-projects; Annex 4 provides the detailed results.
Table 2: APTMDP Service Delivery Sub-projects
Sl. No. ULB Beneficiaries Number of House Service Connections
Storage Capacity (KL) Increase %
Network Coverage (KM) Increase %
Andhra Pradesh 1 Vizianagaram 115,011 14,722 7.3 85.15 2 Badvel 40,450 10,787 368.83 149.31
4 This includes: supply of desktops to set up ERP command communications centers and establishing open-air gyms in 180 parks.
The World Bank ANDHRA PRADESH AND TELANGANA MUNICIPAL DEVELOPMENT PROJECT (P071250)
Page 12 of 57
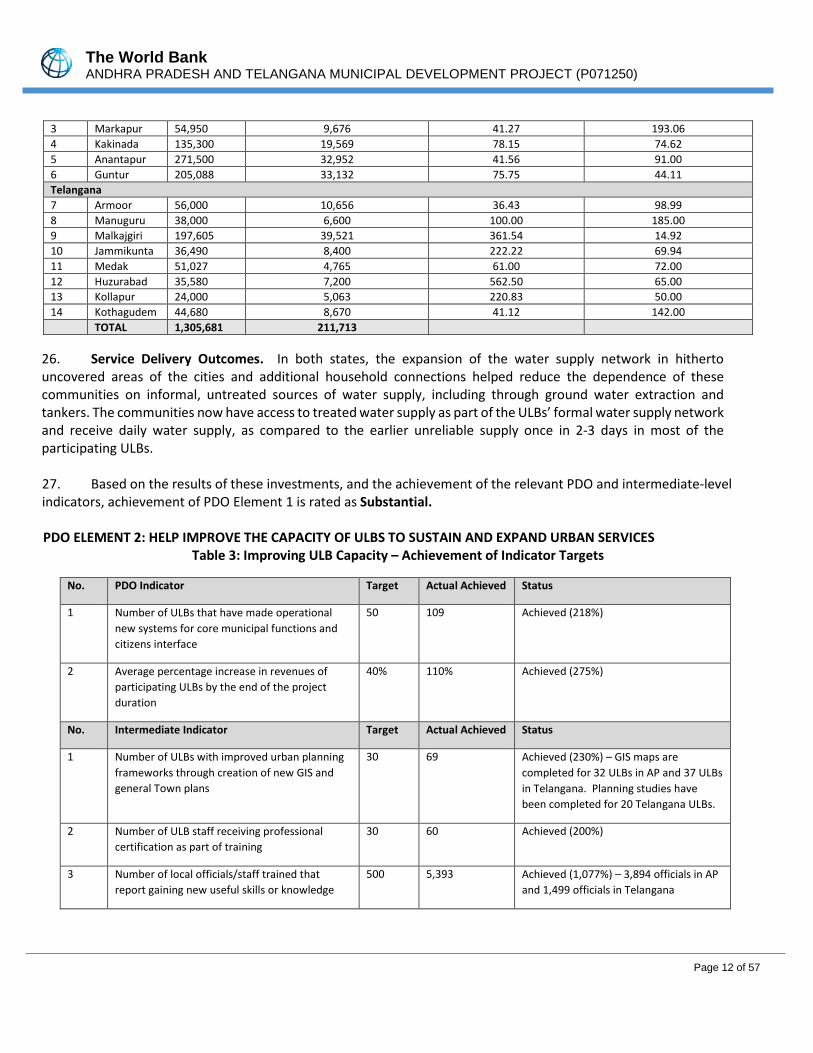
26. Service Delivery Outcomes. In both states, the expansion of the water supply network in hitherto uncovered areas of the cities and additional household connections helped reduce the dependence of these communities on informal, untreated sources of water supply, including through ground water extraction and tankers. The communities now have access to treated water supply as part of the ULBs’ formal water supply network and receive daily water supply, as compared to the earlier unreliable supply once in 2-3 days in most of the participating ULBs.
3 Markapur 54,950 9,676 41.27 193.06 4 Kakinada 135,300 19,569 78.15 74.62 5 Anantapur 271,500 32,952 41.56 91.00 6 Guntur 205,088 33,132 75.75 44.11 Telangana 7 Armoor 56,000 10,656 36.43 98.99 8 Manuguru 38,000 6,600 100.00 185.00 9 Malkajgiri 197,605 39,521 361.54 14.92 10 Jammikunta 36,490 8,400 222.22 69.94 11 Medak 51,027 4,765 61.00 72.00 12 Huzurabad 35,580 7,200 562.50 65.00 13 Kollapur 24,000 5,063 220.83 50.00 14 Kothagudem 44,680 8,670 41.12 142.00 TOTAL 1,305,681 211,713
27. Based on the results of these investments, and the achievement of the relevant PDO and intermediate-level indicators, achievement of PDO Element 1 is rated as Substantial. PDO ELEMENT 2: HELP IMPROVE THE CAPACITY OF ULBS TO SUSTAIN AND EXPAND URBAN SERVICES
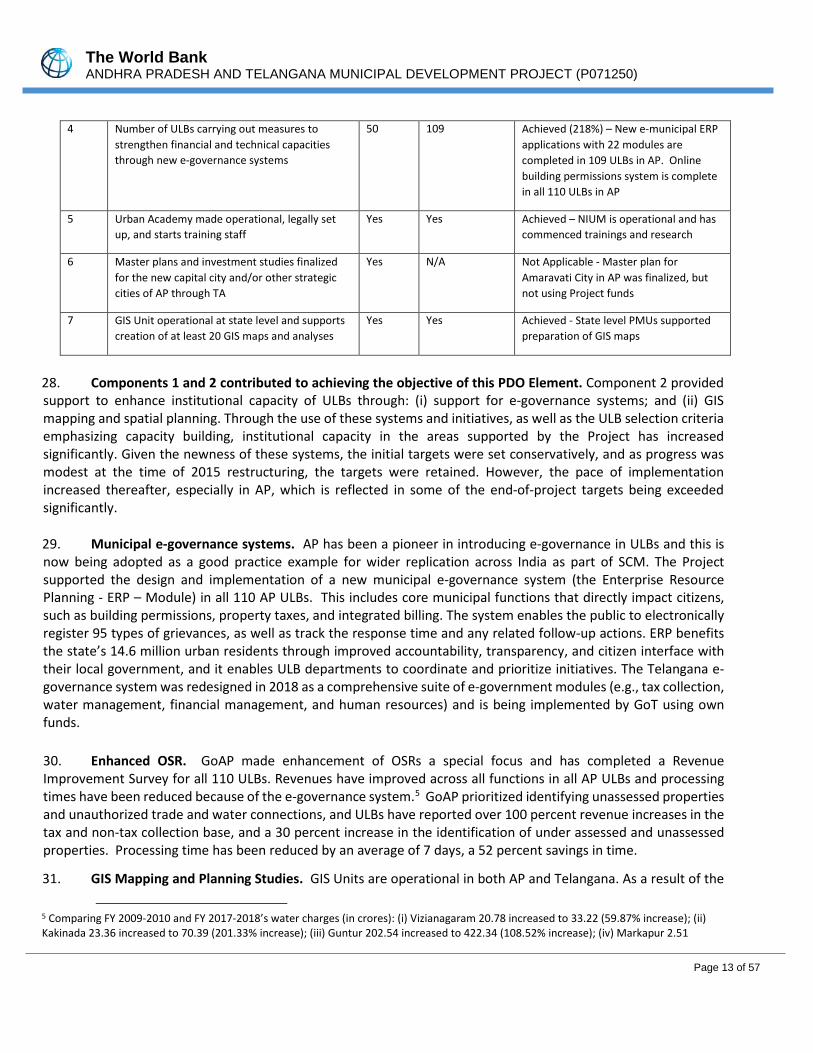
Table 3: Improving ULB Capacity – Achievement of Indicator Targets
No. PDO Indicator Target Actual Achieved Status
1 Number of ULBs that have made operational new systems for core municipal functions and citizens interface
50 109 Achieved (218%)
2 Average percentage increase in revenues of participating ULBs by the end of the project duration
40% 110% Achieved (275%)
No. Intermediate Indicator Target Actual Achieved Status
1 Number of ULBs with improved urban planning frameworks through creation of new GIS and general Town plans
30 69 Achieved (230%) – GIS maps are completed for 32 ULBs in AP and 37 ULBs in Telangana. Planning studies have been completed for 20 Telangana ULBs.
2 Number of ULB staff receiving professional certification as part of training
30 60 Achieved (200%)
3 Number of local officials/staff trained that report gaining new useful skills or knowledge
500 5,393 Achieved (1,077%) – 3,894 officials in AP and 1,499 officials in Telangana
The World Bank ANDHRA PRADESH AND TELANGANA MUNICIPAL DEVELOPMENT PROJECT (P071250)
Page 13 of 57
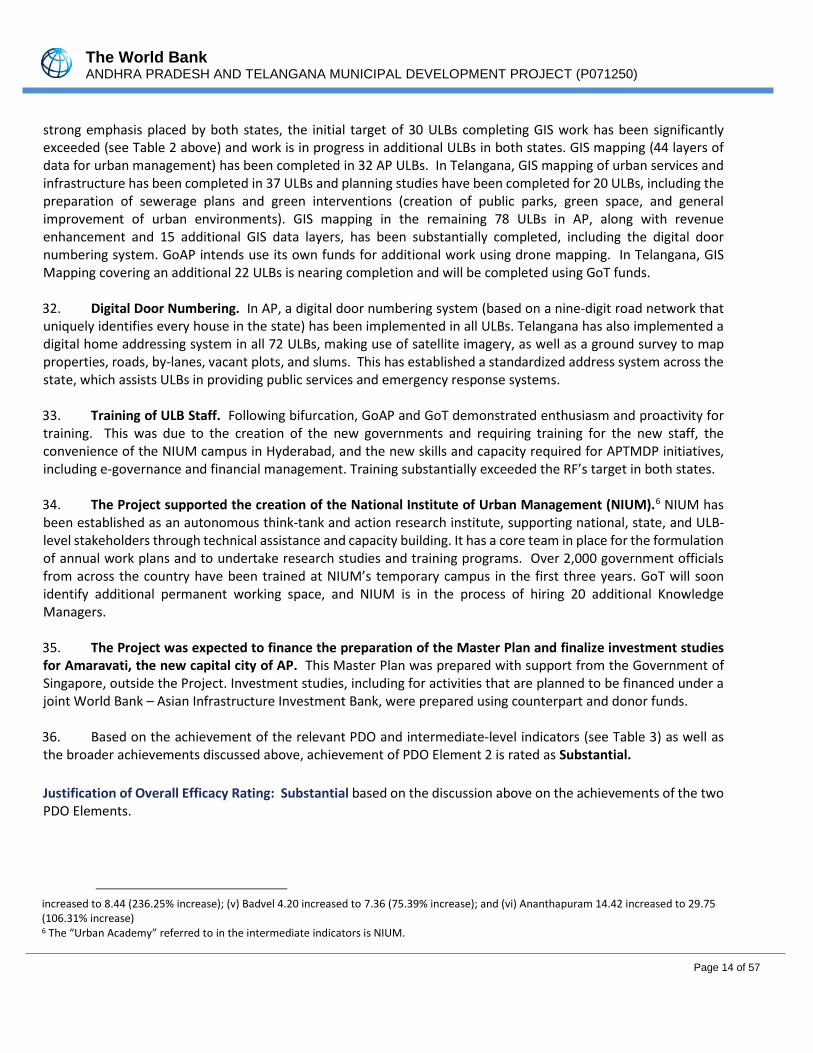
4 Number of ULBs carrying out measures to strengthen financial and technical capacities through new e-governance systems
50 109 Achieved (218%) – New e-municipal ERP applications with 22 modules are completed in 109 ULBs in AP. Online building permissions system is complete in all 110 ULBs in AP
5 Urban Academy made operational, legally set up, and starts training staff
Yes Yes Achieved – NIUM is operational and has commenced trainings and research
6 Master plans and investment studies finalized for the new capital city and/or other strategic cities of AP through TA
Yes N/A Not Applicable - Master plan for Amaravati City in AP was finalized, but not using Project funds
7 GIS Unit operational at state level and supports creation of at least 20 GIS maps and analyses
Yes Yes Achieved - State level PMUs supported preparation of GIS maps
28. Components 1 and 2 contributed to achieving the objective of this PDO Element. Component 2 provided support to enhance institutional capacity of ULBs through: (i) support for e-governance systems; and (ii) GIS mapping and spatial planning. Through the use of these systems and initiatives, as well as the ULB selection criteria emphasizing capacity building, institutional capacity in the areas supported by the Project has increased significantly. Given the newness of these systems, the initial targets were set conservatively, and as progress was modest at the time of 2015 restructuring, the targets were retained. However, the pace of implementation increased thereafter, especially in AP, which is reflected in some of the end-of-project targets being exceeded significantly. 29. Municipal e-governance systems. AP has been a pioneer in introducing e-governance in ULBs and this is now being adopted as a good practice example for wider replication across India as part of SCM. The Project supported the design and implementation of a new municipal e-governance system (the Enterprise Resource Planning - ERP – Module) in all 110 AP ULBs. This includes core municipal functions that directly impact citizens, such as building permissions, property taxes, and integrated billing. The system enables the public to electronically register 95 types of grievances, as well as track the response time and any related follow-up actions. ERP benefits the state’s 14.6 million urban residents through improved accountability, transparency, and citizen interface with their local government, and it enables ULB departments to coordinate and prioritize initiatives. The Telangana e-governance system was redesigned in 2018 as a comprehensive suite of e-government modules (e.g., tax collection, water management, financial management, and human resources) and is being implemented by GoT using own funds. 30. Enhanced OSR. GoAP made enhancement of OSRs a special focus and has completed a Revenue Improvement Survey for all 110 ULBs. Revenues have improved across all functions in all AP ULBs and processing times have been reduced because of the e-governance system.5 GoAP prioritized identifying unassessed properties and unauthorized trade and water connections, and ULBs have reported over 100 percent revenue increases in the tax and non-tax collection base, and a 30 percent increase in the identification of under assessed and unassessed properties. Processing time has been reduced by an average of 7 days, a 52 percent savings in time.
31. GIS Mapping and Planning Studies. GIS Units are operational in both AP and Telangana. As a result of the
5 Comparing FY 2009-2010 and FY 2017-2018’s water charges (in crores): (i) Vizianagaram 20.78 increased to 33.22 (59.87% increase); (ii) Kakinada 23.36 increased to 70.39 (201.33% increase); (iii) Guntur 202.54 increased to 422.34 (108.52% increase); (iv) Markapur 2.51
The World Bank ANDHRA PRADESH AND TELANGANA MUNICIPAL DEVELOPMENT PROJECT (P071250)
Page 14 of 57
strong emphasis placed by both states, the initial target of 30 ULBs completing GIS work has been significantly exceeded (see Table 2 above) and work is in progress in additional ULBs in both states. GIS mapping (44 layers of data for urban management) has been completed in 32 AP ULBs. In Telangana, GIS mapping of urban services and infrastructure has been completed in 37 ULBs and planning studies have been completed for 20 ULBs, including the preparation of sewerage plans and green interventions (creation of public parks, green space, and general improvement of urban environments). GIS mapping in the remaining 78 ULBs in AP, along with revenue enhancement and 15 additional GIS data layers, has been substantially completed, including the digital door numbering system. GoAP intends use its own funds for additional work using drone mapping. In Telangana, GIS Mapping covering an additional 22 ULBs is nearing completion and will be completed using GoT funds. 32. Digital Door Numbering. In AP, a digital door numbering system (based on a nine-digit road network that uniquely identifies every house in the state) has been implemented in all ULBs. Telangana has also implemented a digital home addressing system in all 72 ULBs, making use of satellite imagery, as well as a ground survey to map properties, roads, by-lanes, vacant plots, and slums. This has established a standardized address system across the state, which assists ULBs in providing public services and emergency response systems. 33. Training of ULB Staff. Following bifurcation, GoAP and GoT demonstrated enthusiasm and proactivity for training. This was due to the creation of the new governments and requiring training for the new staff, the convenience of the NIUM campus in Hyderabad, and the new skills and capacity required for APTMDP initiatives, including e-governance and financial management. Training substantially exceeded the RF’s target in both states. 34. The Project supported the creation of the National Institute of Urban Management (NIUM).6 NIUM has been established as an autonomous think-tank and action research institute, supporting national, state, and ULB-level stakeholders through technical assistance and capacity building. It has a core team in place for the formulation of annual work plans and to undertake research studies and training programs. Over 2,000 government officials from across the country have been trained at NIUM’s temporary campus in the first three years. GoT will soon identify additional permanent working space, and NIUM is in the process of hiring 20 additional Knowledge Managers. 35. The Project was expected to finance the preparation of the Master Plan and finalize investment studies for Amaravati, the new capital city of AP. This Master Plan was prepared with support from the Government of Singapore, outside the Project. Investment studies, including for activities that are planned to be financed under a joint World Bank – Asian Infrastructure Investment Bank, were prepared using counterpart and donor funds. 36. Based on the achievement of the relevant PDO and intermediate-level indicators (see Table 3) as well as the broader achievements discussed above, achievement of PDO Element 2 is rated as Substantial. Justification of Overall Efficacy Rating: Substantial based on the discussion above on the achievements of the two PDO Elements.
increased to 8.44 (236.25% increase); (v) Badvel 4.20 increased to 7.36 (75.39% increase); and (vi) Ananthapuram 14.42 increased to 29.75 (106.31% increase) 6 The “Urban Academy” referred to in the intermediate indicators is NIUM.
The World Bank ANDHRA PRADESH AND TELANGANA MUNICIPAL DEVELOPMENT PROJECT (P071250)
Page 15 of 57
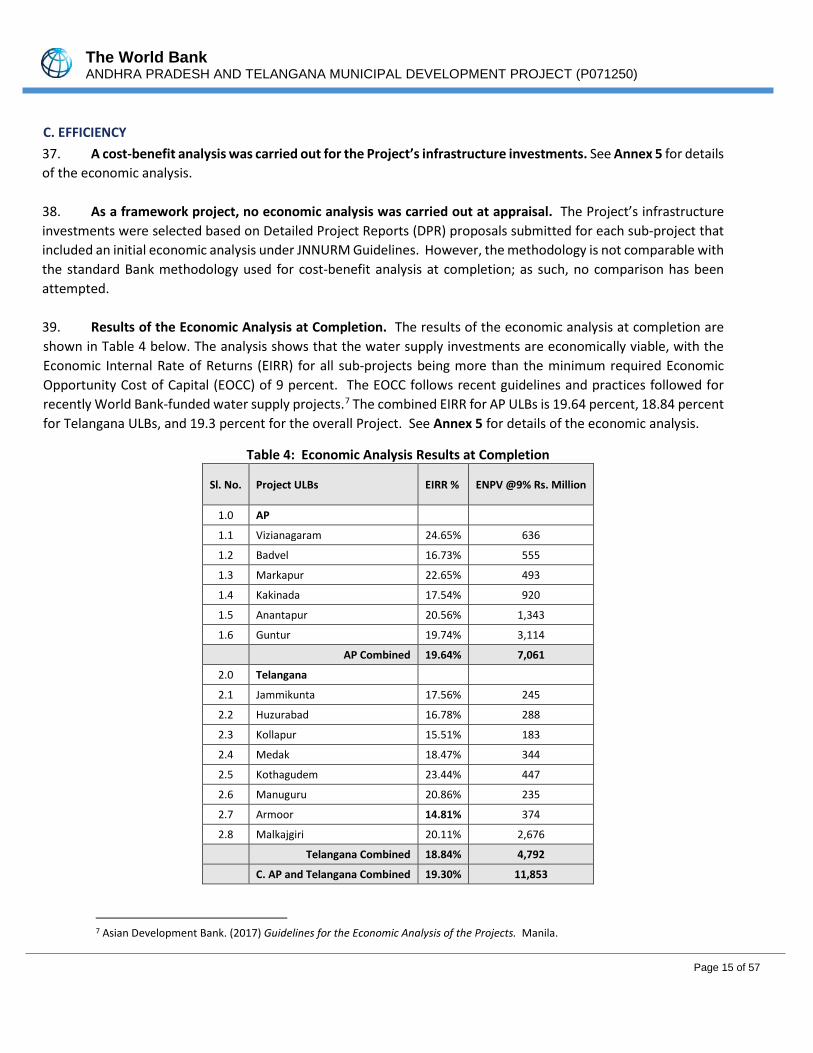
C. EFFICIENCY 37. A cost-benefit analysis was carried out for the Project’s infrastructure investments. See Annex 5 for details of the economic analysis. 38. As a framework project, no economic analysis was carried out at appraisal. The Project’s infrastructure investments were selected based on Detailed Project Reports (DPR) proposals submitted for each sub-project that included an initial economic analysis under JNNURM Guidelines. However, the methodology is not comparable with the standard Bank methodology used for cost-benefit analysis at completion; as such, no comparison has been attempted. 39. Results of the Economic Analysis at Completion. The results of the economic analysis at completion are shown in Table 4 below. The analysis shows that the water supply investments are economically viable, with the Economic Internal Rate of Returns (EIRR) for all sub-projects being more than the minimum required Economic Opportunity Cost of Capital (EOCC) of 9 percent. The EOCC follows recent guidelines and practices followed for recently World Bank-funded water supply projects.7 The combined EIRR for AP ULBs is 19.64 percent, 18.84 percent for Telangana ULBs, and 19.3 percent for the overall Project. See Annex 5 for details of the economic analysis.
Table 4: Economic Analysis Results at Completion
Sl. No. Project ULBs EIRR % ENPV @9% Rs. Million
1.0 AP
1.1 Vizianagaram 24.65% 636
1.2 Badvel 16.73% 555
1.3 Markapur 22.65% 493
1.4 Kakinada 17.54% 920
1.5 Anantapur 20.56% 1,343
1.6 Guntur 19.74% 3,114
AP Combined 19.64% 7,061
2.0 Telangana
2.1 Jammikunta 17.56% 245
2.2 Huzurabad 16.78% 288
2.3 Kollapur 15.51% 183
2.4 Medak 18.47% 344
2.5 Kothagudem 23.44% 447
2.6 Manuguru 20.86% 235
2.7 Armoor 14.81% 374
2.8 Malkajgiri 20.11% 2,676
Telangana Combined 18.84% 4,792
C. AP and Telangana Combined 19.30% 11,853
7 Asian Development Bank. (2017) Guidelines for the Economic Analysis of the Projects. Manila.
The World Bank ANDHRA PRADESH AND TELANGANA MUNICIPAL DEVELOPMENT PROJECT (P071250)
Page 16 of 57
40. A sensitivity analysis was also conducted to assess the effect of adverse changes in key variables including: (i) an overrun in operations and maintenance (O&M) costs of 20 percent; (ii) a decline in estimated benefits of 20 percent; and (iii) variables (i) and (ii) combined. The sensitivity analysis revealed that the results are robust for all water supply sub-projects. See Annex 5 for details. 41. Financial Analysis of Water Supply Operations. The financial analysis concluded that the ULBs in both states can absorb the O&M expenses of water supply services and the additional debt service requirements. However, water tariff revenues will not be sufficient to recover the annual O&M costs of the water supply systems, except in Malkajgiri in Telangana, which can recover the full O&M costs based on its existing tariff. Until the other ULBs revise their existing water tariffs to achieve full O&M cost recovery, water supply O&M will be subsidized from the ULB general account. 42. Administrative and Operational Efficiency. Over the course of implementation, the loan closing date was extended through two restructurings for a total of three years. These extensions stemmed largely from political and largely exogenous factors related to the 2014 bifurcation, and the subsequent need to establish and incorporate a new institutional structure in Telangana and to reorganize the existing structures in AP. More endogenous to the Project, additional time was required to revise ULB-level water supply planning studies, which had initially not contemplated adequate coverage levels in order to improve the equitable distribution of services among beneficiaries. Other major issues encountered during implementation included the time required for permissions from GoI departments, e.g., the Ministry of Railways and the National Highways Authority of India (for water pipelines to cross railway lines and roads, respectively) and the Department of Archaeology (for issues relating to the Project’s impact on cultural property), as well as natural hazards such as floods. 43. Utilization of the loan. As of the ICR writing, US$197.64 million (65.9 percent) of the loan amount of US$300 million has been disbursed. The principal reasons for underutilization of the loan include: the significant depreciation of the Indian Rupee vis-à-vis the US dollar; deletion of some activities from the Project; and the joint decision of GoI and the Bank not to extend the loan closing date beyond December 31, 2018 for additional activities. The rupee depreciated from INR47.7 per US$1 (PAD estimate) to INR70.4 per US$1 at project closing, leading to significant savings in US dollars, as the costs in INR did not increase by a corresponding amount. The July 2014 Aide Memoire that discussed the upcoming restructuring detailed net savings of US$42 million; in 2018, the rupee depreciated a further 14 percent. Cancellations were discussed at multiple meetings between the Bank, GoI Department of Economic Affairs, and the two states and were explicitly highlighted in mission packages. Ultimately, GoI decided to retain the original loan amount. The final two ISRs downgraded IP to Moderately Unsatisfactory due to slow disbursement and delays in contract execution. The disbursement grace period was extended on April 23, 2019 to June 30, 2019, and it is expected that the final disbursement numbers will reflect approximately 70 percent disbursement. Assessment of Efficiency and Rating: Modest. Despite the high EIRR rating, due to administrative and operational factors, the Efficiency of the Project is rated Modest.
The World Bank ANDHRA PRADESH AND TELANGANA MUNICIPAL DEVELOPMENT PROJECT (P071250)
Page 17 of 57
D. JUSTIFICATION OF OVERALL OUTCOME RATING Moderately Satisfactory. The Overall Outcome of the Project is rated as Moderately Satisfactory based on the ratings of Relevance of the PDO (High), Efficacy (Substantial), and Efficiency (Modest). E. OTHER OUTCOMES AND IMPACTS (IF ANY)
Gender 44. Women participated in the community meetings ahead of sub-project selection and were employed for sub-project implementation. Water supply interventions also disproportionately benefit women and girls as they are primarily responsible for water collection and benefit from the time and energy saved as a result of the house connections.
Institutional Strengthening 45. Strengthening local government institutions to deliver public services and build capacity was one of the Project’s core objectives and was captured prominently in the PDO and in the project design. The mutually reinforced approach of building systems such as e-governance and focused capacity building support worked well. NIUM provides an opportunity for continued learning. The key interventions and outcomes have been highlighted in the Efficacy section.
Mobilizing Private Sector Financing N/A
Poverty Reduction and Shared Prosperity
46. By providing water supply services to previously unconnected households and communities, the Project contributed to sharing prosperity and reducing multi-dimensional poverty. Each ULB’s sub-project area was mandated to include low-income neighborhoods, which directly contributed to poverty reduction through boosting service connectivity, creating local employment, and implementing works that led to improved public health outcomes. 47. Local communities participated in the construction of sub-projects, which provided employment opportunities. Of the nearly 96,000 total days of employment for the Telangana sub-projects, around 18 percent (17,200 days) employed local labor, of which 23 percent (3,960) were women. In AP, local labor worked 37 percent (301,550) of the 815,000 days of employment created from the Project, of which 34 percent (102,530 days) were women.
Other Unintended Outcomes and Impacts 48. One of the positive outcomes of APTMDP is the pioneering of new technologies in service delivery and local governance. In both states, the Project supported technologies such as GIS mapping, drones, e-services, smart metering and bill collection, and digital door numbering. Beyond these noteworthy improvements in the level of service provision and improved collection of user charges, the Project has demonstrated the potential for technology and smart solutions at the local level and opportunities for greater stakeholder engagement, transparency, and accountability through digital platforms.
The World Bank ANDHRA PRADESH AND TELANGANA MUNICIPAL DEVELOPMENT PROJECT (P071250)
Page 18 of 57
III. KEY FACTORS THAT AFFECTED IMPLEMENTATION AND OUTCOME A. KEY FACTORS DURING PREPARATION
49. The preparation of the Project was thorough and was based on robust analysis. The Project built on the initial 2005 project preparation and past Bank support to GoAP to remove infrastructure bottlenecks and strengthen institutions and systems. Using these as lessons learned and good practices, APMDP addressed key weaknesses in urban services and institutions. The Project was designed to build on the JNNURM institutional strengthening criteria. In addition, the Project emphasized support for municipal capacity building, anchored within the state’s municipal administration system rather than trying to enhance ULBs’ access to capital markets and risk jeopardizing the Project’s effectiveness due to the lack of local capacity. Support to state-level policies and institutions were specifically designed to enable sustained performance at the local level. This strategy was especially effective after bifurcation, when the relatively simple project design helped to build the new state’s capacity and institutions. 50. Risks and key institutional issues identified were clearly stated in the PAD, and project design included measures to mitigate capacity and accountability risks. Some of the risks identified included lack of political will for local autonomy and accountability, inappropriate selection of sub-projects, and/or weakened demand for state-level reforms. These risks were mitigated by focusing on building systems for accountable and effective local governance and included broad consultations with citizens and political leaders. Sub-projects were demand-driven and agreed with local stakeholders. In addition, ULBs were required to meet criteria demonstrating capacity and commitment to further improve capacity. Priority was given to improving institutional capacity from the outset through assessments of local capacity needs and the identification of training opportunities. State-level reforms and the corresponding Terms of References were agreed before appraisal. Overall, the risk mitigation measures put in place were appropriate.
51. At appraisal, the Project was designed as a framework, and neither the participating ULBs nor the individual sub-projects were identified. It was intended that the Project would support a wide variety of sub-projects, possibly including urban roads, sewerage, water supply, sanitation, solid waste management, street lighting, energy efficiency, and community centers.
B. KEY FACTORS DURING IMPLEMENTATION
52. Selection of sub-projects and ULBs. The state government subsequently determined, in agreement with the Bank, that the Project should focus on ULBs with water scarcity issues as well as ULBs that had not previously participated in earlier national programs (e.g., JNNURM). This was formalized in a 2009 GoAP order. GoAP, in agreement with the Bank, applied a set of criteria to select the participating ULBs that included: a satisfactory and current audit of municipal accounts; an operating budget surplus of more than 15 percent of the identified sub-project; and an approved Municipal Reform Action Plan (MRAP) that included actions to increase the ULBs’ operating surplus and cover the operating costs of the proposed sub-projects. These criteria were aligned with those of JNNURM, which were well-established and had proven successful. 53. ULBs conducted extensive consultations with stakeholders as part of the preparation of the DPR. Outreach to women was a part of the consultation process, and sub-project designs included a household survey for the social baseline of the sub-project area. The City Councils then approved the sub-projects. The selected water supply sub-projects comprised a combination of new distribution networks and house service connections, increased
The World Bank ANDHRA PRADESH AND TELANGANA MUNICIPAL DEVELOPMENT PROJECT (P071250)
Page 19 of 57
system capacity, reduced ground water extraction and use of water tankers, and improved hours of supply. Investments were made with strategic objectives: (i) universal coverage, including slum households being provided with individual connections; (ii) preparation for the provision of 24x7 water supply; and (iii) sustainability at the local level, including financial, social, and environmental sustainability.
54. Transfer of funds. Once the ULB eligibility criteria for the water supply sub-projects were met, the Andhra Pradesh Urban Finance and Infrastructure Development Corporation (APUFIDC) and Telangana Urban Finance and Infrastructure Development Corporation (TUFIDC) signed MoUs with each of the participating ULBs for the transfer of funds partly as grants and partly as loans. The sub-loans were repayable over 15 years at an interest rate equal to the state’s borrowing cost, plus one percent per annum (replicating the JNNURM model). Funds were released to ULBs in tranches, depending on their utilization in ongoing sub-project contracts.
55. Restructurings. At the time of the 2015 restructuring, the nine ULBs participating under the Project had completed procurement and 85 percent of funds allocated for investment sub-projects had been committed. The institutional and capacity building components were largely on track. However, disbursements were low (16.5 percent) because of the difficulties preceding the bifurcation, the time required for the new governments to be organized, delays in receiving permissions from GoI Ministries, and the depreciation of the rupee. As a result, the end-of-project targets in the RF were retained unchanged. Despite the restructuring, implementation delays continued, which impacted sub-projects’ progress and the scope of work. A second restructuring extended the project closing date by 12 months to accommodate the delivery of sub-projects. 56. The bifurcation of the state into Telangana and AP was extremely disruptive for project implementation. The agitations prior to the bifurcation, particularly in Telangana, resulted in serious delays for over two years. The Project followed the AP Reorganization Act to determine the split of the loan amount between the successor states. Five Telangana ULBs were added to the GoT portfolio, as loan funds were available under the loan allocation for Telangana. These ULBs did not receive as many opportunities for capacity building support and training opportunities and had smaller sub-projects due to the reduced time available for their implementation. 57. Institutional Arrangements. The ULBs identified and designed the investment and TA programs, planned and managed implementation, and contributed funds to the sub-projects. The Project was implemented at the state level by a Municipal Strengthening Unit (MSU) under the Commissioner and Director of Municipal Administration (CDMA), which supported ULBs in preparing and managing sub-projects, including detailed design and supervision support. The MSU also coordinated training for the ULBs. APUFIDC and TUFIDC conducted fiduciary appraisal of sub-project proposals and ULBs, verified and disbursed funds, and collected repayments. Following the bifurcation, the reorganization and transferring of staff to Vijayawada (the interim capital of AP) and the creation of the parallel agencies in Telangana resulted in the need to hire and retrain staff and adapt to new working conditions.
58. Loan Utilization. The period leading up to and post bifurcation resulted in a loss of momentum in implementation, which affected overall progress and disbursement and compounded issues related to the significant depreciation of the rupee. See Efficiency for details.
IV. BANK PERFORMANCE, COMPLIANCE ISSUES, AND RISK TO DEVELOPMENT OUTCOME
The World Bank ANDHRA PRADESH AND TELANGANA MUNICIPAL DEVELOPMENT PROJECT (P071250)
Page 20 of 57
A. QUALITY OF MONITORING AND EVALUATION (M&E) M&E Design
59. Results Framework. Three PDO indicators and 12 intermediate indicators comprised the RF. The PDO indicators evaluated the Project’s objectives, and intermediate indicators assessed the progress of the components and were measurable and time bound. Baselines, data/information sources, and responsible agencies for data collection and compilation were clearly defined. However, the framework nature of the Project meant that targets were difficult to determine at appraisal.
60. The Project was restructured twice with amendments to the RF. The two restructurings provided an opportunity to review and modify the RF. While some modifications were made by adding and dropping indicators, the review could have been more rigorous, especially in relation to end targets once sub-project activities and ULB participation rates were known. The PDO indicator measuring beneficiary satisfaction was modified to reflect the number of beneficiaries (for ease of measurement), and an additional PDO indicator was added to measure operational new systems as part of state-level and ULB capacity building. Intermediate indicators were modified to reflect the nature of project investments selected by the ULBs during implementation. However, the indicators could have been further refined and revised during the two restructurings. An indicator better calibrated to the sub-project investments (e.g., water supply coverage) would have provided more detail than the number of beneficiaries. The intermediate indicator related to the new capital city of AP was not applicable to the Project once the master plan was not funded under APTMDP and should have been dropped. Targets were not amended during the restructurings, which led to significant over achievement of some indicators, especially the intermediate indicators related to PDO Element 2. 61. The Project’s M&E system was designed to track project expenditures by ULBs, fund flows, and ULB and state administrative functions. The MSUs were responsible for overall project M&E based on reports from implementation agencies and their own analysis. Progress on ULBs’ investment sub-projects was reported monthly, which the CDMAs reviewed and compiled in the form of quarterly project reports for MAUD and the Bank.
M&E Implementation 62. The M&E systems were implemented as per the original and updated designs. The MSUs and ULBs made a concerted effort to collect and track financial data on the infrastructure investments. ULBs were trained to collect and maintain data related to the sub-projects. All 14 ULBs provided individual sub-project progress reports, which included information related to selection of the sub-project, costing and payments, the reasons for time extensions, problems experienced, amount and type of ULB contribution, and the existence of a maintenance, business, and/or environmental management plan. “Complete and timely progress / financial reports being made available by Project Management Unit (MSU)” was an intermediate indicator that was fully achieved. M&E was consistently rated as Satisfactory in ISRs.
M&E Utilization 63. Utilization. The CDMAs organized regular meetings for ULBs to share their experiences. The Bank monitored and supported M&E implementation through the review of the CDMA reports and consultants, in addition to twice yearly missions. ULB and MSU reports were utilized by the PMUs, execution support agencies, and the Bank team to make corrections and improvements in the work program. This was especially relevant in the last year of implementation in order to identify sub-projects at risk of not being completed by project closing or in
The World Bank ANDHRA PRADESH AND TELANGANA MUNICIPAL DEVELOPMENT PROJECT (P071250)
Page 21 of 57
danger of cost overruns. The intermediate indicator “Adequate quality of DPRs ensure sub project costs at completion have no cost over-runs exceeding 10% compared to original estimates” was achieved except for one ULB. 64. In AP, the e-governance team identified monitoring ULB performance and the lack of adequate information for informed decision-making as a critical challenge. The ERP system monitored performance indicators based on analysis of ULB data, alongside GIS maps which tracked and compared ULB performance.
Justification of Overall Rating of Quality of M&E: Modest.
B. ENVIRONMENTAL, SOCIAL, AND FIDUCIARY COMPLIANCE 65. Environmental and Social Safeguards. Due to the nature of the infrastructure investments and the project area, the Project was classified as Category A and triggered a number of Bank safeguard policies: OP/BP 4.01 (Environmental Assessment); OP/BP 4.36 (Forests); OP 4.09 (Pests); OP/BP 4.11 (Physical Cultural Resources); OP/BP 4.10 (Indigenous Peoples); and OP/BP 4.12 (Involuntary Resettlement). On the basis of the Social and Environmental Assessment, a Social and Environmental Assessment and Management Framework (SEAMF) was prepared, which was revised in 2015. The revised document incorporated the provisions of GoI’s 2014 “Right to Fair Compensation and Transparency in Land Acquisition and Rehabilitation and Resettlement Act.”
66. The Project team was thorough in preparing the safeguards documents. The SEAMF was developed into a Project Manager’s Manual (PMM) and a Manual for Urban Local Bodies (MULB). The manuals included a Social and Environmental Capacity-Building Action Plan (SECAP), and an Information and Consultation Strategy and Action Plan (ICS) to ensure that information was available to stakeholders throughout the project cycle and for obtaining stakeholder feedback. The PMM aided project managers to understand and supervise implementation of the SEAMF as well as manage information and communications for the Project. The MULB provided the ULBs with guidance for implementation.
67. Environmental and Social Safeguards Implementation. The Project’s safeguard documents were adopted by the successor states after the bifurcation of AP. Implementation of social safeguards was generally satisfactory, with minimal issues relating to land acquisition or implementation of the Tribal Development Plan. However, the delay in providing house ownership titles in one of the ULBs in AP resulted in downgrading of social safeguards management to “Moderately Unsatisfactory” in the final ISR. These ownership titles were provided shortly after project closing and demonstrated the ULBs’ continued commitment to the Project. Environmental safeguards were rated “Satisfactory” in the final ISR. The Project enabled the adoption of several good environmental management practices, including provisions for recycling backwash water in water treatment plants, monitoring of air and water quality, use of personal protective gear by workers, public notices on work periods and contact details of staff in-charge, systematic records on tree cutting and road restoration requirements, and the use of cautionary signage to restrict unauthorized access to work areas.
68. OP/BP 4.01 (Environmental Assessment). The Environmental Management Framework (EMF) developed during project preparation included a screening and appraisal process for sub-projects, institutional arrangements, and plans for capacity building and monitoring. Post-bifurcation, the EMF was revised and re-disclosed. An
The World Bank ANDHRA PRADESH AND TELANGANA MUNICIPAL DEVELOPMENT PROJECT (P071250)
Page 22 of 57
environmental screening and assessment was undertaken for all sub-projects. The EMF was suitably responsive; when the scope of a sub-project was enhanced post-environmental screening and assessment, the environmental management plan was revised to reflect the changes.
69. OP/BP 4.11 (Physical Cultural Resources). A Physical and Cultural Resources Management Plan was prepared in consultation with the Department of Archaeology for the Malkajgiri sub-project (which required construction activity in the vicinity of a protected monument) and was implemented in an acceptable manner.
70. OP/BP 4.10 (Indigenous Peoples) and OP/BP 4.12 (Involuntary Resettlement). Land acquisition and resettlement impacts were addressed in compliance with the SEAMF by providing compensation as per agreed provisions and offering displaced families alternative housing with basic amenities and ownership rights. Two resettlement action plans in AP’s Guntur and Vizianagaram were prepared and implemented, as was a Tribal Development Plan for Telangana’s Manuguru. Land acquisition-related impacts in AP included the acquisition of 1.54 acres of private land (impacting 30 land owners) and the displacement of 32 informally-settled families. All basic infrastructure facilities proposed under the Tribal Development Plan were completed, except for the construction of boundary walls for the community centers for want of funds. The Project was endorsed by the tribal community and implementation was conducted in a culturally appropriate manner. The costs of implementation of land acquisition and resettlement in Guntur and Vizianagaram were US$307,840 (INR21.36 million) and US$27,380 (INR1.90 million) respectively, approximately 0.77 and 0.35 percent of the cost of the respective schemes. In Telangana, one acre of private land was acquired through the Land Acquisition Act and donation. The Telangana donor family was provided with regular employment in return for the land donation. Additional details can be found in Annex 6.
71. The Project made efforts to avoid the acquisition of private land by identifying vacant municipal property or annexing GoI-owned land. In addition to using ULB land, approximately 20 acres of land belonging to other government departments was used to meet sub-projects’ land requirements. The planned construction of a summer storage tank in Kakinada was abandoned due to complex land acquisition and livelihood issues. The proposed site consisted of 185 acres of land cultivated by three cooperative societies under lease arrangements from GoAP. The cooperative societies claimed rights over the land and appealed in court, which resulted in prolonged delays and the eventual abandonment of the scheme.
72. One of the key social development outcomes of the Project was the facilitation of resettlement assistance and the establishment of ownership rights for 32 families in Guntur. The Project provided housing with formal titles to the resettled families and provided support to extend basic amenities (e.g., internal roads, drains, and street lighting). In Manuguru, the Project improved access to key basic facilities and extended individual house connections for drinking water in two tribal villages.
73. Fiduciary. The Project’s overall financial management system was rated as Moderately Satisfactory in the final ISR. Accounting and reporting in both states, as well as internal audits, were mostly on time. External audits were normally delayed, but there are currently no outstanding reports. There was an issue in both states with utilization certificates being submitted as and when funds were required, instead of monthly as recommended. This delayed the accounting process and was repeatedly highlighted in Project mission packages. Additionally, in
The World Bank ANDHRA PRADESH AND TELANGANA MUNICIPAL DEVELOPMENT PROJECT (P071250)
Page 23 of 57
Telangana, ULBs reported unpaid bills and requested transfer of funds from TUFIDC for making payments to contractors. Multiple mission packages requested GoT to release funds to ULBs, as these delays affected project implementation.
74. The MSUs maintained adequate records to support the Project’s expenditures incurred by the States. The Project disbursed both sub-grants and sub-loans to the ULBs through APUFIDC and TUFIDC, which the Bank reimbursed. Both states had some issues with ULBs making less-than-agreed contributions to sub-projects; while these did not impact disbursement, they did affect the overall financial closure of contracted packages.
75. Procurement. The overall procurement performance was rated as Moderately Satisfactory in the final ISR. The procurement process generally complied with World Bank procurement rules and procedures. The ULBs and state agencies demonstrated growing capacity for conducting procurement activities, including procurement planning and the bidding process. The procurement process generally worked well, especially for the IT firms selected for Components A and B. However, there were some delays in procurements that could then not be taken up, such as water meter contracts in some of the ULBs.
C. BANK PERFORMANCE
Quality at Entry 76. The World Bank team incorporated relevant lessons from previous AP and local governance service delivery projects in the design of the Project. When project approval was delayed after the 2005 negotiations, the design was updated to reflect current GoI, GoAP, and Bank priorities. The Project addressed the issues highlighted by national programs, state policies, and Bank strategic documents. Risks were correctly identified and appropriately mitigated. The Project’s framework design was deliberately flexible to allow the selection of ULBs and sub-projects based on the agreed criteria and ULB priorities. The Bank ensured that a team of specialists was mobilized to address all relevant project issues, including technical aspects, social and environmental safeguards, and M&E. Economic and financial analysis, appropriate for a framework project, was also carried out. See Key Factors During Preparation.
77. Project design focused adequately on fiduciary and safeguards requirements. Financial management and procurement arrangements were well designed and addressed the principal risks identified by the capacity and risk assessments. Appropriate environmental and social safeguard policies were triggered, and the SEAMF followed Bank requirements. Safeguards documentation was especially thorough, including MULBs and ICS, and helped ensure ULBs understood their roles and responsibilities and how to disseminate information to stakeholders. Training related to safeguards, procurement, and project management began during project preparation.
78. The Project was designed as a framework and was thus only partially ready for implementation at the time of approval. The selection of the participating ULBs and the sub-projects began after project approval. Consequently, the first two years of implementation were dedicated to the selection of participating cities and sub-projects, the signing of MoUs, and recruitment of consultants to provide technical support to the ULBs.
The World Bank ANDHRA PRADESH AND TELANGANA MUNICIPAL DEVELOPMENT PROJECT (P071250)
Page 24 of 57
Quality of Supervision 79. The Project was thoroughly supervised by the Bank’s task team throughout the implementation period. The Bank produced 19 ISRs during the Project. Most missions comprised joint field visits with GoAP/GoT teams and core World Bank team members and were effective in identifying and addressing implementation issues. Supervision and midterm review documentation, including Aide Memoires, management letters, and ISRs, were thorough and appropriately candid and included clear action items to expedite sub-project implementation and address any fiduciary and safeguards issues. The Project benefitted from excellent team continuity as the co-TTL remained for the entire duration. The core team was all based in-country.
80. Restructurings were completed in a timely manner to reflect project needs. The Bank provided needed support during the bifurcation. The team restructured the Project in April 2015 after it was determined how to split the loan in consultation with GoI and the CMU. Throughout the bifurcation process, the Bank team continued to conduct missions, hold field-based reviews, and provide ULB-level training. The second restructuring ensured the Project’s main activities could be completed.
81. M&E design updates and utilization could have been more rigorous, including amending the RF during the restructurings to better reflect sub-project investments and outcomes. Targets, especially related to PDO Element 2, were conservatively estimated at appraisal and should have been revised once the momentum of implementation increased.
82. The Project could not utilize about one-third of the loan. Cancellations were discussed and explicitly mentioned in mission packages as early as the Mid Term Review in 2013, but GoI and the state governments decided to leave the loan amount unchanged.
Justification of Overall Rating of Bank Performance: Moderately Satisfactory D. RISK TO DEVELOPMENT OUTCOME
83. The future sustainability of the completed sub-projects must be carefully monitored. Potential issues related to the maintenance of physical infrastructure, institutional capacity at the local level, and continuation of community engagement must be supervised. Key aspects of sustainability include:
a. Completion of remaining Project works. GoAP and GoT have made provisions to complete sub-projects that were not completed by the loan closing date, as well as scale them up using state, GoI, SCM, and/or AMRUT funds. However, asset management will be critical and closely linked to financial sustainability and institutional capacity. Incomplete sub-projects are in the Telangana ULBs which had limited implementation time, and all will be completed by June 30, 2019. Additional works (e.g., incorporating metering in Badvel and Kakinada) will scale up APTMDP’s investments. b. Financial Sustainability. ULBs will receive water-supply related revenues that directly support O&M. As of May 2019, collection efficiency is very low in some ULBs, and there is potential for generating much higher revenues based on the existing tariffs. GoAP/GoT and CDMAs should also work with ULBs to introduce revised water tariffs to fully cover O&M costs (e.g., Badvel has recently raised tariffs as a result of the Project). These efforts will reduce the need for ULBs to provide O&M subsidies for water supply operations. c. Institutional Capacity. The Project provided significant training to both state and ULB officials, which has resulted considerable capacity building. However, routine rotation and reassignment of
The World Bank ANDHRA PRADESH AND TELANGANA MUNICIPAL DEVELOPMENT PROJECT (P071250)
Page 25 of 57
personnel is an ongoing occurrence, and provision must be made for training the replacement staff. d. Community Engagement. Residents’ associations were actively involved in resolving issues during Project implementation but have no formal role in O&M moving forward. Institutionalizing roles and responsibilities for the community post-implementation will ensure continued stakeholder engagement and ownership of the investments.
84. Links to National Programs. The continuation of the national SCM and AMRUT missions until 2021 (and possibly beyond) has enormous potential to expand APTMDP investments. Kakinada in AP is currently implementing water supply metering under SCM. There are also discussions of mapping the city’s pipeline network, digitizing it, and linking it to a data platform in order to monitor the water supply network. Vizianagaram, Guntur, and Anantapur have used AMRUT funds to extend APTMDP works or to introduce smart metering.
V. LESSONS AND RECOMMENDATIONS 85. Capacity building of local governments is an ongoing activity and must be targeted to the selected ULBs’ priorities. Bank-supported urban development projects in other Indian states have operated primarily through state-level financial intermediaries to channel investment financing and facilitate ULB capital market access. APMDP chose to anchor the project in CDMA and focus on improving ULB capacity, including for service provision. This has prepared these ULBs for more sophisticated financing models in the future. Future projects should consider whether such a focused approach would be suitable in the specific local circumstances. 86. The Bank must set realistic conditions for Board presentation. In 2005, the condition for presenting the APMDP loan to the Executive Directors for approval - the repeal of the Urban Land Ceiling Act - delayed the approval of the loan by nearly three years. As a result, the loan for the Project had to be re-negotiated and the GoI requirement of 30 percent pipeline had to be reestablished. The impact of such conditions for Board presentation of loans should be carefully considered a priori.
87. Framework projects require the RF to be refined and updated. Projects approved under a framework approach are unable to design an M&E system that adequately captures project results, as the participating ULBs and/or the details of the specific infrastructure investments are not known at appraisal. The RF should be carefully monitored and modified during restructurings to better capture the results of the identified investments. 88. The Bank should consider funding of focused, complementary TA packages for ULBs. Most state-level urban projects in India, including APTMDP, have TA components that are formulated statewide for comprehensive studies. Consequently, the contracts are large and are implemented across a range of ULBs to enable cross-learning and coordination. However, as was the case in this Project, progress of implementation is uneven when there are a large number of ULBs. An alternative would be to work with a selected number of ULBs on a demand driven / pilot basis and mainstream initiatives subsequently through dissemination and a follow-on project.
89. Include metering as part of house connections to improve collection rates for water charges. ULBs have reported low collection rates, as household connections in some sub-projects did not include the installation of meters. Counterpart officials indicated that incorporating metering in sub-project design would have improved consumers’ willingness to pay. This is consistent with experience in water projects in India and globally. .
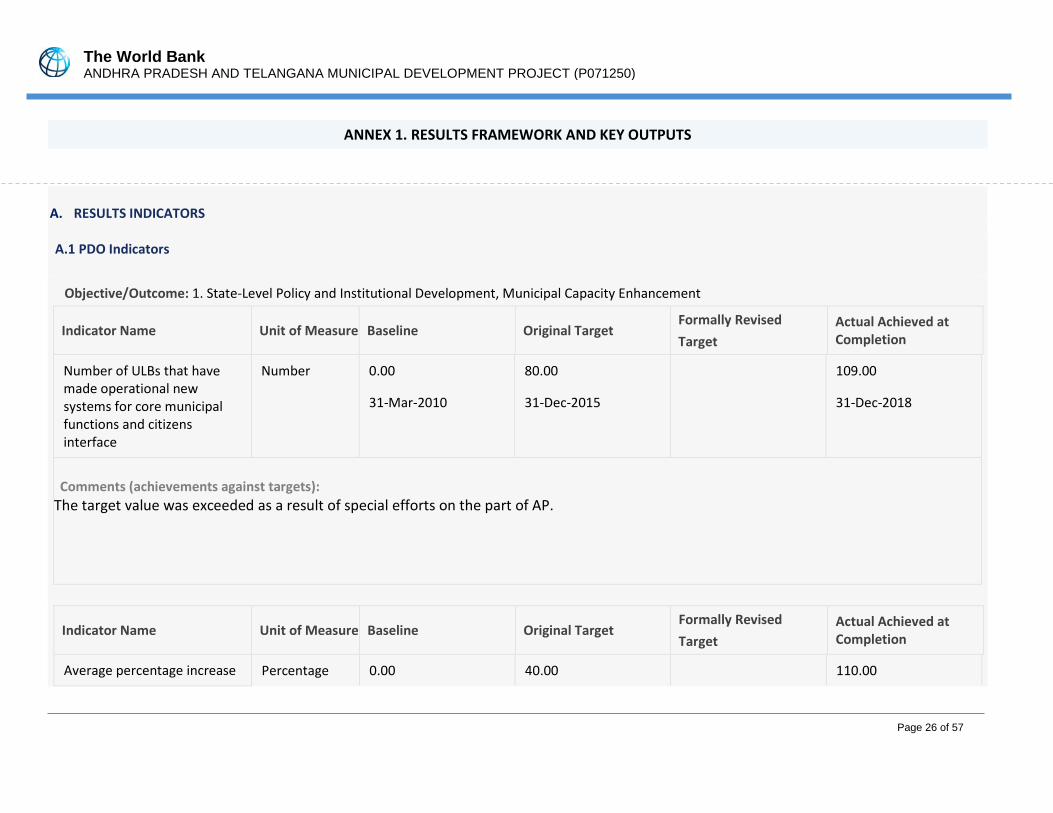
The World Bank ANDHRA PRADESH AND TELANGANA MUNICIPAL DEVELOPMENT PROJECT (P071250)
Page 26 of 57
ANNEX 1. RESULTS FRAMEWORK AND KEY OUTPUTS
A. RESULTS INDICATORS A.1 PDO Indicators Objective/Outcome: 1. State-Level Policy and Institutional Development, Municipal Capacity Enhancement
Indicator Name Unit of Measure Baseline Original Target Formally Revised Target
Actual Achieved at Completion
Number of ULBs that have made operational new systems for core municipal functions and citizens interface
Number 0.00 80.00 109.00
31-Mar-2010 31-Dec-2015 31-Dec-2018
Comments (achievements against targets): The target value was exceeded as a result of special efforts on the part of AP.
Indicator Name Unit of Measure Baseline Original Target Formally Revised Target
Actual Achieved at Completion
Average percentage increase Percentage 0.00 40.00 110.00
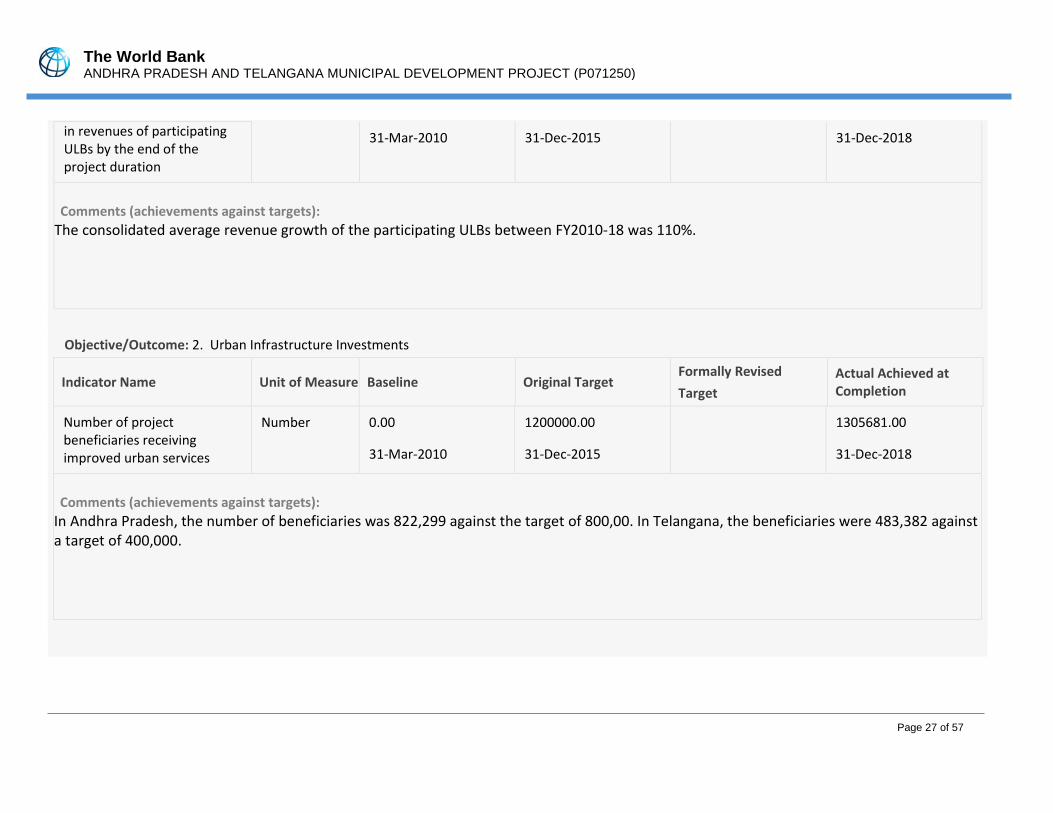
The World Bank ANDHRA PRADESH AND TELANGANA MUNICIPAL DEVELOPMENT PROJECT (P071250)
Page 27 of 57
in revenues of participating ULBs by the end of the project duration
31-Mar-2010 31-Dec-2015 31-Dec-2018
Comments (achievements against targets): The consolidated average revenue growth of the participating ULBs between FY2010-18 was 110%.
Objective/Outcome: 2. Urban Infrastructure Investments
Indicator Name Unit of Measure Baseline Original Target Formally Revised Target
Actual Achieved at Completion
Number of project beneficiaries receiving improved urban services
Number 0.00 1200000.00 1305681.00
31-Mar-2010 31-Dec-2015 31-Dec-2018
Comments (achievements against targets): In Andhra Pradesh, the number of beneficiaries was 822,299 against the target of 800,00. In Telangana, the beneficiaries were 483,382 against a target of 400,000.
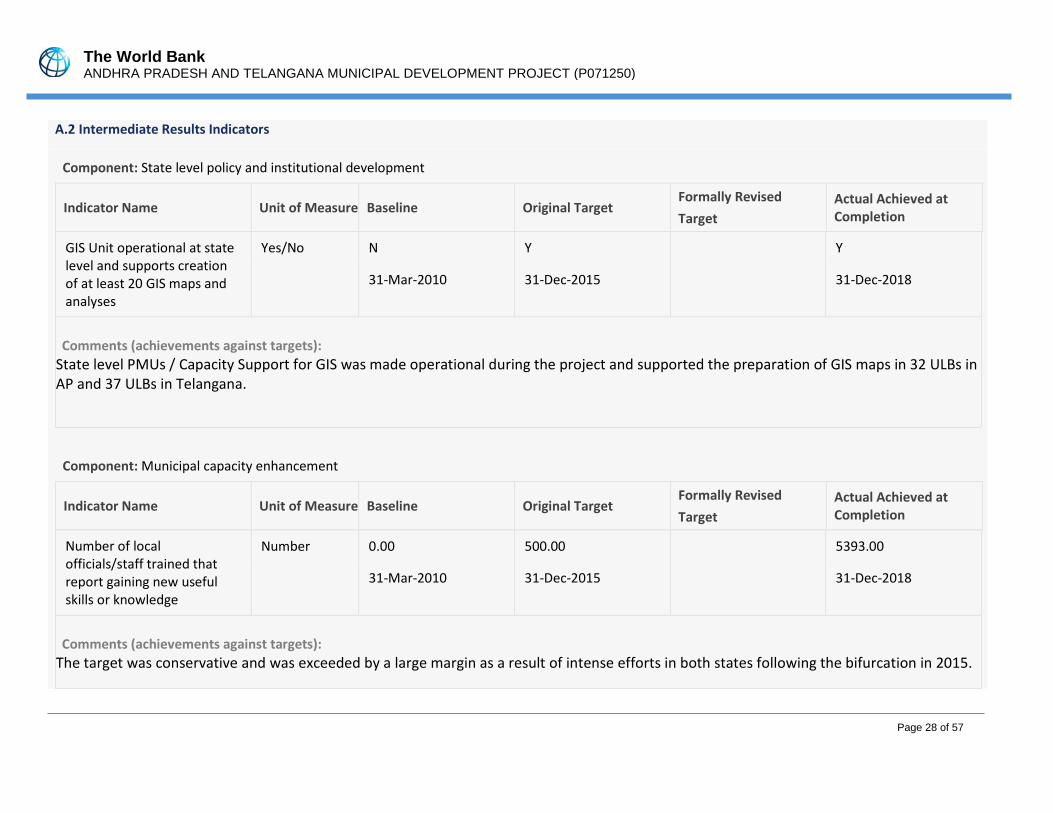
The World Bank ANDHRA PRADESH AND TELANGANA MUNICIPAL DEVELOPMENT PROJECT (P071250)
Page 28 of 57
A.2 Intermediate Results Indicators
Component: State level policy and institutional development
Indicator Name Unit of Measure Baseline Original Target Formally Revised Target
Actual Achieved at Completion
GIS Unit operational at state level and supports creation of at least 20 GIS maps and analyses
Yes/No N Y Y
31-Mar-2010 31-Dec-2015 31-Dec-2018
Comments (achievements against targets): State level PMUs / Capacity Support for GIS was made operational during the project and supported the preparation of GIS maps in 32 ULBs in AP and 37 ULBs in Telangana.
Component: Municipal capacity enhancement
Indicator Name Unit of Measure Baseline Original Target Formally Revised Target
Actual Achieved at Completion
Number of local officials/staff trained that report gaining new useful skills or knowledge
Number 0.00 500.00 5393.00
31-Mar-2010 31-Dec-2015 31-Dec-2018
Comments (achievements against targets): The target was conservative and was exceeded by a large margin as a result of intense efforts in both states following the bifurcation in 2015.
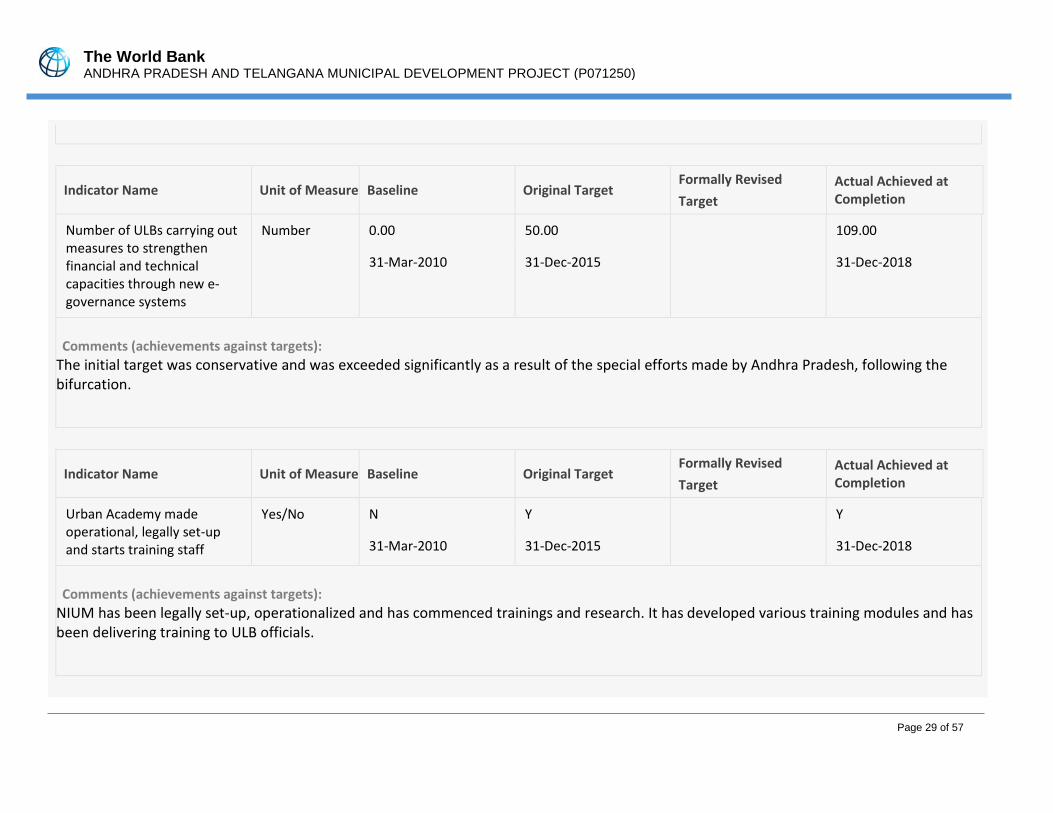
The World Bank ANDHRA PRADESH AND TELANGANA MUNICIPAL DEVELOPMENT PROJECT (P071250)
Page 29 of 57
Indicator Name Unit of Measure Baseline Original Target Formally Revised Target
Actual Achieved at Completion
Number of ULBs carrying out measures to strengthen financial and technical capacities through new e-governance systems
Number 0.00 50.00 109.00
31-Mar-2010 31-Dec-2015 31-Dec-2018
Comments (achievements against targets): The initial target was conservative and was exceeded significantly as a result of the special efforts made by Andhra Pradesh, following the bifurcation.
Indicator Name Unit of Measure Baseline Original Target Formally Revised Target
Actual Achieved at Completion
Urban Academy made operational, legally set-up and starts training staff
Yes/No N Y Y
31-Mar-2010 31-Dec-2015 31-Dec-2018
Comments (achievements against targets): NIUM has been legally set-up, operationalized and has commenced trainings and research. It has developed various training modules and has been delivering training to ULB officials.
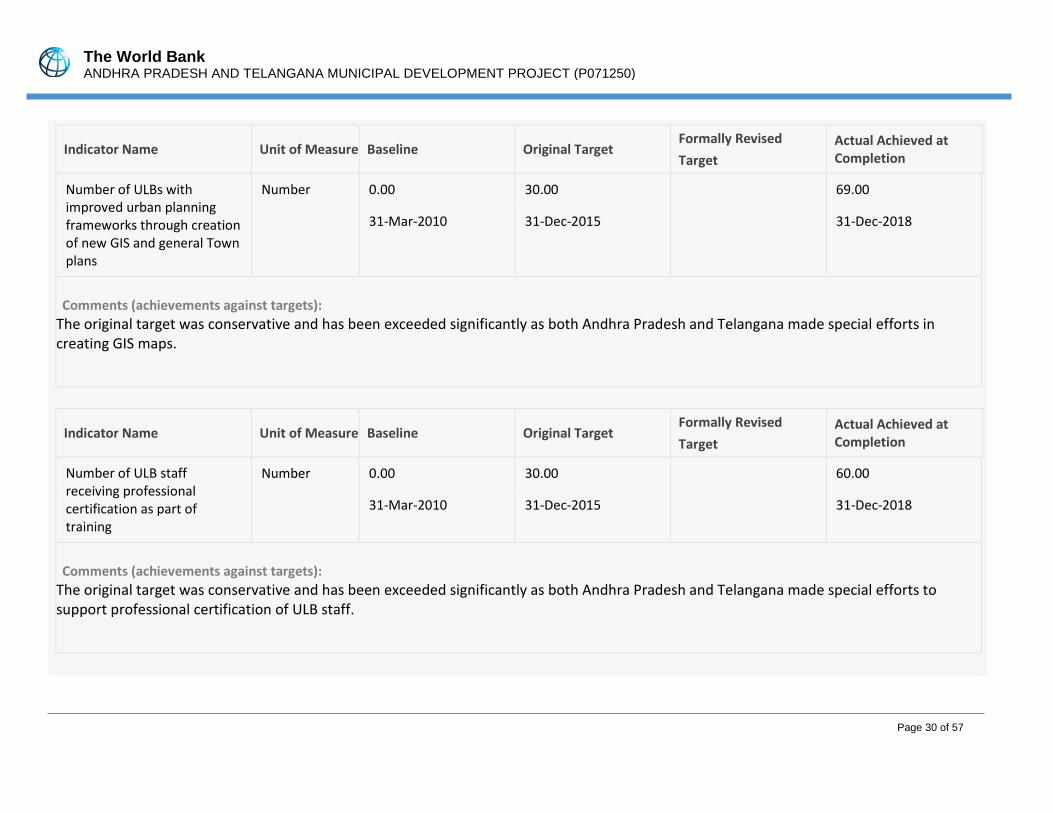
The World Bank ANDHRA PRADESH AND TELANGANA MUNICIPAL DEVELOPMENT PROJECT (P071250)
Page 30 of 57
Indicator Name Unit of Measure Baseline Original Target Formally Revised Target
Actual Achieved at Completion
Number of ULBs with improved urban planning frameworks through creation of new GIS and general Town plans
Number 0.00 30.00 69.00
31-Mar-2010 31-Dec-2015 31-Dec-2018
Comments (achievements against targets): The original target was conservative and has been exceeded significantly as both Andhra Pradesh and Telangana made special efforts in creating GIS maps.
Indicator Name Unit of Measure Baseline Original Target Formally Revised Target
Actual Achieved at Completion
Number of ULB staff receiving professional certification as part of training
Number 0.00 30.00 60.00
31-Mar-2010 31-Dec-2015 31-Dec-2018
Comments (achievements against targets): The original target was conservative and has been exceeded significantly as both Andhra Pradesh and Telangana made special efforts to support professional certification of ULB staff.
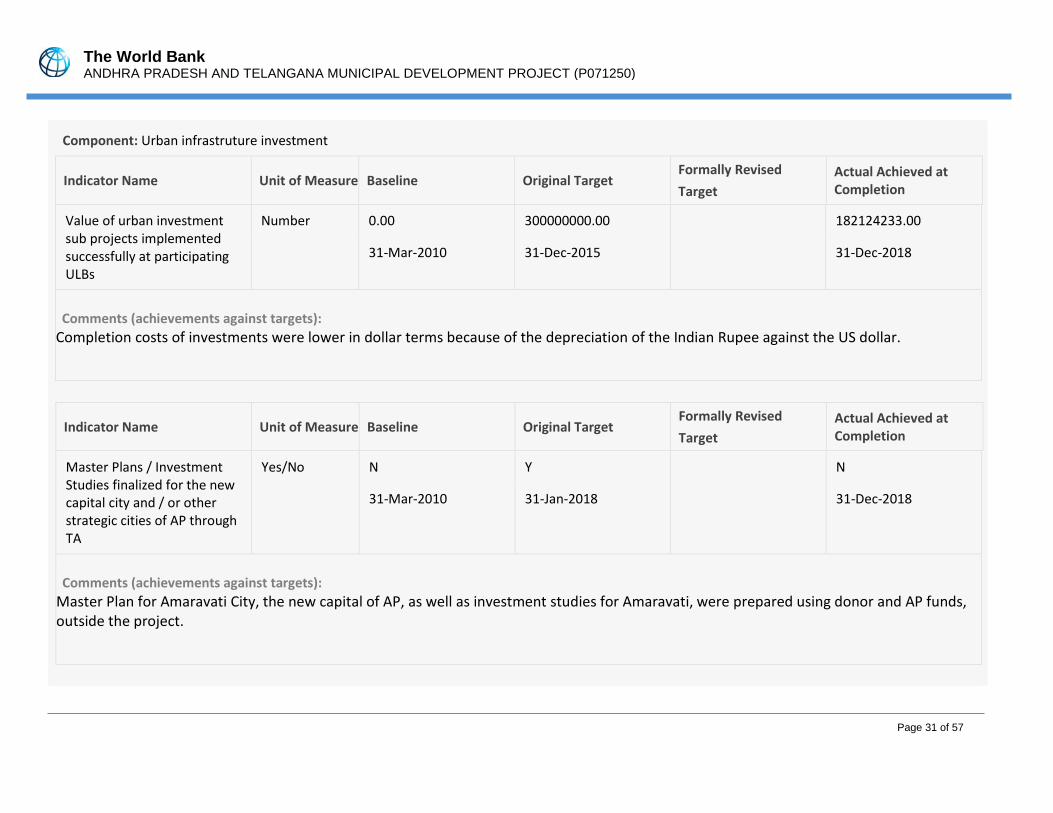
The World Bank ANDHRA PRADESH AND TELANGANA MUNICIPAL DEVELOPMENT PROJECT (P071250)
Page 31 of 57
Component: Urban infrastruture investment
Indicator Name Unit of Measure Baseline Original Target Formally Revised Target
Actual Achieved at Completion
Value of urban investment sub projects implemented successfully at participating ULBs
Number 0.00 300000000.00 182124233.00
31-Mar-2010 31-Dec-2015 31-Dec-2018
Comments (achievements against targets): Completion costs of investments were lower in dollar terms because of the depreciation of the Indian Rupee against the US dollar.
Indicator Name Unit of Measure Baseline Original Target Formally Revised Target
Actual Achieved at Completion
Master Plans / Investment Studies finalized for the new capital city and / or other strategic cities of AP through TA
Yes/No N Y N
31-Mar-2010 31-Jan-2018 31-Dec-2018
Comments (achievements against targets): Master Plan for Amaravati City, the new capital of AP, as well as investment studies for Amaravati, were prepared using donor and AP funds, outside the project.
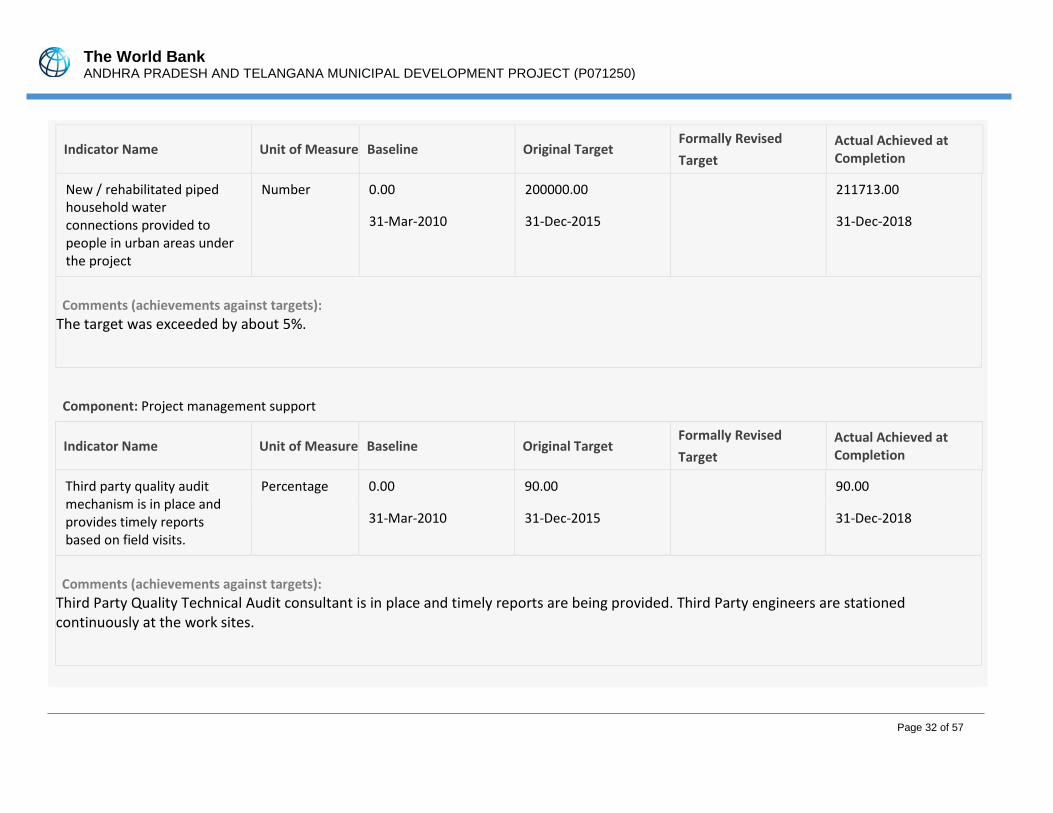
The World Bank ANDHRA PRADESH AND TELANGANA MUNICIPAL DEVELOPMENT PROJECT (P071250)
Page 32 of 57
Indicator Name Unit of Measure Baseline Original Target Formally Revised Target
Actual Achieved at Completion
New / rehabilitated piped household water connections provided to people in urban areas under the project
Number 0.00 200000.00 211713.00
31-Mar-2010 31-Dec-2015 31-Dec-2018
Comments (achievements against targets): The target was exceeded by about 5%.
Component: Project management support
Indicator Name Unit of Measure Baseline Original Target Formally Revised Target
Actual Achieved at Completion
Third party quality audit mechanism is in place and provides timely reports based on field visits.
Percentage 0.00 90.00 90.00
31-Mar-2010 31-Dec-2015 31-Dec-2018
Comments (achievements against targets): Third Party Quality Technical Audit consultant is in place and timely reports are being provided. Third Party engineers are stationed continuously at the work sites.
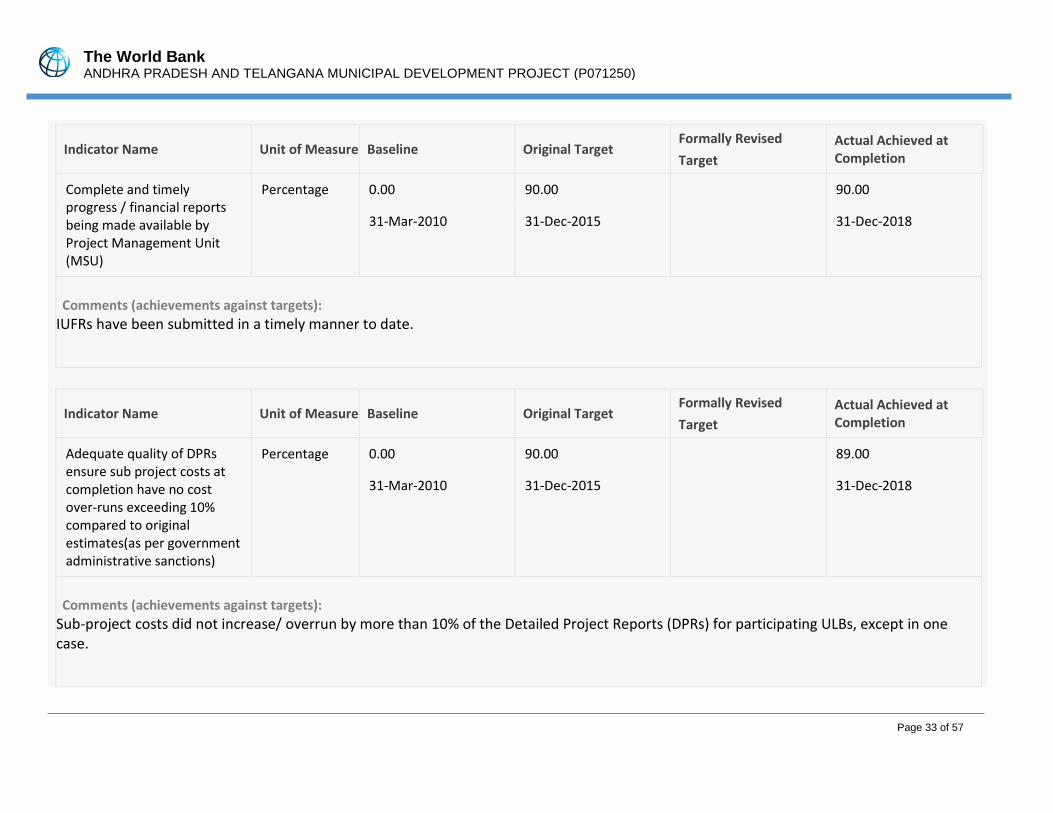
The World Bank ANDHRA PRADESH AND TELANGANA MUNICIPAL DEVELOPMENT PROJECT (P071250)
Page 33 of 57
Indicator Name Unit of Measure Baseline Original Target Formally Revised Target
Actual Achieved at Completion
Complete and timely progress / financial reports being made available by Project Management Unit (MSU)
Percentage 0.00 90.00 90.00
31-Mar-2010 31-Dec-2015 31-Dec-2018
Comments (achievements against targets): IUFRs have been submitted in a timely manner to date.
Indicator Name Unit of Measure Baseline Original Target Formally Revised Target
Actual Achieved at Completion
Adequate quality of DPRs ensure sub project costs at completion have no cost over-runs exceeding 10% compared to original estimates(as per government administrative sanctions)
Percentage 0.00 90.00 89.00
31-Mar-2010 31-Dec-2015 31-Dec-2018
Comments (achievements against targets): Sub-project costs did not increase/ overrun by more than 10% of the Detailed Project Reports (DPRs) for participating ULBs, except in one case.
The World Bank ANDHRA PRADESH AND TELANGANA MUNICIPAL DEVELOPMENT PROJECT (P071250)
Page 34 of 57
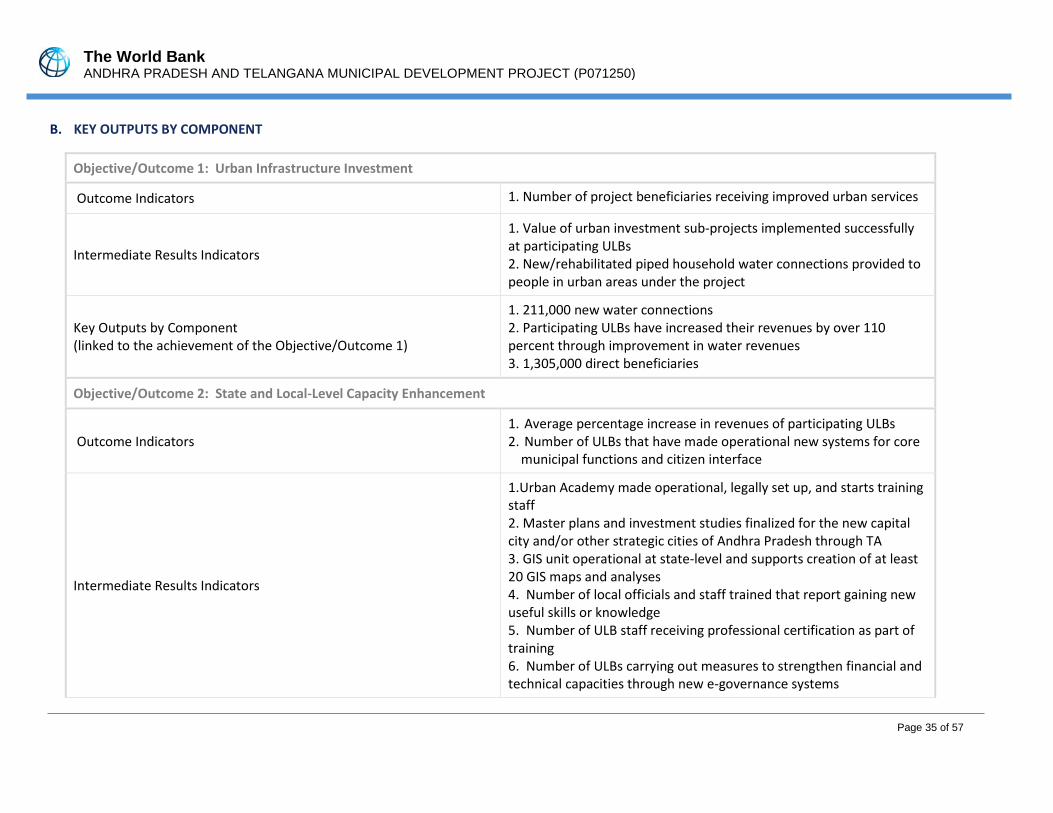
The World Bank ANDHRA PRADESH AND TELANGANA MUNICIPAL DEVELOPMENT PROJECT (P071250)
Page 35 of 57
B. KEY OUTPUTS BY COMPONENT
Objective/Outcome 1: Urban Infrastructure Investment
Outcome Indicators 1. Number of project beneficiaries receiving improved urban services
Intermediate Results Indicators
1. Value of urban investment sub-projects implemented successfully at participating ULBs 2. New/rehabilitated piped household water connections provided to people in urban areas under the project
Key Outputs by Component (linked to the achievement of the Objective/Outcome 1)
1. 211,000 new water connections 2. Participating ULBs have increased their revenues by over 110 percent through improvement in water revenues 3. 1,305,000 direct beneficiaries
Objective/Outcome 2: State and Local-Level Capacity Enhancement
Outcome Indicators 1. Average percentage increase in revenues of participating ULBs 2. Number of ULBs that have made operational new systems for core
municipal functions and citizen interface
Intermediate Results Indicators
1.Urban Academy made operational, legally set up, and starts training staff 2. Master plans and investment studies finalized for the new capital city and/or other strategic cities of Andhra Pradesh through TA 3. GIS unit operational at state-level and supports creation of at least 20 GIS maps and analyses 4. Number of local officials and staff trained that report gaining new useful skills or knowledge 5. Number of ULB staff receiving professional certification as part of training 6. Number of ULBs carrying out measures to strengthen financial and technical capacities through new e-governance systems
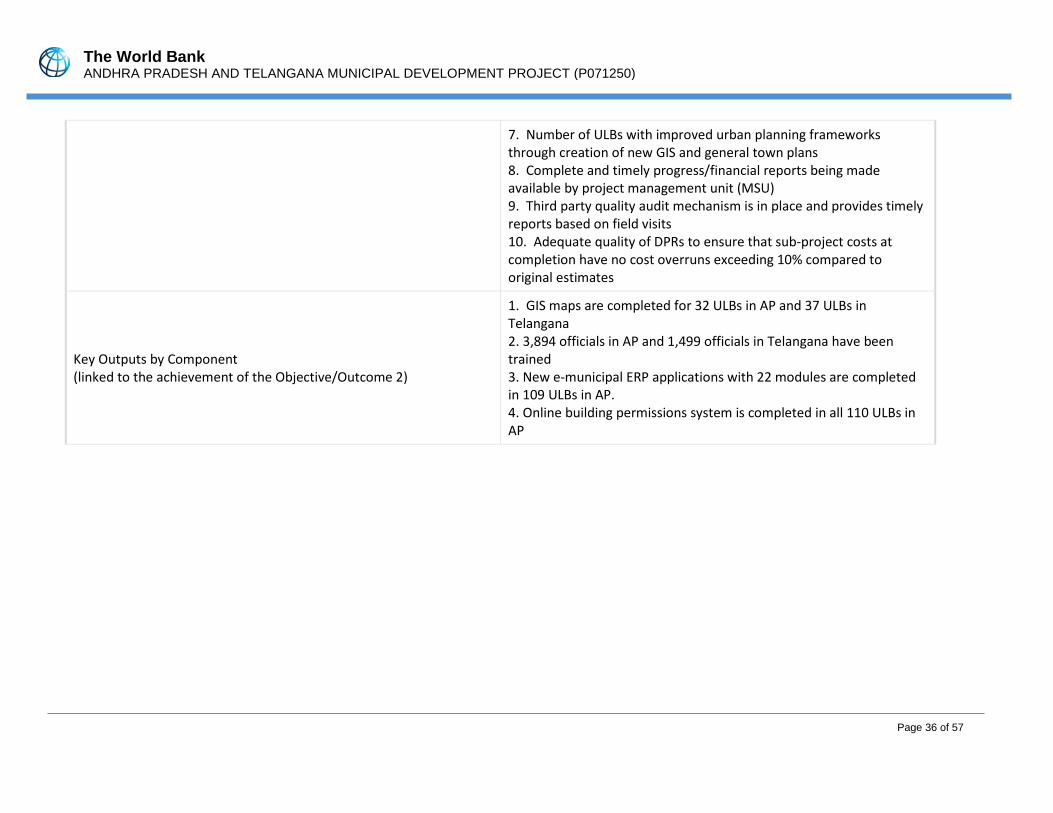
The World Bank ANDHRA PRADESH AND TELANGANA MUNICIPAL DEVELOPMENT PROJECT (P071250)
Page 36 of 57
7. Number of ULBs with improved urban planning frameworks through creation of new GIS and general town plans 8. Complete and timely progress/financial reports being made available by project management unit (MSU) 9. Third party quality audit mechanism is in place and provides timely reports based on field visits 10. Adequate quality of DPRs to ensure that sub-project costs at completion have no cost overruns exceeding 10% compared to original estimates
Key Outputs by Component (linked to the achievement of the Objective/Outcome 2)
1. GIS maps are completed for 32 ULBs in AP and 37 ULBs in Telangana 2. 3,894 officials in AP and 1,499 officials in Telangana have been trained 3. New e-municipal ERP applications with 22 modules are completed in 109 ULBs in AP. 4. Online building permissions system is completed in all 110 ULBs in AP
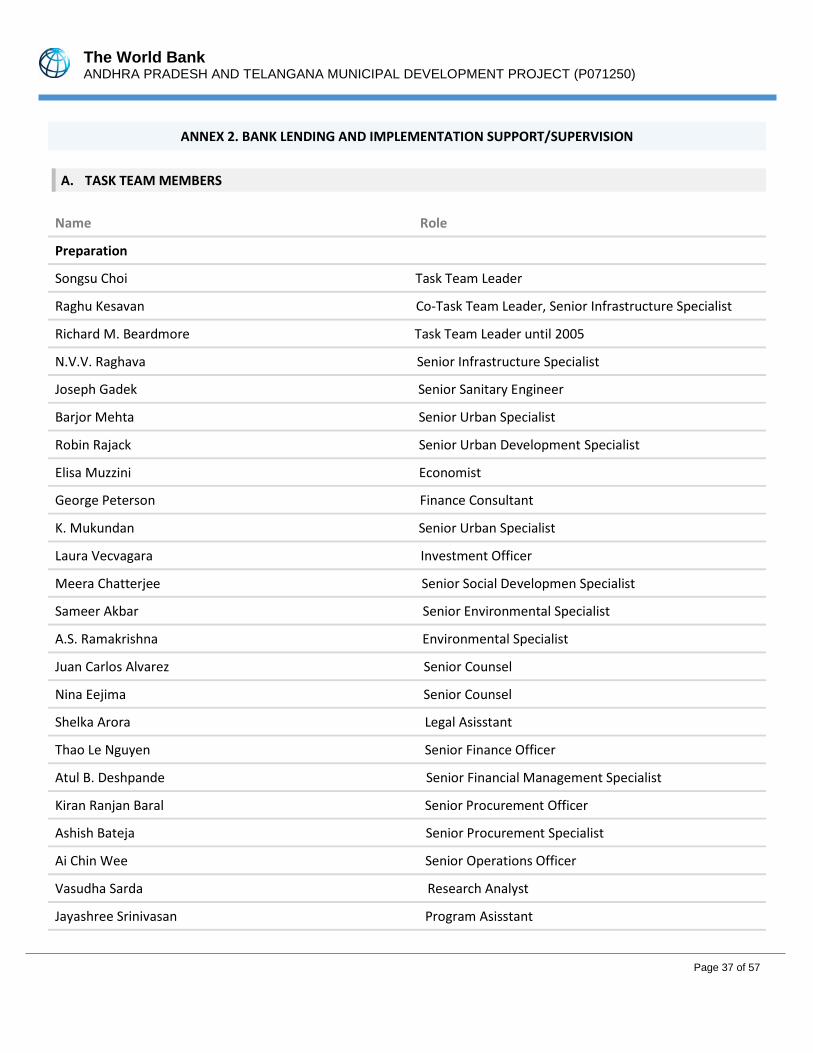
The World Bank ANDHRA PRADESH AND TELANGANA MUNICIPAL DEVELOPMENT PROJECT (P071250)
Page 37 of 57
ANNEX 2. BANK LENDING AND IMPLEMENTATION SUPPORT/SUPERVISION
A. TASK TEAM MEMBERS
Name Role
Preparation
Songsu Choi Task Team Leader
Raghu Kesavan Co-Task Team Leader, Senior Infrastructure Specialist
Richard M. Beardmore Task Team Leader until 2005
N.V.V. Raghava Senior Infrastructure Specialist
Joseph Gadek Senior Sanitary Engineer
Barjor Mehta Senior Urban Specialist
Robin Rajack Senior Urban Development Specialist
Elisa Muzzini Economist
George Peterson Finance Consultant
K. Mukundan Senior Urban Specialist
Laura Vecvagara Investment Officer
Meera Chatterjee Senior Social Developmen Specialist
Sameer Akbar Senior Environmental Specialist
A.S. Ramakrishna Environmental Specialist
Juan Carlos Alvarez Senior Counsel
Nina Eejima Senior Counsel
Shelka Arora Legal Asisstant
Thao Le Nguyen Senior Finance Officer
Atul B. Deshpande Senior Financial Management Specialist
Kiran Ranjan Baral Senior Procurement Officer
Ashish Bateja Senior Procurement Specialist
Ai Chin Wee Senior Operations Officer
Vasudha Sarda Research Analyst
Jayashree Srinivasan Program Asisstant
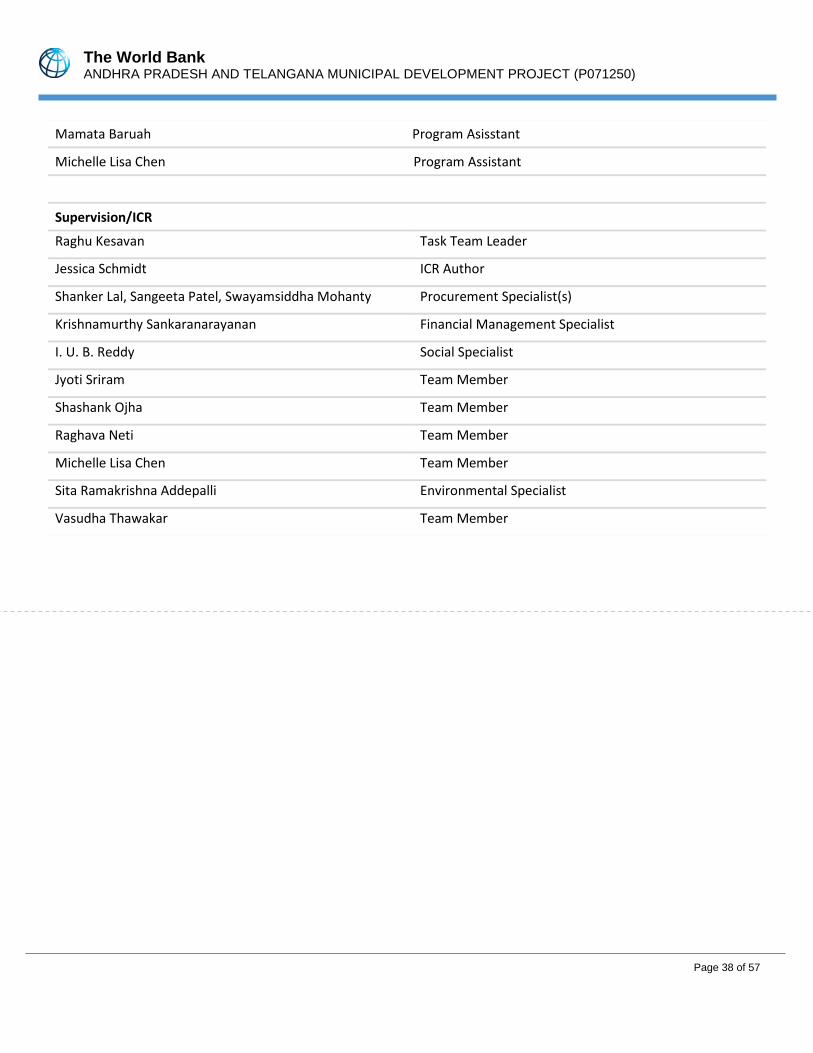
The World Bank ANDHRA PRADESH AND TELANGANA MUNICIPAL DEVELOPMENT PROJECT (P071250)
Page 38 of 57
Mamata Baruah Program Asisstant
Michelle Lisa Chen Program Assistant
Supervision/ICR
Raghu Kesavan Task Team Leader
Jessica Schmidt ICR Author
Shanker Lal, Sangeeta Patel, Swayamsiddha Mohanty Procurement Specialist(s)
Krishnamurthy Sankaranarayanan Financial Management Specialist
I. U. B. Reddy Social Specialist
Jyoti Sriram Team Member
Shashank Ojha Team Member
Raghava Neti Team Member
Michelle Lisa Chen Team Member
Sita Ramakrishna Addepalli Environmental Specialist
Vasudha Thawakar Team Member
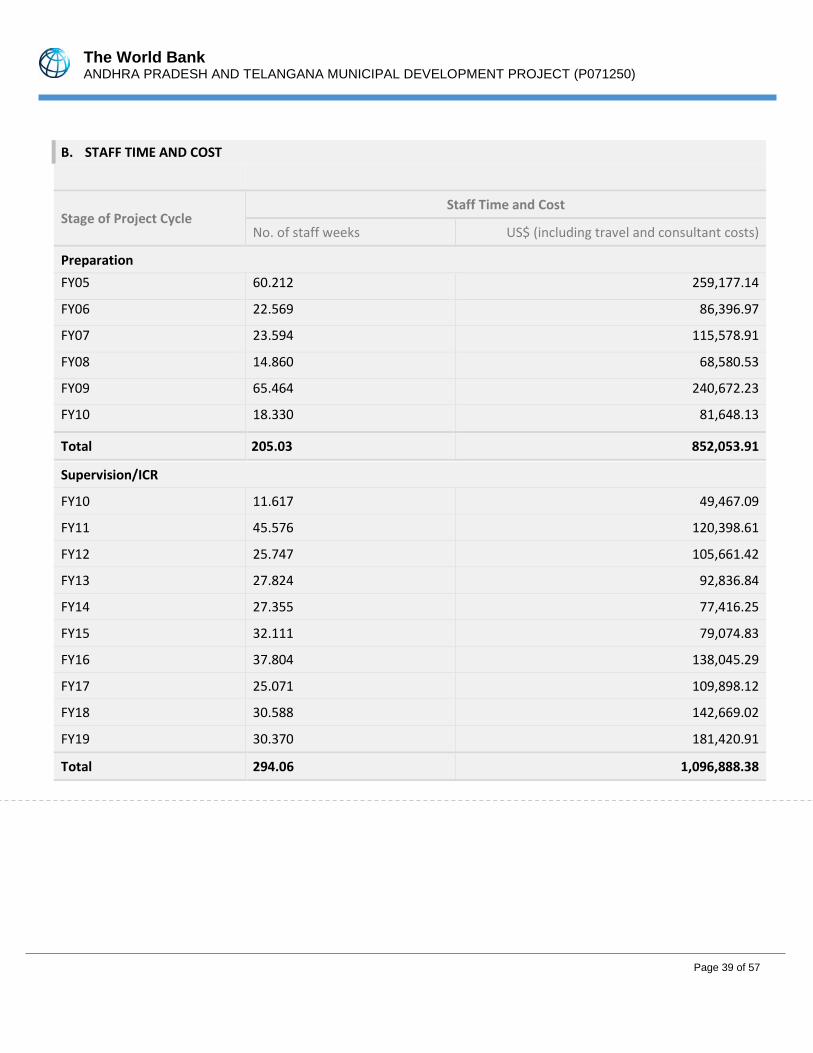
The World Bank ANDHRA PRADESH AND TELANGANA MUNICIPAL DEVELOPMENT PROJECT (P071250)
Page 39 of 57
B. STAFF TIME AND COST
Stage of Project Cycle Staff Time and Cost
No. of staff weeks US$ (including travel and consultant costs)
Preparation FY05 60.212 259,177.14
FY06 22.569 86,396.97
FY07 23.594 115,578.91
FY08 14.860 68,580.53
FY09 65.464 240,672.23
FY10 18.330 81,648.13
Total 205.03 852,053.91
Supervision/ICR
FY10 11.617 49,467.09
FY11 45.576 120,398.61
FY12 25.747 105,661.42
FY13 27.824 92,836.84
FY14 27.355 77,416.25
FY15 32.111 79,074.83
FY16 37.804 138,045.29
FY17 25.071 109,898.12
FY18 30.588 142,669.02
FY19 30.370 181,420.91
Total 294.06 1,096,888.38
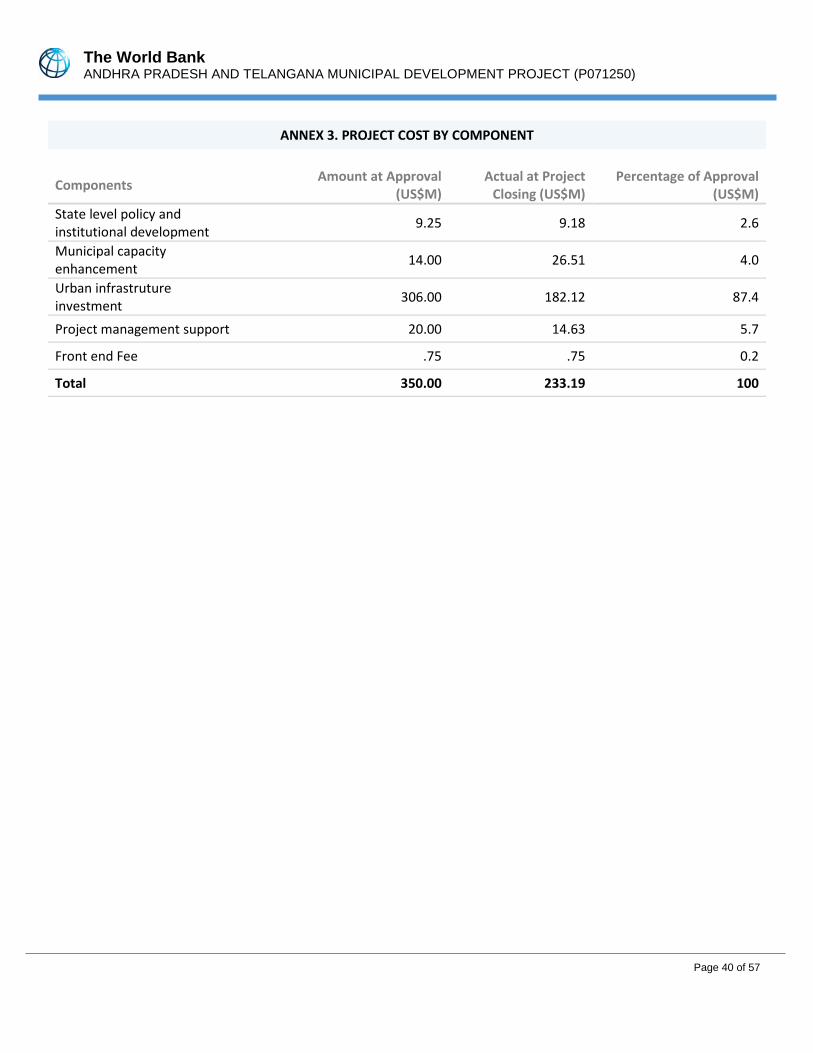
The World Bank ANDHRA PRADESH AND TELANGANA MUNICIPAL DEVELOPMENT PROJECT (P071250)
Page 40 of 57
ANNEX 3. PROJECT COST BY COMPONENT
Components Amount at Approval (US$M)
Actual at Project Closing (US$M)
Percentage of Approval (US$M)
State level policy and institutional development 9.25 9.18 2.6
Municipal capacity enhancement 14.00 26.51 4.0
Urban infrastruture investment 306.00 182.12 87.4
Project management support 20.00 14.63 5.7
Front end Fee .75 .75 0.2
Total 350.00 233.19 100
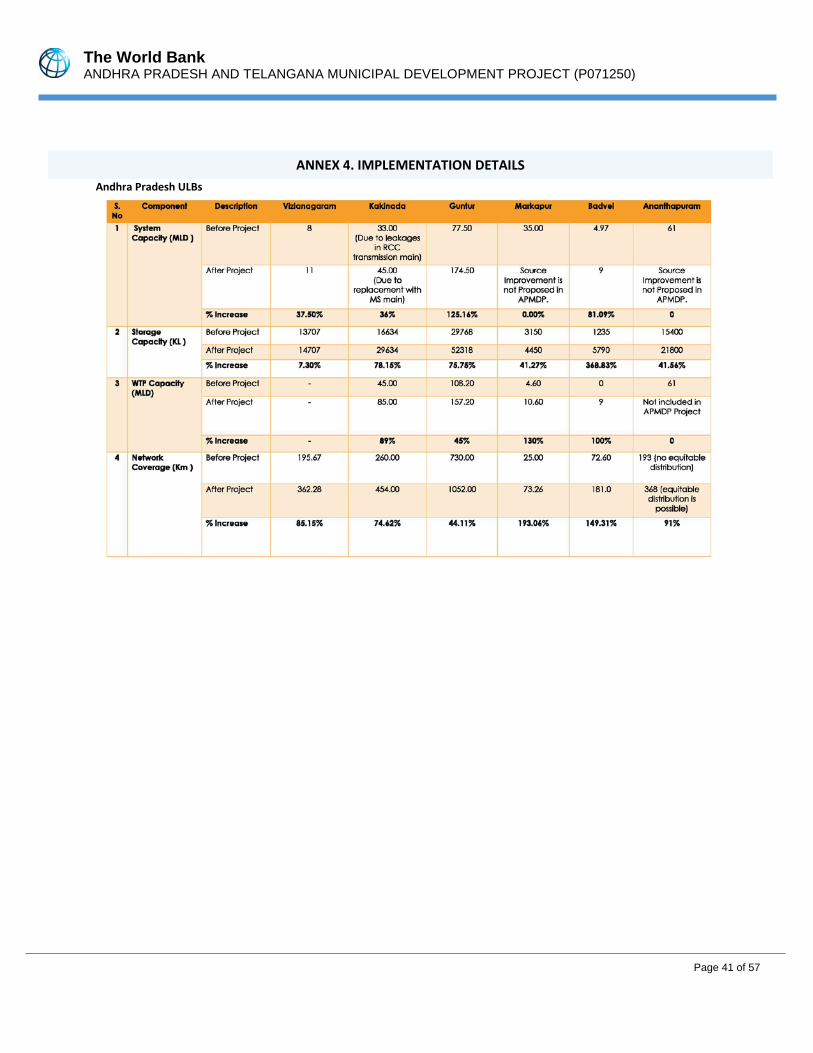
The World Bank ANDHRA PRADESH AND TELANGANA MUNICIPAL DEVELOPMENT PROJECT (P071250)
Page 41 of 57
ANNEX 4. IMPLEMENTATION DETAILS Andhra Pradesh ULBs
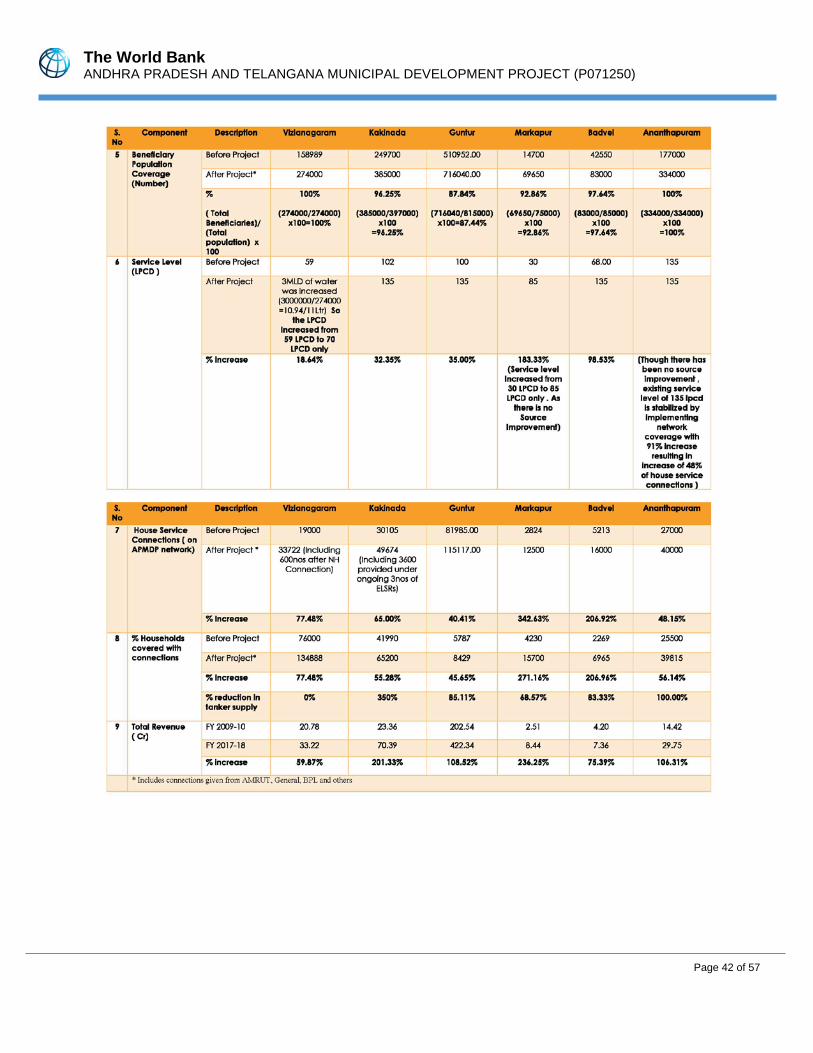
The World Bank ANDHRA PRADESH AND TELANGANA MUNICIPAL DEVELOPMENT PROJECT (P071250)
Page 42 of 57
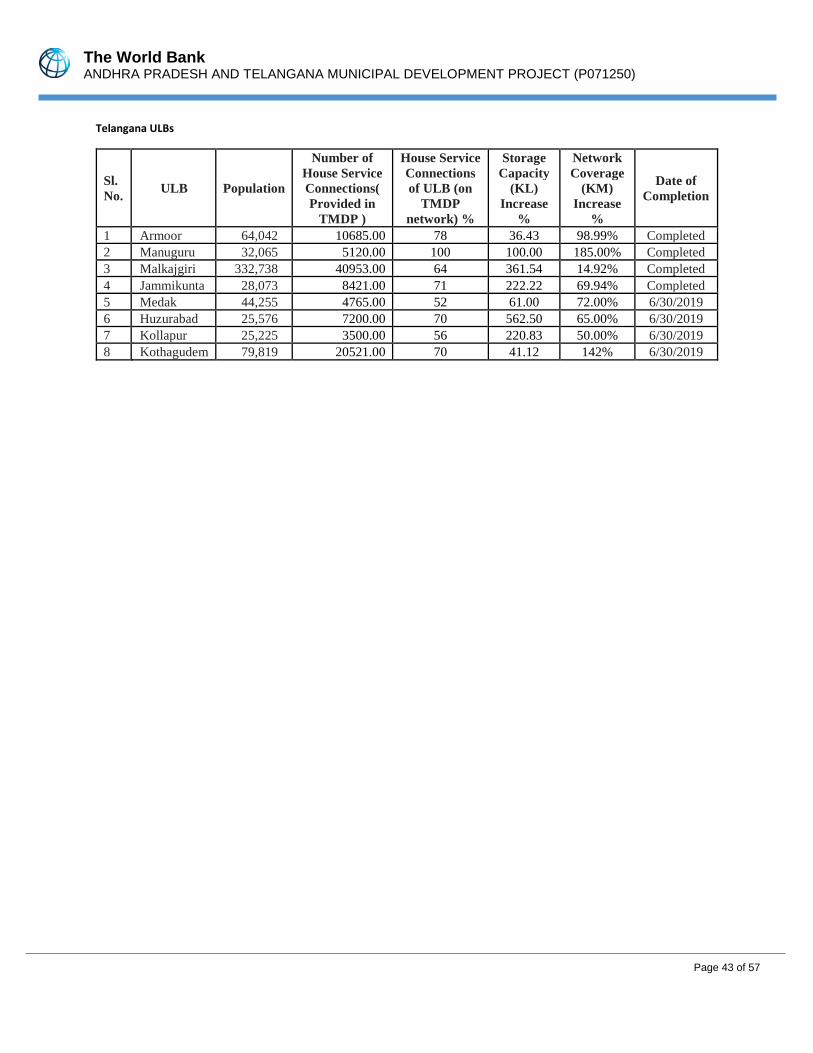
The World Bank ANDHRA PRADESH AND TELANGANA MUNICIPAL DEVELOPMENT PROJECT (P071250)
Page 43 of 57
Telangana ULBs
Sl. No.
ULB Population
Number of House Service Connections( Provided in
TMDP )
House Service Connections of ULB (on
TMDP network) %
Storage Capacity
(KL) Increase
%
Network Coverage
(KM) Increase
%
Date of Completion
1 Armoor 64,042 10685.00 78 36.43 98.99% Completed 2 Manuguru 32,065 5120.00 100 100.00 185.00% Completed 3 Malkajgiri 332,738 40953.00 64 361.54 14.92% Completed 4 Jammikunta 28,073 8421.00 71 222.22 69.94% Completed 5 Medak 44,255 4765.00 52 61.00 72.00% 6/30/2019 6 Huzurabad 25,576 7200.00 70 562.50 65.00% 6/30/2019 7 Kollapur 25,225 3500.00 56 220.83 50.00% 6/30/2019 8 Kothagudem 79,819 20521.00 70 41.12 142% 6/30/2019
The World Bank ANDHRA PRADESH AND TELANGANA MUNICIPAL DEVELOPMENT PROJECT (P071250)
Page 44 of 57
ANNEX 5. EFFICIENCY ANALYSIS
Assessment of Efficiency and Rating
1. An economic analysis was carried out to evaluate economic value of the investments implemented under the Project. The evaluation was conducted independently for AP and Telangana States to account for the 2014 bifurcation and creation of Telangana State, as well as for the Project overall.
Economic Analysis at Appraisal
2. Of the four components identified under APTMDP, Component C “Urban Infrastructure Investment” was the bulk of the funding with an allocation of US$306 million and a primary focus on infrastructure. Investments were planned to complement the on-going schemes by GoI and DFID project. In addition, only sub-projects with action plans to improve the ULB’s financial and operational capacities and for operations and maintenance, were proposed.
3. Sub-projects were not identified at appraisal. As the sub-projects were to be identified and designed by the yet-to-be-named ULBs, economic analysis for individual sub-projects or the Project could not be carried out. However, a guideline framework, in line with the Project objectives, for ULB and sub-project selection was provided to ensure that the Project be demand-driven:
• Audit of municipal accounts be satisfactory and up to date • Formal agreement to carry out the agreed action plan for the municipal reform, financial and services
improvement plan and capacity building • Current account surplus sufficient to meet the debt service obligations and O&M expenses, of more than
15% of the sub-projects based on audited accounts, agreeable to Commissioner and Director of Municipal Administration (CDMA)
• Formal commitment for Municipal Reform Action Plan (MRCP) with Andhra Pradesh Urban Finance and Infrastructure Development Corporation (APUFIDC) and CDMA through municipal council resolution; and
• Quantitative cost-benefit analysis/efficiency analysis carried out for sub-projects costing more than US$ 3.14 million (Rs 15 crores)
4. Although adequate provisions were made for the efficient investment in the urban infrastructure investments under the Project, no quantitative cost benefit analysis (CBA) was done during preparation, appraisal, or implementation.
Economic Analysis at Completion
5. Since there was no economic analysis carried out at the processing stage, a fresh economic analysis is being carried out at completion for all completed water supply sub-projects in AP and Telangana. CBA was carried out following the methodology applicable for water supply sub-projects and input assumptions relevant to sub-projects and used in other studies in the region. The aggregate cost of the interventions evaluated at completion for urban infrastructure investment corresponds to approximately 88 percent of total Project expenditures. Though project documentation at appraisal had suggested Component C would consist of investment in different sectors, only water
The World Bank ANDHRA PRADESH AND TELANGANA MUNICIPAL DEVELOPMENT PROJECT (P071250)
Page 45 of 57
supply sub-projects were selected. All completed water supply sub-projects in the 6 ULBs in AP and 8 in Telangana have been evaluated.
6. The completed water supply sub-projects include water source augmentation, improvement of treatment and storage facilities, rehabilitation and extension of the network, and household connections to achieve 100 percent coverage with 135 liters per capita per day (LPCD). Prior to the project, coverage was between 21 and 75 percent in AP ULBs with average per capital piped water supply ranging between 27 and 100 LPCD. Coverage in Telangana ULBS was 0-92 percent with supply ranging between 0 and 85 LPCD. In AP, average water consumption was 87.6 LPCD, in which 78.1 LPCD was provided from piped water; and of the 88.2 LPCD consumption in Telangana, 67.6 LPCD was from piped water, meaning that an average of 9.5 and 20.6 LPCD in AP and Telangana respectively was supplemented from other sources. The resource cost of these supplemental sources is treated as a non-incremental benefit. Any additional water above the present consumption of 87.6 LPCD (AP) and 88.2 LPCD (Telangana) is treated as an incremental benefit. Savings in resource cost, time to collect water from alternate sources, and household health expenditures and earning, and earning loss due to sick days from waterborne diseases are the benefits considered for non-incremental water supply. The average unit cost for incremental water is estimated through the willingness to pay (WTP) will be the benefit considered for “incremental water.”
a. Time saved in water collection. Investment through water supply sub-projects interventions carried out under the Project has reduced the amount of time beneficiaries spend collecting water. The analysis used estimated time saved in collection (80 percent of the reported collection time) multiplied by the opportunity cost of prevailing wage rate for unskilled labor (only 50 percent of the wage rate during non-working hours). b. Savings in resource cost for the replaced water from other sources. Further analysis of the supplemental water (9.5 for AP, 20.6 for Telangana) was done to understand the costs of the various sources. Using an estimated unit rate of resource costs for different sources (US$ 0.11 (Rs. 7.75)/kl for open well; US$ 0.17 (Rs 11.62)/kl for borewell; US$ 25.59 (Rs 1750) for bottled water; and US$ 1.02 (Rs. 69.81)/kl for tanker water), this was multiplied by the annual quantity of replaced water from different sources to calculate the resource cost of the replaced supplemental water. Since the water is replaced by the piped water supply under the “with project” scenario, the above resource cost spent during the “without project” is considered as savings to the project beneficiaries. c. Savings in earnings loss during sick days due to waterborne diseases. With an average household daily income of US$15.60 (Rs. 1,066.85) (US$ 4.01 (Rs. 273.97) for slums comprising approximately 33 percent of a ULB and US$20.91 (Rs. 1,429.95) for non-slums comprising 67 percent) in AP and US$16.24 (Rs. 1,110.69) (US$4.01 (Rs. 273.97) for slums comprising approximately 25 percent of a ULB and US$20.27 (Rs. 1,386.57) for non-slums comprising 75 percent) in Telangana and an average of seven working days lost per year, the average household annual earning loss due to waterborne diseases for the earning member was estimated. The savings in earning loss was estimated to be 25 percent, which was assigned to the water supply improvement.8
8 World Bank. 2009. ‘Water, Sanitation, and Hygiene Interventions to Combat Childhood Diarrhea in Developing Countries’. India
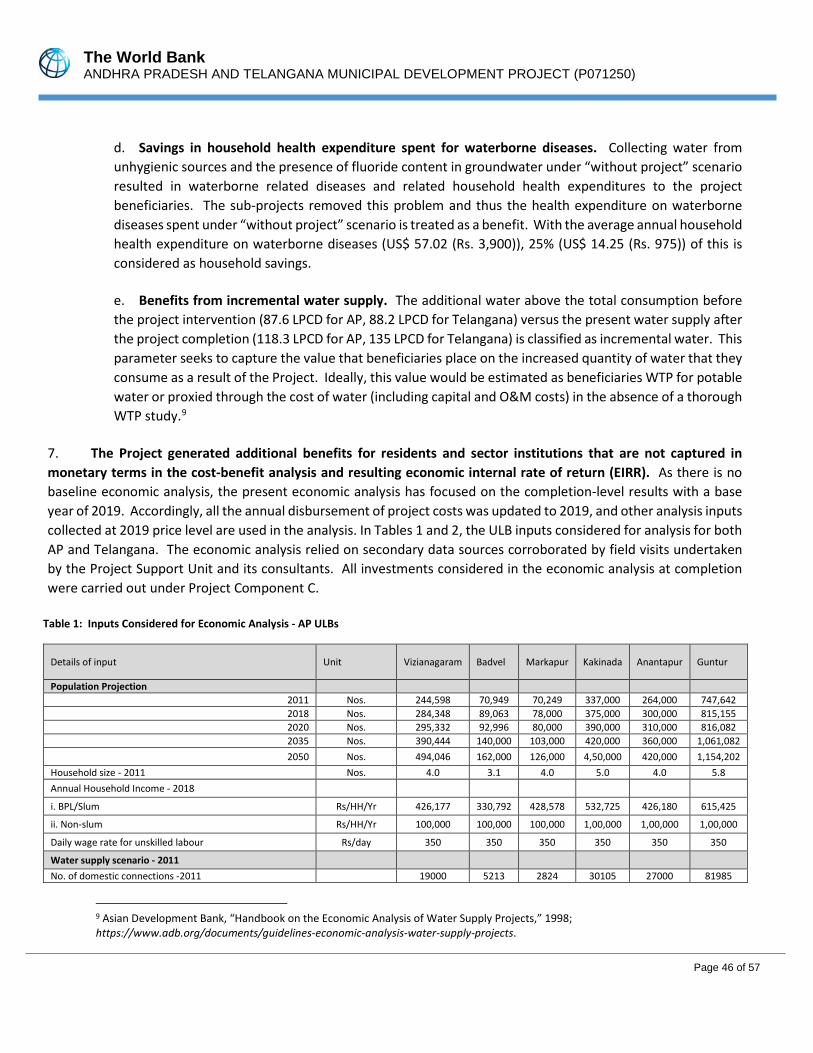
The World Bank ANDHRA PRADESH AND TELANGANA MUNICIPAL DEVELOPMENT PROJECT (P071250)
Page 46 of 57
d. Savings in household health expenditure spent for waterborne diseases. Collecting water from unhygienic sources and the presence of fluoride content in groundwater under “without project” scenario resulted in waterborne related diseases and related household health expenditures to the project beneficiaries. The sub-projects removed this problem and thus the health expenditure on waterborne diseases spent under “without project” scenario is treated as a benefit. With the average annual household health expenditure on waterborne diseases (US$ 57.02 (Rs. 3,900)), 25% (US$ 14.25 (Rs. 975)) of this is considered as household savings. e. Benefits from incremental water supply. The additional water above the total consumption before the project intervention (87.6 LPCD for AP, 88.2 LPCD for Telangana) versus the present water supply after the project completion (118.3 LPCD for AP, 135 LPCD for Telangana) is classified as incremental water. This parameter seeks to capture the value that beneficiaries place on the increased quantity of water that they consume as a result of the Project. Ideally, this value would be estimated as beneficiaries WTP for potable water or proxied through the cost of water (including capital and O&M costs) in the absence of a thorough WTP study.9
7. The Project generated additional benefits for residents and sector institutions that are not captured in monetary terms in the cost-benefit analysis and resulting economic internal rate of return (EIRR). As there is no baseline economic analysis, the present economic analysis has focused on the completion-level results with a base year of 2019. Accordingly, all the annual disbursement of project costs was updated to 2019, and other analysis inputs collected at 2019 price level are used in the analysis. In Tables 1 and 2, the ULB inputs considered for analysis for both AP and Telangana. The economic analysis relied on secondary data sources corroborated by field visits undertaken by the Project Support Unit and its consultants. All investments considered in the economic analysis at completion were carried out under Project Component C.
Table 1: Inputs Considered for Economic Analysis - AP ULBs
Details of input Unit Vizianagaram Badvel Markapur Kakinada Anantapur Guntur
Population Projection
2011 Nos. 244,598 70,949 70,249 337,000 264,000 747,642 2018 Nos. 284,348 89,063 78,000 375,000 300,000 815,155 2020 Nos. 295,332 92,996 80,000 390,000 310,000 816,082 2035 Nos. 390,444 140,000 103,000 420,000 360,000 1,061,082 2050 Nos. 494,046 162,000 126,000 4,50,000 420,000 1,154,202
Household size - 2011 Nos. 4.0 3.1 4.0 5.0 4.0 5.8 Annual Household Income - 2018
i. BPL/Slum Rs/HH/Yr 426,177 330,792 428,578 532,725 426,180 615,425
ii. Non-slum Rs/HH/Yr 100,000 100,000 100,000 1,00,000 1,00,000 1,00,000
Daily wage rate for unskilled labour Rs/day 350 350 350 350 350 350
Water supply scenario - 2011
No. of domestic connections -2011 19000 5213 2824 30105 27000 81985
9 Asian Development Bank, “Handbook on the Economic Analysis of Water Supply Projects,” 1998; https://www.adb.org/documents/guidelines-economic-analysis-water-supply-projects.
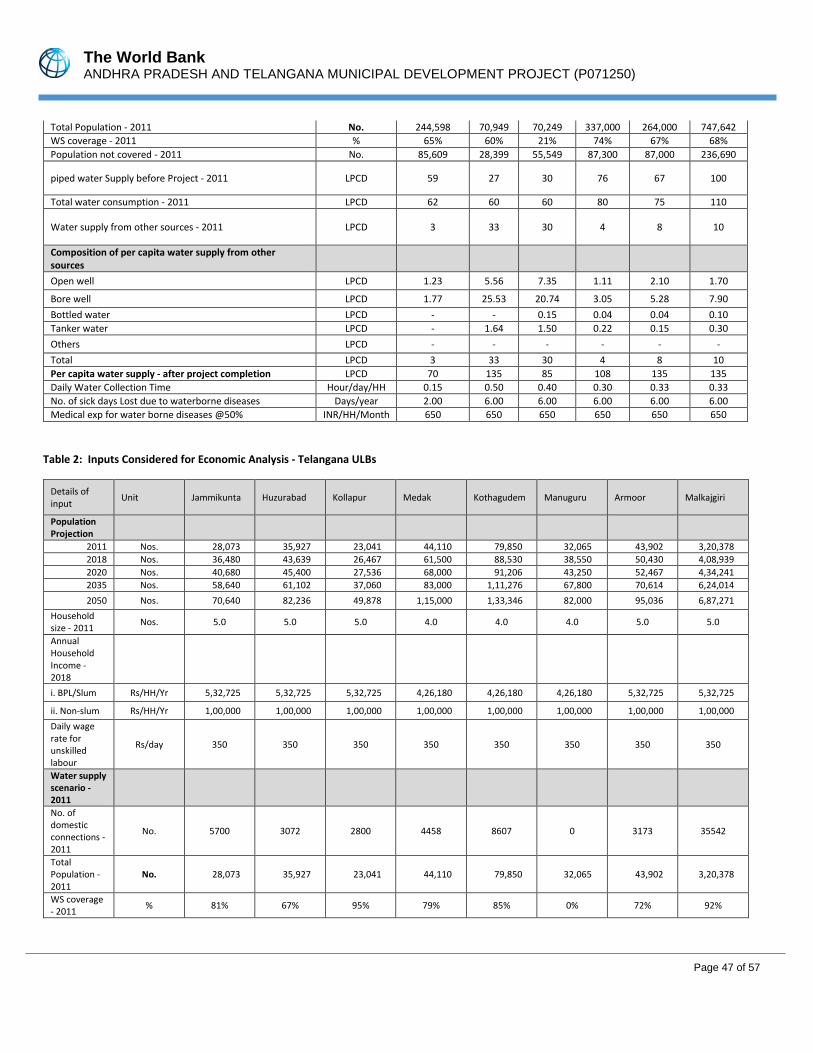
The World Bank ANDHRA PRADESH AND TELANGANA MUNICIPAL DEVELOPMENT PROJECT (P071250)
Page 47 of 57
Total Population - 2011 No. 244,598 70,949 70,249 337,000 264,000 747,642 WS coverage - 2011 % 65% 60% 21% 74% 67% 68% Population not covered - 2011 No. 85,609 28,399 55,549 87,300 87,000 236,690
piped water Supply before Project - 2011 LPCD 59 27 30 76 67 100
Total water consumption - 2011 LPCD 62 60 60 80 75 110
Water supply from other sources - 2011 LPCD 3 33 30 4 8 10
Composition of per capita water supply from other sources
Open well LPCD 1.23 5.56 7.35 1.11 2.10 1.70
Bore well LPCD 1.77 25.53 20.74 3.05 5.28 7.90 Bottled water LPCD - - 0.15 0.04 0.04 0.10 Tanker water LPCD - 1.64 1.50 0.22 0.15 0.30 Others LPCD - - - - - - Total LPCD 3 33 30 4 8 10 Per capita water supply - after project completion LPCD 70 135 85 108 135 135 Daily Water Collection Time Hour/day/HH 0.15 0.50 0.40 0.30 0.33 0.33 No. of sick days Lost due to waterborne diseases Days/year 2.00 6.00 6.00 6.00 6.00 6.00 Medical exp for water borne diseases @50% INR/HH/Month 650 650 650 650 650 650
Table 2: Inputs Considered for Economic Analysis - Telangana ULBs
Details of input Unit Jammikunta Huzurabad Kollapur Medak Kothagudem Manuguru Armoor Malkajgiri
Population Projection
2011 Nos. 28,073 35,927 23,041 44,110 79,850 32,065 43,902 3,20,378 2018 Nos. 36,480 43,639 26,467 61,500 88,530 38,550 50,430 4,08,939 2020 Nos. 40,680 45,400 27,536 68,000 91,206 43,250 52,467 4,34,241 2035 Nos. 58,640 61,102 37,060 83,000 1,11,276 67,800 70,614 6,24,014 2050 Nos. 70,640 82,236 49,878 1,15,000 1,33,346 82,000 95,036 6,87,271
Household size - 2011 Nos. 5.0 5.0 5.0 4.0 4.0 4.0 5.0 5.0
Annual Household Income - 2018
i. BPL/Slum Rs/HH/Yr 5,32,725 5,32,725 5,32,725 4,26,180 4,26,180 4,26,180 5,32,725 5,32,725
ii. Non-slum Rs/HH/Yr 1,00,000 1,00,000 1,00,000 1,00,000 1,00,000 1,00,000 1,00,000 1,00,000 Daily wage rate for unskilled labour
Rs/day 350 350 350 350 350 350 350 350
Water supply scenario - 2011
No. of domestic connections -2011
No. 5700 3072 2800 4458 8607 0 3173 35542
Total Population - 2011
No. 28,073 35,927 23,041 44,110 79,850 32,065 43,902 3,20,378
WS coverage - 2011 % 81% 67% 95% 79% 85% 0% 72% 92%
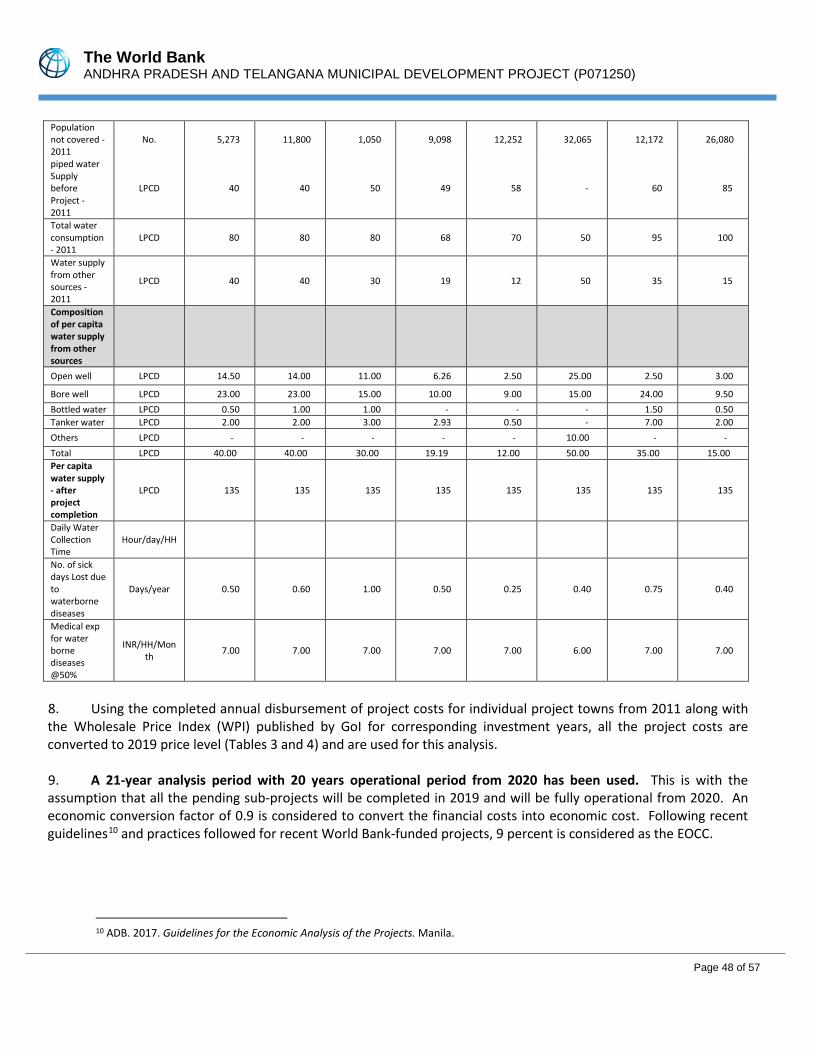
The World Bank ANDHRA PRADESH AND TELANGANA MUNICIPAL DEVELOPMENT PROJECT (P071250)
Page 48 of 57
Population not covered - 2011
No. 5,273 11,800 1,050 9,098 12,252 32,065 12,172 26,080
piped water Supply before Project - 2011
LPCD 40 40 50 49 58 - 60 85
Total water consumption - 2011
LPCD 80 80 80 68 70 50 95 100
Water supply from other sources - 2011
LPCD 40 40 30 19 12 50 35 15
Composition of per capita water supply from other sources
Open well LPCD 14.50 14.00 11.00 6.26 2.50 25.00 2.50 3.00
Bore well LPCD 23.00 23.00 15.00 10.00 9.00 15.00 24.00 9.50 Bottled water LPCD 0.50 1.00 1.00 - - - 1.50 0.50 Tanker water LPCD 2.00 2.00 3.00 2.93 0.50 - 7.00 2.00 Others LPCD - - - - - 10.00 - - Total LPCD 40.00 40.00 30.00 19.19 12.00 50.00 35.00 15.00 Per capita water supply - after project completion
LPCD 135 135 135 135 135 135 135 135
Daily Water Collection Time
Hour/day/HH
No. of sick days Lost due to waterborne diseases
Days/year 0.50 0.60 1.00 0.50 0.25 0.40 0.75 0.40
Medical exp for water borne diseases @50%
INR/HH/Month 7.00 7.00 7.00 7.00 7.00 6.00 7.00 7.00
8. Using the completed annual disbursement of project costs for individual project towns from 2011 along with the Wholesale Price Index (WPI) published by GoI for corresponding investment years, all the project costs are converted to 2019 price level (Tables 3 and 4) and are used for this analysis.
9. A 21-year analysis period with 20 years operational period from 2020 has been used. This is with the assumption that all the pending sub-projects will be completed in 2019 and will be fully operational from 2020. An economic conversion factor of 0.9 is considered to convert the financial costs into economic cost. Following recent guidelines10 and practices followed for recent World Bank-funded projects, 9 percent is considered as the EOCC.
10 ADB. 2017. Guidelines for the Economic Analysis of the Projects. Manila.
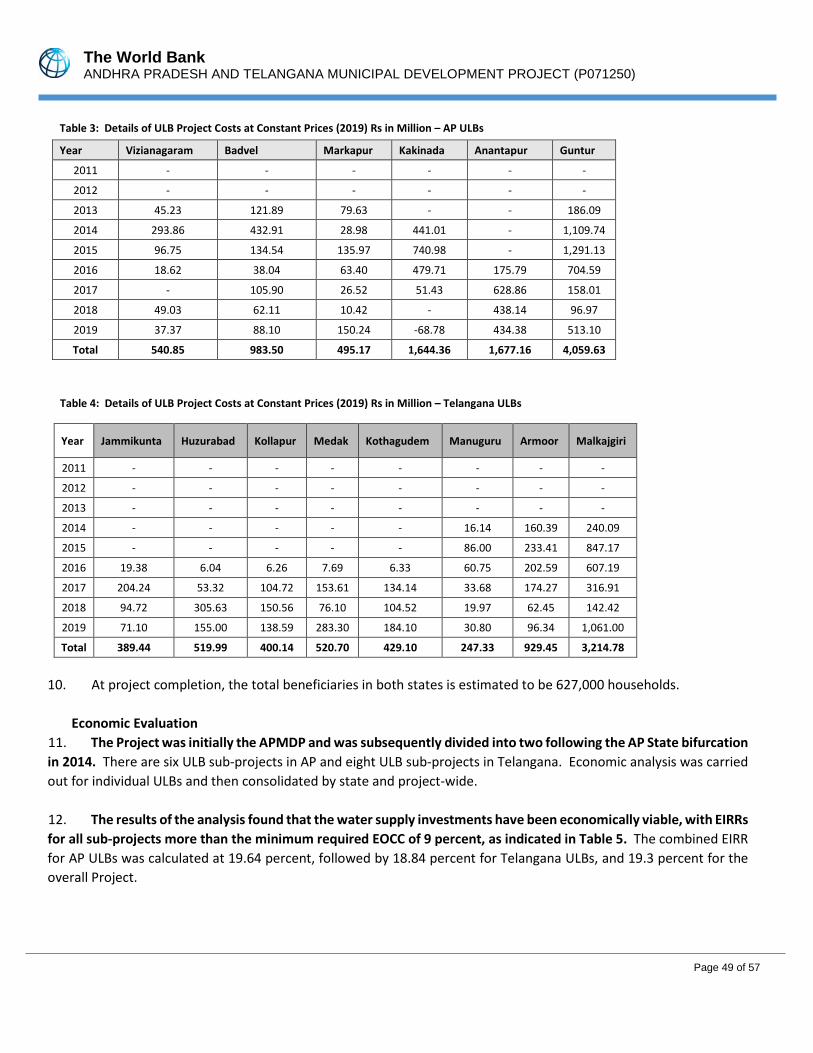
The World Bank ANDHRA PRADESH AND TELANGANA MUNICIPAL DEVELOPMENT PROJECT (P071250)
Page 49 of 57
Table 3: Details of ULB Project Costs at Constant Prices (2019) Rs in Million – AP ULBs
Year Vizianagaram Badvel Markapur Kakinada Anantapur Guntur
2011 - - - - - -
2012 - - - - - -
2013 45.23 121.89 79.63 - - 186.09
2014 293.86 432.91 28.98 441.01 - 1,109.74
2015 96.75 134.54 135.97 740.98 - 1,291.13
2016 18.62 38.04 63.40 479.71 175.79 704.59
2017 - 105.90 26.52 51.43 628.86 158.01
2018 49.03 62.11 10.42 - 438.14 96.97
2019 37.37 88.10 150.24 -68.78 434.38 513.10
Total 540.85 983.50 495.17 1,644.36 1,677.16 4,059.63
Table 4: Details of ULB Project Costs at Constant Prices (2019) Rs in Million – Telangana ULBs
Year Jammikunta Huzurabad Kollapur Medak Kothagudem Manuguru Armoor Malkajgiri
2011 - - - - - - - -
2012 - - - - - - - -
2013 - - - - - - - -
2014 - - - - - 16.14 160.39 240.09
2015 - - - - - 86.00 233.41 847.17
2016 19.38 6.04 6.26 7.69 6.33 60.75 202.59 607.19
2017 204.24 53.32 104.72 153.61 134.14 33.68 174.27 316.91
2018 94.72 305.63 150.56 76.10 104.52 19.97 62.45 142.42
2019 71.10 155.00 138.59 283.30 184.10 30.80 96.34 1,061.00
Total 389.44 519.99 400.14 520.70 429.10 247.33 929.45 3,214.78
10. At project completion, the total beneficiaries in both states is estimated to be 627,000 households.
Economic Evaluation
11. The Project was initially the APMDP and was subsequently divided into two following the AP State bifurcation in 2014. There are six ULB sub-projects in AP and eight ULB sub-projects in Telangana. Economic analysis was carried out for individual ULBs and then consolidated by state and project-wide.
12. The results of the analysis found that the water supply investments have been economically viable, with EIRRs for all sub-projects more than the minimum required EOCC of 9 percent, as indicated in Table 5. The combined EIRR for AP ULBs was calculated at 19.64 percent, followed by 18.84 percent for Telangana ULBs, and 19.3 percent for the overall Project.
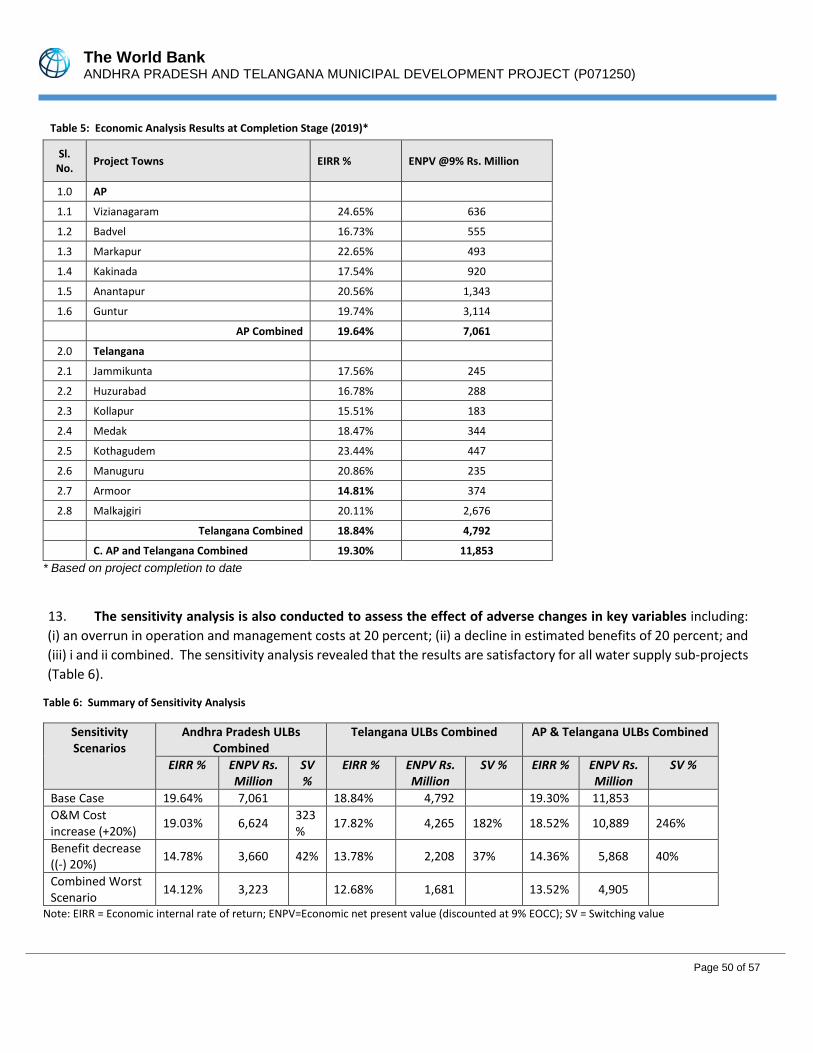
The World Bank ANDHRA PRADESH AND TELANGANA MUNICIPAL DEVELOPMENT PROJECT (P071250)
Page 50 of 57
Table 5: Economic Analysis Results at Completion Stage (2019)*
Sl. No. Project Towns EIRR % ENPV @9% Rs. Million
1.0 AP
1.1 Vizianagaram 24.65% 636
1.2 Badvel 16.73% 555
1.3 Markapur 22.65% 493
1.4 Kakinada 17.54% 920
1.5 Anantapur 20.56% 1,343
1.6 Guntur 19.74% 3,114
AP Combined 19.64% 7,061
2.0 Telangana
2.1 Jammikunta 17.56% 245
2.2 Huzurabad 16.78% 288
2.3 Kollapur 15.51% 183
2.4 Medak 18.47% 344
2.5 Kothagudem 23.44% 447
2.6 Manuguru 20.86% 235
2.7 Armoor 14.81% 374
2.8 Malkajgiri 20.11% 2,676
Telangana Combined 18.84% 4,792
C. AP and Telangana Combined 19.30% 11,853 * Based on project completion to date
13. The sensitivity analysis is also conducted to assess the effect of adverse changes in key variables including: (i) an overrun in operation and management costs at 20 percent; (ii) a decline in estimated benefits of 20 percent; and (iii) i and ii combined. The sensitivity analysis revealed that the results are satisfactory for all water supply sub-projects (Table 6).
Table 6: Summary of Sensitivity Analysis
Sensitivity Scenarios
Andhra Pradesh ULBs Combined
Telangana ULBs Combined AP & Telangana ULBs Combined
EIRR % ENPV Rs. Million
SV %
EIRR % ENPV Rs. Million
SV % EIRR % ENPV Rs. Million
SV %
Base Case 19.64% 7,061 18.84% 4,792 19.30% 11,853 O&M Cost increase (+20%) 19.03% 6,624 323
% 17.82% 4,265 182% 18.52% 10,889 246%
Benefit decrease ((-) 20%) 14.78% 3,660 42% 13.78% 2,208 37% 14.36% 5,868 40%
Combined Worst Scenario 14.12% 3,223 12.68% 1,681 13.52% 4,905
Note: EIRR = Economic internal rate of return; ENPV=Economic net present value (discounted at 9% EOCC); SV = Switching value
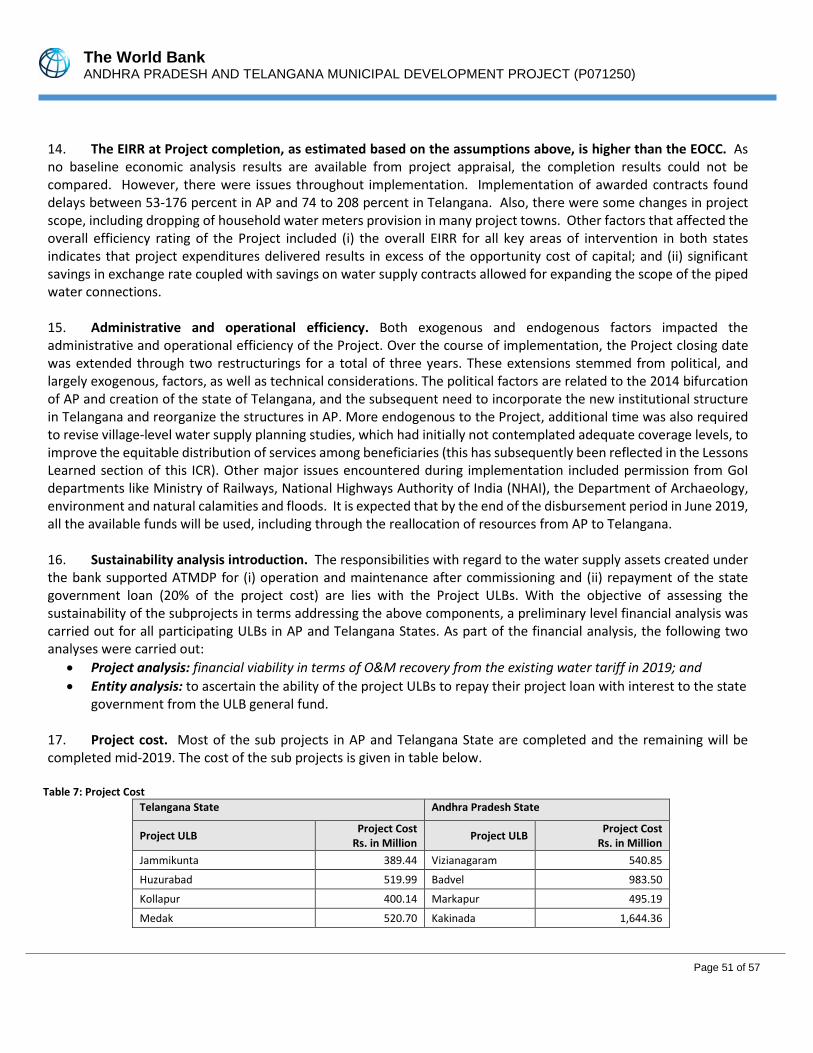
The World Bank ANDHRA PRADESH AND TELANGANA MUNICIPAL DEVELOPMENT PROJECT (P071250)
Page 51 of 57
14. The EIRR at Project completion, as estimated based on the assumptions above, is higher than the EOCC. As no baseline economic analysis results are available from project appraisal, the completion results could not be compared. However, there were issues throughout implementation. Implementation of awarded contracts found delays between 53-176 percent in AP and 74 to 208 percent in Telangana. Also, there were some changes in project scope, including dropping of household water meters provision in many project towns. Other factors that affected the overall efficiency rating of the Project included (i) the overall EIRR for all key areas of intervention in both states indicates that project expenditures delivered results in excess of the opportunity cost of capital; and (ii) significant savings in exchange rate coupled with savings on water supply contracts allowed for expanding the scope of the piped water connections.
15. Administrative and operational efficiency. Both exogenous and endogenous factors impacted the administrative and operational efficiency of the Project. Over the course of implementation, the Project closing date was extended through two restructurings for a total of three years. These extensions stemmed from political, and largely exogenous, factors, as well as technical considerations. The political factors are related to the 2014 bifurcation of AP and creation of the state of Telangana, and the subsequent need to incorporate the new institutional structure in Telangana and reorganize the structures in AP. More endogenous to the Project, additional time was also required to revise village-level water supply planning studies, which had initially not contemplated adequate coverage levels, to improve the equitable distribution of services among beneficiaries (this has subsequently been reflected in the Lessons Learned section of this ICR). Other major issues encountered during implementation included permission from GoI departments like Ministry of Railways, National Highways Authority of India (NHAI), the Department of Archaeology, environment and natural calamities and floods. It is expected that by the end of the disbursement period in June 2019, all the available funds will be used, including through the reallocation of resources from AP to Telangana.
16. Sustainability analysis introduction. The responsibilities with regard to the water supply assets created under the bank supported ATMDP for (i) operation and maintenance after commissioning and (ii) repayment of the state government loan (20% of the project cost) are lies with the Project ULBs. With the objective of assessing the sustainability of the subprojects in terms addressing the above components, a preliminary level financial analysis was carried out for all participating ULBs in AP and Telangana States. As part of the financial analysis, the following two analyses were carried out:
• Project analysis: financial viability in terms of O&M recovery from the existing water tariff in 2019; and • Entity analysis: to ascertain the ability of the project ULBs to repay their project loan with interest to the state
government from the ULB general fund. 17. Project cost. Most of the sub projects in AP and Telangana State are completed and the remaining will be completed mid-2019. The cost of the sub projects is given in table below.
Table 7: Project Cost
Telangana State Andhra Pradesh State
Project ULB Project Cost Rs. in Million Project ULB Project Cost
Rs. in Million Jammikunta 389.44 Vizianagaram 540.85
Huzurabad 519.99 Badvel 983.50
Kollapur 400.14 Markapur 495.19
Medak 520.70 Kakinada 1,644.36
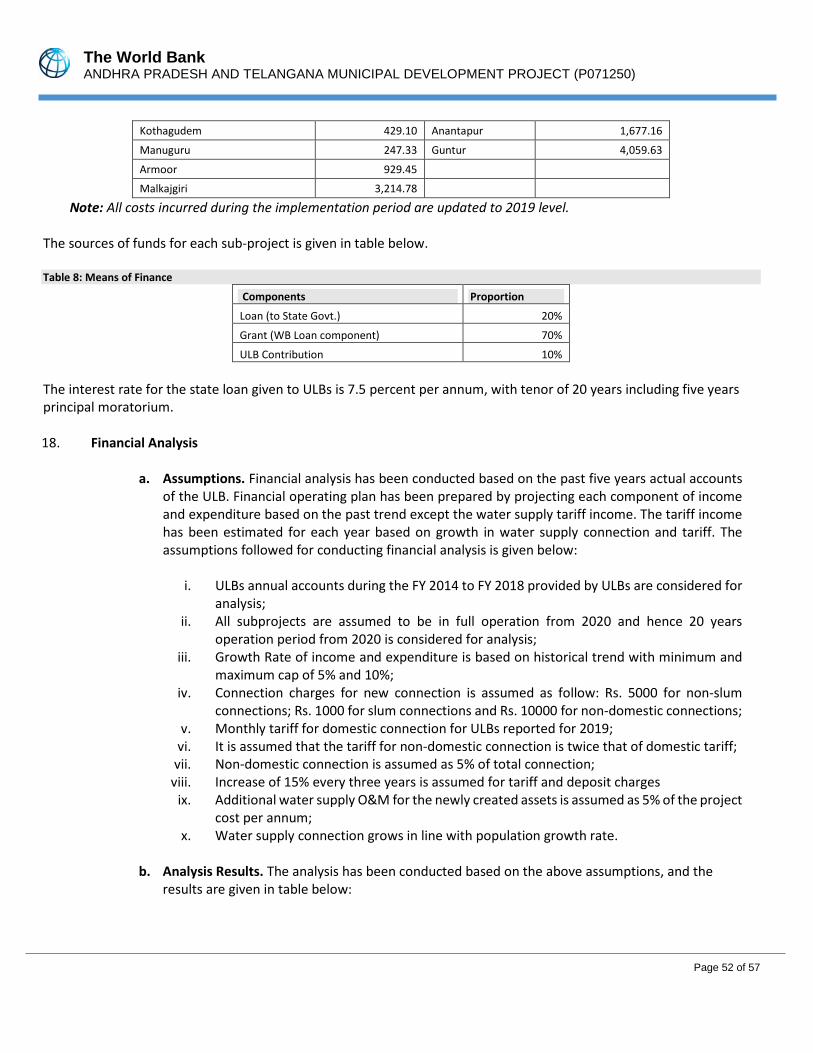
The World Bank ANDHRA PRADESH AND TELANGANA MUNICIPAL DEVELOPMENT PROJECT (P071250)
Page 52 of 57
Kothagudem 429.10 Anantapur 1,677.16
Manuguru 247.33 Guntur 4,059.63
Armoor 929.45
Malkajgiri 3,214.78
Note: All costs incurred during the implementation period are updated to 2019 level. The sources of funds for each sub-project is given in table below. Table 8: Means of Finance
Components Proportion
Loan (to State Govt.) 20%
Grant (WB Loan component) 70%
ULB Contribution 10% The interest rate for the state loan given to ULBs is 7.5 percent per annum, with tenor of 20 years including five years principal moratorium. 18. Financial Analysis
a. Assumptions. Financial analysis has been conducted based on the past five years actual accounts
of the ULB. Financial operating plan has been prepared by projecting each component of income and expenditure based on the past trend except the water supply tariff income. The tariff income has been estimated for each year based on growth in water supply connection and tariff. The assumptions followed for conducting financial analysis is given below:
i. ULBs annual accounts during the FY 2014 to FY 2018 provided by ULBs are considered for
analysis; ii. All subprojects are assumed to be in full operation from 2020 and hence 20 years
operation period from 2020 is considered for analysis; iii. Growth Rate of income and expenditure is based on historical trend with minimum and
maximum cap of 5% and 10%; iv. Connection charges for new connection is assumed as follow: Rs. 5000 for non-slum
connections; Rs. 1000 for slum connections and Rs. 10000 for non-domestic connections; v. Monthly tariff for domestic connection for ULBs reported for 2019;
vi. It is assumed that the tariff for non-domestic connection is twice that of domestic tariff; vii. Non-domestic connection is assumed as 5% of total connection;
viii. Increase of 15% every three years is assumed for tariff and deposit charges ix. Additional water supply O&M for the newly created assets is assumed as 5% of the project
cost per annum; x. Water supply connection grows in line with population growth rate.
b. Analysis Results. The analysis has been conducted based on the above assumptions, and the
results are given in table below:
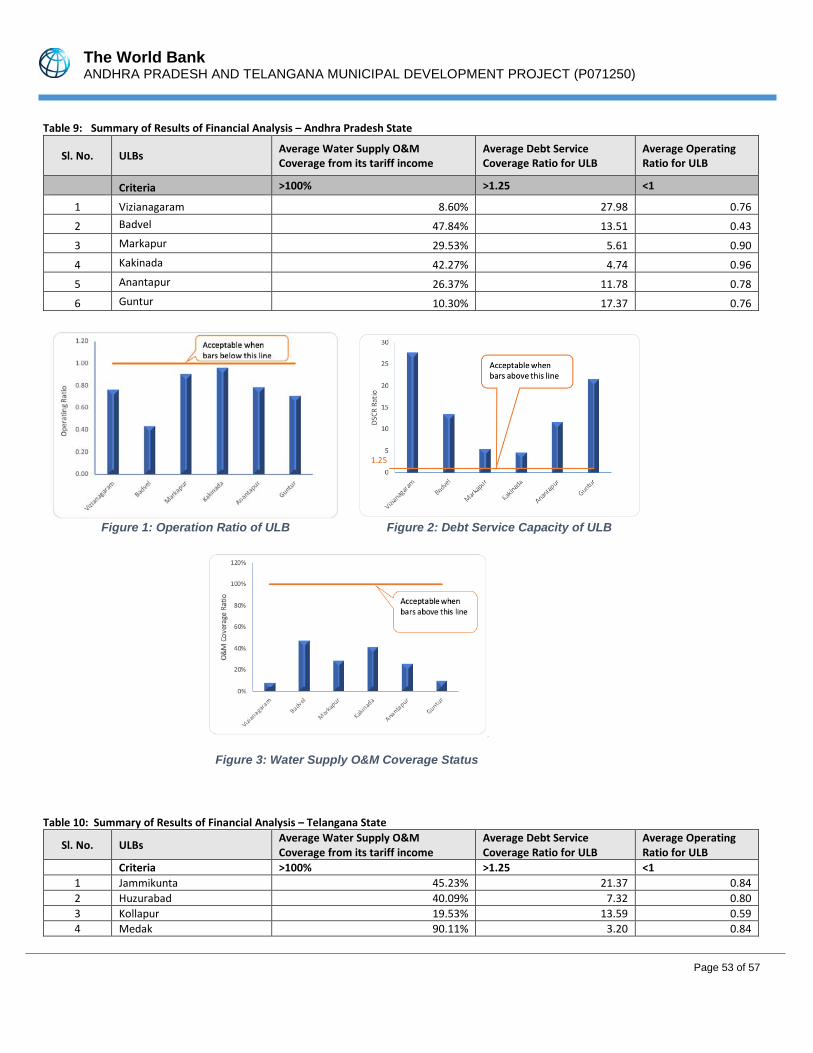
The World Bank ANDHRA PRADESH AND TELANGANA MUNICIPAL DEVELOPMENT PROJECT (P071250)
Page 53 of 57
Table 9: Summary of Results of Financial Analysis – Andhra Pradesh State
Sl. No. ULBs Average Water Supply O&M Coverage from its tariff income
Average Debt Service Coverage Ratio for ULB
Average Operating Ratio for ULB
Criteria >100% >1.25 <1
1 Vizianagaram 8.60% 27.98 0.76
2 Badvel 47.84% 13.51 0.43
3 Markapur 29.53% 5.61 0.90
4 Kakinada 42.27% 4.74 0.96
5 Anantapur 26.37% 11.78 0.78
6 Guntur 10.30% 17.37 0.76
Table 10: Summary of Results of Financial Analysis – Telangana State
Sl. No. ULBs Average Water Supply O&M Coverage from its tariff income
Average Debt Service Coverage Ratio for ULB
Average Operating Ratio for ULB
Criteria >100% >1.25 <1 1 Jammikunta 45.23% 21.37 0.84 2 Huzurabad 40.09% 7.32 0.80 3 Kollapur 19.53% 13.59 0.59 4 Medak 90.11% 3.20 0.84
Figure 1: Operation Ratio of ULB
Figure 2: Debt Service Capacity of ULB
Figure 3: Water Supply O&M Coverage Status
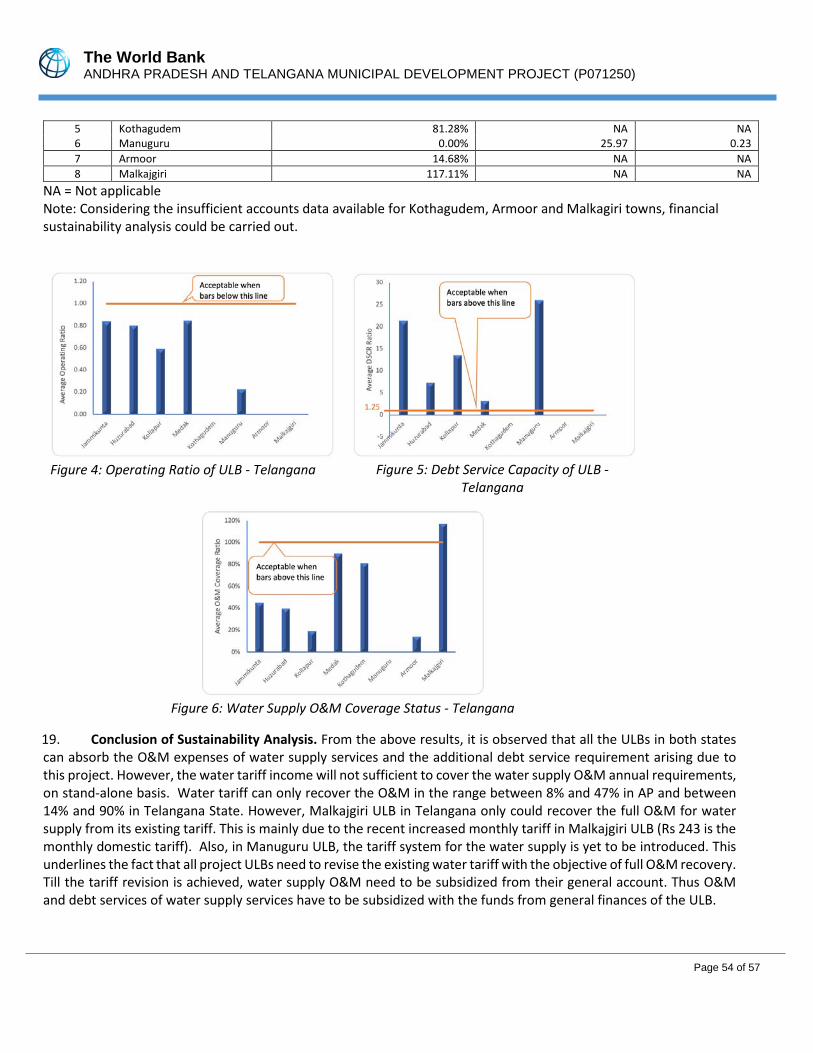
The World Bank ANDHRA PRADESH AND TELANGANA MUNICIPAL DEVELOPMENT PROJECT (P071250)
Page 54 of 57
5 Kothagudem 81.28% NA NA 6 Manuguru 0.00% 25.97 0.23 7 Armoor 14.68% NA NA 8 Malkajgiri 117.11% NA NA
NA = Not applicable Note: Considering the insufficient accounts data available for Kothagudem, Armoor and Malkagiri towns, financial sustainability analysis could be carried out.
Figure 4: Operating Ratio of ULB - Telangana
Figure 5: Debt Service Capacity of ULB -
Telangana
Figure 6: Water Supply O&M Coverage Status - Telangana
19. Conclusion of Sustainability Analysis. From the above results, it is observed that all the ULBs in both states can absorb the O&M expenses of water supply services and the additional debt service requirement arising due to this project. However, the water tariff income will not sufficient to cover the water supply O&M annual requirements, on stand-alone basis. Water tariff can only recover the O&M in the range between 8% and 47% in AP and between 14% and 90% in Telangana State. However, Malkajgiri ULB in Telangana only could recover the full O&M for water supply from its existing tariff. This is mainly due to the recent increased monthly tariff in Malkajgiri ULB (Rs 243 is the monthly domestic tariff). Also, in Manuguru ULB, the tariff system for the water supply is yet to be introduced. This underlines the fact that all project ULBs need to revise the existing water tariff with the objective of full O&M recovery. Till the tariff revision is achieved, water supply O&M need to be subsidized from their general account. Thus O&M and debt services of water supply services have to be subsidized with the funds from general finances of the ULB.
The World Bank ANDHRA PRADESH AND TELANGANA MUNICIPAL DEVELOPMENT PROJECT (P071250)
Page 55 of 57
ANNEX 6. IMPACT EVALUATION OF LAND ACQUISITION AND RESETTLEMENT
1. The impact evaluation of land acquisition and resettlement implementation in Guntur and Vizianagaram Towns was carried out by an independent consultant. The evaluation concluded that the overall living standards of displaced families has improved substantially compared to the baseline situation and the “control” population. The average annual income of the displaced families was reported as INR.1.04,000, which is 63% higher than baseline and 10% higher than that of the “control” population. The proportion of those living below the poverty line reduced to 61% from 100% at baseline and compared favorably with “control” population (72%). The average annual household expenditure is INR70,806, which is 27% higher than baseline and 11 more the “control” population. The ownership of assets and the level of borrowings/loans among displaced families remained the same as in the baselin. Similarly, the occupation profile also remined same, with 50% engaged as daily wage labor.
2. The study confirmed that the resettlement site was only 800 meters away from their original location. The resettled area was provided internal roads, drains and street lighting facilities; these facilities were also extended to the host population at these sites. House site ownership papers were provided as per GoAP norms and the houses were provided with individual water taps and toilets. The new site is close to the main road and has better housing conditions and civic amenities. 3. In Vizianagaram, the study confirmed that the average extent of land lost was only about 4% of the total land owned and the current annual income from agriculture of the affected land downers is about INR400,000, which is about 40% higher than at baseline. The proportion of those with borrowings/loans has marginally reduced from 59% at the time of baseline to 57%, while the occupational profile remained the same. The study confirmed that compensation for land was paid in accordance with the provisions of the new Land Law, which enabled people to receive compensation at higher rates than those prevailing at the time of notification due to the improved compensation procedures.
4. The study concluded that land acquisition and resettlement was been implemented in a consultative manner with regular and frequent interaction between the implementing agencies and the affected families. The affected persons were adequately informed on the policy provisions and entitlements. They were also informed of the grievance redress mechanism; some of the grievances related to drinking water supply at the resettlement site were resolved through the grievances redress mechanism.
5. Tribal Development Plan (TDP). the third-party audit team interacted with villagers and observed that most of them have expressed satisfaction with the implementation of the TDP. The audit assessed that 53 children in Chinaravigudem and 22 children in Kamlapur use the project constructed pre-schools (Anganwadi centers). Drinking water leakages have been arrested, stagnant water has reduced due to the improved drainage system, and community centers are being used for village development meetings, performing religious rituals and weddings. Construction of boundary walls for two Community centers was in progress at the time of writing the ICRR.
The World Bank ANDHRA PRADESH AND TELANGANA MUNICIPAL DEVELOPMENT PROJECT (P071250)
Page 56 of 57
ANNEX 7. BORROWERS’ COMMENTS
GOVERNMENT OF ANDHRA PRADESH Comments were made in track change mode and the paragraph number is provided here as reference
• 17: Supply of Desktops, UPS, to set up Command Communication centers and establishing open air Gym equipment in 180 parks.
• Table 2: The figures indicated may vary as per our records. In case of Badvel total network area has carried out under World Bank funded. Percentage may change accordingly.
• Table 3: GIS base maps. Revenue Improvement Survey and Digital Door Numbering are completed in 110ULBs.
• 81: Further, while executing such projects comprehensive work i.e. source improvement, distribution and metering must be taken up as single package. So that the financial capacity of the ULB may be increased.
• Annex 1 A.2 Intermediate Indicator “GIS Unit Operational…” 44 GIS layers GOVERNMENT OF TELANGANA
• We would like to inform you that this office has no major comments or remark on the ICR report communicated vide email dt: 30-05-2019.
• Further, it is observed that in-case of preparation of GIS Base Maps for Telangana the ICR report has mentioned only 37 ULBs GIS Base Maps. TMD project has also implemented the preparation of GIS Base Maps for 22 ULBs and Master Plan preparation for 20 ULBs. The same may be incorporated in the final ICR.
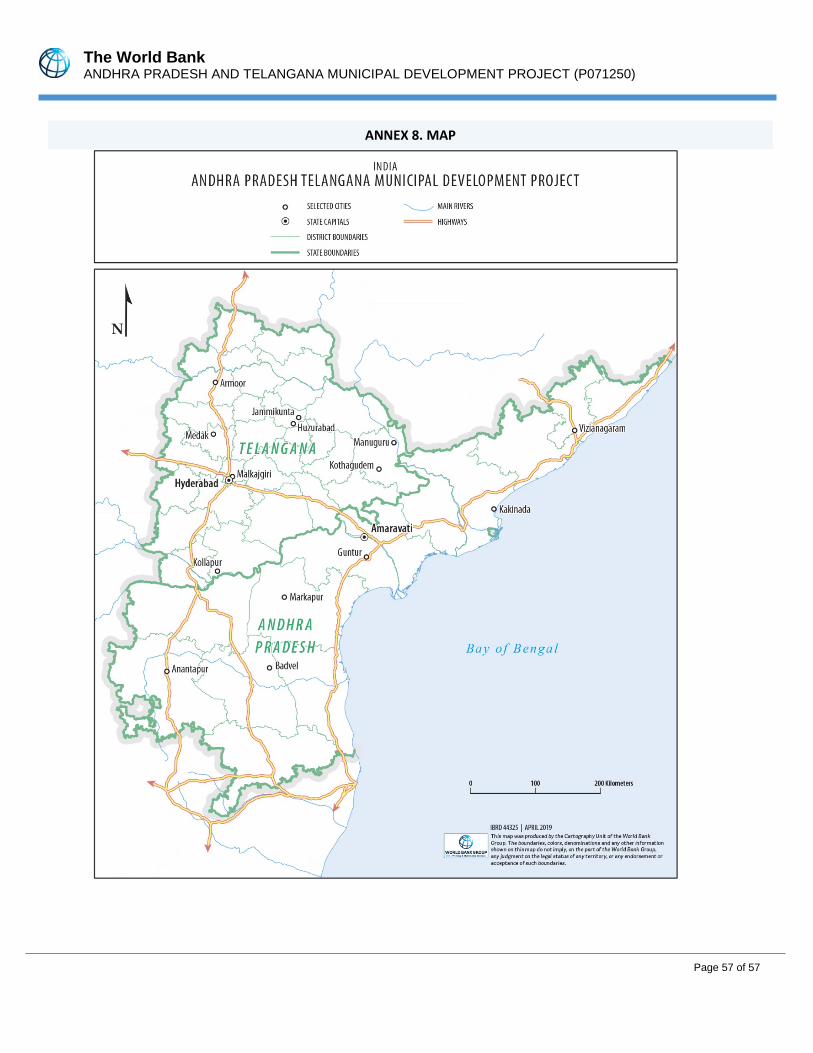
The World Bank ANDHRA PRADESH AND TELANGANA MUNICIPAL DEVELOPMENT PROJECT (P071250)
Page 57 of 57
ANNEX 8. MAP