Impacts of replacing a fixed transit line by a Demand ...
20
Impacts of replacing a fixed transit line by a Demand Responsive Transit system Felipe Mariz Coutinho*, Niels van Oort, Zoi Christoforou, María J. Alonso-González, Oded Cats and Serge Hoogendoorn * Corresponding author: Dep. Transport and Planning, Faculty of Civil Engineering and Geosciences, Delft University of Technology, 2600 GA Delft, The Netherlands, +55 84 987333321, [email protected] JEL classification: L920, R410, O180 Keywords: Demand Responsive Transit; Fixed transit; Ridership; Sustainability; Efficient operations; ABSTRACT The diffusion of the smartphone and the urban sprawl is pushing both private and public actors to revisit the concept of the demand-responsive transit (DRT). Mokumflex is a DRT pilot program that replaced the regular bus service in low-density areas of Amsterdam, the Netherlands, for 12 months. The close collaboration with the private enterprise that conducted the system but also with the local bus operator allowed the authors to have access to precise databases, giving this article empirical information for both the situation before and after the implementation. These insights help to understand DRT systems and support (future) design of DRT and transit systems. A few indicators were chosen for the comparison: distances, ridership, costs, Greenhouse Gases (GHG), emissions and population’s perception. The ridership dropped, however, for being “demand-tailored”, the mileage per passenger reduced, improving the costs and GHG emissions. In regards to population’s perception, the system enjoyed a good evaluation. 1. Introduction Urbanization is not a recent trend and neither are the challenges it faces. In 1968, the “first truly comprehensive official look at urban transportation in the light of modern technological capabilities to deal with modern urban problems” was published, pointing out the problems that urban planners at that time had to deal with: equality, accessibility, quality of service,
Transcript of Impacts of replacing a fixed transit line by a Demand ...

Impacts of replacing a fixed transit line by a Demand Responsive Transit
system
Felipe Mariz Coutinho*, Niels van Oort, Zoi Christoforou, María J. Alonso-González, Oded
Cats and Serge Hoogendoorn
* Corresponding author: Dep. Transport and Planning, Faculty of Civil Engineering and
Geosciences, Delft University of Technology, 2600 GA Delft, The Netherlands, +55 84
987333321, [email protected]
JEL classification:
L920, R410, O180
Keywords:
Demand Responsive Transit; Fixed transit; Ridership; Sustainability; Efficient operations;
ABSTRACT
The diffusion of the smartphone and the urban sprawl is pushing both private and public
actors to revisit the concept of the demand-responsive transit (DRT). Mokumflex is a DRT
pilot program that replaced the regular bus service in low-density areas of Amsterdam, the
Netherlands, for 12 months. The close collaboration with the private enterprise that
conducted the system but also with the local bus operator allowed the authors to have
access to precise databases, giving this article empirical information for both the situation
before and after the implementation. These insights help to understand DRT systems and
support (future) design of DRT and transit systems. A few indicators were chosen for the
comparison: distances, ridership, costs, Greenhouse Gases (GHG), emissions and
population’s perception. The ridership dropped, however, for being “demand-tailored”, the
mileage per passenger reduced, improving the costs and GHG emissions. In regards to
population’s perception, the system enjoyed a good evaluation.
1. Introduction
Urbanization is not a recent trend and neither are the challenges it faces. In 1968, the “first
truly comprehensive official look at urban transportation in the light of modern technological
capabilities to deal with modern urban problems” was published, pointing out the problems
that urban planners at that time had to deal with: equality, accessibility, quality of service,

Impacts of replacing a fixed transit line by a Demand Responsive Transit system
Page 2 of 20
congestion, efficient use of assets, pollution and inadapted institutional framework were
some of them and were considered crucial for a proper urban development (HUD, 1968).
Nowadays the spread of cities is still facing similar problems but they were all aggregated
under the concept of sustainability and transportation is seen as one major tool to address
them (Laws et al., 2009, Feigon et al., 2018). The 5E framework, proposed by van Oort et al.
(2017), for example, estimates the value of transit by its economic, environmental and social
impacts, but also regarding the effectiveness (transporting people reliably, safely and
reducing congestion) and efficiency (good usage of space).
When it comes to analysis of mobility and urbanization, a classic problem is how to serve
low-density and dispersed settled areas where regular transit is usually not feasible and
demand-responsive transit (DRT) is a possible solution, helping the population to satisfy their
mobility needs (Ellis and McCollom, 2009, MOG, 2014). By DRT, this article considers to be
a form of transportation, privately or publicly operated, with fixed or dynamically allocated
routes and schedules to offer a service that relies on trip pooling to be performing.
The aim of this study is to evaluate the impacts coming from the transformation of a fixed bus
line into a demand-responsive system, giving the guidelines of a methodology that will help
urban planners in their decision-making process. It is based in information coming from a
demand-responsive pilot program called Mokumflex, that was operated in two rural areas of
Amsterdam, the Netherlands, between December 2017 and December 2018, whose dataset
included information for each requested displacement.
The next section, a literature review of the development of DRT as well as current
experiences are presented. The third section is dedicated to a brief explanation of the local
context and the program itself. The penultimate part offers the analysis of the outcomes,
evaluating different indicators representative of the previous and the current situation.
2. Development of DRT
DRT is not an innovation of the twentieth-first century: the first somehow formal and
documented experiment was realized in 1916, in Atlantic City: a jitney service open to the
general public that operated in a fixed route picking-up and discharging passengers
according to their requests (O’Leary, 1974, ITCFL, 1982).
The following decades met only a shy dissemination of these type of projects with only two
more operations being documented until the 60’s, when the planet watched the expansion of
these transportation systems: starting in North America and followed by Europe during the
70’s (ITCFL, 1982). Figure 1 illustrates the technologic developments and the context that
helped DRT’s in their spread worldwide:

Impacts of replacing a fixed transit line by a Demand Responsive Transit system
Page 3 of 20
Figure 1: Important technological developments for DRT
The diffusion of DRT started in the 60’s: the spread of low-density areas in the US, that
generally did not dispose of the same financial resources of the consolidated urban centers,
made demand-responsive bus-based system a promising solution (Cole, 1968). The CARS
project of the Massachusetts Institute of Technology, aimed the development of a “many-to-
many” origins and destinations algorithm to assign efficiently demand, reducing the
workforce necessary to provide the offer, making a door-to-door transit system affordable
(Wilson et al., 1969). During the 70’s, the first automated operations were put into practice:
first in Haddonfield, New Jersey, in 1972, followed by Rochester, New York, in 1975 (Strobel,
1982).
The inaugural European experiences date from the end of the 60’s and beginning of the 70’s,
mainly influenced by the North-American initiatives and different travel comportment,
telephone, car ownership and disposable income (Webster, 1974). The 80’s and 90’s saw
the improvement of different technologies that enhanced communication and data collection.
Adding the limited budget environment, in the USA, the replacement of regular services by
shared taxis and dial-a-ride bus options was stimulated (Casey et al., 1991). Concerning the
2000’s, the internet allowed important financial and time savings caused by inefficient
telephone communication, being considered a promising solution already at that time
(Lasdon et al., 2000)
Despite its development, this concept did not meet great acceptance as a substitute for
regular transit in situations where the last is not economically viable (Davison et al., 2014).
One of the reasons is the nature and objectives of DRT systems: usually, the main
motivation for their implementation is to serve weak demands in a more optimized way.

Impacts of replacing a fixed transit line by a Demand Responsive Transit system
Page 4 of 20
However, to reduce subsidies, the systems have to raise the occupancy but this raise often
indicates the necessity of a regular line, therefore limiting their application (Vuchic et al.,
1981).
The second decade of the 21st century, however, is embedded into an environment (mainly
characterized by the smartphone and significant budget cuts to transit subsidies) that is
inviting urban planners to reconsider DRT (Westervelt et al., 2018, Davison et al., 2014). The
rediscovery of the concept in current days is being pioneered by the private sector
companies and the increasing popularity induced transit agencies to deploy their own pilots
(McCoy et al., 2018). The natural development of transportation network companies (TNC),
which started operating in 2009, made them start to pool multiple trips in the same vehicle
through their software, giving origin to the current DRT systems (Westervelt et al., 2018).
Between 2012 and 2016, some recent DRT companies launched operations just like Via,
Kutsuplus, Bridj, Chariot, Padam, Leap, Loup, UberPool, Lyft Lines and Shuttle (Westervelt
et al., 2018). Even if ultimately all of these enterprises propose as final and ideal service a
shared trip in a car where prices and level of comfort are situated somewhere between
regular transit and TNC/ taxis, their business models vary considerably between enterprises
and even accordingly to the cities where they are implemented.
Nonetheless, the sustainable business model is still to be found but the reasons are still
unclear as enterprises hardly share their data (McCoy et al., 2018). However, some general
characteristics of their business model support this statement (Feigon et al., 2018):
• Cost-intense nature: when compared to TNC companies, DRT experiences are
leasing vehicles and paying drivers as employees, which raises its costs;
• Similarity with transit: DRT operators usually provide a transit-like service,
without subsidies and for lower demands;
• Low patronage attraction: the system is well understood and accepted by only
a few users.
The Netherlands followed this trend: when it comes to stop-to-stop (StS) DRT, recent
developments were made firstly, in 2016, in Arnhem-Nijmegen, with Breng flex (Alonso-
González et al., 2018) and secondly in 2017, in Helmond and surroundings, with Bravoflex
(Hermes, 2019). Figure 2 summarizes some features of contemporary DRT experiences:

Impacts of replacing a fixed transit line by a Demand Responsive Transit system
Page 5 of 20
Figure 2: Main features of contemporary DRT operations
In the case of Amsterdam, the Municipality created a pilot program called Mokumflex, which
operated between December 2017 and December 2018. Two areas were chosen for the test,
based on their limited transit offer and low efficiency, and the project was executed differently
in each one:
• In Amsterdam Zuidoost and Weesp, Mokumflex was added to the existing transit offer
(provided by the line 49) and ran between December 2017 and December 2018;
• In Amsterdam Noord, Mokumflex completely replaced the public transport (provided by
the lines 30 and 31) and ran between February 2018 and December 2018.
As the objective of this article is to evaluate the impacts of the replacement of fixed bus lines
for DRT, only the outcomes of Amsterdam Noord will be presented in this article. For further
information about the impacts in Amsterdam Zuidoost and Weesp, other indicators and
comparisons, please refer to Coutinho (2019). The area served by the lines 30 and 31 is
shown in Figure 3.

Impacts of replacing a fixed transit line by a Demand Responsive Transit system
Page 6 of 20
Figure 3: Localization of the previous lines (top left, line 31, top right, line 30)
Source: Google Maps (2018) and Moovit (2018)
While the original fixed bus lines were operated by GVB (the local transit operator) and
regulated by Vervoerregio Amsterdam (the transport authority), Mokumflex was operated by
RMC, a private enterprise which also operated the paratransit of the region. Since the
paratransit is regulated by Gemeente Amsterdam, the Municipality of Amsterdam, the project
was regulated by the Municipality, not by GVB. It is important to say that the fleet of
Mokumflex was not dedicated, as RMC used these vehicles to also provide paratransit.
Figure 4 summarizes some main operational features of both offers.

Impacts of replacing a fixed transit line by a Demand Responsive Transit system
Page 7 of 20
Figure 4: Characteristics and level of service
These results demonstrate that the structure for Mokumflex was leaner: 2 vehicles were
capable of serving the areas that previously required 3 vans (disconsidering reserve fleet).
However, as will be presented later, the transformation caused a drop in the ridership making
this comparison unfair. Also, it is important to note that the pilot extended the operating time-
frame as well as the number of stops.
With regard to the large headway of 60 minutes, it was replaced by a demand-based system:
the user had to book a trip up to one hour before and the vehicle was supposed to arrive in a
15-minute time-frame around the desired departure time. Finally, while the previous system
costed 0,155 €/km (GVB, 2018b), the pilot was free of charge.
3. Data and methodology
As previously mentioned, transit has the capacity to help urban planners to surmount some
of the main issues of urban sprawl on the ongoing context. However, not all of the impacts
coming from the implementation of mobility projects are considered when designing new
transport policies and plans, and, despite the technical capacity that humanity currently
dispose of, the main indicators used for evaluations are still traditional metrics, such costs
and time saving, for example (Van Oort et al., 2017). This work incorporated, then, a broader
set of indicators to compare a regular transit line with a DRT taking into consideration some
of the main ideas of sustainability.
3.1 Data sources
Diverse sources were consulted to consolidate the metrics used in the comparisons as this
information was not straight available. The first dataset was the one provided by RMC,
containing information such as displacing, request and drop-off times, request and drop-off
Impacts of replacing a fixed transit line by a Demand Responsive Transit system
Page 8 of 20
stops, user’s opinion and the ID of the car allocated to this displacement for each request for
the whole duration of the pilot program. For the service in Amsterdam Noord, between
February 2017 and December 2018, 5.980 requests were recorded, 95% were properly
registered (different pick-up and drop-off stations, times and distance travelled superior to 50
meters) and 83% of the displacements were completed (for the rest, the passenger did not
show up).
The second most important source was provided by the local transit operator, GVB,
containing information about the demands for the regular bus lines via smartcard data,
containing tap-in and tap-out information (Van Oort et al. 2015). Finally, other sources of data
were the socio-demographic and territorial facts provided by the Dutch Bureau of Statistics,
CBS (CBS, 2012), and the national car database, which keep a detailed description about
each car registered in the Netherlands and is available in the site of RDW, the Dutch Vehicle
Authority (RDW, 2019).
3.2 Methodology to compare fixed transit and DRT
In order to propose a summarized and unbiased comparison between the regular transit and
the demand responsive offer, few indicators were prioritized: ridership (passengers/ month),
distances (vehicular kilometres/ month), costs (€/ month, €/ passenger and €/ kilometre),
GHG emissions (measured in gCO2Eq/ veh km) and population’s perception (obtained from
surveys with the users of both systems).
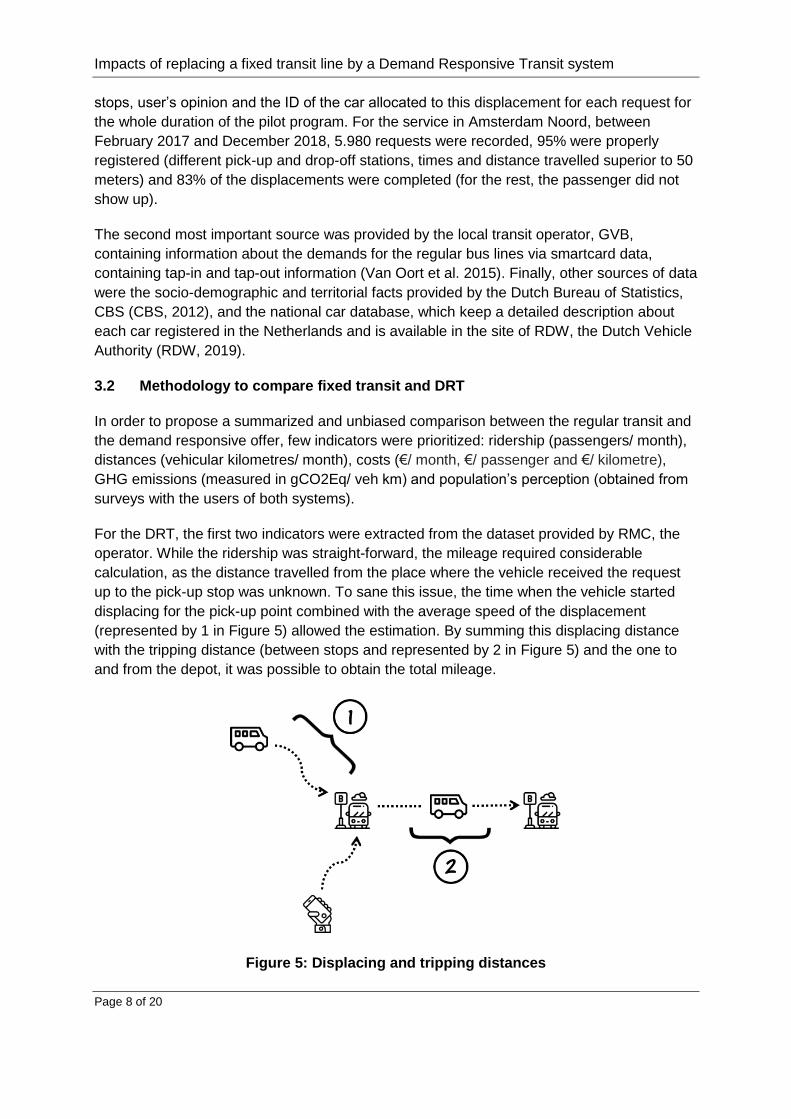
For the DRT, the first two indicators were extracted from the dataset provided by RMC, the
operator. While the ridership was straight-forward, the mileage required considerable
calculation, as the distance travelled from the place where the vehicle received the request
up to the pick-up stop was unknown. To sane this issue, the time when the vehicle started
displacing for the pick-up point combined with the average speed of the displacement
(represented by 1 in Figure 5) allowed the estimation. By summing this displacing distance
with the tripping distance (between stops and represented by 2 in Figure 5) and the one to
and from the depot, it was possible to obtain the total mileage.
Figure 5: Displacing and tripping distances

Impacts of replacing a fixed transit line by a Demand Responsive Transit system
Page 9 of 20
Another important feature that deserves explanation is the fleet dimensioning. While for the
regular lines the minimum number of vehicles could be estimated based on the headways
and schedules, for the DRT it was different. As previously mentioned, since RMC used cars
from the paratransit system for the displacements of Mokumflex, the “fleet dimensioning” was
based on the “analysis of simultaneity of cars” operating in Mokumflex: for every minute of
the pilot, it was checked how many cars were providing trips for Mokumflex in that interval.
The results are in Figure 6: Necessary fleet to run MokumflexFigure 6Figure 6:
Figure 6: Necessary fleet to run Mokumflex
The average shows that the paratransit cars operated 192 minutes per day for Mokumflex. In
168.5 of those, there was only one car, while in 20.6, there were 2 and the remaining 2.9
minutes saw the presence of 3 or more vehicles. Based on the fact that for more than 98% of
the operating minutes there was one or two cars, it was assumed that 2 were enough to
provide the displacements (implying additional waiting time for passengers during the
mentioned 2.9 minutes)
When it comes to the demand of the previous transit offer, it was provided by the local bus
operator, GVB, between February 2018 and December 2018, and the mileage was
calculated based on the headways, line length and distances to and from the depot.
Concerning the costs, they were divided in components studied for each vehicle model:
depreciation, energy (fuel and, for electric vehicles, battery packs), insurance, interest of the
depreciation, maintenance, own risk damage, staff (direct and indirect), storage and taxes.
For Mokumflex, since the vehicles also operated for the paratransit, the costs were divided
among the systems: the GPS of the cars demonstrated that they travelled 243,0 km per day
whose 136,6 km were for Mokumflex and the remaining 106,4 km for the paratransit. This
proportion was applied to divide the distance-based costs. Finally, no opportunity costs nor
estimations for the future were considered.
0
100
200
300
Dec Jan Fev Mar Apr May Jun Jul Aug Sep Oct Nov Dec
AV
G d
aily
min
ute
s w
ith
X v
ehic
les
in
Mo
kum
flex
(m
in/
day
)
1 2 3+ Average

Impacts of replacing a fixed transit line by a Demand Responsive Transit system
Page 10 of 20
For the GHG emissions, a Wheel-to-Wheel (WTW) analysis comparing three different
vehicular models was made: two models that were used during the pilot and the van used for
the lines 30 and 31. For the population’s perception, the data came from the evaluation
available for users after the completion of each trip, where they could evaluate the
displacement as “very satisfied”, “satisfied”, “reasonable”, “dissatisfied” and “very
dissatisfied”.
4. Results
4.1 Distance and ridership
When comparing different systems, one of the most usual indicators is ridership. In addition,
since this methodology incorporates other indicators that depends on the distances (such as
operational cost and GHG emissions), the mileage travelled by the vehicles was also
calculated, following the method presented in Section 3. A summary of both is proposed in
Table 1:
Table 1: Mileage and ridership
Fixed 30
Fixed 31
Fixed Total
DRT Mokumflex
Mileage (vehicular km/ day) 1085.9 166.8 1252.8 136.6
Demand (pass/ day) 64.7 13.4 78.1 15.9
Veh km/passenger 16.8 12.5 16.0 8.6
From this table, the low-demand character of the region is latent: the ridership of lines 30 and
31 combined was used for only 78 people. For Mokumflex this number was even lower,
about 16 users daily, despite the fact that it was free of charge (this drop is possibly linked to
the large time-frame of 15 minutes around the desired departure time, that required
customers to organize their schedules for a 30-minutes basis). On the other hand,
Mokumflex was more efficient in terms of vehicular mileage per passenger, as the distance
reduced more than 46%, passing from 16 km/ passenger to 8,6 km/ passenger.
4.2 Operational costs
The second most traditional indicator is the cost and it relies on mainly four aspects of a
transit system: the time-frame of the operation, the number of cars used, the vehicle model
and the mileage. The number of vehicles and the mileages were already discussed but in
regards to the models while the previous lines operated with Mercedes-Benz Sprinter City
(Traminfo, 2019), Mokumflex used a set of different cars to operate Mokumflex. A CNG
Combi, however, was used to provide more than 20% of the trips and was one of the models
chosen for this evaluation. Moreover, an electric e-Crafter was introduced to check impacts
of electrification. The cars studied in this comparison are shown in Figure 7Figure 7.

Impacts of replacing a fixed transit line by a Demand Responsive Transit system
Page 11 of 20
Figure 7: Car models used for the financial analysis (from the left to the right: Combi, e-Crafter and Sprinter)
Source: Autowereld (2018), Green car reports (2019) and Busphoto (2019)
A detailed explanation of each component of the operational costs can be found in
Coutinho(2019) and the summary of the costs is proposed in Table 2 (the numbers are per
vehicle and the information per system can be found in the conclusion).
Table 2: Operational cost analysis
Fixed, 30 Sprinter
Fixed, 31 Sprinter
DRT Combi
DRT e-Crafter
Lifetime (years) 3.6 8.3 3.2 3.2
Lifetime (km) 504,000 360,000 288,000 288,000
Catalog price (€/ vehicle) $41,000 $41,000 $54,293 $54,184
Total (€/ month) $15,360 $13,567 $4,775 $4,951
Veh costs (%) 24% 14% 39% 41%
Workforce (%) 76% 86% 61% 59%
Total (€/ km) $1.30 $3.74 $1.15 $1.19
Total (€/ pass) $21.63 $50.06 $6.42 $6.65
Firstly, the lifetime of sprinters changed accordingly to the intense daily usage: the more a
car travel in a daily basis, the larger will be the lifetime mileage (Laver et al., 2007).
The regular line was less cost-performing than the demand-responsive offer in all the “total”
indicators, showing that despite the drop in demand, Mokumflex was more efficient. This
happened for two reasons: the higher daily mileage (that caused more expenditure with fuels
and other distance-dependent indicators, such as maintenance) but also due to the larger
number of working hours per week (while the previous system operated 90h/ week with 3
cars thus 270 hours of direct and indirect staff, the demand-responsive ran an average of
192 minutes per day requiring, then, 44,8h per week).
When it comes to the comparison of the energy disbursements between the CNG Combi and
the e-Crafter, the e-Crafter was more expensive, as the depreciation of the battery pack
accounted for about 62% of the total expenses with energy, and pushed the number
upwards. A cost composition is proposed in Figure 8.

Impacts of replacing a fixed transit line by a Demand Responsive Transit system
Page 12 of 20
Figure 8: Cost composition
This cost composition demonstrates that workforce is indeed highly impacting for the
previous lines but still accounts for the majority of the costs for Mokumflex, demonstrating the
potential for automation. The absolute disbursements with depreciation were equivalent
before and after but, given that after the transformation, the total monthly expenditure
diminished, it grew in percentage.
4.3 GHG emissions
Since this work focused in the incorporation of a broader set of indicators that represented
some of the ideals of sustainability, an analysis of GHG emission was mandatory. The choice
for a WTW analysis evaluated more precisely the numbers and allowed the estimation of the
impact of electric cars. It is important to say that for Tank-to-Wheel (TTW) emissions, the
CO2 emissions were considered numerically equivalent to the total CO2eq emissions, as
other GHG accounts for small fractions of the total (Nam et al., 2004, and Becker et al.,
1999). The values were summarized in Table 3.
Table 3: Emissions per car model
Fixed, 30+31
Sprinter DRT
Combi DRT
e-Crafter
Fuel Diesel CNG Electricity
Conso (Lt, m³ or kwh/ 100km) 39 7 22
WTT emissions (gCO2eq/ km) 103.5 49.7 115.1
TTW emissions (gCO2eq/ km) 233.0 195.4 0.0
Mileage (veh*km/day) 1252.8 136.6 136.6
Emissions (kgCO2eq/ month) 9,275** 1,004* 472*
Emissions (kgCO2eq/ pass) 5.4 2.1 1.0 * 30-days month
** 22-days month
0%
25%
50%
75%
100%
Combi e-Crafter Citaro, 30 Citaro, 31
Direct staff (%) Indirect staff (%) Depreciation (%)
Energy (%) Interest, depreciation (%) Storage (%)
Maintenance (%) Taxes (%) Own risk damage (%)
Insurance (%)

Impacts of replacing a fixed transit line by a Demand Responsive Transit system
Page 13 of 20
Despite the similar emission per kilometre, the higher mileage drastically raises the total
emissions, making the previous system much less performing than the demand-responsive
one. Special attention should be given to the Well-to-Tank (WTT) emissions, that are a
considerable part of the total: in the case of the e-Crafter, the carbon-intensity of the
electrical Dutch matrix negatively impacted its performance being even more pollutant than
the manufacturing of the diesel and demonstrating the necessity of decarbonizing this sector.
4.4 Population’s perception
The last indicator was the population’s perception, which was based in the evaluation
available on the main dataset. As the punctuality was a major issue for Mokumflex, the
following numbers were split in two sub-groups: “on-time” and “not on-time” trips. Trips were
considered to be “on-time” if the pick-up time was contained the 15-minutes frame around
the requested pick-up hour. In total, 3.892 completed trips were “on-time” and 329 were
evaluated, while the “not on-time” accounted for 1,082 completed trips and 64 evaluations. In
regards to the previous system, it was measured differently and GVB’s bus system had a
satisfaction of 7,6 in 2016, in a 0-10 scale (GVB, 2018). The results for Mokumflex were
summarized in Figure 9.
Figure 9: Population’s perception
As one can see, the system enjoyed a good perception, with almost 94% of the “on-time”
trips being evaluated as “very satisfying” or “satisfying”. On the other hand, when it came to
the judgement of the “Not on-time” trips, the sum of these numbers reduced to about 70%,
mainly giving space to “very dissatisfied” and “reasonable” perceptions.
5. Conclusions
This article investigated the differences in terms of distances, ridership, costs, GHG
emissions and population’s perception between a DRT system and a regular bus line based
in a real case study in Amsterdam. The results showed that the reduced mileage and
Impacts of replacing a fixed transit line by a Demand Responsive Transit system
Page 14 of 20
operating time-frame contributed for a better performance of the on-demand system when
compared to the previous, despite the drop in the ridership.
The nature of DRT is unstable and basic questions, such as the proper context for its
implementation, are still lacking answers. However, the possibilities that the smartphone-
based context is offering are bringing new and old actors to participate into the rediscovery of
the concept.
In this perspective, the case study of a real DRT operation allowed interesting outcomes for
the scientific community. It is acknowledged that a broader set of indicators could be
internalised but this work wanted to propose the guidelines for a methodology to evaluate
transport operations, helping decision-makers to substantiate their choices. For further
comparisons, please refer to Coutinho (2019).
This study demonstrated that the transformation impacted considerably the ridership, which
dropped to less than 28% of the previous. However, as the mileage reduced to less than
11% of the previous, the resources were rationalized: the comparisons of the indicators per
passenger demonstrated considerable improvements, as the number of vehicular kilometres
per passenger, operational costs per passenger and GHG emissions per passenger were
smaller. Indeed, the regular system had larger mileages and operating time-frame, which
caused negative impacts in these indicators.
Still, the WTT analysis showed the importance of evaluating the production of the fuel and
electricity, as they may account for a considerable percentage of the total.
The system was also well seen by the users, with levels of satisfaction in almost 90% but
punctuality was proven to be an important characteristic of a DRT system, having strong
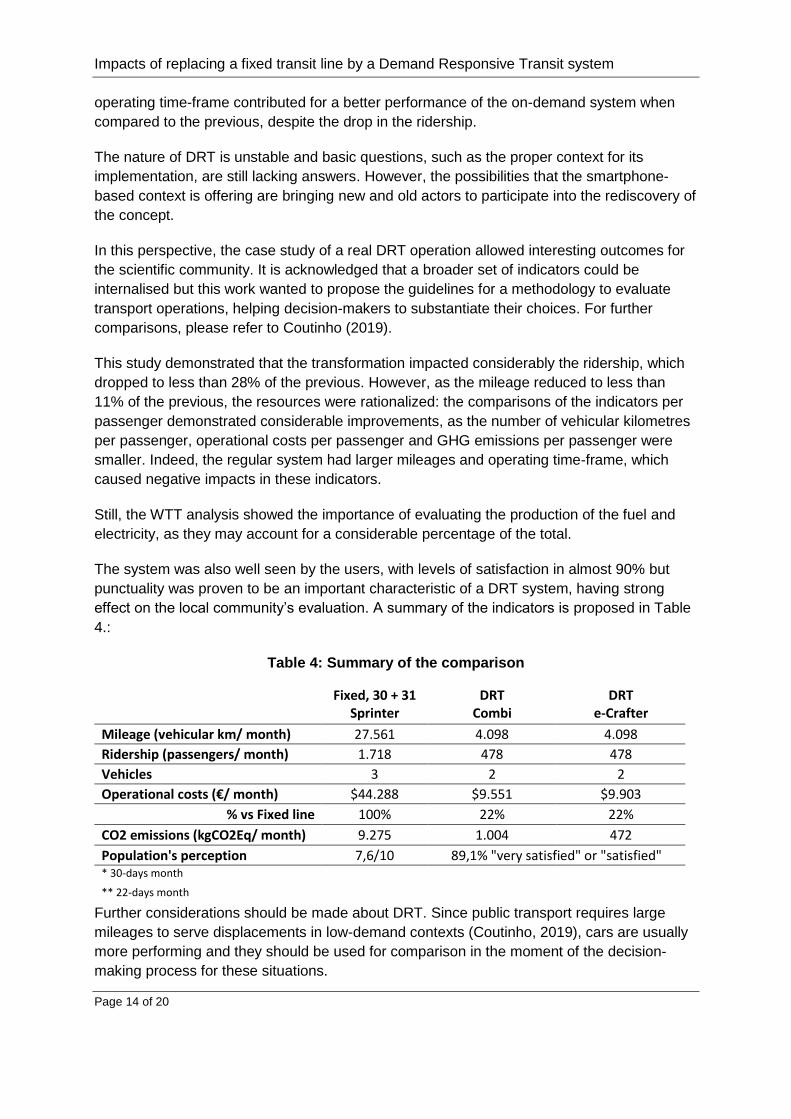
effect on the local community’s evaluation. A summary of the indicators is proposed in Table
4.:
Table 4: Summary of the comparison
Fixed, 30 + 31 Sprinter
DRT Combi
DRT e-Crafter
Mileage (vehicular km/ month) 27.561 4.098 4.098
Ridership (passengers/ month) 1.718 478 478
Vehicles 3 2 2
Operational costs (€/ month) $44.288 $9.551 $9.903
% vs Fixed line 100% 22% 22%
CO2 emissions (kgCO2Eq/ month) 9.275 1.004 472
Population's perception 7,6/10 89,1% "very satisfied" or "satisfied" * 30-days month
** 22-days month
Further considerations should be made about DRT. Since public transport requires large
mileages to serve displacements in low-demand contexts (Coutinho, 2019), cars are usually
more performing and they should be used for comparison in the moment of the decision-
making process for these situations.

Impacts of replacing a fixed transit line by a Demand Responsive Transit system
Page 15 of 20
Secondly, smartphone-based services require a level of digital literacy that usually population
do not dispose of and this can be a real barrier for users, especially for the elders, which are
a vulnerable group in terms of mobility and tend to live in rural areas (Ellis and McCollom,
2009). Thirdly, ensuring a good user experience is fundamental: whether by teaching people
how to use the application (that should be simple and provide real-time information) as well
as by signalizing properly stops and cars.
Finally, the lack of indicators to develop analysis about social impacts is clear: the study of
mode change, socio-demographics of users and impacts on accessibility could offer
interesting outcomes. Also, clarify questions such as the impact of increased ridership in the
performance of the system is important. A methodology that incorporates all these indicators
of sustainability is not an easy task but could give urban planners great outcomes.
Acknowledgements
The authors acknowledge all enterprises involved in this project: RMC, the Municipality of
Amsterdam, GVB and Vervoerregio Amsterdam.
References
Alonso-González, M., van Oort, N., Cats, O., Hoogendoorn, S. (2018). The Potential of
Demand Responsive Transport as a Complement to Public Transport: An Assessment
Framework and Empirical Evaluation. Transportation Research Record, 2672 (8), 1-11;
Autowereld. Volkswagen Transporter Kombi - 2.0 TDI 115, 8 Persoons, Lang, Cruise, Airco,
8 Persoons, Lang, Cruise, Airco. (2018). https://www.autowereld.nl/volkswagen/transporter-
kombi/2-0-tdi-115-8-persoons-lang-cruise-airco-20445087/details.html Accessed in:
22.11.18;
Becker, K.H., Kurtenbach, R., Wiesen, P., Jense, T.E., Wallington, T.J. (1999). Nitrous Oxide
(N2O) Emissions from Vehicles. Environ. Sci. Technology, 1999, 33, 22, 4134-4139;
Busphoto. CFP 2093 - 2099, 2052 – 2057. (2019).
http://busfoto.nl/foto/thumbnails.php?album=577 Accessed in: 19.06.19;
CBS. Kerncijfers postcodegebieden, 2008-2010. (2012). https://www.cbs.nl/nl-
nl/maatwerk/2012/01/kerncijfers-postcodegebieden-2008-2010. Accessed in: 02.11.18;
Cole, L. (1968). Tomorrow’s transportation: New systems for the urban future. Retrieved from
http://ntl.bts.gov/lib/24000/24500/24577/Tomorrows%7B_%7DTransportation%7B_%7D
srch.pdf%5Cnhttps://trid.trb.org/view/129263;
Coutinho, F. (2019). Evaluation of the impacts coming from the transformation of fixed bus
lines into demand-responsive systems. Master thesis. École des Ponts Paristech;
Davison, L., Enoch, M., Ryley, T., Quddus, M., Wang, C. (2014). A survey of Demand
Responsive Transport in Great Britain. Transport Policy, Volume 31, 47-54;

Impacts of replacing a fixed transit line by a Demand Responsive Transit system
Page 16 of 20
Ellis, E. McCollom, B. (2009). TCRP Report 136: Guidebook for Rural Demand-Response
Transportation: Measuring, Assessing, and Improving Performance. Retrieved from
http://www.trb.org/Publications/Blurbs/162701.aspx;
Feigon, S., Murphy, C., McAdam, T. (2018). TCRP Report Research Report 196, Private
Transit: Existing Services and Emerging Directions. Retrieved from
http://www.trb.org/TCRP/Blurbs/177189.aspx;
Google Maps. (2018). https://www.google.com/maps/ Accessed in 30.10.18;
Green car reports. VW plans for electric trucks and buses, starting production next year.
(2017). https://www.greencarreports.com/news/1113283_vw-plans-for-electric-trucks-and-
buses-starting-production-next-year Accessed in: 19.06.19;
GVB. Facts and figures. (2018). https://en.gvb.nl/organisatie/feiten-en-cijfers Accessed in:
10/12/18;
Hermes. Bravoflex. (2019). https://www.hermes.nl/bravoflex/1466 Accessed in: 15.01.19;
ITCFL (Institute for Transportation and Communication Friedrich List). (1982). Computer
controlled urban transportation: A survey of Concepts, Methods and International
Experiences. Retrieved from http://pure.iiasa.ac.at/id/eprint/1830/;
Lasdon, L., Mahmassani, H., Dutt, S. (2000). Transit scheduling data integration: paratransit
operations review and analysis. Retrieved from http://ctr.utexas.edu/wp-
content/uploads/pubs/1884_1.pdf;
Laws, R., Enoch, M., Ison, S. (2009). Demand Responsive Transport: A Review of Schemes
in England and Wales. Journal of Public Transportation, 12 (1): 19-37;
McCoy, K., Andrew, J., Glynn, R., Lyons, W. (2018). Integrating Shared Mobility into
Multimodal Transportation Planning: Improving Regional Performance to Meet Public Goals.
Retrieved from https://www.planning.dot.gov/documents/SharedMobility_Whitepaper_02-
2018.pdf;
MOG (Move on Green). (2014). Policy guidelines for sustainable mobility in rural and
mountain áreas. Retrieved from https://www.euromontana.org/wp-
content/uploads/2014/06/Policy_Guidelines_Final_with_layout.pdf;
Moovit. All Bus Lines in Netherlands by GVB. (2018).
https://moovitapp.com/index/en/public_transit-lines-Netherlands-1-101-884629 Accessed in
30.10.18;
Nam., E.K., Jensen, T.E., Wallington, T.J. (2004). Methane Emissions from Vehicles.
Environ. Sci. Technol, 2004, 38, 7, 2005-2010;
O’Leary, K. (1974). Planning for new and integrated demand responsive systems. Fifth
Annual Conference on Demand-Responsive Transportation Systems. Oakland, California,
11-13 November 1974;

Impacts of replacing a fixed transit line by a Demand Responsive Transit system
Page 17 of 20
RDW. RDW Kentekencheck. (2019). https://ovi.rdw.nl/default.aspx Accessed in: 14.06.19;
Strobel, H. (1982). Computer Controlled Urban Transportation, A Survey of Concepts,
Methods, and International Experiences. Retrieved from http://pure.iiasa.ac.at/id/eprint/1830/;
Traminfo. Gemeentevervoerbedrijf Amsterdam - Serie 2052-2057. (2019).
http://www.traminfo.nl/busserie141.html Accessed in: 19.06.19;
Casey, R., Labell, L., Prensky, S., Schweiger, C. (1991). Advanced Public Transportation
Systems: The State of the Art. Retrieved from
https://archive.org/details/advancedpublictr00case/page/n2;
Laver, R., Schnek, D., Skorupski, D., Brady, S., Cham, L., Hamilton, B. (2007). Useful Life of
Transit Buses and Vans. Retrieved from
https://www.transitwiki.org/TransitWiki/images/6/64/Useful_Life_of_Buses.pdf;
Van Oort, N., van der Bijl, R., Verhoof, F. (2017). The wider benefits of high-quality public
transport for cities. European Transport Conference, Barcelona, October, 2017;
Van Oort, N., T. Brands, E. de Romph. (2015). Short-Term Prediction of Ridership on Public
Transport with Smart Card Data. Transportation Research Record, No. 2535, pp. 105-111.
Vuchic, V., Clarke, R., Molinero, A. (1981). Timed Transfer System Planning, Design and
Operation. Retrieved from https://repository.upenn.edu/ese_papers/731/;
Webster, F. (1974). Supplementary report 76 UC, Research and public transport. Retrieved
from https://trl.co.uk/sites/default/files/SR076.pdf.Westervelt, M., Huang, E., Schanl, J.,
Borgman, N., Fuhrer, T., Narula-Woods, R. (2018). Up Routed: Exploring Microtransit in the
United Stated. Retrieved from https://www.enotrans.org/etl-material/uprouted-exploring-
microtransit-united-states/;
Wilds, M., Talley, W. Dial-a-Ride and Bus Transit Services: A Mode-Choice Analysis.
Transportation Research Record, 984, 63-66;
Wilson, N., Sussman, J., Goodman, L., Higonnet, B. (1969). Simulation of a Computer Aided
Routing System (CARS). Proceedings of the third conference on Applications of simulation,
Los Angeles, California, 8-10 December 1969.
Examples:
Impacts of replacing a fixed transit line by a Demand Responsive Transit system
Page 18 of 20
Reference to a book:
Strunk, W., Jr., & White, E. B. (2000). The elements of style. (4th ed.). New York: Longman,
(Chapter 4).
Reference to a chapter in an edited book:
Mettam, G. R., & Adams, L. B. (2009). How to prepare an electronic version of your article. In
B. S. Jones, & R. Z. Smith (Eds.), Introduction to the electronic age (pp. 281–304). New
York: E-Publishing Inc.
Journal abbreviations source
Journal names should be abbreviated according to the List of Title Word Abbreviations:
http://www.issn.org/services/online-services/access-to-the-ltwa/
Citations
Please ensure that every reference cited in the text is also present in the reference list (and
vice versa). Any references cited in the abstract must be given in full.
All citations in the text should refer to:
• Single author: the author's name (without initials, unless there is ambiguity) and the year
of publication;
• Two authors: both authors' names and the year of publication;
• Three or more authors: first author's name followed by 'et al.' and the year of publication.

Impacts of replacing a fixed transit line by a Demand Responsive Transit system
Page 19 of 20
Citations may be made directly (or parenthetically). Groups of references should be listed
first alphabetically, then chronologically.
Examples: ''as demonstrated (Allan, 1996a, 1996b, 1999; Allan and Jones, 1995). Kramer et
al. (2000) have recently shown ''
Reference management software
The Research in Transportation Economics (Elsevier) journal has standard templates
available in key reference management packages – EndNote and Reference Manager. Using
plug-ins to word processing packages, authors only need to select the appropriate journal
template when preparing their article and the list of references and citations to these will be
formatted according to the journal style.

Impacts of replacing a fixed transit line by a Demand Responsive Transit system
Page 20 of 20
Appendix
Commence the appendix on a new page. If there is more than one appendix, they should be
identified as A, B, etc. Formulae and equations in appendices should be given separate
numbering: Eq. (A.1), Eq. (A.2), etc.; in a subsequent appendix, Eq. (B.1) and so on.
Similarly for tables and figures: Table A.1; Fig. A.1, etc.