Impacts of Deforestation on Climate and Water...
15
2 Impacts of Deforestation on Climate and Water Resources in Western Amazon Ranyére Silva Nóbrega University Federal of Pernambuco Brazil 1. Introduction The Amazon importance in several areas of research demonstrates how the region affects the balance of South America and, depending on the scale used, on the planet. The biodiversity, mineral wealth, water resources wealth, carbon sequestration, transport of energy in the atmosphere are examples of important aspects of the region. Another important phenomenon that occurs in the Amazon are the energy flows between soil- vegetation-atmosphere dynamics that affect the climate, water resources and the advection of moisture to the surrounding parts. Deforestation is the major environmental problem in the Amazon River basin nowadays, and its impacts affect both the local and global scale. In fact, this region is responsible for approximately 13% of all global runoff into the oceans (Foley et al., 2002) and its abundant vegetation releases large amounts of water vapor through evapotranspiration leading to a recycling in precipitation of about 25-35% (Brubaker et al, 1993; Eltahir and Bras, 1994; Trenberth, 1999). Rondonia State, located in Western Amazon, already has a large area of vegetation changed by deforestation. Historically, there were tax incentives and government so that there was an expansion of development. Today the concern with changes in environmental balance of the Amazon basin, Rondônia, is justified by the increasing pressure on various forms of exploitation of the region, for example, timber extraction and agricultural expansion, the construction of hydropower, exploitation of biological and mineral riches. Krusche et al. (2005) suggest the following reasons for this progress: between 1970 and 1990 there was a surge in state occupancy with settlers coming from other regions, extensive cattle ranching became the main economic activity and the state ground most is old and weathered, with the exception of some basins, promoting agriculture in an appropriate area. According to the authors, the pattern of occupancy was observed of the "fishbone" associated with the opening of roads. The highway BR-364construction, responsible for turning the region with the rest of the country, was one of the factors that triggered large projects of colonization / occupation. Earlier this deforestation process was seen as boon, as a prerequisite for applying for tenure and subsequent legalization of land (Santos, 2001). Fearnside (2007) assert that the main aspect of change in land use / land cover in region is deforestation, and that it has grown over the years. www.intechopen.com
Transcript of Impacts of Deforestation on Climate and Water...

2
Impacts of Deforestation on Climate and Water Resources in Western Amazon
Ranyére Silva Nóbrega University Federal of Pernambuco
Brazil
1. Introduction
The Amazon importance in several areas of research demonstrates how the region affects the balance of South America and, depending on the scale used, on the planet. The biodiversity, mineral wealth, water resources wealth, carbon sequestration, transport of energy in the atmosphere are examples of important aspects of the region. Another important phenomenon that occurs in the Amazon are the energy flows between soil-vegetation-atmosphere dynamics that affect the climate, water resources and the advection of moisture to the surrounding parts. Deforestation is the major environmental problem in the Amazon River basin nowadays,
and its impacts affect both the local and global scale. In fact, this region is responsible for
approximately 13% of all global runoff into the oceans (Foley et al., 2002) and its abundant
vegetation releases large amounts of water vapor through evapotranspiration leading to a
recycling in precipitation of about 25-35% (Brubaker et al, 1993; Eltahir and Bras, 1994;
Trenberth, 1999).
Rondonia State, located in Western Amazon, already has a large area of vegetation changed
by deforestation. Historically, there were tax incentives and government so that there was
an expansion of development. Today the concern with changes in environmental balance of
the Amazon basin, Rondônia, is justified by the increasing pressure on various forms of
exploitation of the region, for example, timber extraction and agricultural expansion, the
construction of hydropower, exploitation of biological and mineral riches.
Krusche et al. (2005) suggest the following reasons for this progress: between 1970 and 1990
there was a surge in state occupancy with settlers coming from other regions, extensive
cattle ranching became the main economic activity and the state ground most is old and
weathered, with the exception of some basins, promoting agriculture in an appropriate area.
According to the authors, the pattern of occupancy was observed of the "fishbone"
associated with the opening of roads.
The highway BR-364construction, responsible for turning the region with the rest of the
country, was one of the factors that triggered large projects of colonization / occupation.
Earlier this deforestation process was seen as boon, as a prerequisite for applying for tenure
and subsequent legalization of land (Santos, 2001). Fearnside (2007) assert that the main
aspect of change in land use / land cover in region is deforestation, and that it has grown
over the years.
www.intechopen.com

Deforestation Around the World
22
Deforestation rates of the State during the period 1988 to 2007 followed, in general, the same degradation that deforestation in the Amazon, since it has to be estimated. The most relevant peaks occurred in 1994 and 2004, showing a slight decrease for the years 2005 to 2007, however, leaving the state responsible for a higher percentage than the last 10 years earlier, reflecting a greater intensity on change in coverage plant that closed in the rest of the Amazon.
Year
Deforestation (km2) %
Rondönia Amazon
1988 2340 21050 11.10
1989 1430 17770 8.00
1990 1670 13730 12.20
1991 1110 11030 10.10
1992 2265 13786 16.40
1993 2595 14896 17.40
1994 2595 14896 17.40
1995 4730 29059 16.30
1996 2432 18161 13.40
1997 1986 13227 15.00
1998 2041 17383 11.70
1999 2358 17259 13.70
2000 2465 18226 13.50
2001 2673 18165 14.70
2002 3067 21651 14.50
2003 3620 25396 14.40
2004 3834 27772 14.00
2005 3233 19014 17.00
2006 2062 14286 14.70
2007 1611 11651 13.82
2008 1136 12911 10.00
2009 482 7464 6.45%
2010 427 6451 6.6%
Table 1. Annual deforestation rates - Amazon and Rondônia (Source data: Prodes, Inpe)
Public policies has been working to combat deforestation across the Amazon, we can observe the decrease in the rate since 2007, however, has been observed that in conservation areas this rate is increasing. The proposal chapter is investigating the impacts that deforestation and climate change can lead on hydrological cycle in the region, as well as the feedback system of climate and hydrological cycle.
www.intechopen.com

Impacts of Deforestation on Climate and Water Resources in Western Amazon
23
2. Metodology
The study is centered in Rondônia state, whose area of about 234.000 km2. The state's
network runoff is represented by Madeira river (an important tributary of the Amazonian
river basin) and its streams that form eight important sub river basins, among them, it is the
Jamari sub river basin (Fig. 1). About 28% of the Rondônia state have already been
deforested, because of this, is used as the test catchment study.
The Jamari river basin has suffered a substantial deforestation due to the advance of the
agricultural frontier in the Rondônia state. The basin is crossed by two important rivers
namely Jamari and Candeias. Jamari river has its nascent in the southwest part of “Serra do
Pacaás Novos”, in Rondônia, and streams northward flowing into the right bank of Madeira
river, whose river basin is defined by the geographical coordinates 08º 28'S to 11º 07'S of
latitude and 62º 36'W to 64º 20'W of longitude with about 29.066.68 km² of area.
The semi-distributed hydrological model SLURP with more detailed input parametric
information will be used in this research in order to investigate the impacts caused by
deforestation as well as climate changes on hydrological processes in Jamari River basin.
Realistic and extremes scenarios of deforestation will be analyzed, and also scenarios of
temperature rise and precipitation increase/decrease.
Fig. 1. Localization and drainage network Jamari sub river basin.
www.intechopen.com

Deforestation Around the World
24
2.1 Hydrological model
Semi-distributed Land Use-based Runoff Processes - SLURP is a basin model that simulates
the hydrological cycle from precipitation to runoff including the effects of reservoirs,
regulators and water extractions (Kite, 2005). First divides a basin into sub-basins using
topography from a digital elevation map. These sub-basins are further divided into areas of
different land covers using data from a digital land cover classification. Each land cover
class has a distinct set of parameters for the model.
This model uses basically three types of data: i) digital elevation data (DEM); ii) land cover
data; and iii) climatic data. The matrix data of both DEM and land cover data must have the
same dimension. Climatic data should contain: precipitation, air temperature, dew-point
temperature (or relative humidity), solar radiation and wind intensity. Firstly, it divides a
hydrological basin into sub-river basins and then divides each sub-river basin into land
cover components using the public-domain topographic analysis software TOPAZ (and
Martz and Garbreht, 1999). These homogeneous areas are based on the hydrological
response unit (HRU) concept described by Kite (2005). SLURP defines these areas as
Aggregated Simulation Areas (ASA).
The model has been applied in many countries for small hectares basins (Su et al., 2000) to
large basins such as Mackenzie (Kite et al., 1994) and it was developed to make maximum
use of remote sensing data. Applications of the model includes studies of climate change
(Kite, 1993), hydropower (Kite et al., 1998), water productivity (Kite, 2005), irrigation (Kite
and Droogers, 1999) and wildlife refuges (de Voogt et al., 1999), contribution of snowmelt to
runoff (Laurente and Valeo, 2003; Thorne and Woo, 2006), and large mountainous
catchment (Thorne and Woo, 2006). However, the SLURP model was not used in the
Amazon, and its conceptual approach allows its use in regions with little data, as well as the
possibility and direct use of remote sensing data which allows to retrieve physical
parameters with good accuracy, even in basins with small slopes, as found in some sub-
basins in the Amazon River.
2.2 Data
Digital Elevation Model - DEM from the Shuttle Radar Topography Mission (SRTM) with
90-m resolution horizontal was used to obtain topography. In order to correct failures, it was
used the technique of space filtering, interactive filling.
For actual land cover data it was used seven images of Landsat 7 scenes 2007 over the Jamari sub-river basin, resolution of 30m, provided by Amazonian Protection System (SIPAM). Firstly, the scenes were georeferenced and then a mosaic was composed. Secondly, NDVI performed a supervised classification to obtain the land-cover image. Then, the data was sampled again to 90m resolution, since the SLURP requires that the matrix of land cover has the same size of DEM. Finally, the data was classified into four classes: water, forest, non-forest and man-modified (urbanized). The non-forest class includes agricultural areas and the savannah.
2.3 Climatic, rainfall and runoff data
Climatic, rainfall and runoff data are some of the main difficulties in hydrometeorological modeling in the Amazon. The time series available is short and has many flaws. Was used data set from four stations with information about precipitation, air temperature and dew
www.intechopen.com

Impacts of Deforestation on Climate and Water Resources in Western Amazon
25
point of the Agency for Environmental Development in Rondônia (SEDAM). We also use data from five rainfall gauge of the National Water Agency (ANA). The data sets are from the period between 1 January 1999 and December 31, 2007.
2.4 Model performance evaluation criteria
Model performance was evaluated by using four different error measures: Nash and Sutcliffe (NS), Percent BIAS (PBIAS), Daily Root Mean Square (DRMS) error criteria (Zhi et al., 2009; Moriasi et al., 2007), and Deviation Volume (D%) (Kite, 2005). The equations were given as showed below:
n 2(Q Q )obs modi 1S 1 n 2(Q Q )obs obsdi 1
N
(1)
where Qobs and Qmod are the measured and modeled data, respectively; . obsdQ . is average
modeled data; and n is the total number of data records. The coefficient can range from -∞ to
1 and represents the amount of data oscillation that is explained by the model. The model is
considered optimal if NS = 1, appropriate and good if NS > 0.75, acceptable if 0.36 <NS
<0.75, and unacceptable if NS <0.35. If NS < 0, the predictor is worse than the average
(Nóbrega, 2008).
n(Q Q )obs modi 1PBIAS n
Qobsi 1
(2)
where Qobs and Qmod are the measured and modeled data, respectively. The optimal value of PBIAS is 0. Low magnitude values indicate accurate model simulation; PBIAS > 0 indicate model underestimation bias; and PBIAS < 0 indicate model overestimation bias (Zhi, 2009).
n(Q Q )obs modi 1PBIAS n
Qobsi 1
(3)
RSR varies from optimal value of 0, which indicates zero RSME or residual variability and
therefore perfect model simulation, to large positive values; the smaller RSR the better the
model simulation performs (Zhi, 2009; Kannan et al., 2007).
Q Qobs modD (%) 100.v
Qobs
(4)
This criterion is simply a change in the pattern of calculated and observed average in the simulated period, which is a statistical test comparing the simulated discharge volumes to measures during the event, generating information about performance of the water balance total modeled. A value of zero indicates optimal modeling, or no difference between the
www.intechopen.com

Deforestation Around the World
26
volumes measured and simulated. A positive value indicates underestimation of the simulated volumes (losses in origin). A negative value indicates that the calculated average flow is high (losses in sinks) (Kite, 2005).
3. Simulations
Based on the percentage of deforestation in the basin obtained from the PRODES data (Table
2) it was defined two trends scenarios: i) DEFOR+20, 20% more deforestation area, and ii)
DEFOR+30, 30% deforestation area. It was defined three extreme scenarios of land cover for
investigating the relationship between soil-cover change and runoff within SLURP model.
The experiments are: i) 100%FOR, one hundred per cent with forest and water; ii)
100%NOFOR, one hundred per cent with savannah plus pasture and water; and iii)
100%MANMODIF, one hundred per cent man-modified area and water. For climatic
impacts analysis has been used two scenarios. The scenarios were based in climate futures
projections up to 2050 A2 HadCM3 model, discussed in Marengo (2006b). In both scenarios
is assumed that the temperature rise 2oC, and rainfall varies 20%, decreasing and increasing.
The climate scenarios are: i) P+20, meaning 20% increase in rainfall, with an increase in
temperature of 2 degrees, and ii) P-20, meaning 20% reduction in rainfall, with an increase in
temperature of 2 degrees.
SCENARIO DESCRIPTION
DEFOR+20 20% more deforestation area
DEFOR+30 30% more deforestation area
100%FOR 100% forest area
100%NOFOR 100% savannah plus pasture
100%MANMODIF 100% man-modified area
P+20 20% increase in rainfall, and 2oC temperature increase
P-20 20% decrease in rainfall, and 2oC temperature increase
Table 2. Simulations scenarios
3.1 Problems identified – implementation of necessary remedial measures
SLURP model needs data from weather stations which contains precipitation, temperature,
humidity and wind. The average is calculated using the Thiessen polygons method for each
ASA. If there is no such data, the model does not perform the simulation (for example, when
there is rainfall data, but there is not temperature).
In some countries, such as Brazil, it is common to have only rainfall station, instead of
weather station, making the network rainfall much denser than the weather. But the
compilation of the model does not allow the use of this data. Aiming to overcome this
limitation, we tried to develop a methodology that would use the climatic stations without
changing the source code of the model. Adopted method is based on the concept that the
spatial variability of precipitation is less than the other data, such as temperature. Then,
without the model, it was calculated the mean rainfall for each ASA also using the Thiessen
method, but including the data from rainfall stations. After that, the files of average
precipitation for each ASA were replaced.
www.intechopen.com
Impacts of Deforestation on Climate and Water Resources in Western Amazon
27
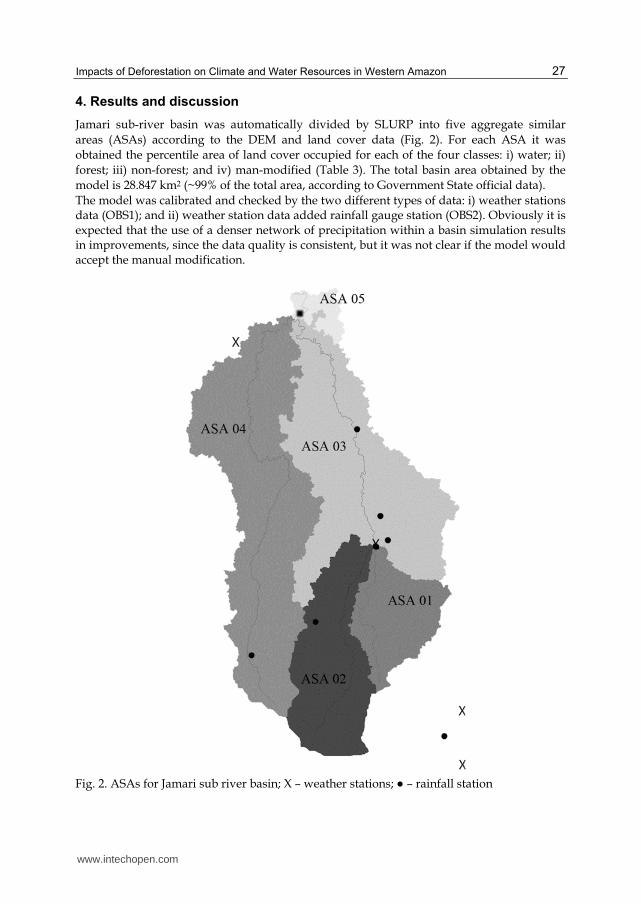
4. Results and discussion
Jamari sub-river basin was automatically divided by SLURP into five aggregate similar
areas (ASAs) according to the DEM and land cover data (Fig. 2). For each ASA it was
obtained the percentile area of land cover occupied for each of the four classes: i) water; ii)
forest; iii) non-forest; and iv) man-modified (Table 3). The total basin area obtained by the
model is 28.847 km2 (~99% of the total area, according to Government State official data).
The model was calibrated and checked by the two different types of data: i) weather stations data (OBS1); and ii) weather station data added rainfall gauge station (OBS2). Obviously it is expected that the use of a denser network of precipitation within a basin simulation results in improvements, since the data quality is consistent, but it was not clear if the model would accept the manual modification.
Fig. 2. ASAs for Jamari sub river basin; X – weather stations; ● – rainfall station
www.intechopen.com

Deforestation Around the World
28
ASA Name Water Forest Non forest Man modified Total (km2)
ASA 01 9.0 63.0 7.8 20.2 3025.81
ASA 02 3.6 67.3 11.7 17.4 5007.65
ASA 03 9.3 61.3 7.0 22.4 9239.68
ASA 04 3.9 62.2 11.4 22.5 10999.55
ASA 05 4.1 93.8 2.0 0.1 573.94
Table 3. Land coverage and total area for each ASA (%)
The NS, RSR, PBIAS and D(%) for OBS2(OBS1) calibration period was 0.88(0.74), 0.31(0.45), -
7%(-12%) and -0.94%(-10.1%), respectively. The NS, RSR, PBIAS and D(%) for OBS2(OBS1)
validation period was 0.84(0.71), 0.34(0.48), -8%(-15%) and -13.4(-10.3). The verification of
the model efficiency criteria indicates that the values are acceptable during both the
calibration and validation period. (Table 3), but it is clear that the model did better with the
inclusion of climatic stations. From this point, we used OBS2 data with SLURP climate
input.
4.1 Calibration and verification
Model was calibrated and verified by the two different types of data: i) weather stations
data (OBS1); and ii) weather station data added rainfall gauge station (OBS2). Obviously it is
expected that the use of a denser network of precipitation within a basin simulation results
in improvements, since the data quality is consistent, but it was not clear if the model would
accept the manual modification.
The NS, RSR, PBIAS and D(%) for OBS2(OBS1) calibration period was 0.88(0.74), 0.31(0.45), -
7%(-12%) and -0.94%(-10.1%), respectively. The NS, RSR, PBIAS and D(%) for OBS2(OBS1)
validation period was 0.84(0.71), 0.34(0.48), -8%(-15%) and -13.4(-10.3). Model efficiency
criteria verification indicates that the values are acceptable during both the calibration and
validation period (Table 4), but it is clear that the model did better with the inclusion of
climatic stations, therefore, used OBS2 data with climate input.
OBS2 (OBS1) NS RSR PBIAS D(%)
Calibration 0.88 (0.74) 0.31(0.45) -7%(-12%) -0.94 (-10.1)
Verification 0.84 (0.71) 0.34(0.48) -8% (-15%) -13.4 (-10.3)
Table 4. Model performance
4.2 Deforestation impacts
Taking into account the current deforestation rate in the area which is being studied, the
trend scenarios can be designed by 2013 and 2016, respectively. The results for DEFOR+20%
and DEFOR+30% indicated increased runoff compared to the average from 1999-2007, 825.3
m3.s-1, to 1048.1 m3.s-1 and 1163.7 m3.s-1, resulting in an increase of 27% and 41%,
respectively. During the dry season (characterized by a weak runoff), the flow trends to
increase remarkably, what can be a concern for local population who use these rivers for
www.intechopen.com

Impacts of Deforestation on Climate and Water Resources in Western Amazon
29
human supply, navigation (in some places, the only kind of transportation), and also for
power generation. If these scenarios become real, the rivers of the basin will be subjected to
a different runoff pattern that might cause some socioeconomic impact. Although the
extreme scenarios are not realistic, the results are instructive because they clarify the non-
linear response of the hydrological cycle to the progressive changes in land cover.
When modifying the land cover to 100%FOR, the annual calculated runoff average
decreased from 825.3m3.s-1 to 329.1 m3.s-1, i.e., a decrease of about 60%. On the other hand,
for the scenarios with 100%NOFOR and 100%MANMODIF, runoff increased to 2313.1m3.s-1,
and 1729.4m3.s-1, an increase of 181%, and 109% of the observed annual runoff average,
respectively.
The parameters that most influenced the results in these scenarios were related to the
amount of available soil water for evapotranspiration and canopy interception, which were
modified according to the soil cover. The high interception in scenario 100%FOR leads to a
reduction of precipitation that reaches the soil and thus reduces runoff. It also reduces the
amount of water available for evaporation. Furthermore, the increase of flowing in scenarios
100%NOFOREST and 100%MANMODIF is due to the substantial decrease in
evapotranspiration and rainfall interception by the canopy. It is worth mentioning that this
study used the same series of precipitation for all scenarios, but the precipitation in the
region is a variable that has its intensity, largely influenced by local evaporation. Hence,
decrease in evapotranspiration tends to reduce rainfall. The use of SLURP coupled to an
atmospheric model can reveal more about this feedback mechanism in further studies.
The elements of water balance are shown in Fig. 3. It may be noticed that evapotranspiration
varies slightly between the scenarios, except the 100%NOFOR, where evapotranspiration is
approximately 90% the value of the other scenarios. However, when the exchange of water
between the surface and the atmosphere is divided into evaporation and transpiration, the
peculiarities of each scenario are quite evident. In 100%FOREST, transpiration contributed
to the increase of evapotranspiration. This is quite obvious, since in this scenario, the
interaction between the surface and free atmosphere is dominated by the exchange of
processes in the vegetation canopy. In 100% NOFOREST, the land cover formed by the
typical savanna and pasture vegetation makes the transpiration to be twice as much as
evaporation. In 100% MANMODIF, the deforested soil with urban characteristic implies a
greater contribution in evaporation than in transpiration.
It can be observed that the evapotranspiration and groundwater reduces slightly with the
decrease of forest areas when we compare with the trend scenarios. In terms of numbers the
evapotranspiration decreased from 20% to 30%, respectively; groundwater flow decreased
20% and 8%, respectively. As long as deforestation leads to less water interception by
vegetation, the contribution of evaporation increases with the expansion of the deforested
area.
Several studies suggest the local contribution of evapotranspiration as responsible for about
50% of the precipitation that occurs in western Amazonia (Nóbrega, 2005; Marengo, 2006a;
Nóbrega, 2008). Therefore, a decrease in vegetation cover over a region can alter the
precipitation regime is this region (and neighborhood), decreasing the amount of water
vapor originated there, because the evapotranspiration decreased in these simulated
scenarios, and this trend, combined with the increase in flowing during dry periods, may
worsen social and environmental problems during more critical periods.
www.intechopen.com
Deforestation Around the World
30
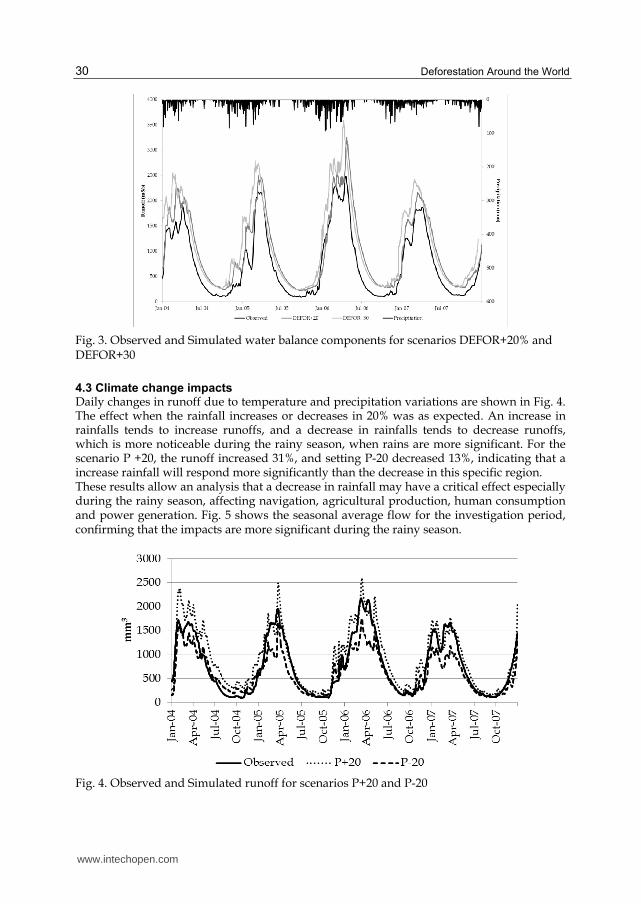
Fig. 3. Observed and Simulated water balance components for scenarios DEFOR+20% and DEFOR+30
4.3 Climate change impacts Daily changes in runoff due to temperature and precipitation variations are shown in Fig. 4. The effect when the rainfall increases or decreases in 20% was as expected. An increase in rainfalls tends to increase runoffs, and a decrease in rainfalls tends to decrease runoffs, which is more noticeable during the rainy season, when rains are more significant. For the scenario P +20, the runoff increased 31%, and setting P-20 decreased 13%, indicating that a increase rainfall will respond more significantly than the decrease in this specific region. These results allow an analysis that a decrease in rainfall may have a critical effect especially during the rainy season, affecting navigation, agricultural production, human consumption and power generation. Fig. 5 shows the seasonal average flow for the investigation period, confirming that the impacts are more significant during the rainy season.
Fig. 4. Observed and Simulated runoff for scenarios P+20 and P-20
www.intechopen.com

Impacts of Deforestation on Climate and Water Resources in Western Amazon
31
0
500
1000
1500
2000
2500
Jan Feb Mar Apr May Jun Jul Aug Sep Oct Nov Dez
mm
3/s
Observed P+20 P-20
Fig. 5. Superficial runoff monthly average Observed and simulated for scenarios P+20 and P-20
Water balance changes due to changes in temperature and precipitation, it was observed
that an increase in temperature tends to increase transpiration in both scenarios, and a
decrease in rainfall tends to reduce evaporation (Fig. 6). The evapotranspiration increases
30% and 54%, evaporation decreases 21% and increases 3%, transpiration increases 37% and
41%, and groundwater decreases 35% and 33% for the sets of P-20 and P +20 respectively.
0
20
40
60
80
100
120
140
160
Default P-20 P+20
(mm
/yr)
.10
2
ETp E T G
Fig. 6. Observed (Default) and simulated water balance components for scenarios P+20 and P-20
It is important to mention that the simulation did not consider the impacts that deforestation would cause on climatic variables. Although with the results obtained from the simulation, it is possible to conclude that deforestation modifies substantially physical processes of the hydrological cycle.
www.intechopen.com

Deforestation Around the World
32
Impacts are easier to be seen during the rainy season. Furthermore, with less water available
for evapotranspiration, the vegetation may suffer from water stress. Although some authors
found a precipitation increase in deforested areas (Li et al., 2007), if the deforestation keeps
on increasing, the changes in the hydrological cycle might become unsustainable. The
change in cover / land use can lead the current system to a new dry equilibrium, and
vegetation should be modified to adapt itself to climate changes.
5. Conclusions
Firstly, it was needed to make sure if the model could be used in that region, due to the lack
of some meteorological data and the small slope of the region. Based on the NASH, RSR,
PBIAS and D% criteria, the results indicate acceptable values. Furthermore, since it is a
semi-distributed model, it requires less startup parameters than the distributed models, and
also is able to calculate results faster.
Deforestation in Amazonia has been occurring for some decades and the rate of annual
growth is noticeable. In addition, this might be influenced by climatic and social-economics
factors. Land cover/use changes simulations indicated that the runoff can be changed. The
results suggest that there is an increase in runoff when deforestation occurs in the extreme
and trend scenarios, associated with less interception of water by the canopy. If the average
rate of deforestation continues to be about 3.45% per year in the basin, our simulations
predict that the annual runoff will increase about 27% by 2013 and 41% by 2016. Samuel
Hydropower, located on the Jamari river, began to be built in 1982. Between 2004 and 2006,
the hydropower floodgates had to be opened because the river level reached its maximum
level.
The results make us believe that the ongoing deforestation could be responsible for opening these floodgates, since the observed data do not indicate more rain than the average. In used model, sediment load that affects the level increase of the river is not taken into account, but it is likely to result in a sediment increase due to the silt produced by deforestation. Evapotranspiration and groundwater tend to decrease with deforestation. Results show that
the main impact might occur on transpiration, which tends to decrease with deforestation,
while the evaporation tends to increase. Alterations in water balance in the Amazon can
result in modifications in the local hydrological cycle, and agreeing with other studies, it
will affect rain patterns there and close areas, once the water vapor generated goes straight
to the neighborhood.
6. References
Brubaker, L.K., Entekhabi, D., and P.S. Eagleson. (1993). Estimation of continental precipitation recycling. J. Climate, Vol. 6, pp. 1077-1089.
de Voogt, K., Kite, G.W., Droogers, P., and H. Murray-Rust. (1999). Modeling water allocation between a wetland and irrigated agriculture in the Gediz Basin, Turkey. Research Report, International Water Management Institute, Colombo, Sri Lanka
www.intechopen.com

Impacts of Deforestation on Climate and Water Resources in Western Amazon
33
Eltahir, E.A.B., and R.L. Bras. (1994). Precipitation recycling in the Amazon basin. Quart. J. R. Met. Soc., Vol. 120, pp. 861-880.
Fearnside, P.M. (2007). Deforestation in Amazonia. Encyclopedia of Earth. Eds. C.J. Cleveland (General Editor) & M. Hall-Beyer (Topic Editor). Environmental Information Coalition, National Council for Science and the Environment, Washington, D.C., U.S.A.
Foley, I.A., Botta, A., Coe, M.T., and M.H. Costa. (2002). The El Niño-Southern Oscillation and the climate ecosystem and river of Amazonia. G. Biogeochemical Cycles, Vol.16, pp.1132-1144.
Kannan, N. et al., (2007). Hydrological modelling of a small catchment using SWAT-2000 – Ensuring correct flow partitioning for contaminant modeling. J. Hydrology, Vol. 3(34) pp. 64-72.
Kite, G.W. (2005). Manual for the SLURP hydrological model. 236 p. Kite, G.W., and P. Droogers. (1999). Irrigation modeling in the context of basin water
resources. J. Water Resources Development, Vol.15, pp. 43-54. Kite, G.W., Danard, M., and B. LI. (1998). Simulating long series of streamflow using data
from an atmospheric model. Hydrological Sciences, Vol.43(3). Kite, G.W., and P. Droogers. (1999). Irrigation modeling in the context of basin water
resources. J. Water Resources Development, Vol.15, pp. 43-54. Krusche, A.V., Ballester, M.V.R., and R.L. Victoria. (2005). Effects of land use changes in the
biogeochemistry of fluvial systems of the Ji-Paraná river basin, Rondônia. Acta Amazônica, Vol. 35(2), pp. 192-205.
Laurent, MESt, C. Valeo. (2003). Modeling runoff in the northern boreal forest using SLURP with snow ripening and frozen ground. Geophysical Research Abstracts, Vol. 5, pp. 06-30.
Li, K.Y., Coe, M.T., Ramankutty, N., and R. Jong. (2007). Modeling the hydrological impact of land-use change in West Africa. J. Hydrology, Vol. 337, pp. 258-268.
Marengo, J.A., (2006a). On the hydrological cycle of the Amazon basin: a historical review and current state-of-the-art. Rev. Brasil. Meteorologia, Vol. 21(3), pp. 1-19.
Marengo, J.A., (2006b). Global Climate Changesand biodiversity efects. 201 p. Martz, W., and J. Garbrecht. (1999). An outlet breaching algorithm for the treatment of
closed depressions in a raster DEM. Computers & Geosciences, Vol. 25, pp. 835-844.
Moriasi, D.N. et al., (2007). Model evaluation guidelines for systematic quantification of accuracy in watershed simulations. Vol. 50(3), pp. 885-900.
Nóbrega R.S., (2008). Modeling impacts of deforestation in water resources of river basin Jamari (RO) using data surface and TRMM. D.Sc. Thesis. Federal University of Campina Grande, Paraíba, Brasil. 212p.
Santos, C. A. (2001). Fronteira do Guaporé. Porto Velho/RO: EDUFRO. Su, M, Stolte, W.J., and G. van der Kamp. (2000). Modeling Canadian prairie wetland
hydrology using a semi-distributed streamflow model. Hydrological Processes, Vol.14(14), pp. 2405-2422.
Thorne R., and M. Woo. (2006). Efficacy of a hydrologic model in simulating discharge from a large mountainous catchment. J. of Hydrol, Vol. 30(1-2), pp.301-312.
Trenberth, K.E. (1999). Atmospheric Moisture Recycling: Role of Advection and Local Evaporation. J. Climate, Vol. 12, pp.1368-1381.
www.intechopen.com

Deforestation Around the World
34
Zhi, L., et al., (2009). Impacts of land use change and climate variability on hydrology in an agricultural catchment on the Loess Plateau of China. J. Hydrology (doi: 10.116/j.jhydrol.2009.08.007)
www.intechopen.com

Deforestation Around the WorldEdited by Dr. Paulo Moutinho
ISBN 978-953-51-0417-9Hard cover, 372 pagesPublisher InTechPublished online 30, March, 2012Published in print edition March, 2012
InTech EuropeUniversity Campus STeP Ri Slavka Krautzeka 83/A 51000 Rijeka, Croatia Phone: +385 (51) 770 447 Fax: +385 (51) 686 166www.intechopen.com
InTech ChinaUnit 405, Office Block, Hotel Equatorial Shanghai No.65, Yan An Road (West), Shanghai, 200040, China
Phone: +86-21-62489820 Fax: +86-21-62489821
Deforestation and forest degradation represent a significant fraction of the annual worldwide human-inducedemission of greenhouse gases to the atmosphere, the main source of biodiversity losses and the destructionof millions of people's homes. Despite local/regional causes, its consequences are global. This book providesa general view about deforestation dynamics around the world, incorporating analyses of its causes, impactsand actions to prevent it. Its 17 Chapters, organized in three sections, refer to deforestation impacts onclimate, soil, biodiversity and human population, but also describe several initiatives to prevent it. A specialemphasis is given to different remote-sensing and mapping techniques that could be used as a source fordecision-makers and society to promote forest conservation and control deforestation.
How to referenceIn order to correctly reference this scholarly work, feel free to copy and paste the following:
Ranyére Silva Nóbrega (2012). Impacts of Deforestation on Climate and Water Resources in WesternAmazon, Deforestation Around the World, Dr. Paulo Moutinho (Ed.), ISBN: 978-953-51-0417-9, InTech,Available from: http://www.intechopen.com/books/deforestation-around-the-world/impacts-of-deforestation-on-climate-and-water-resources-in-western-amazon