Impact of animal source foods on growth, morbidity and ...
176
Impact of animal source foods on growth, morbidity and iron bioavailability in Kenyan school children Monika Grillenberger
Transcript of Impact of animal source foods on growth, morbidity and ...

Impact of animal source foods on growth, morbidity and iron bioavailability in Kenyan school children
Monika Grillenberger
Promotoren
Prof. Dr. Joseph G.A.J. Hautvast Hoogleraar Voeding en Gezondheid Wageningen Universiteit Prof. Dr. Ir. Frans J. Kok Hoogleraar Voeding en Gezondheid Wageningen Universiteit Co-promotor
Prof. Dr. Charlotte G. Neumann Professor in Community Health Sciences and Pediatrics School of Public Health, University of California, Los Angeles, USA Promotiecommissie
Prof. Dr. Wija A. van Staveren Wageningen Universiteit Dr. Jules J.M. Tolboom Universitair Medisch Centrum St Radboud, Nijmegen Prof. Dr. Ir. Martin W.A. Verstegen Wageningen Universiteit Dr. Ir. Marti van Liere Unilever Health Institute, Vlaardingen
Dit onderzoek is uitgevoerd binnen de onderzoekschool VLAG.

Impact of animal source foods on growth, morbidity and iron bioavailability in Kenyan school children
Monika Grillenberger
Proefschrift
ter verkrijging van de graad van doctor
op gezag van de rector magnificus
van Wageningen Universiteit,
Prof. Dr. M.J. Kropff,
in het openbaar te verdedigen
op woensdag 19 april 2006
des namiddags te vier uur in de Aula.

Impact of animal source foods on growth, morbidity and iron bioavailability in Kenyan school children / Monika Grillenberger
Thesis Wageningen University, The Netherlands – with summaries in Dutch and German
ISBN 90-8504-387-5

To all children
“We must move children to the centre of the world’s agenda. We must rewrite strategies to reduce poverty so that investments in children are given priority. Any
country, any society, which does not care for its children, is no nation at all."
-Nelson Mandela, The State of the World's Children, www.unicef.org


AAbbssttrraacctt
Simultaneous multiple micronutrient deficiencies that are highly prevalent in developing countries can impair growth and immunity with an increased risk of morbidity, mortality, and poor psychomotor development. Animal source foods can provide highly bioavailable micronutrients and improve the absorption of micronutrients from plant foods that are less bioavailable. The research presented in this thesis is part of a randomised controlled feeding intervention study that was carried out in order to examine the efficacy of animal source foods in improving cognitive function, growth, and morbidity in rural Kenyan children. Food supplements were provided for two years as a mid-morning snack to children aged 6-9 years from twelve primary schools (n 554). The habitual diet mainly consists of maize and beans with little or no animal source foods and children suffer from stunting and micronutrient deficiencies. Schools were randomly assigned to four study groups: 1) Control: no food supplement provided; 2) Energy supplement: a food supplement based on a local dish of maize, beans and vegetables (githeri); 3) Milk supplement: githeri plus a glass of milk (200 mL); and 4) Meat supplement: githeri with 60 g minced beef. The food supplements were approximately isoenergetic and contained an estimated energy content of ~250 kcal/serving (1050 kJ) during the first three months of the intervention and were then modified to obtain a total energy content of ~300 kcal/serving (1255 kJ). The supplements would supply ~20% of the daily energy requirement, yet the meat supplement would provide highest proportions of recommended amounts of micronutrients, particularly vitamin B12, bioavailable iron and bioavailable zinc, and the milk supplement would provide highest proportions of recommended amounts of vitamin A, riboflavin, calcium and phosphorus. Thus dietary quality would be improved for children receiving the meat or milk supplement compared with children receiving the energy supplement, and dietary quantity would be improved for all supplemented children compared with children in the control group. Weight gain was significantly higher (~10%) in the children receiving any type of food supplement compared with the control group. However, it remains unsolved if it was the energy and/or nutrients provided by the food supplements that resulted in the observed improvement in weight. No overall effect of the food supplementation was found on height. Children receiving the milk supplement who were more stunted gained 1.3 cm (15%) more height than children in the control group. Children receiving the meat supplement gained ~80% more mid-upper-arm muscle area (MMA) than those in the control group and ~30% more than those receiving the milk or energy supplement. Children receiving the milk supplement gained ~40% more MMA than those in the control group. No effects of the food supplements were found on measures of body fat. Analyses of the total diet of the children, i.e., their home diet and the food supplements, revealed that energy from animal source foods, but not total energy, was predictive of gain in height, weight, MMA, and mid-upper-arm fat area. Further, haem iron, preformed vitamin A, calcium and vitamin B12 positively predicted height and weight gain. In contrast, nutrients predominantly found in plant foods and dietary components that inhibit micronutrient absorption, such as fibre and phytate, negatively predicted the children’s growth. No effect of any of the food supplements was found on common childhood diseases or indicators of illness severity, but there was the trend that predicted risks were lowest for children receiving the milk supplement for most of the morbidity outcomes. The amount of absorbed iron in the habitual diet of the children was very low (0.56 ± 0.47 mg/d) due to the high amount of iron absorption inhibitors in the diet. Simulations of different household dietary strategies revealed that the combined addition of meat and ascorbic acid to a meal was the most efficacious approach to reduce the prevalence of inadequate iron intake, which was estimated to be 77% in the habitual diet. The findings of the study indicate that animal source foods can improve iron bioavailability and are beneficial for growth. An increase in the consumption of animal source foods should therefore be part of any program aiming at alleviating micronutrient malnutrition in children in developing countries.

CCoonntteennttss Chapter 1 Introduction 11 Chapter 2 Food supplements have a positive impact on weight gain 43 and the addition of animal source foods increases lean body mass of rural Kenyan school children Chapter 3 Intake of micronutrients high in animal source foods is 61 associated with better growth in rural Kenyan school children Chapter 4 Impact of supplementation with animal source foods on morbidity 81 of rural Kenyan school children Chapter 5 High prevalence of inadequate iron intake in rural 99 Kenyan school children Chapter 6 The potential of household dietary strategies to improve iron 113 nutrition in rural Kenyan school children Chapter 7 General discussion 127 Summary 149 Samenvatting 155 Zusammenfassung 161 Acknowledgements 167 Curriculum Vitae 171 List of publications 172 Educational programme 173


11
IInnttrroodduuccttiioonn

CHAPTER 1
12
MICRONUTRIENT MALNUTRITION IN CHILDREN IN DEVELOPING COUNTRIES
Prevalence, causes and consequences of micronutrient deficiencies
The global elimination or reduction of micronutrient deficiencies, particularly iodine, vitamin A and iron deficiencies were set goals at several international meetings such as the World Summit for Children in 1990. However micronutrient malnutrition is still widely prevalent among children in developing countries and probably the main nutritional problem in the world posing important public health problems with long-term effects on human capital and national economic growth. Besides iron deficiency anaemia, vitamin A deficiency and iodine deficiency disorders, deficiencies of zinc, vitamin B12, folate and others are increasingly recognised. Micronutrient deficiencies that often co-exist with protein-energy malnutrition are not only caused by high morbidity rates and insufficient food quantity, but also by the low quality of the diet common in many areas in developing countries. Diets usually contain few animal products, fruits and vegetables, and predominantly consist of cereals, tubers and legumes. This type of diet is associated with low intakes of several vitamins and minerals and poor mineral bioavailability. It is now known that many population groups do not suffer from single, but from simultaneous deficiencies of multiple nutrients1. The term poverty micronutrient malnutrition trap has been used to highlight the fact that poverty and micronutrient malnutrition positively influence each other2.
Iron deficiency (with or without anaemia) is the most common micronutrient deficiency world-wide, affecting more than 3.5 billion people in developing countries1. Consequences for children are impaired motor and mental development, impaired immune function, growth retardation, reduced appetite and decreased physical activity. These can result in increased morbidity and educational losses. Main causes for iron deficiency anaemia in developing countries are low intakes of bioavailable iron and infections with intestinal parasites3.
Iodine deficiency affects an estimated 1.6 billion people worldwide with the possible consequences of severe mental retardation, goitre, hypothyroidism, abortion, stillbirths and low birth weight. Iodine deficiency during early life also adversely affects learning ability, motivation, school performance, motor development and general cognitive function. National salt iodisation programmes have accelerated over recent years and now globally ~70% of households in countries with iodine deficiency disorders consume iodised salt4. Other possible methods to supply iodine to populations with iodine deficiency is iodisation of water or administration of iodised oil by mouth or injection4,5.
Although declining, vitamin A deficiency is still affecting up to 250 million preschool and many more school-age children, pregnant women and others. Aside from its adverse effect on vision, subclinical vitamin A deficiency contributes significantly to poor growth and raised morbidity and mortality in at-risk populations. Policies of vitamin A supplementation are commonly found in countries where vitamin A deficiency is known to be a major public health problem and efforts of food fortification are underway in various countries4. Deficiencies of zinc6, selenium7,

INTRODUCTION
13
vitamin B128,9, magnesium and potassium10 have also been observed in children in developing
countries. However, their global prevalences are not known exactly because subclinical deficiencies are difficult to assess other than through the observation of negative effects of diets fed to animals that are deplete in the respective nutrient or through the observation of a beneficial effect of supplementation. It has been estimated that half of the world’s population is at risk of inadequate zinc intake6. Zinc deficiency is known to impair several biological functions, such as gene expression, protein synthesis, skeletal growth and maturation, dark adaptation, taste perception and appetite, gonad development and pregnancy outcomes, skin integrity and immunity, and may lead to delays in cognitive development11.
Nutrition intervention strategies in the control of micronutrient deficiencies
Micronutrient malnutrition can be addressed via many different routes. Broad approaches are directed at economic growth that reduces poverty whereas more specific nutritional approaches, such as pharmanutrient supplementation target large doses of micronutrients directly to specific individuals. Other nutrition intervention strategies to address micronutrient malnutrition include food fortification and food-based approaches, such as dietary diversification/modification. Supplement-based approaches and food fortification have been the most commonly used strategies for micronutrient deficiency control and have been successful in several countries because they are relatively cost-effective, easy to deliver and have a rapid impact. However, pharmanutrient supplementation often fails to supply all the necessary nutrients, individuals in nontargeted groups are usually neglected, and compliance is poor especially when the supplements need to be taken frequently and for longer time periods12. Further, supplementation with pills is difficult to sustain, has little long-term economic benefit, and may even have negative health effects when nutrient interactions are not considered. Food-fortification programs have been more or less successful in the control of certain micronutrient deficiencies, e.g., through salt iodisation, because they can provide the micronutrients cheaply over a long time period. However, often they may not provide adequate amounts to the most needy population groups if those produce their own food rather than purchase the fortified products. Further constraints are technical barriers to food fortification including adverse effects on the sensory qualities of foods, nutrient-nutrient interactions, poor bioavailability of some fortificants and the difficulty of fortifying some staple foods such as rice12. Dietary diversification/ modification is an approach that aims at enhancing the availability, access, and utilisation of foods with a high content and bioavailability of micronutrients. This approach includes an increased production of micronutrient-rich foods (e.g., commercial production, home gardening, small livestock and aquaculture), an increased intake of micronutrient-rich foods (e.g., through nutrition education), a use of household food processing methods to reduce the levels of absorption inhibitors (e.g., soaking, fermentation and germination), or an increased consumption of absorption enhancers (e.g., ascorbic acid and flesh foods) with meals4,13. Plant breeding and biotechnology are further strategies to address micronutrient deficiencies through

CHAPTER 1
14
an increase in the amount of micronutrients within major food staples and/or a decrease in dietary components that inhibit micronutrient bioavailability14, but their efficacy and effectiveness still remains to be evaluated.
THE ROLE OF MICRONUTRIENTS IN CHILD GROWTH
Attained height is the result of the interaction between genetic and nutritional factors during the growth period. Best-known causes of children’s growth failure are frequent infections and inadequate energy and nutrient intakes. The underlying mechanisms are not fully understood, although growth hormone and insulin-like growth factor I (IGF-I) seem to play key roles in different phases of bone growth15. Restrictions of energy and protein, but also other nutrients, such as zinc, have been shown to reduce IGF-I plasma concentrations16. It is well known that severe protein-energy malnutrition results in linear growth retardation (stunting), reduced bone mineral contents and delayed skeletal maturation17. However, interpretations of studies of the associations of energy and protein with growth are difficult because if the intake of energy and protein is low, the intake of many other nutrients will also be inadequate. During the past years, more consideration has been given to the quality of the diet and the possible role of micronutrient deficiencies, especially those of zinc, iron, and vitamin A in children’s growth performance. Other growth-limiting nutrients might be iodine, copper, calcium, potassium, manganese and thiamin, but information on their intake and deficiencies is scarce. There is a strong probability that growth is limited by multiple simultaneous deficiencies in children in many areas in developing countries. Micronutrient deficiencies may also contribute indirectly to growth retardation through anorexia and/or increased morbidity15. Stunting has detrimental consequences not only during childhood, but also lifelong, including low physical activity, impaired motor and mental development, lowered immunocompetence, reduced work productivity, greater severity of infections and increased mortality18.
Stunting occurs primarily in the first 2-3 years of life. The widely accepted view has been that stunting is both persistent and irreversible. However, this view has been challenged recently by Cameron et al.19, who showed substantial catch-up growth in South African children. Although an improvement in growth might be limited if children remain in the same environment that gave rise to the initial growth retardation, several studies have shown improved growth-rates in children at almost any age before sexual maturity experiencing an amelioration of environment, such as immigrants20,21, children being adopted into a socio-economically better-off family22,23, and through food or nutrient supplementation24,25.
Zinc
Zinc is especially needed in times of rapid growth due to its effect on gene replication and nucleic acid metabolism and as a mediator of growth hormone action26. The major concentration of zinc occurs in the soft tissues, primarily in muscle. It’s concentration in bone is also high and although zinc is thought to be involved in chondrogenesis, collagen synthesis, osteoblastic

INTRODUCTION
15
function and calcification, its function in bone is still largely unknown27. Zinc needs for optimal growth have not been fully defined for either normal or malnourished infants.
In the 1930th animal studies first documented the essentiality of zinc for growth28. If rats were fed zinc deficient fodder, a marked suppression of growth and protein synthesis in muscle occurred, which was promptly resumed if zinc was added back to the fodder10. The earliest description of zinc deficiency syndrome affecting growth and development in humans was published by Prasad et al. in the 1960’s in young Iranian and Egyptian youths eating a diet consisting largely of whole meal bread with a high amount of zinc, but poor availability29. Other observational studies that thereafter examined the relation of zinc status and growth also suggest that inadequate zinc intake and even mild zinc deficiency may be a limiting factor for growth in otherwise healthy children30,31 whereas no relation was found between linear or ponderal growth and serum zinc in healthy French infants32.
Possible mediators of growth inhibition in zinc deficiency are anorexia and decreases of growth hormone and insulin-like growth factor I33. The mechanism by which an improved growth is achieved by raising zinc intakes is more likely to be related to the stimulation of appetite or metabolic effects, rather than to an improved supply of zinc for bone formation per se27. Anorexia allows the reduction of an otherwise wasteful food intake and digestion to avoid development of functionally inadequate tissues where one essential element is lacking10.
A meta-analysis by Brown et al. based on 33 zinc supplementation studies, demonstrated positive responses in height and weight increments to supplementation, with greater effects in children who were underweight or stunted34. Studies that examined the effect of zinc supplementation on body composition found an inverse relation between zinc status and anthropometric indices of body fat35-37, and an increase in lean body mass in severely malnourished38 and stunted children39-41. In contrast, no change in body composition was found in another study in zinc-supplemented children42.
Iron
Growing children require large amounts of iron for growth and children whose diets are inadequate in iron content and/or who experience heavy iron losses due to parasitic infections are highly vulnerable to iron deficiency. Although iron deficiency anaemia has been associated with an impairment in growth32,43,44, there is conflicting evidence concerning the beneficial effect of iron supplementation on growth. Some studies have shown an improvement in weight gain (height gain was not measured)43,45 or weight and height gain46,47. Iron-supplemented Kenyan school children gained more weight, weight-for-height, arm circumference, skinfold thickness48 in one study and weight, height, weight-for-height, height-for-age and weight-for-age in another study49. The beneficial effect of iron supplementation in these studies was observed mainly in initially anaemic or iron-deficient children. In contrast, other studies have not found a growth response to iron supplementation42,50-52 or even reported an adverse effect53. The physiological mechanism for a beneficial effect of iron supplementation on growth is not known, but could be
CHAPTER 1
16
explained by a reduction in morbidity and/or correction of anorexia or the direct effect of iron itself47. A lack of an improvement in growth, particularly linear growth, with iron supplementation might be due to a too short duration of supplementation, high infestation with intestinal parasites and/or another additional micronutrient deficiency, such as zinc and/or vitamin A deficiency.
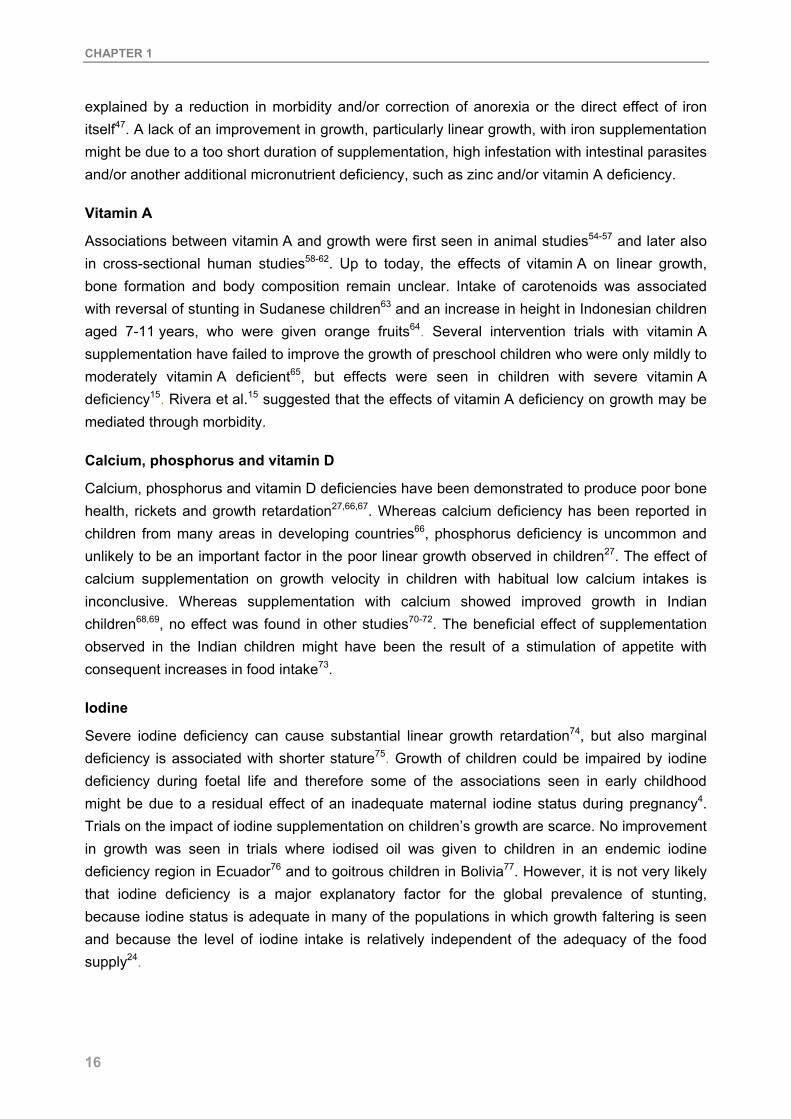
Vitamin A
Associations between vitamin A and growth were first seen in animal studies54-57 and later also in cross-sectional human studies58-62. Up to today, the effects of vitamin A on linear growth, bone formation and body composition remain unclear. Intake of carotenoids was associated with reversal of stunting in Sudanese children63 and an increase in height in Indonesian children aged 7-11 years, who were given orange fruits64. Several intervention trials with vitamin A supplementation have failed to improve the growth of preschool children who were only mildly to moderately vitamin A deficient65, but effects were seen in children with severe vitamin A deficiency15. Rivera et al.15 suggested that the effects of vitamin A deficiency on growth may be mediated through morbidity.
Calcium, phosphorus and vitamin D
Calcium, phosphorus and vitamin D deficiencies have been demonstrated to produce poor bone health, rickets and growth retardation27,66,67. Whereas calcium deficiency has been reported in children from many areas in developing countries66, phosphorus deficiency is uncommon and unlikely to be an important factor in the poor linear growth observed in children27. The effect of calcium supplementation on growth velocity in children with habitual low calcium intakes is inconclusive. Whereas supplementation with calcium showed improved growth in Indian children68,69, no effect was found in other studies70-72. The beneficial effect of supplementation observed in the Indian children might have been the result of a stimulation of appetite with consequent increases in food intake73.
Iodine
Severe iodine deficiency can cause substantial linear growth retardation74, but also marginal deficiency is associated with shorter stature75. Growth of children could be impaired by iodine deficiency during foetal life and therefore some of the associations seen in early childhood might be due to a residual effect of an inadequate maternal iodine status during pregnancy4. Trials on the impact of iodine supplementation on children’s growth are scarce. No improvement in growth was seen in trials where iodised oil was given to children in an endemic iodine deficiency region in Ecuador76 and to goitrous children in Bolivia77. However, it is not very likely that iodine deficiency is a major explanatory factor for the global prevalence of stunting, because iodine status is adequate in many of the populations in which growth faltering is seen and because the level of iodine intake is relatively independent of the adequacy of the food supply24.
INTRODUCTION
17
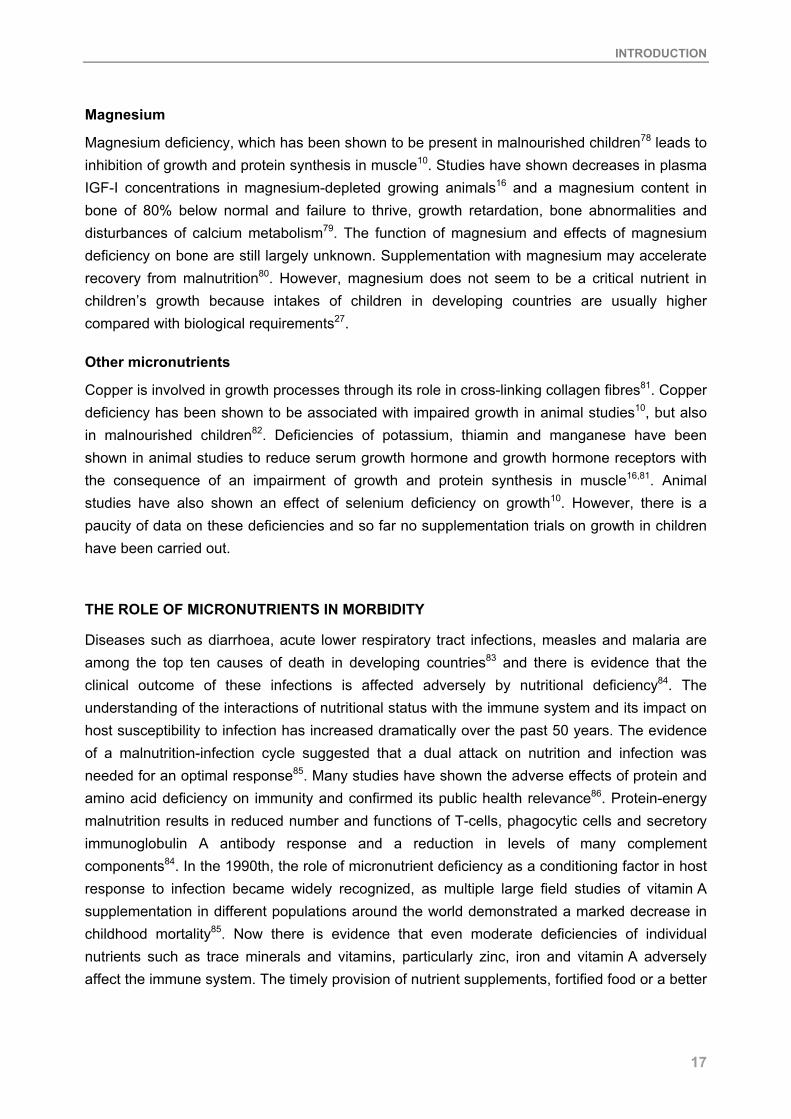
Magnesium
Magnesium deficiency, which has been shown to be present in malnourished children78 leads to inhibition of growth and protein synthesis in muscle10. Studies have shown decreases in plasma IGF-I concentrations in magnesium-depleted growing animals16 and a magnesium content in bone of 80% below normal and failure to thrive, growth retardation, bone abnormalities and disturbances of calcium metabolism79. The function of magnesium and effects of magnesium deficiency on bone are still largely unknown. Supplementation with magnesium may accelerate recovery from malnutrition80. However, magnesium does not seem to be a critical nutrient in children’s growth because intakes of children in developing countries are usually higher compared with biological requirements27.
Other micronutrients
Copper is involved in growth processes through its role in cross-linking collagen fibres81. Copper deficiency has been shown to be associated with impaired growth in animal studies10, but also in malnourished children82. Deficiencies of potassium, thiamin and manganese have been shown in animal studies to reduce serum growth hormone and growth hormone receptors with the consequence of an impairment of growth and protein synthesis in muscle16,81. Animal studies have also shown an effect of selenium deficiency on growth10. However, there is a paucity of data on these deficiencies and so far no supplementation trials on growth in children have been carried out.
THE ROLE OF MICRONUTRIENTS IN MORBIDITY
Diseases such as diarrhoea, acute lower respiratory tract infections, measles and malaria are among the top ten causes of death in developing countries83 and there is evidence that the clinical outcome of these infections is affected adversely by nutritional deficiency84. The understanding of the interactions of nutritional status with the immune system and its impact on host susceptibility to infection has increased dramatically over the past 50 years. The evidence of a malnutrition-infection cycle suggested that a dual attack on nutrition and infection was needed for an optimal response85. Many studies have shown the adverse effects of protein and amino acid deficiency on immunity and confirmed its public health relevance86. Protein-energy malnutrition results in reduced number and functions of T-cells, phagocytic cells and secretory immunoglobulin A antibody response and a reduction in levels of many complement components84. In the 1990th, the role of micronutrient deficiency as a conditioning factor in host response to infection became widely recognized, as multiple large field studies of vitamin A supplementation in different populations around the world demonstrated a marked decrease in childhood mortality85. Now there is evidence that even moderate deficiencies of individual nutrients such as trace minerals and vitamins, particularly zinc, iron and vitamin A adversely affect the immune system. The timely provision of nutrient supplements, fortified food or a better

CHAPTER 1
18
diet has the potential to stimulate immune response and reduce prevalence, severity and mortality from certain key infections84,87.
An impaired health status of children not only leads to poor growth performance88 but also diminished cognitive function and school performance1. The negative effects of diseases on growth might be mediated through a decrease in food intake, impaired nutrient absorption, direct nutrient losses, increased metabolic requirements and/or catabolic losses of nutrients and, possibly, impaired transport of nutrients to target tissues88-90.
Vitamin A
Vitamin A, in addition to its role in vision, reproduction, and epithelial cell differentiation, plays an important role in the innate immune system as well as in specific immune functions91. In vitamin A deficiency, a loss of the integrity of the epithelial lining of mucus membranes increases susceptibility to infections, particularly of the gastrointestinal, respiratory and genitourinary tracts. Even mild or subclinical vitamin A deficiency can lead to xerosis of the membranes leading to bacterial colonization, a decline in the antimicrobial enzyme lysozyme, an impairment of phygocytic cell functions, as well as suppression of the delayed type hypersensitivity response. Impaired development of primary lymphoid organs and impaired cellular proliferation in vitamin A deficiency may lead to a decrease in T-cells and the compromise of thymic epithelial integrity might reduce thymulin secretion92.
Studies in children with mild clinical and biochemical evidence of vitamin A deficiency showed an increased relative risk of death and a reversal of these effects through vitamin A supplementation93. A meta-analysis of trials of vitamin A administration in different countries demonstrated a reduction of deaths from diarrhoea and measles in infants and preschool children by 23%94. Unlike the explicit conclusions concerning mortality effects, the effects of vitamin A supplementation on morbidity outcomes in children is less clear, however some studies suggested that regular vitamin A administration had beneficial effects on malaria95,96 and pneumonia following measles97,98. It has been shown that the severity of some diseases, such as measles99 and diarrhoea100 was reduced following vitamin A administration. It seems that vitamin A status affects the child’s ability to respond adequately once infection has developed and hence appears to impact on the course of morbidity94. No effect of vitamin A supplementation on respiratory infections or incidence or prevalence of disease has been found95,101-103.
Zinc
Zinc as a component of metalloenzymes is essential for more than 300 enzymes, structural proteins and hormones and is needed for diverse physiological processes and metabolic functions including many aspects of the immune system. It has been realised that lesser degrees of zinc deficiency are more common than was known before and that the subclinical deficiency of zinc contributes to an increased incidence and severity of common but important infections such as diarrhoea and pneumonia. The recommended daily allowance is only 10 mg
INTRODUCTION
19
elemental zinc, but many people in both developing and developed countries do not reach sufficient intakes104.
Because of zinc’s fundamental role in the maintenance of epithelial and tissue integrity through promoting cell growth and differentiation105, growing children are especially vulnerable to adverse effects from inadequate zinc intake. Cells with a rapid rate of turnover, such as those of the immune and gastrointestinal systems, are most vulnerable to zinc deficiency106. Zinc is essential for normal development and function of cells mediating non-specific immunity such as leukocytes, neutrophils, natural killer cells, monocytes, macrophages and complement activity107. Zinc deficiency also affects development of acquired immunity through an atrophy of the thymus, a gland that has a role in the maturation of lymphocytes, and causes a reduction in
the number of B lymphocytes and T lymphocytes through increased apoptosis and also reduces their functional capacity105. The production and potency of several cytokines, the central messengers of the immune system, are also perturbed by zinc deficiency108. Many of these changes occur even in the early stages of deficiency. Zinc also plays a role as an antioxidant, protecting against free radical damage during inflammatory responses105.
The benefits of zinc supplementation are clearly illustrated in several randomised controlled trials. Meta-analyses of studies in children in developing countries indicated that daily zinc supplementation can reduce the incidence of pneumonia109 and the duration and severity of acute and persistant diarrhoea110. Some studies suggest that zinc may reduce clinical malaria caused by Plasmodium falciparum39,111-113. Various studies in stunted children showed a reduction in morbidity through zinc supplementation114-118. There is evidence that the benefits of zinc supplementation are the result of the correction of zinc deficiency and not of a pharmacologic effect106. Zinc supplements have been recommended for the routine management of children with severe protein-energy malnutrition119.
Iron
Iron deficiency is known to cause suppression of several aspects of the immune system, such as changes in cell-mediated immunity, impaired bactericidal activity, decrease in natural killer cell function, B-cell responses, and production of interleukin-2, and dysfunction of T-cells120-123. An increase in prevalence of malaria, respiratory illness and diarrhoea among iron-deficient infants and adults had been noted in earlier studies124-126. However, since then there has been an unresolved debate over the interaction among iron status, iron supplementation and susceptibility to infection127. Iron is essential for the proliferation of most bacteria, and therefore iron deficiency not only impairs immunological functions, but also suppresses bacterial growth, the so-called nutritional immunity hypothesis128,129. This has sometimes been put forward as an ecological advantage for those individuals who are continually at risk of infection122. On the other hand has iron treatment been associated with acute exacerbations of infection, in particular, malaria. However, in non-malarious areas, none of the studies of oral iron supplementation showed deleterious effects127 and one study clearly showed reduced infectious outcome in anaemic school children46. Other studies evaluating the effect of oral iron therapy in

CHAPTER 1
20
iron deficient subjects also show quite consistently a reduction in morbidity122. A review and a meta-analyses of randomised, controlled clinical trials on iron supplementation studies demonstrated lowered rates of anaemia without an increase in morbidity130 and no increased incidence of infectious illnesses in children131. It seems therefore likely that the known benefits of iron supplementation outweigh the risk of adverse effects even in regions with endemic malaria132.
Other nutrients
Although not studied as profound as the effects of iron, vitamin A and zinc deficiency on immunity, immunologic and related consequences have been reported for deficiencies of B vitamins, vitamins C, D and E, copper, magnesium and essential fatty acids86. Selenium deficiency may increase not only susceptibility to infection, but also the virulence of the pathogen itself133.
DIETARY IRON BIOAVAILABILITY
The majority of people in developing countries consume monotonous cereal and legume-based diets, which lack sufficient quantities of certain nutrients and which are of poor micronutrient bioavailability. Bioavailability is defined as the amount of a nutrient that is potentially available for absorption from a meal and once absorbed, utilisable for metabolic processes in the body. The poor bioavailability of micronutrients from the diet, particularly of iron and zinc, contributes to the high prevalence of micronutrient deficiencies observed in many areas in developing countries.
Iron in food occurs either as haem iron in animal sources or as ferric iron in plant sources. The absorption of haem iron is not greatly influenced by other dietary components present in the meal. In contrast, ferric iron easily forms insoluble complexes with minerals contained in a meal and is then less bioavailable. Soluble, low molecular weight iron complexes and ferrous iron, the reduced form of ferric iron, are well absorbed. Therefore non-haem iron absorption from a meal depends more on the balance between dietary components enhancing and inhibiting iron absorption than on the content of iron in the meal134 and can vary between 2-35%135.
An important determinant of the amount of iron that is absorbed from the food is the iron status of the person and as iron stores rise, the percentage of dietary iron absorption falls136. The first simple algorithm to predict dietary iron absorption based on the content of enhancers and inhibitors in the diet was developed more than 25 years ago by Monsen et al.135. More recently other algorithms of iron absorption have been developed that are based on more dietary factors present in a meal134,137. In the following section, an outline on iron bioavailability will be given, describing the effects of phytates, polyphenols, calcium, ascorbic acid and meat on iron absorption. Other dietary components that have been suggested to inhibit iron absorption are phosphorus138, flavonoids134, oxalates139, soy protein140, fibre141, egg142 and casein4 and possible iron absorption enhancers include organic acids143, vitamin A and ß-carotene144.

INTRODUCTION
21
Phytates are found in all kinds of grains, seeds, legumes, nuts, vegetables, roots (e.g., potatoes), and fruits. Chemically, phytates are inositol hexaphosphate salts and are a storage form of phosphates and minerals. It is a strong chelator of divalent minerals, such as copper, calcium, zinc, magnesium, iron, cobalt, and manganese and decreases their bioavailability. Phytate is considered to be the strongest inhibitor of iron absorption from cereals143. Under normal physiological conditions, phytate-mineral complexes are insoluble and unavailable for absorption. Phytates strongly inhibit iron absorption in a dose-dependent fashion and even small amounts of phytates can have a marked effect145. However lower inositol phosphates (InsP2 and InsP1) do not negatively affect mineral absorption. The effect of phytate on mineral bioavailability is determined by pH (alters along the digestive tract), size and valence of the mineral, mineral and phytate concentrations and ratios and food matrix that includes the presence of enhancers and/or inhibitors. In North American and European diets, about 90% of phytates originate from cereals. No intestinal adaptation to a high-phytate diet was found for iron146.
Polyphenols are ubiquitous in all plant foods (vegetables, cereals, legumes, fruits, nuts, etc.) and beverages (wine, cider, tea, beer, tea, cocoa, etc.)147 as part of their defence system against insects, animals, and humans. Their negative effect on iron absorption has been attributed to the formation of chelates with ferric iron by galloyl and catechol groups of polyphenolic compounds134, such as catechins in green and herbal tea, chlorogenic acid in coffee, tannins in black tea148 and flavonoids in cocoa and wine147. Several studies demonstrated the strong inhibition of iron absorption by coffee and tea if consumed with meals or afterwards148-150 whereby tea seems to be a stronger inhibitor than coffee and black tea a stronger inhibitor than herb tea, cocoa or wine151. The predominant phenolic compounds in vegetables and fruits are flavonoid glycosides and flavonol, respectively, and can be found mainly in the outer parts of the plant147. Flavonoids, phenolic acids and tannins are the main polyphenols in legumes and cereals. The content of polyphenols in cereals is usually less than 1% of dry matter, and they are probably less important inhibitors of iron absorption than are phytates. An exception is sorghum, which can have as much as 10% of polyphenols147. The effect of polyphenols found in legumes on iron bioavailability has not been conclusively resolved. Garcia-Lopez et al.152 did not find a significant effect on iron absorption by tannins from soybean protein, chickpeas, and red kidney beans, whereas Jansman et al.153 found an effect on iron and copper absorption of condensed tannins from fava beans.
Calcium in amounts present in many meals inhibits the absorption of both haem and non-haem iron in the same dose-effect relation154. Inhibition of iron absorption was therefore suggested to be located within the mucosal cell at some transfer step common to haem and non-haem iron155. Only amounts of calcium in the range of 40-300 mg calcium in a meal seem to inhibit iron absorption155 and none of the iron absorption enhancing dietary components seems to be able to counteract these effects156. No duration effect of calcium on iron absorption was observed157. In order to improve iron nutrition, it is recommended to redistribute the daily intake of calcium to the meals with the lowest iron contents156.

CHAPTER 1
22
Ascorbic acid in its free and natural form in fruits and vegetables is a potent - probably the most efficient - enhancer of non-haem iron absorption158. It forms soluble chelates with iron in the stomach, reduces ferric iron to the highly absorbable ferrous iron and maintains the solubility of non-haem iron in the environment of the small intestine. Sufficient amounts of ascorbic acid can counteract the inhibition of phytates and phenolic compounds on iron absorption159. The absolute amount of ascorbic acid in the meal and the ratio between the concentration of ascorbic acid and inhibitors may be more important than the molar ratio of ascorbic acid to iron143. Hallberg et al. found no difference in the enhancing effect of ascorbic acid in meals with and without calcium and in meals with and without meat and concluded therefore that mechanisms of action on iron absorption are different for ascorbic acid, meat and calcium134.
In addition to providing considerable amounts of easily available haem iron, meat tissue is known to have an enhancing effect on non-haem iron absorption from other food components in the same meal. Since this effect was first noted by Layrisse et al.160, there have been numerous studies on the effect of meat, fish and poultry on iron absorption; however, the magnitude of the effect and the mechanisms involved have not yet been conclusively resolved134. It had been suggested that the so-called “meat factor” could be a protein per se, certain peptides or amino acids, especially those containing cysteine, or their metabolites or unidentified components in proteinaceous foods161. However, more recent findings indicate that protein and sulfhydryl groups from cysteine residues are not contributing to iron absorption162. It has also been suggested that meat factor(s) stimulate gastric acid secretion and may chelate solubilised iron in the acid environment of the stomach, thereby maintaining iron solubility during intestinal digestion and absorption163. Meat very effectively counteracts the inhibition of non-haem iron absorption by phytate and polyphenols134 and it seems that the inhibitory effects of phytate on mineral absorption are not seen in varied diets containing sufficient amounts of animal protein164.
THE ROLE OF ANIMAL SOURCE FOODS IN THE NUTRITION OF CHILDREN
In developing countries, there mostly is limited availability, access and intake of animal source foods. The intake of protein from meat is usually extremely low providing only 15% of dietary protein compared with around 60% in developed countries165. Animal source foods, such as meat and milk, are nutrient dense foods that provide protein of high biological value, energy, and fat and are likely to be the only unfortified foods that can provide enough calcium, iron, and zinc for infants and children. They are more energy dense than plant foods, as well as a good source of fat soluble vitamins and essential fatty acids. Vitamin B12 requirements must be met by animal source foods because there is none in plants.
Meat is a good source of high quality protein, iron, zinc, vitamin B12, niacin, vitamin B6, and haem iron. The bioavailability of micronutrients is generally higher from animal source foods than from plant foods. About 40% of the iron in meat is haem iron, of which 15-35% is absorbed, whereas the absorption of non-haem iron from plant foods is estimated as only

INTRODUCTION
23
2-20% depending on the amount of enhancers and inhibitors in the diet as well as an individual’s iron status166. The low bioavailability of micronutrients, especially iron and zinc, from plant sources can be increased through small amounts of flesh foods even in the presence of dietary inhibitors134. Milk is high in calcium, phosphorus, and also contains appreciable amounts of vitamin B12, riboflavin, folate, zinc and small amounts of iron. Milk fat provides vitamins A and D.
Several studies have been conducted among affluent populations to examine the adequacy of the diet of certain subgroups who avoid the consumption of animal source foods. Generally, a vegetarian diet is considered a healthy alternative to an omnivorous diet that is high in saturated fat and cholesterol, and low in fibre167,168. Despite the low content of animal source foods in the diet and the apparent lower bioavailability of some minerals, the mineral status of most adult vegetarians appears to be adequate169. A number of comparative studies of vegetarian and omnivorous children also showed no difference in nutrient intake, nutrient status and growth170-178. However, in order to meet nutritional requirements, considerable care must be taken for true vegan diets, which include no animal products, especially for children who have higher energy and nutrient needs than adults. Children are also at a greater risk of nutrient deficiency, especially during periods of physiological stress and accelerated growth179. Nutrients of concern for children raised on diets that do not contain any animal source foods are iron, zinc, iodine, vitamin B12, vitamin D and calcium3.
A number of observational studies have shown negative associations between the avoidance of animal source foods and the health of children in developed countries. Children in New Zealand who avoid drinking cow milk had low dietary calcium intakes and poor bone health67. British vegan children had smaller structures and lower weights compared with standards180. Lower rates of growth have also been reported in children reared on vegan180,181 and macrobiotic diets182. A macrobiotic diet is somehow similar to a diet characteristic of children in developing countries. It consists primarily of cereals (mainly rice), vegetables, legumes, and marine algae, small amounts of cooked fruit and occasional fish. No meat or dairy products are used. Rickets were also observed in children reared on vegetarian183 and macrobiotic diets184. The Dutch infants consuming macrobiotic diets also had a poorer nutritional status, and were more likely to have deficiencies of riboflavin, vitamin B12, and iron, with consequent anaemia184. After two years of increased consumption of fish and/or dairy products, their linear growth velocity improved182. The same children followed up in adolescence showed impaired cobalamin status and low bone mineral density185. Adequate milk consumption in children has been associated with better bone density in adulthood186-188.
Diets of children from poorer regions in developing countries usually do not contain animal source foods and parents do not have the choice to include a variety of healthy foods, fortified foods or supplements into their children’s diets as have vegetarian families in developed countries. Several cross-sectional studies have shown that consumption of animal source foods is associated with improved nutritional status and growth among children in developing

CHAPTER 1
24
countries. Findings from the Human Nutrition Collaborative Support Program, a longitudinal observational study in Egypt, Kenya, and Mexico, suggest that low intake of animal protein is associated with low intakes of available zinc, iron, vitamin B12 and that the intake of animal source foods is strongly associated with improved growth, cognitive function, activity, school performance, pregnancy outcome, and morbidity in young children189-191. Stunted Jamaican children were found to consume significantly fewer servings of dairy products and fruits than the non-stunted children192. The percentage of protein intake from animal sources was positively associated with growth in Peruvian children193, and because the protein intakes were considered adequate, it was suggested that other nutrients contained in the animal products, such as haem-iron, zinc, and vitamin B12, may explain the observed effect. Linear growth was also positively associated with intake of animal source foods in another cohort of Peruvian children with low intakes of complementary foods194. Animal protein intake was correlated with height-for-age in Korean children, whereas fat intake was a more important factor for weight-for-age and weight-for-height195. In a study in Latin American children, availability of dairy products, oils, and meats were negatively related to underweight and protein, total fat, total energy, and animal fat were negatively related to stunting and it was concluded that animal source foods are important to support the normal growth of children196. In Nepal, xeropthalmia in young children was less likely to occur if they had relatively high meat or fish intakes when they were 13 to 24 months of age197.
A number of controlled studies showed positive effects of supplementation with milk or milk products on children’s weight198-203, height198,200-205 and bone health200,206-209, whereas others did not show any effect on growth206,210,211. However, interpretation of findings from these studies is complicated by the inability to accurately determine if increases in energy, protein and/or micronutrients were responsible for the outcome observed. Controlled supplementation studies with other animal source foods than milk are scarce. A trial in which dry fish powder was added to fermented maize porridge, did not improve growth or micronutrient status of Ghanaian children212.
DESCRIPTION OF THE STUDY
Study rational, research objectives and hypotheses
The research presented in this thesis is part of the larger study “Role of animal source foods to improve diet quality and growth and cognitive development in East African children” carried out within the framework of the Global Livestock Collaborative Research Support Program1 and is
1 The study was funded by the Global Livestock Collaborative Research and Support Program, USAID Grant No. DAN-1328-G-00-0046-00 119-18. Principal investigators: CG Neumann, University of California, Los Angeles; NO Bwibo, University of Nairobi; Co-Principal Investigators: SP Murphy, University of Hawaii; M Sigman, University of California, Los Angeles; Co-Investigator: LH Allen, University of California, Davis.

INTRODUCTION
25
based on a 2-year-long randomised controlled feeding intervention study in rural Kenyan school children213.
The study was conducted in a rural area where habitually a cereal-legume based diet is consumed. Findings from a study in the 1980s showed that school-aged children in the area obtained over 75% of their energy intake from maize and beans, 1% from milk (35 g/d) and less than 1% from meat (11 g/d). Diets were low in micronutrients with prevalences of inadequate intakes of 87% for vitamin B12, 44% for vitamin E, 100% for vitamin D, 91% for calcium, 31% for iron and 30% for zinc214. Prevalences of micronutrient deficiencies are high, especially those of iron, zinc, iodine and vitamin B12. These can lead to linear growth retardation (stunting) and impaired immunity with an increased risk of illness and death, poor cognitive and motor development, and other impairments such as in function15,215,216. Stunting also leads to smaller size and poorer performance in adulthood4. In Embu District, stunting (height-for-age Z-score < -2 SD of NCHS reference population) was present in ~35% of the children in Embu District and severe stunting (height-for-age Z-score < -3 SD of NCHS reference population) in 14%217. Children in the study area mainly suffer from upper and lower respiratory tract infection, gastrointestinal disease, eye infection, malaria, and skin infection218.
Macronutrient and multiple micronutrient deficiencies most often coexist in populations in developing countries and therefore interventions that aim at increasing the intake of only one specific micronutrient through pharmanutrient supplementation or food fortification may not alleviate the functional deficits caused by other nutrient deficiencies. There is evidence from observational studies that diets that exclude animal source foods are inadequate to meet nutritional needs in young children and that the intake of even small amounts of animal source foods is associated with improved growth, health and cognitive development (see above). However, findings that are based on observational studies might have been confounded by other factors and intervention studies that investigate these relationships are rare. The few studies conducted vary widely in their approaches, making it difficult to isolate the factors that best account for the outcomes. To test the causal relation between consumption of animal source foods and several outcome variables related to growth, health and development, a controlled feeding intervention study was needed. Based on these considerations and the findings of a previous study in the same area189, food supplements containing meat or milk that could help meeting gaps between actual intakes and recommended nutrient and energy intakes were distributed to school children over a period of two years213. Nutrients primarily targeted by the intervention were bioavailable iron, bioavailable zinc, vitamin A, vitamin B12 and calcium. Riboflavin, although initially not identified as a nutrient of concern was identified as low with the application of the newly developed recommended intakes219. Vitamin D was assumed to be available from sun and vitamin E was not specifically targeted.
Some studies have shown improvements in children’s development by primarily increasing the energy and/or protein intake and therefore it is important to determine whether animal source foods are important because of the macronutrients and/or micronutrients they provide, i.e., to

CHAPTER 1
26
examine the effect of an increase in food quantity versus the effect of improving diet quality. The effects of food supplements containing meat and milk were therefore compared with the effects of an isoenergetic food supplement without animal source foods. The supplementation groups were further compared with a control group in which children did not receive a food supplement. We hypothesised that children who receive a supplement with milk or meat would consume a more nutritionally adequate diet overall than children who receive an isoenergetic food supplement without animal source foods. All food supplements would supply ~20% of the children’s daily energy requirement, yet the supplement containing meat would provide substantially higher proportions of recommended amounts of micronutrients particularly vitamin B12, bioavailable iron, and bioavailable zinc and the supplement containing milk would provide higher proportions of recommended amounts of vitamin A, riboflavin, calcium, and phosphorus compared with the supplement that does not contain animal source foods. Because intakes of these micronutrients have been associated with physical growth and health, we expected increases in height and weight and decreases in morbidity in the children supplemented with meat or milk. Meat, through an increase in zinc intake, would increase lean body mass. Prevalence and severity of morbidity could be reduced by either meat or milk, because iron, zinc and vitamin A are all important nutrients for health. The effect of animal source foods on other outcomes, such as micronutrient status and cognitive function were assessed by other researchers of the study.
Because the provision of food supplements might change the habitual diet of the study population, we further examined which nutrients from all sources, i.e., home intake plus food supplement, predicted interindividual variation in the children’s growth. Knowing which specific nutrients are necessary for an improvement in growth is important in the design of suitable tailor-made dietary intervention programmes.
One of the causes of iron deficiency is likely to be the low iron bioavailability in the habitual cereal-legume based diets that are consumed in many areas in developing countries. It is important to learn more about the quantities of iron and inhibitors and enhancers of iron absorption in the diet. We therefore calculated the amount of iron absorbed from the habitual diet of the study children using an algorithm of iron absorption that also considers the iron status of the children. In order to improve iron nutrition in children, it is necessary to establish how iron absorption can be increased. Consequently, simulations of several household dietary strategies were carried out and their potential in improving iron nutrition evaluated.
Study site
The study described in this thesis was conducted in the sublocations Kathanjure, Kathunguri and Karurumo, which are in Kyeni South Division of Embu District in Eastern Province, Kenya (Figure 1.1). The study area is located at ~160 km northeast of Nairobi on the southeast slopes of Mount Kenya. The size of the area is ~60 km2 and it is ~30 km northeast of the town of Embu.

INTRODUCTION
27
Figure 1.1 Study site. Sources: (1) (2) University of Texas Libraries, www.lib.ubtexas.edu; (3) redone from Global Livestock CRSP, University of California, Davis
(1)
(2)
(3)

CHAPTER 1
28
There are two distinct geographical areas; the upper zone includes Kathanjure, Kinthithe and part of Kathunguri, at an altitude of 1200 to 1500 meters, and the lower zone covers Karurumo and part of Kathunguri and ranges between 900 and 1200 meters above sea level220. Rainfall pattern is bimodal with two distinct rainy seasons. The long rains generally fall between March and June whereas the short rains are experienced from October through December. The amount of rain received varies from year to year and also with altitude whereby the upper zone normally receives over 1000 mm of rain annually, whereas the lower zone is semi-arid and normally receives an average of 550 mm per year. Temperatures range from 12oC in July to 27oC in March221. Because the upper zone is generally cooler, receives more rainfall, and is agriculturally productive, this zone is more densely populated than the lower zone220.
The Embu tribe belongs to the larger ethnic group of Bantu. The first language is Kiembu, although Kiswahili, Kikuyu and English are widely understood. The majority of people are small-holder agriculturalists producing both subsistence and market crops. Households also keep small amounts of cattle, goats and chicken. Limited land size, coupled with high population has resulted in intensive cultivation. The average size of farm holding is ~1.2 ha per family221. Embu District, particularly the upper zone, has high potential agricultural land, which, under normal weather conditions, can be utilised to produce enough food to feed its population. The requirements of the staple food crops maize and beans are normally met from local production. Only in few dry areas pockets of food deficits exist, which can be offset by other food harvests such as Irish potatoes and bananas221 or requires relief food.
During the study period, there was a system of school-fees, but those were waived for primary schools in 2003, when a new government came to rule. The school enrolment of girls was 62% and that of boys 75% in 1994. Most school-age children in Kenya drop out after the primary level of education. Data from 1996 indicate that the transition rate from primary to secondary education is only about 45% (46% for boys and 44% for girls)222.
The area was selected because the purpose of the study was to investigate the effect of animal source foods on growth, morbidity, and development and the children in Embu were found to lack animal source foods and suffered from micronutrient deficiencies, stunting, and infectious diseases. In addition, this study site had the advantage that, due to a previous study220, methods were already adopted to this locale, trained people for data collection were available, and good relationships with the community and administrative bodies had been established.
Study design
Primary schools were randomised to four different study groups: 1) Control: no food supplement provided; 2) Energy supplement: a food supplement based on a local dish of maize, beans and vegetables (githeri); 3) Milk supplement: githeri plus a glass of milk (200 mL); and 4) Meat supplement: githeri with 60 g of minced beef.

INTRODUCTION
29
Subjects
The sample size was calculated to detect differences between the four study groups in the main cognitive test (Raven’s Progressive Matrices), which was considered the primary outcome of the study. This required a sample size of ~120 children per study group. Out of the eighteen primary schools in the study area, six schools could not be included in the study because of very small size and/or inaccessibility for food delivery, especially in the rainy season. All children enrolled in class 1 (median age 7.1 years) from the twelve selected primary schools participated in the study, resulting in a total sample size of 554 children, i.e., on average 139 children per study group.
Three large schools that had more than one class 1 classroom were first randomly assigned to each of the groups before the remaining schools were randomised, such that the large schools could not be randomised to the same food supplementation group.
Feeding
The feeding started on 31 August 1998 at the beginning of the last school term of the year and ended in July 2000. The school year in Kenya begins in January and comprises three terms, with three 1-month breaks in April, August and December. The time chosen for the provision of the food supplement was mid-morning because this was expected to be least likely to influence the children’s breakfast and lunch and replace some of the foods they consume, but actually supplement the regular children’s diet. The supplement was distributed for 18 months, when schools were in session. With the new school year in January 1999, the children moved to class 2 and in January 2000 to class 3. Repeaters were kept in the study and continued to be fed with their original class. All children in a class where a food supplement was distributed could participate in the feeding, irrespective of whether data were collected from them or whether their data were included in the analyses.
Preparation, distribution and composition of food supplements
The base for the food supplements was githeri, a local dish made from dry white maize (Zea mays), Mwitemania beans (kidney beans, Phaseolus vulgaris), tomatoes, sukuma wiki (kale or collard greens, Brassica oleracea), onions, iodised salt (Kensalt, 168.5 mg potassium iodate/kg, Salt Manufacturers Kenya Ltd), and vegetable fat (Kimbo, fortified with 124 IU retinol/g (37 µg retinol activity equivalents/g), manufactured by Unilever Kenya Ltd). For the meat supplement, minced beef (~10% fat) was added; for the milk supplement, a glass of ultra heat treated (UHT) cow’s milk was served with the githeri; and the energy supplement contained higher amounts of all ingredients. The food supplement was thoroughly mixed to ensure that all children received the same amount of all ingredients, and that not part of the mixture would be consumed preferentially (such as pieces of meat). It was deemed important that only local foods and familiar preparation methods were used, but, for hygienic and logistic reasons, the milk and meat were purchased from reputable wholesalers within the region or from Nairobi. Taste tests

CHAPTER 1
30
were carried out with school children in a school that did not participate in the study, and where necessary, recipes were adjusted.
The food supplements were approximately isoenergetic and contained an estimated energy content of ~250 kcal/serving (1050 kJ) during the first school term of the intervention (from September to November 1998). Because children grew in height and weight, the amounts of some ingredients were then increased to achieve a total energy content of ~300 kcal/serving (1255 kJ), by increasing the portion size of the energy supplement (from 185 to 230 g/child), the milk content of the milk supplement (to 250 mL) and the beef content of the meat supplement (to 85 g). Table 1.1 displays a detailed description of the food supplements for all school terms, and Table 1.2 shows the energy and nutrient composition for all but the first school term. The vitamin B12 content of the UHT milk was measured and found to be comparable to that of fresh milk. Proximate analyses of the food supplements were carried out on a regular basis to evaluate the energy content and adjustments in preparation methods made whenever necessary.
Table 1.1 Amount of food supplement served per child per day and amount of ingredients per food supplement
Meat supplement Milk supplement Energy supplement
1998 1999/2000 1998 1999/2000 1998 1999/2000
Amount served, g 184 225 100 100 185 230 Ingredients, g Maize 20 20 20 20 36 45 Beans 13 13 13 13 24 30 Fat 1.6 1.6 1.6 3.6 3 5.2 Onions 2.7 2.7 2.7 2.7 5 6.3 Green leaves 5.2 5.2 5.2 5.2 10 12.5 Salt 0.8 0.8 0.5 0.5 1 1 Meat 60 85 - - - - Milk, mL # - - 200 250 - -
# Milk was served separately in a glass.
The food was prepared in a central location by workers who regularly underwent medical exams, and strict hygienic preparation methods were followed. The food was weighed into plastic bowls that were labelled with the children’s names and transported while still hot in insulated containers by car to the schools. The food was served during the first school-break at 9.30 am. Project staff ensured that each child received the food container that was labelled with his/her name and that no food was spilled or exchanged between the children. Afterwards, the bowls and cups were collected, the milk leftovers were measured at school, and later at the cooking site the food leftovers were weighed and the amounts of leftovers recorded.

INTRODUCTION
31
Table 1.2 Energy and nutrient content of the food supplements #
Meat supplement Milk supplement Energy supplement
Macronutrients Energy, kJ 1317 1317 1313 kcal 315 315 314 Energy from animal source, kJ 765 690 0 kcal 183 165 0 Protein, g 21.6 12.7 10.7 Protein from animal source, g 16.9 8.0 0 Carbohydrate, g 23.4 35.6 53.5 Fat, g 14.8 14.3 7.3 Saturated fat, g 6.3 7.0 1.6 Mono-saturated fat, g 5.8 4.5 2.7 Poly-unsaturated fat, g 1.8 1.6 2.3 Dietary fibre, g 3.7 3.7 8.6 Phytate, mg 368 368 841 Vitamins
Vitamin A, µg RAE ‡ 79 291 240 Vitamin E, mg α-TE 0.4 0.5 1.0 Vitamin C, mg 3 5 6 Thiamin, mg 0.19 0.24 0.31 Riboflavin, mg 0.17 0.49 0.15 Niacin, mg 3.1 1.2 2.2 Vitamin B6, mg 0.34 0.26 0.25 Folate, mg 54 65 114
Vitamin B12, µg 1.27 1.0 0 Minerals Calcium, mg 18 303 35 Phosphorus, mg 230 328 224 Magnesium, mg 57 69 95 Potassium, mg 440 558 479 Sodium, mg 355 340 408 Copper, mg 0.19 0.13 0.30 Iron, mg 2.88 1.97 3.94 Available iron, mg § 0.26 0.18 0.36 Zinc, mg 3.53 1.74 1.70 Available zinc, mg § 0.46 0.23 0.22
RAE, Retinol activity equivalents; TE, tocopherol equivalents. # Values are based on the supplements for 1999 and 2000 (see Table 1.1). Nutrient values are calculated using food composition data from the International Minilist that was developed for the WorldFood Dietary Assessment System223. ‡ The vegetable fat was fortified with 124 IU retinol/g (37µg RAE). The milk itself provided 138 µg RAE. § Dietary iron and zinc availability were calculated using the approach described by Murphy et al.224. It is assumed that the supplement is consumed alone.

CHAPTER 1
32
Data collection
Training of field staff and pilot testing of the feeding and data collection were carried out in June through August 1998 before the food supplementation started. Data collection for outcome and covariate measures were carried out at baseline and thereafter longitudinally and at different intervals for each subject and/or their families during the 2-year study period.
Design considerations
The study was conducted as an efficacy trial, i.e., the impact of the intervention was tested under ideal conditions with food supplementation to all targeted children with a high level of supervision and the careful measurement of outcome in order to determine whether a biological impact is actually possible.
The feeding supplementation was carried out in primary schools because of logistic reasons. Children who attend school are easily accessible for feeding, measurement, and observation. The daily home delivery of a cooked food supplement to ~400 children would not have been feasible and compliance to a centre-type distribution can be assumed to be low because households are very scattered in the area and long distances by foot would have been necessary. It might be argued that growth, morbidity, and development of children in the age group of our study children (6-9 years) are less affected by nutritional problems than children in the first 3 years of life and that they respond less to interventions. Undernutrition often already starts in utero and extends throughout the life cycle and it is important to target nutrition interventions to all age groups1. Children aged 6-9 years face a number of nutritional problems, such as multiple micronutrient deficiencies, stunting, underweight, and anaemia5. Their physical growth is assumed to be the result of both environmental and genetic factors and their interaction225 and they can still respond functionally to improved dietary quantity and quality. Stunting is believed to occur mainly in early childhood and through a cumulative process. However, the severity and prevalence of stunting and underweight have been found to increase with age; with older children diverging further from the reference medians for height until puberty5.
Ethical considerations
The inclusion of a control group with no food supplement was deemed necessary in order to investigate the effect of increasing the quantity of food versus the effect of improving the quality of the diet. After completion of the study, the households in the control group were given a local milk goat plus several improved male goats for breeding purposes. This was chosen by the parents through representative committees as compensation for the food their children missed during the course of study. We believe that all children taking part in the study, including those in the control group, benefited from the study through treatment of helminths twice during the study period, medical examinations carried out by doctors employed by the project, and the regular contact with the project nurse and enumerators trained in morbidity who were able to refer children or other family members to health facilities when illness was identified. Children

INTRODUCTION
33
who had severe anaemia, malaria or any other serious condition were referred immediately for medical evaluation and treatment. Further, the whole study area is likely to have benefited economically from the project because many people were employed as cooks, cleaners, enumerators, office staff, drivers, supervisors, etc.
Approval by the University of California Los Angeles Human Subject Protection Committee, USA and the Ethics Committee of the University of Nairobi, School of Medicine, Kenya and research clearance were obtained from the Office of the President, Government of Kenya. All local and district authorities were involved in the implementation of the study and the community informed extensively about the aim and procedures of the intervention. Informed verbal consent of the parents of the study children and active verbal assent was obtained by the children prior to the study. Everybody was free to withdraw at any time from the feeding or any part of the study. Children whose parents did not allow any data collection could continue to receive the daily food supplement. All results from medical examinations were disseminated and explained to the headmasters, teachers and parents.
Logistical constraints
There were several constraints concerning the preparation and delivery of the food supplements to the schools. Food preparation was labour intensive and kitchen staff had to work overnight in order to have the food freshly prepared in the morning for delivery; electricity blackouts often occurred, forcing the staff to rely on lamps and candlelight to ensure accurate and timely preparation of the food supplements; mosquitoes were present in the open-air kitchen, so the area was enclosed with mesh and mosquito repellants were provided. Problems encountered during the dry seasons were scarcity of water, which had to be fetched from a nearby stream and treated to ensure its safety, and poor road conditions with a lot of dust. During the rainy seasons, pipes were sometimes blocked by debris and certain roads were muddy and sometimes impassable for food delivery to schools. Rumours spread in the communities on the appropriateness and suitability of the food supplements and their potential causing illnesses in the children and this as well as other issues that raised concern had to be addressed. Data collection was hampered by children being sent away from school due to non-payment of school fees or closure of schools due to teachers’ strikes. Parents of some study children were uncooperative, but meetings could mostly clear up their concerns.

CHAPTER 1
34
OUTLINE OF THE THESIS
The following research questions have been investigated and the results are described in the following chapters of this thesis:
What is the effect of a daily food supplement containing meat or milk on the growth and body composition of rural Kenyan school children? (Chapter 2)
Which are the specific nutrients that predict growth of the children who participated in the food supplementation study? (Chapter 3)
What is the effect of a daily food supplement containing meat or milk on the children’s morbidity? (Chapter 4)
What is the amount of iron absorbed from the habitual diet of the children and what is the prevalence of inadequate iron intake in the study population? (Chapter 5)
What is the potential of household dietary strategies to increase iron absorption and to reduce the prevalence of inadequate iron intake in the children? (Chapter 6)
In Chapter 7, methodological issues that might have affected the study outcomes are discussed and the findings of the thesis reviewed and summarised. Conclusions are drawn and implications and suggestions for future research presented.
REFERENCES 1. ACC/SCN (2000) Fourth report on the world nutrition situation. Geneva: ACC/SCN with IFPRI. 2. Demment MW, Young MM & Sensenig RL (2003) Providing Micronutrients through Food-Based Solutions: A
Key to Human and National Development. J Nutr 133 (11): 3879S-85S. 3. Institute of Medicine (2001) Dietary Reference Intakes for vitamin A, vitamin K, arsenic, boron, chromium,
copper, iodine, iron, manganese, molybdenum, nickel, silicon, vanadium and zinc. Washington, DC: National Academy Press.
4. ACC/SCN (2001) What works? A Review of the Efficacy and Effectiveness of Nutrition Interventions. [Allen LH and Gillespie SR, editors]. Geneva: ACC/SCN in collaboration with the Asian Development Bank, Manila.
5. United Nations System Standing Committee on Nutrition (2002) School-age Children and their Health and Nutrition, SCN News Number 25.
6. Black RE (2002) Consequences of Zinc Deficiency on Human Health and Alternatives for Programmatic Intervention. In Public Health Issues in Infant and Child Nutrition [Black RE and Fleischer K, editors]. Philadelphia: Nestec Ltd., Vevey/Lippincott William & Wilkins.
7. Bhan MK, Sommerfelt H & Strand T (2001) Micronutrient deficiency in children. Br J Nutr 85 (Suppl. 2): 199S-203S.
8. Allen LH, Rosado JL, Casterline JE, et al. (1995) Vitamin B-12 deficiency and malabsorption are highly prevalent in rural Mexican communities. Am J Clin Nutr 62: 1013-9.
9. Casterline JE, Allen LH & Ruel MT (1997) Vitamin B-12 deficiency is very prevalent in lactating Guatemalan women and their infants at three months post-partum. J Nutr 127: 1966-72.
10. Clausen T & Dorup I (1998) Micronutrients, minerals and growth control. Bibl Nutr Dieta 54: 84-92. 11. Black MM (1998) Zinc deficiency and child development. Am J Clin Nutr 68: 4645S-95S. 12. Allen LH (2003) Interventions for Micronutrient Deficiency Control in Developing Countries: Past, Present and
Future. J Nutr 133 (11): 3875S-8S. 13. Gibson RS & Hotz C (2001) Dietary diversification/modification strategies to enhance micronutrient content and
bioavailability of diets in developing countries. Br J Nutr 85, Suppl 2: 159S-66S. 14. Ruel MT & Bouis HE (1998) Plant breeding: a long-term strategy for the control of zinc deficiency in vulnerable
populations. Am J Clin Nutr 68: 488S-94S.
INTRODUCTION
35
15. Rivera JA, Hotz C, Gonzalez-Cossio T, Neufeld L & Garcia-Guerra A (2003) The Effect of Micronutrient Deficiencies on Child Growth: A Review of Results from Community-Based Supplementation Trials. J Nutr 133 (11): 4010S-20S.
16. Estívariz CF & Ziegler TR (1997) Nutrition and the insulin-like growth factor system. Endocrine 7: 65-71. 17. Adams P & Berridge FR (1969) Effects of kwashiorkor on cortical and trabecular bone. Arch Dis Child 44: 705-
9. 18. Norgan NG (2000) Long-term physiological and economic consequences of growth retardation in children and
adolescents. P Nutr Soc 59 (2): 245-56. 19. Cameron N, Preece MA & Cole TJ (2005) Catch-up growth or regression to the mean? Recovery from stunting
revisited. Am J Hum Biol 17: 412-7. 20. Mjönes S (1987) Growth in Turkish children in Stockholm. Ann Hum Biol 14: 337-47. 21. Schumacher LB, Pawson LG & Kretchmer N (1987) Growth of immigrant children in the newcomer schools of
San Francisco. Pediatrics 80: 861-8. 22. Lien NM, Meyer KK & Winick M (1977) Early malnutrition and 'late' adoption: a study of their effects on the
development of Korean orphans adopted into American families. Am J Clin Nutr 30: 1734-9. 23. Proos LA, Hofvander Y & Tuvemo T (1991) Menarcheal age and growth pattern of Indian girls adopted in
Sweden. II. Catch-up growth and final height. Indian J Pediatr 58 (1): 105-14. 24. Allen LH (1994) Nutritional influences on linear growth: a general review. Eur J Clin Nutr 48 (Suppl 1): 75S-89S. 25. Bhandari N, Bahl R & Taneja S (2001) Effect of micronutrient supplementation on linear growth of children. Br J
Nutr 85 (Suppl. 2): 131S-7S. 26. ACC/SCN (1993) SCN News No. 9. Focus on micronutrients. Geneva: ACC/SCN. 27. Prentice A & Bates CJ (1994) Adequacy of dietary mineral supply for human bone growth and mineralisation.
Eur J Clin Nutr 48: 161S-77S. 28. Todd WR, Elvejheim CA & Hart EB (1934) Zinc in the nutrition of the rat. Am J Physiol 107: 146-56. 29. Prasad AS, Miale A, Farid Z, Schulert A & Sandstead HH (1963) Zinc metabolism in patients with the syndrome
of iron deficiency anemia, hypogonadism, and dwarfism. J Lab Clin Med 61: 537-49. 30. Hambidge KM, Walravens PA, Brown RM, et al. (1976) Zinc nutrition of preschool children in the Denver Head
Start program. Am J Clin Nutr 29: 734-8. 31. Smit Vanderkooy PD & Gibson RS (1987) Food consumption patterns of Canadian preschool children in
relation to zinc and growth status. Am J Clin Nutr 45: 609-16. 32. Bouglé D, Laroche D & Bureau F (2000) Zinc and iron status and growth in healthy infants. Eur J Clin Nutr 54:
764-7. 33. Nishi Y (1996) Zinc and growth. J Amer College of Nutr 15: 340-4. 34. Brown KH, Peerson JM, Rivera J & Allen LH (2002) Effect of supplemental zinc on the growth and serum zinc
concentrations of prepubertal children: a meta-analysis of randomized controlled trials. Am J Clin Nutr 75 (6): 1062-71.
35. Chen M, Lin P, Lin W & Cheng V (1988) Zinc in hair and serum of obese individuals in Taiwan. Am J Clin Nutr 48: 1307-9.
36. Di Martino G, Matera MG, De Martino B, Vacca C, Di Martino S & Rossi F (1993) Relationship between zinc and obesity. J Med 24: 177-83.
37. Gibson RS, Skeaff M & Williams S (2000) Interrelationship of indices of body composition and zinc status in 11-yr-old New Zealand children. Biol Trace Elem Res 73: 65-77.
38. Golden BE & Golden MHN (1992) Effect of zinc on lean tissue synthesis during recovery from malnutrition. Eur J Clin Nutr 46: 697-706.
39. Bates CJ, Evans PH, Dardenne M, et al. (1993) A trial of zinc supplementation in young rural Gambian children. Br J Nutr 69: 2443-55.
40. Frijs H, Ndhlovu P, Mduluza T, et al. (1997) The impact of zinc supplementation on growth and body composition: A randomized, controlled trial among rural Zimbabwean schoolchildren. Eur J Clin Nutr 51: 38-45.
41. Kikafunda JK, Walker AF, Allan EF & Tumwine JK (1998) Effect of zinc supplementation on growth and body composition of Ugandan preschool children: a randomized, controlled, intervention trial. Am J Clin Nutr 68 (6): 1261-6.
42. Rosado JL, López P, Munoz E, Martinez H & Allen LH (1997) Zinc supplementation reduced morbidity, but neither zinc nor iron supplementation affected growth or body composition of Mexican preschoolers. Am J Clin Nutr 65: 13-9.
43. Judisch JM, Naiman JL & Oski FA (1966) The fallacy of the fat iron-deficient child. Pediatrics 37: 987-90. 44. Rao KV, Radhiah G & Raju SVS (1980) Association of growth status and the prevalence of anemia in preschool
children. Indian J Med Res 71: 237-46.
CHAPTER 1
36
45. Aukett MA, Parks YA, Scott PH & Wharton BA (1986) Treatment with iron increases weight gain and psychomotor development. Arch Dis Child 61: 849-57.
46. Chwang L, Soemantri AG & Pollitt E (1988) Iron supplementation and physical growth of rural Indonesian children. Am J Clin Nutr 47: 496-501.
47. Angeles IT, Schultink WJ, Matulessi P, Gross R & Sastroamidjojo S (1993) Decreased rate of stunting among anemic Indonesian preschool children through iron supplementation. Am J Clin Nutr 58: 339-42.
48. Latham MC, Stephenson LS, Kinoti SN, Zaman MS & Kurz KM (1990) Improvements in growth following iron supplementation in young Kenyan school children. Nutrition 6: 159-65.
49. Lawless JW, Latham MC, Stephenson LS, Kinoti SN & Pertet AM (1994) Iron supplementation improves appetite and growth in anemic Kenyan primary school children. J Nutr 124 (5): 645-54.
50. Lozoff B, Brittenham GM, Viteri FE, Wolf AW & Urrutia JJ (1982) The effects of short-term oral iron therapy on developmental deficits in iron-deficient anemia infants. J Pediatr 100 (3): 351-7.
51. Rahman MM, Akramuzzaman SM, Mitra AK, Fuchs GJ & Mahalanabis D (1999) Long-term supplementation with iron does not enhance growth in malnourished Bangladeshi children. J Nutr 129: 1319-22.
52. Dossa RAM, Ategbo EAD, Koning FLHA, van Raaij JMA & Hautvast JGAJ (2001) Impact of iron supplementation and deworming on growth performance in preschool Beninese children. Eur J Clin Nutr 55: 223-8.
53. Idjradinata P, Watkins WE & Pollitt E (1994) Adverse effect of iron supplementation on weight gain or iron replete young children. Lancet 343: 1252-4.
54. McCollum EV & Davis M (1915) The essential factors in the diet during growth. J Biol Chem 23: 231-54. 55. Orr JB & Richards MB (1934) Growth and vitamin A deficiency. Biochemical J 28: 1259-73. 56. Lamb AJ, Apiwatanaporn P & Olsen AJ (1974) Induction of rapid, synchronous vitamin A deficiency in the rat. J
Nutr 104: 1140-8. 57. Anzano MA, Lamb AJ & Olsen JA (1979) Growth, appetite, sequence of pathological signs and survival
following the induction of rapid, synchronous vitamin A defiency in the rat. J Nutr 109: 1419-31. 58. Madhavan S, Susheela TP & Swaminathan MS (1967) Association of growth status and prevalence of
nutritional deficiency signs among preschool children. Indian J Med Res 55: 497-503. 59. Brink EW, Perera WDA, Broske SP, et al. (1979) Vitamin A status of children in Sri Lanka. Am J Clin Nutr 32:
84-91. 60. Santos LMP, Dricot JM, Asciutti LS & Dricot-d'Ans C (1983) Xerophthalmia in the state of Paraiba, Northeast of
Brazil: Clinical findings. Am J Clin Nutr 38: 139-44. 61. Mele L, West KJ, Kusdiono, et al. (1991) Nutritional and household risk factors for xerophthalmia in Aceh,
Indonesia: A case-control study. Am J Clin Nutr 53: 1460-5. 62. Tarwotjo I, Katz J, West KJ, Tielsch J & Sommer A (1992) Xerophthalmia and growth in preschool Indonesian
children. Am J Clin Nutr 55: 1142-6. 63. Sedgh G, Herrera MG, Nestel P, el Amin A & Fawzi WW (2000) Dietary vitamin A intake and nondietary factors
are associated with reversal of stunting in children. J Nutr 130: 2520-6. 64. de Pee S, West C, Permaesih D, Martuti S, Muhilal & Hautvast JGAG (1998) Orange fruit is more effective than
are dark-green, leafy vegetables in increasing serum concentrations of retinol and b-carotene in schoolchildren in Indonesia. Am J Clin Nutr 68: 1958-67.
65. Ramakrishnan U & Martorell R (1998) The role of vitamin A in reducing child mortality and morbidity and improving growth. Salud pública de México 40 (2): 189-98.
66. Chusilp K, Somnasang P, Kirdpon W, et al. (1992) Observations on the development of stunting in children of the Khon Kaen region of Thailand. Eur J Clin Nutr 46 (7): 475-87.
67. Black RE, Williams SM, Jones IE & Goulding A (2002) Children who avoid drinking cow milk have low dietary calcium intakes and poor bone health. Am J Clin Nutr 76 (3): 675-80.
68. Aykroyd WR & Krishnan BG (1938) Effect of calcium lactate on children in a nursery school. Lancet ii: 153-5. 69. Aykroyd WR & Krishnan BG (1939) A further experiment on the value of calcium lactate for Indian children.
Indian J Med Res 27: 409-12. 70. Luyken R, Luyken-Koning FWM, Cambridge TH, Dohle T & Bosch R (1967) Studies on physiology of nutrition in
Surinam. X. Protein metabolism and influence of extra calcium on the growth of and calcium metabolism in boarding school children. Am J Clin Nutr 20: 34-42.
71. Lee WTK, Leung SSF, Wang SH, et al. (1994) Double-blind, controlled calcium supplementation and bone mineral accretion in children accustomed to a low-calcium diet. Am J Clin Nutr 60: 744-50.
72. Dibba B, Prentice A, Ceesay M, Stirling DM, Cole TJ & Poskitt EM (2000) Effect of calcium supplementation on bone mineral accretion in Gambian children accustomed to a low-calcium diet. Am J Clin Nutr 71 (2): 544-9.
73. Walker ARP (1954) Does a low intake of calcium retard growth or conduce to stuntedness? Am J Clin Nutr 2: 265-71.

INTRODUCTION
37
74. Greene LS (1980) Social and biological predictors of physical growth and neurological development in an area where iodine and protein-energy malnutrition are endemic. In Social and biological predictors of nutritional status, physical growth, and neurological development, pp. 223-56 [Greene LS and Johnston FE, editors]. New York: Academic Press.
75. Neumann CG & Harrison GG (1994) Onset and evolution of stunting in infants and children. Examples from the Human Nutrition Collaborative Research Support Program. Kenya and Egypt studies. Eur J Clin Nutr 48: 90S-102S.
76. Ramirez I, Fierro-Benitez R, Estrella E, et al. (1969) Iodized oil in the prevention of endemic goiter and associated defects in the Andean region of Ecuador. In Endemic Goiter [Stanbury J and Kroc R, editors]. New York: Plenum.
77. Bautista A, Barker PA, Dunn JT, Sanchez M & Kaiser DL (1982) The effects or oral iodized oil on intelligence, thyroid status, and somatic growth in school-age children from an area of endemic goiter. Am J Clin Nutr 35: 127-34.
78. Caddell JL & Goddard DR (1967) Studies on protein calorie malnutrition. I. Chemical evidence for magnesium deficiency. N Engl J Med 276: 533-5.
79. Schwartz R (1990) Magnesium metabolism. In Nutrition and bone development, pp. 148-63 [Simmons DJ, editor]. Oxford: Oxford University Press.
80. Nichols BL, Alvarado J, Hazelwood CF & Viteri F (1978) Magnesium supplementation in protein-calorie malnutrition. Am J Clin Nutr 31: 176-88.
81. Loveridge N & Noble BS (1994) Control of longitudinal growth: the role of nutrition. Eur J Clin Nutr 48 (2): 75-84. 82. Castillo-Duran C, Fisberg M, Egana JI, Valenzuela A & Uauy R (1983) Controlled trial of copper
supplementation during the recovery from marasmus. Am J Clin Nutr 37: 898-903. 83. Lopez AD & Murray CCJL (1998) The global burden of disease, 1990-2020. Nature Medicine 4: 1241-3. 84. Chandra RK (1999) Nutrition and immunology: from the clinic to cellular biology and back again. P Nutr Soc 58:
681-3. 85. Keusch GT (2003) The history of nutrition: malnutrition, infection and immunity. J Nutr 133: 336S-40S. 86. Scrimshaw NS & Sangionanni JP (1997) Synergism of nutrition, infection, and immunity: an overview. Am J Clin
Nutr 66: 464S-77S. 87. Filteau SM & Tomkins AM (1999) Promoting vitamin A status in low-income countries. Lancet 353: 1458-9. 88. Stephenson CB (1999) Burden of infection on growth failure. J Nutr 129: 534S-8S. 89. Rowland RGM & Rowland SGJ (1988) Impact of infection on the growth of children from 0-12 years in an urban
West African community. Am J Clin Nutr 47: 138-40. 90. Zaman K, Baqui AH, Yunus MD, et al. (1996) Association between nutritional status, cell-mediated immune
status and acute lower respiratory infections in Bangladeshi children. Eur J Clin Nutr 50: 309-14. 91. West KJ, Howard G & Sommer A (1989) Vitamin A and infection. Public Health Implications. Annu Rev Nutr 9:
63-86. 92. Bhaskaram P (2001) Immunobiology of mild micronutrient deficiencies. Br J Nutr 85 (2): 75S-80S. 93. Sommer A, Tarwotjo I, Djunaedi E, et al. (1986) Impact of vitamin A supplementation on childhood mortality: a
randomised controlled community trial. Lancet 1: 1169-73. 94. Beaton GH, Martorell R, Aronson KJ, et al. (1993) Effectiveness of vitamin A supplementation in the control of
young child morbidity and mortality in developing countries. ACC/SCN State-of-the-Art Series, Nutrition Policy Discussion Paper No. 13. Geneva: ACC/SCN.
95. Ghana VAST Study Team (1993) Vitamin A supplementation in northern Ghana: effects on clinic attendances, hospital admissions and child mortality. Lancet 342: 7-12.
96. Shankar AH, Genton B, Semba RD, et al. (1999) Effect of vitamin A supplementation on morbidity due to Plasmodium falciparum in young children in Papua New Guinea: a randomised trial. Lancet 354: 203-9.
97. Barclay AJG, Foster A & Sommer A (1987) Vitamin A supplements and mortality related to measles: a randomised clinical trial. Brit Med J 294: 294-6.
98. Hussey GD & Klein MA (1990) A randomized, controlled trial of vitamin A in children with severe measles. N Engl J Med 323: 160-4.
99. Sommer A & West KP (1996) Vitamin A deficiency. Health, survival, and vision. New York: Oxford University Press.
100. Barreto ML, Santos LMP, Assis AMO, et al. (1994) Effect of vitamin A supplementation on diarrhoea and acute lower-respiratory-tract infections in young children in Brazil. Lancet 344: 228-31.
101. Rahmathullah L, Underwood BA, Thulasiraj RD & Milton RC (1991) Diarrhea, respiratory infections, and growth are not affected by a weekly low-dose vitamin A supplement: a masked, controlled field trial in children in southern India. Am J Clin Nutr 54: 568-77.

CHAPTER 1
38
102. Bhandari N, Bhan MK & Sazawal S (1994) Impact of massive dose of vitamin A given to preschool children with acute diarrhoea on subsequent respiratory and diarrhoeal morbidity. Brit Med J 309: 1404-7.
103. The Vitamin A and Pneumonia Working Group (1995) Potential interventions for the prevention of childhood pneumonia in developing countries: a meta-analysis of data from field trials to assess the impact of vitamin A supplementation on pneumonia morbidity and mortality. B World Health Organ 73: 609-19.
104. Gibson RS, Vanderkooy PDS, MacDonald AC, Goldman A, Ryan BA & Berry M (1989) A growth-limiting, mild zinc-deficiency syndrome in some Southers Ontario boys with low height percentiles. Am J Clin Nutr 49: 1266-73.
105. Berger A (2002) Science commentary. What does zinc do? Brit Med J 325: 1062. 106. Hambidge M & Krebs N (1999) Zinc, diarrhea, and pneumonia. J Pediatr 135 (6): 661-4. 107. Shankar AH & Prasad AS (1998) Zinc and immune function: the biological basis of altered resistance to
infection. Am J Clin Nutr 68: 447S-63S. 108. Beck FW, Prasad AS, Kaplan J, Fitzgerald JT & Brewer GJ (1997) Changes in cytokine production and T cell
subpopulations in experimentally induced zinc-deficient humans. Am J Physiol 272: E1002-E7. 109. Bhutta ZA, Black RE, Brown KE, et al. (1999) Prevention of diarrhea and pneumonia by zinc supplementation in
children in developing countries: pooled analysis of randomized controlled trials. Zinc Investigators' Collaborative Group. J Pediatr 135 (6): 689-97.
110. Bhutta Z, Bird S, Black R, et al. (2000) Therapeutic effects or oral zinc in acute and persistent diarrhea in children in developing countries: pooled analysis of randomized controlled trials. Am J Clin Nutr 72: 1516-22.
111. Gibson RS, Heywood A, Yaman C, Sohlstrom A, Thompson L & Heywood P (1991) Growth in children from the Wosera sub-district Papua New Guinea, in relation to energy and protein intakes and zinc status. Am J Clin Nutr 53: 782-9.
112. Black RE (1998) Therapeutic and preventive effects of zinc on serious childhood infectious diseases in developing countries. Am J Clin Nutr 68: 476S-9S.
113. Shankar AH, Genton B, Baisor M, et al. (2000) The influence of zinc supplementation on morbidity due to Plasmodium falciparum: a randomized trial in preschool children in Papua New Guinea. Am J Trop Med Hyg 62 (6): 663-9.
114. Golden M & Golden B (1981) Effect of zinc supplementation on the dietary intake, rate of weight gain, and energy cost of tissue deposition in children recovering from severe malnutrition. Am J Clin Nutr 34 (5): 900-8.
115. Ninh NX, Thissen JP, Collette L, Gerard G & Khoi HH (1996) Zinc supplementation increases growth and circulating insulin-like growth factor I (IGF-I) in growth-retarded Vietnamese children. Am J Clin Nutr 63: 514-19.
116. Ruel MT, Rivera JA, Santizo MC, Lonnerdal B & Brown KH (1997) Impact of zinc supplementation on morbidity from diarrhea and respiratory infections among rural Guatemalan children. Pediatrics 99 (6): 808-13.
117. Meeks Gardner JM, Witter MM & Ramdath DD (1998) Zinc supplementation: effect on the growth and morbidity of undernourished Jamaican children. Eur J Clin Nutr 52: 34-9.
118. Sazawal S, Black RE, Mazumdar S, Sinha A & Bhan MK (1998) Zinc supplementation reduces the incidence of acute lower respiratory infections in infants and preschool children: a double-blind controlled trial. Pediatrics 102: 1-5.
119. Tomkins A (2000) Malnutrition, morbidity and mortality in children and their mothers. P Nutr Soc 59: 135-46. 120. Krantman HJ, Young SR, Ank BJ, O'Donnell CM, Rachelefsky GS & Stiehm ER (1982) Immune function in pure
iron deficiency. Am J Dis Child 136: 840-4. 121. Dhur A, Galan P & Hercberg S (1989) Iron status, immune capacity and resistance to infection. Comp Biochem
Physiol 94: 11-9. 122. Tomkins A & Watson F (1989) Malnutrition and infection: a review, ACC/SCN State-of-the-art series nutrition
policy discussion paper no. 5. Geneva: ACC/SCN. 123. Thibault H, Galan P, Selz F, et al. (1993) The immune response in iron-deficient young children: effect of iron
supplementation on cell-mediated immunity. Eur J Pediatr 152: 120-4. 124. Tonkin S (1970) Maori infant health: trial of intramuscular iron to prevent anaemia in Maori babies. New
Zealand Med J 71: 129-34. 125. Masawe AEJ, Muindi JM & Swai GBR (1974) Infections in iron deficiency and other types of anaemia in the
tropics. Lancet 2: 314-7. 126. Basta SS, Soekirman, Karyadi D & Scrimshaw NS (1979) Iron deficiency anaemia and the productivity of adult
males in Indonesia. Am J Clin Nutr 32: 916-25. 127. Oppenheimer SJ (2001) Iron and its relation to immunity and infectious disease. J Nutr 131: 616S-35S. 128. Kochan I (1973) The role of iron in bacterial infections with special consideration of host-tubercle bacillus
interaction. Curr Trop Microbiol Immunol 60: 1-30. 129. Weinberg ED (1978) Iron and infection. Microbiol Rev 42: 45-66.

INTRODUCTION
39
130. International Nutritional Anemia Consultative Group (2000) Safety of Iron Supplementation Programs in Malaria-Endemic Regions. Washington, DC: ILSI Press.
131. Gera T & Sachdev HP (2002) Effect of iron supplementation on incidence of infectious illness in children: a systematic review. Brit Med J 325: 1142-51.
132. Allen LH (2002) Iron supplements: Scientific issues concerning efficacy and implications for research and programs. J Nutr 132: 813S-9S.
133. Beck MA, Levander OA & Handy J (2003) Selenium Deficiency and Viral Infection. J Nutr 133: 1463S-67S. 134. Hallberg L & Hulthén L (2000) Prediction of dietary iron absorption: an algorithm for calculating absorption and
bioavailability of dietary iron. Am J Clin Nutr 71: 1147-60. 135. Monsen ER, Hallberg L, Layrisse M, et al. (1978) Estimation of available dietary iron. Am J Clin Nutr 31: 134-
41. 136. Hallberg L, Hulthén L & Garby L (1998) Iron stores in man in relation to diet and iron requirements. Eur J Clin
Nutr 52: 623-31. 137. Reddy MR, Hurrell RF & Cook JD (2000) Estimation of nonheme-iron bioavailability from meal compositions.
Am J Clin Nutr 71: 937-43. 138. Monsen ER & Cook JD (1976) Food iron absorption in human subjects. IV. The effects of calcium and
phosphate salts on the absorption of nonheme iron. Am J Clin Nutr 29: 1142–8. 139. Gillooly M, Bothwell TH, Torrance JD, et al. (1983) The effect of organic acids, phytates and polyphenols on the
absorption of iron from vegetables. Br J Nutr 49 (3): 331-42. 140. Cook JD, Morck TA & Lynch SR (1981) The inhibitory effect of soy products on nonheme iron absorption in
man. Am J Clin Nutr 34: 2622-9. 141. Rossander L (1987) Effect of dietary fiber on iron absorption in man. Scand J Gastroenterol 129: 68S-72S. 142. Callender ST, Marney SRJ & Warner GT (1970) Eggs and iron absorption. Br J Haematol 19: 657-65. 143. Lynch SR & Stoltzfus RJ (2003) Iron and ascorbic acid: proposed fortification levels and recommended iron
compounds. J Nutr 133: 2978S-84S. 144. Garcia-Casal MN, Layrisse M, Solano L, et al. (1998) Vitamin A and b-carotene can improve nonheme iron
absorption from rice, wheat and corn by humans. J Nutr 128: 646-50. 145. Hallberg L, Brune M & Rossander L (1989) Iron absorption in man: ascorbic acid and dose-dependent inhibition
by phytate. Am J Clin Nutr 49: 140-4. 146. Reddy NR & Sathe SK (2002) Food phytates. [Reddy NR and Sathe SK, editors]. Boca Raton, FA: CRC Press. 147. Bravo L (1998) Polyphenols: chemistry, dietary sources, metabolism, and nutritional significance. Nutr Rev 56:
317-33. 148. Morck TA, Lynch SR & Cook JD (1983) Inhibition of food iron absorption by coffee. Am J Clin Nutr 37: 416-20. 149. Disler PB, Lynch SR, Charlton RW, et al. (1975) The effect of tea on iron absorption. Gut 16: 193-200. 150. Brune M, Rossander L & Hallberg L (1989) Iron absorption and phenolic compounds: importance of different
phenolic structures. Eur J Clin Nutr 43 (8): 547-57. 151. Hurrell RF, Reddy M & Cook JD (1999) Inhibition of non-haem iron absorption in man by polyphenolic-
containing beverages. Br J Nutr 81: 289-95. 152. Garcia-Lopez S, Erdman JW & Sherman AR (1990) Iron retention by rats from casein-legume test meals: effect
of tannin level and previous diet. J Nutr 120: 760-6. 153. Jansman AJM, Houdijk JGM & Verstegen MWA (1993) Effects of condensed tannins in faba beans (Vicia faba
L.) on the availability of minerals in pigs. In Bioavailability '93: Nutritional, Chemical and Food Processing Implications of Nutrient Availability [Schlemmer U, editor]. Karlsruhe: Federation of European Chemical Societies.
154. Hallberg L, Brune M, Erlandsson M, Sandberg AS & Rossander-Hulthén L (1991) Calcium: effect of different amounts on nonheme- and heme-iron absorption in man. Am J Clin Nutr 53: 112-9.
155. Hallberg L (1998) Does calcium interfere with iron absorption? Am J Clin Nutr 68: 3-4. 156. Hallberg L, Rossander-Hulten L, Brune M & Gleerup A (1992) Calcium and iron absorption: mechanism of
action and nutritional importance. Eur J Clin Nutr 46: 317-27. 157. Gleerup A, Rossander-Hulten L & Hallberg L (1993) Duration of the inhibitory effect of calcium on non-haem
iron absorption in man. Eur J Clin Nutr 47 (12): 875-9. 158. Lynch SR (1997) Interaction of iron with other nutrients. Nutr Rev 55: 102-10. 159. Siegenberg D, Baynes RD, Bothwell TH, et al. (1991) Ascorbic acid prevents the dose-dependent inhibitory
effects of polyphenols and phytates on nonheme-iron absorption. Am J Clin Nutr 53: 537-41. 160. Layrisse M, Martinez-Torres C & Roch M (1968) Effect of interaction of various foods on iron absorption. Am J
Clin Nutr 21: 1175-83. 161. Taylor PG, Martinez-Tores C, Ramono EL & Layrisse M (1986) The effect of cysteine-containing peptides
released during meat digestion on iron absorption in humans. Am J Clin Nutr 43: 68-71.
CHAPTER 1
40
162. Bæch SB, Hansen M, Bukhave K, et al. (2003) Nonheme-iron absorption from a phytate-rich meal is increased by the addition of small amounts of pork meat. Am J Clin Nutr 77 (1): 173-9.
163. Kim Y, Carpenter CE & Mahony AW (1993) Gastric acid production, iron status, and dietary phytate alter enhancement by meat of iron absorption in rats. J Nutr 123: 940-6.
164. Zheng J, Mason JB, Rosenberg IH & Wood RJ (1993) Measurement of zinc bioavailability from beef and ready-to-eat high-fiber breakfast cereal in humans: application of a whole gut lavage technique. Am J Clin Nutr 58: 902-7.
165. Higgs J & Pratt J (1998) Meat, poultry and meat products. In Encyclopedia of human nutrition, p. 1275 [Sadler MJ, Strain JJ and Caballero B, editors]. San Diego and London: Academic Press.
166. Dwyer JT (1991) Nutritional consequences of vegetarianism. Annu Rev Nutr 11: 61-91. 167. Phillips P & Segasothy M (1999) Commentary. Vegetarian diet: panacea for modern lifestyle diseases? QJM 92
(9): 531-44. 168. Hoffmann I, Groeneveld MJ, Boeing H, et al. (2001) Giessen Wholesome Nutrition Study: relation between a
health-conscious diet and blood lipids. Eur J Clin Nutr 55 (10): 887-95. 169. Gibson R (1994) Zinc nutrition in developing countries. Nutr Res Rev 7: 151-73. 170. Herbert JR (1985) Relationship of vegetarianism to child growth in South India. Am J Clin Nutr 42: 1246-54. 171. Jacobs C & Dwyer JT (1988) Vegetarian children: appropriate and inappropriate diets. Am J Clin Nutr 48 (3):
811S-8S. 172. Tayter M & Stanek KL (1989) Anthropometric and dietary assessment of omnivore and lacto-ovo-vegetarian
children. J Am Diet Assoc 89 (11): 1661-3. 173. Sabate J, Lindsted KD, Harris RD & Sanches A (1991) Attained height of lacto-ovo vegetarian children and
adolescents. Eur J Clin Nutr 45: 51-8. 174. Nathan I, Hackett AF & Kirby S (1997) A longitudinal study of the growth of matched pairs of vegetarian and
omnivorous children, aged 7-11 years, in the north-west of England. Eur J Clin Nutr 51: 20-5. 175. American Academy of Pediatrics/Committee on Nutrition (1998) Soy protein-based formulas: recommendations
for use in infant feeding. Pediatrics 101: 148-53. 176. Hebbelinck M, Clarys P & De Malsche A (1999) Growth, development, and physical fitness of Flemish
vegetarian children, adolescents, and young adults. Am J Clin Nutr 70 (3 Suppl): 579S-85S. 177. Thane CW & Bates CJ (2000) Dietary intakes and nutrient status of vegetarian preschool children from a British
national survey. J Hum Nutr Diet 13 (3): 149-62. 178. Leung S, Lee R, Sung R, et al. (2001) Growth and nutrition of Chinese vegetarian children in Hong Kong. J
Paediatr Child Health 37 (3): 247-53. 179. Mangels AR & Messina V (2001) Considerations in planning vegan diets: infants. J Am Diet Assoc 101 (6): 670-
7. 180. Sanders TAB & Purves R (1981) An anthropometric and dietary assessment of the nutritional status of vegan
preschool children. J Hum Nutr 35: 349-57. 181. O'Connell JM, Dibley MJ, Sierra J, Wallace B, Marks JS & Yip R (1989) Growth of vegetarian children: The
Farm Study. Pediatrics 84 (3): 475-81. 182. Dagnelie PC, van Dusseldorp M, van Staveren WA & Hautvast JGAJ (1994) Effects of macrobiotic diets on
linear growth in infants and children until 10 years of age. Eur J Clin Nutr 48: 103S-12S. 183. Curtis JA, Kooh SW, Fraser D & Greenberg ML (1983) Nutritional rickets in vegetarian children. Can Med
Assoc J 128 (2): 150-2. 184. Dagnelie PC, Vergote FJ, Van Staveren WA, van den Berg H, Dingjan PG & Hautvast JG (1990) High
prevalence of rickets in infants on macrobiotic diets. Am J Clin Nutr 51: 202-8. 185. Dhonukshe-Rutten RA, van Dusseldorp M, Schneede J, de Groot LC & van Staveren WA (2005) Low bone
mineral density and bone mineral content are associated with low cobalamin status in adolescents. Eur J Nutr 44 (6): 341-7.
186. Hirota T, Nara M, Ohguri M, Manago E & Hirota K (1992) Effect of diet and lifestyle on bone mass in Asian young women. Am J Clin Nutr 55: 1168-73.
187. Murphy S, Khaw K-T, May H & Compston JE (1994) Milk consumption and bone mineral density in middle aged and elderly women. Brit Med J 308: 939-41.
188. Teegarden D, Lyle RM, Proulx WR, Johnston CC & Weaver CM (1999) Previous milk consumption is associated with greater bone density in young women. Am J Clin Nutr 69: 1014-7.
189. Neumann CG & Bwibo NO (1987) Final report: Food intake and human function, Kenya Project, Human Collaborative Support Program, USAID, Office of Nutrition.
190. Allen LH, Backstrand JR, Stanek EJI, et al. (1992) The interactive effects of dietary quality on the growth of young Mexican children. Am J Clin Nutr 56: 353-64.
INTRODUCTION
41
191. Calloway DH, Murphy S, Balderston O, Receveur O, Lein D & Hudes M (1992) Final report: Functional implications of malnutrition, Across NCRSP Projects, USAID.
192. Walker SP, Powell CA & Grantham-McGregor SM (1990) Dietary intakes and activity levels of stunted and non-stunted children in Kingston, Jamaica, Part 1, Dietary Intakes. Eur J Clin Nutr 44: 527-34.
193. Graham GG, Creed HM, MacLean WC, Kallman CH, Rabold J & Mellits ED (1981) Determinants of growth among poor children: nutrient intake-achieved growth relationships. Am J Clin Nutr 34: 539-54.
194. Marquis GS, Habicht JP, Lanata CF, Black RE & Rasmussen KM (1997) Breast milk or animal-product foods improve linear growth of Peruvian toddlers consuming marginal diets. Am J Clin Nutr 66 (5): 1102-9.
195. Paik HY, Hwang SH & Lee SP (1992) Comparative analysis of growth, diet, and urinary N excretion in elementary school children from urban and rural areas of Korea. Int J Vitam Nutr Res 62: 83-90.
196. Uauy R, Mize CE & Castillo-Duran C (2000) Fat intake during childhood: metabolic responses and effects on growth. Am J Clin Nutr 72: 1354S-60S.
197. Gittelsohn J, Shankar AV, West Jr. KP, Ram R, Dhungel C & Dahal B (1997) Infant feeding practices reflect antecedent risk of xerophthalmia in Nepali children. Eur J Clin Nutr 51: 484-90.
198. Malcolm LA (1970) Growth retardation in a New Guinea boarding school and its response to supplementary feeding. Br J Nutr 24: 297-305.
199. Golden BE & Golden MHN (1981) Plasma zinc, rate of weight gain and energy cost of tissue deposition in children recovering from severe malnutrition on cow's milk or soya protein based diet. Am J Clin Nutr 34: 892-9.
200. Lampl M, Johnston FE & Malcolm LA (1987) The effects of protein supplementation on the growth and skeletal maturation of New Guinean school children. Ann Hum Biol 5: 219-27.
201. Heikens GT, Schofield WN, Dawson S & Grantham-McGregor S (1989) The Kingston Project. I. Growth of malnourished children during rehabilitation in the community, given a high energy supplement. Eur J Clin Nutr 43: 145-60.
202. Walker SP, Powell CA, Grantham-McGregor SM, Himes JH & Chang SM (1991) Nutritional supplementation, psychosocial stimulation, and growth of stunted children: the Jamaican study. Am J Clin Nutr 54 (4): 642-8.
203. Schroeder DG, Martorell R, Rivera JA, Ruel MT & Habicht J-P (1995) Age differences in the impact of nutritional supplementation on growth. J Nutr 125: 1051S-9S.
204. Baker IA, Elwood PC, Hughes J, Jones M, Moore F & Sweetnam PM (1980) A randomized controlled trial of the effect of the provision of free school milk on the growth of children. J Epidemiol Community Health 34: 31-4.
205. Zumrawi F, Vaughan JP, Waterlow JO & Kirkwood BR (1981) Dried skimmed milk, breast-feeding and illness episodes - a controlled trial in young children in Karthoum Province, Sudan. Int J Epidemiol 10: 303-8.
206. Köhler L, Meeuwisse G & Mortensson W (1984) Food intake and growth of infants between six and twenty-six weeks of age on breast milk, cow's milk formula, or soy formula. Acta Paediatr Scan 73: 40-8.
207. Bonjour J, Carrie A, Ferrari S, et al. (1997) Calcium-enriched foods and bone mass growth in prepubertal girls: a randomised, double-blind, placebo-controlled trial. J Clin Invest 99: 1287-94.
208. Cadogan J, Eastell R, Jones N & Barker ME (1997) Milk intake and bone mineral acquisition in adolescent girls: randomised, controlled intervention trial. Brit Med J 315: 1255-60.
209. Merrilees MJ, Smart EJ, Gilchrist NL, et al. (2000) Effects of dairy food supplements on bone mineral density in teenage girls. Eur J Clin Nutr 39: 256-62.
210. Elwood PC, Haley TJ, Hughes SJ, Sweetnam PM, Gray OP & Davies DP (1981) Child growth (0-5 years), and the effect of entitlement to a milk supplement. Arch Dis Child 56: 831-5.
211. Chan GM, Hoffman K & McMurry M (1995) Effects of dairy products on bone and body composition in pubertal girls. J Pediatr 126: 551-6.
212. Lartey A, Manu A, Brown KH, Peerson JM & Dewey KG (1999) A randomized, community-based trial of the effects of improved, centrally processed complementary foods on growth and micronutrient status of Ghanaian infants from 6 to 12 mo of age. Am J Clin Nutr 70 (3): 391-404.
213. Neumann CG, Bwibo NO, Murphy SP, et al. (2003) Animal Source Foods Improve Dietary Quality, Micronutrient Status, Growth and Cognitive Function in Kenyan School Children: Background, Study Design and Baseline Findings. J Nutr 133 (11): 3941S-9S.
214. Murphy SP, Calloway DH & Beaton GH (1995) Schoolchildren have similar predicted prevalences of inadequate intakes as toddlers in village populations in Egypt, Kenya, and Mexico. Eur J Clin Nutr 49: 647-57.
215. Filteau SM & Tomkins AM (1994) Micronutrients and tropical infections. T Roy Soc Trop Med H 88: 1-3 & 26. 216. Black MM (2003) Micronutrient Deficiencies and Cognitive Functioning. J Nutr 133 (11): 3927S-31S. 217. UNICEF (1996) Fifth nutrition survey 1994. Nairobi: Office of the Vice-President and Ministry of Planning and
National Development, Central Bureau of Statistics. 218. Neumann CG, Bwibo NO & Sigman M (1992) Final report phase II: Functional implications of malnutrition,
Kenya Project, Human Nutrition Collaborative Research Support Program: Diet quantity and quality, USAID, Office of nutrition.

CHAPTER 1
42
219. Institute of Medicine (1998) Dietary Reference Intakes for thiamin, riboflavin, niacin, vitamin B6, folate, vitamin B12, pantothenic acid, biotin, and choline. Washington, DC: National Academy Press.
220. Neumann CG & Bwibo N (1987) The collaborative research support program on food intake and human function, Kenya project. Final report. Los Angeles: School of Public Health, University of California and College of Health Sciences, University of Nairobi, Nairobi, Kenya.
221. Office of the Vice-President and Ministry of Planning and National Development/Republic of Kenya (1997) Embu District Development Plan 1997-2001. Nairobi: Government Printer.
222. UNDP (1999) Kenya Human Development Report 1999. Nairobi: UNDP. 223. Calloway DH, Murphy SP, Bunch S & Woerner J (1994) WorldFood Dietary Assessment System User's Guides.
Berkeley: The University of California. 224. Murphy SP, Beaton GH & Calloway DH (1992) Estimated mineral intakes of toddlers: predicted prevalence of
inadequacy in village populations in Egypt, Kenya, and Mexico. Am J Clin Nutr 56: 565-72. 225. Bengoa JM (1971) Significance of malnutrition and prioritization for its prevention, national development, and
planning. Presented at an International Conference, Cambridge, MA, USA. Cambridge: MIT Press.

22
Food supplements have a positive impact on weight gain and the addition of animal source foods increases lean
body mass of Kenyan school children
Monika Grillenberger, Charlotte G. Neumann, Suzanne P. Murphy, Nimrod O. Bwibo, Pieter van’t Veer, Joseph G.A.J. Hautvast, Clive E. West
Journal of Nutrition 2003; 133: 3957S-64S

CHAPTER 2
44
ABSTRACT
Observational studies of dietary patterns and growth and studies with milk supplementation have shown that children consuming diets containing animal source foods grow better. This study evaluates the growth of 544 Kenyan school children (median age 7.1 years) after 23 months of food supplementation with a meat, milk or energy supplement (~1255 kJ) compared to a control group without a supplement. Multivariate analyses controlled for covariates compared gain in weight, height, weight-for-height Z-score (WHZ), height-for-age Z-score (HAZ), mid-upper-arm circumference, triceps and subscapular skinfolds, mid-upper-arm muscle area, and mid-upper-arm fat area. Children in each of the supplementation groups gained ~0.4 kg (10%) more weight than children in the control group. Children in the meat, milk and energy groups gained 0.33 cm, 0.19 cm and 0.27 cm more, respectively, in mid-upper-arm circumference than children in the control group. Children who received the meat supplement gained 30-80% more mid-upper-arm muscle area than children in the other groups and children who received the milk supplement gained 40% more mid-upper-arm muscle area than children who did not receive a supplement. No statistically significant overall effects of supplementation were found on height, HAZ, WHZ or measures of body fat. A positive effect of the milk supplement on height gain could be seen in the subgroup of children with a lower baseline HAZ (≤ -1.4). The results indicate that food supplements had a positive impact on weight gain in the study children and that the addition of meat increased their lean body mass.

ANIMAL SOURCE FOODS AND GROWTH
45
INTRODUCTION
Nutrition intervention programs initially focused on increasing the protein and energy intake of the target population1-4, but suboptimal growth observed in children in developing countries has been shown to be related to micronutrient deficiencies as well. Several studies with single or combined micronutrient supplements, especially zinc5,6 and iron7-12, improved growth in children, but more information is needed on the effects of specific foods containing these and other micronutrients needed for optimal growth. Diets in developing countries are mostly plant based, and intake of protein from meat is usually extremely low, providing only 15% of dietary protein compared with ~60% in developed countries13. Animal source foods, such as meat and milk, can supply multiple micronutrients in an efficient and digestible way and also provide the high quality protein necessary for child health, growth, and development. Meat is rich in haem iron, zinc, riboflavin, vitamin B12, niacin, and vitamin B6, but it is low in vitamin A and folate. Milk is a good source of vitamin A, calcium, phosphorus, vitamin B12, riboflavin and folate, but it is low in zinc and iron. Even when small amounts of animal source foods are part of the usual diet of children, they consistently are associated positively with growth14-16. Although supplementing children with milk or milk products has been shown to have beneficial effects on growth4,17-23, milk does not improve iron or zinc status. Diets in developing countries usually contain high amounts of substances that reduce the bioavailability of micronutrients. This low bioavailability, especially of iron and zinc, from plant sources can be improved by consuming meat, even in the presence of dietary inhibitors24-26. No controlled feeding intervention study has been conducted thus far to evaluate the effect of supplementing children with different animal source foods on their physical and cognitive development compared to a control group. Therefore, we performed a 2-year intervention study in which meat and milk were added to the usual plant-based diet to examine whether regular intake of small amounts of these foods could improve the growth of children suffering from moderate stunting and multiple micronutrient deficiencies.
MATERIALS AND METHODS
Study area
The study was conducted in Kyeni South Division of Embu District in Eastern Province, Kenya. The study area is on the slopes of Mt. Kenya, near the Equator, with an elevation ranging from 1200–1460 m. The region is characterized by distinct rainy and dry seasons, with mild weather year-round. The study area includes a relatively fertile zone with higher rainfall and a semi-arid area at lower elevations. During the study period there was a drought that resulted in low harvests of the staple crops, maize and beans. Cash crops, which are produced in the area on a small scale, include coffee, cotton, and tobacco. Studies in this area in the 1980s showed that the intake of animal source foods was low, with only 1% of the energy intake of school children supplied by milk and < 1% from meat27. Intakes of iron, zinc, calcium, riboflavin and vitamins B12, D, E and A were inadequate in toddlers and school children28.
CHAPTER 2
46
Study design
All children enrolled in class 1 (median age 7.1 years) from twelve selected primary schools (n 554) participated in the study. They received either a daily food supplement or no supplement (control). Schools were assigned randomly to one of three different food supplements. These were isoenergetic and contained meat, milk or extra fat (referred to as the ‘‘energy supplement’’). Because three large schools had more than one class 1 classroom, each of these schools was randomly assigned to each of the groups, such that these schools could not be randomised to the same food supplementation group. The feeding started on August 31, 1998, at the beginning of the last school term of the year, and ended in July 2000. The school year in Kenya begins in January and comprises three terms, with three 1-month breaks in April, August and December. The supplement was distributed for 18 months, when schools were in session. In the new school year in 1999 the children moved to class 2, and in January 2000 they moved to class 3. Repeaters were kept in the study and continued to be fed with their original class. Every child in a class where a food supplement was distributed participated in the feeding, irrespective of whether data were collected from them or whether their data were included in the analyses.
Approval was obtained from the University of California, Los Angeles, Human Subject Protection Committee, and the Ethics Committee of the University of Nairobi, School of Medicine, Kenya, and the Office of the President, Government of Kenya. All local and district authorities were involved in the implementation of the study, and the community was informed extensively about the aim and procedures of the intervention. Informed verbal consent of the parents of the study children was obtained before the study. After completion of the study, the households in the control group were given a local milk goat. This was chosen by the parents through representative committees as compensation for the food their children missed during the course of the study.
Preparation, distribution and composition of food supplements
The vehicle for the food supplements was githeri, a local dish made from dry white maize (Zea mays), Mwitemania beans (kidney beans, Phaseolus vulgaris), tomatoes, onions, iodised salt (Kensalt, 168.5 mg potassium iodate/kg; Salt Manufacturers, Kenya), vegetable fat (Kimbo, fortified with 124 IU retinol/g; Unilever, Kenya) and sukuma wiki (kale or collard greens, Brassica oleracea). For the meat supplement, minced beef (10% fat) was added; for the milk supplement, a glass of ultrahigh-temperature cow’s milk was served after the consumption of the githeri; and the energy supplement contained additional fat. The food supplement was thoroughly mixed to ensure that all children received the same amount of all ingredients and that part of the mixture would not be consumed preferentially (such as pieces of meat). It was deemed important that only local foods and familiar preparation methods were used, but for hygienic and logistical reasons, the milk and meat were purchased from reputable wholesalers within the region or from Nairobi. Taste tests were conducted with school children, and where necessary, recipes were adjusted. During the first school term of the intervention (from

ANIMAL SOURCE FOODS AND GROWTH
47
September to November 1998), the meat, milk and energy supplements contained an estimated energy content of ~1050 kJ/serving. The amounts of some ingredients then were increased, because children grew in height and weight, to achieve a total energy content of ~1255 kJ, which was maintained at this level throughout the intervention phase. The milk and meat supplements provided more than half of the recommended daily intake of vitamin A and > 75% of the recommended daily amount of vitamin B12. The meat supplement provided nearly one-third of the recommended iron and more than half of the recommended daily amount of zinc, whereas the milk supplement provided > 75% of the recommended intake of riboflavin. The food was prepared in a central location following strict hygienic preparation methods and weighed into plastic bowls, each of which was labelled with a child’s name, and transported while still hot in insulated containers by car to the schools. The food was served during the first school break at 9:30 a.m. This time was chosen to avoid breakfast or lunch being replaced by the food supplement. Project staff ensured that each child received the food container that was labelled with his/her name and that no food was spilled or exchanged between the children. Afterwards, the bowls and cups were collected. The milk leftovers were measured at school, and later at the cooking site the food leftovers were weighed and the amounts were recorded.
Data collection
Twelve local women who had worked as enumerators in the Nutrition Collaborative Research Support Program on Food Intake and Human Function (NCRSP) in the same location in 1984 were retrained to perform the anthropometric data collection. A supervisor monitored the interviews/measurements, checked the forms, and maintained and calibrated the equipment. The area of the twelve schools was divided into three clusters to facilitate data collection and supervision. The enumerators were rotated between clusters and schools to prevent bias. The methods used were based on the NCRSP study. The forms were pretested and adapted. The ages of the children were derived from the census questionnaires or from the school register.
Anthropometry
Weight, mid-upper-arm circumference (MUAC), triceps skinfold thickness and subscapular skinfold thickness were measured every month in the first year and every other month in the second year. Height was measured every 4 months in the first year and every 8 months in the second year following recommended protocols29,30. Weight was measured to the nearest 0.1 kg on an electronic digital scale (Seca, Columbia, MD) and shoes and as many clothes as possible were removed. The boys were weighed in short trousers and a shirt (average total weight 230 g) and the girls were weighed in a tunic and a blouse (average total weight 280 g). The weight of the clothes was deducted from the weight of the children. Height was measured (with the children shoeless) to the nearest 0.1 cm with a locally manufactured wooden board fitted with a measuring tape, a fixed-foot plate and a movable headboard. The height of the mother was measured once during the study by a light portable wooden device with a footplate, a measuring tape and a headboard. MUAC was measured using a plastic insertion tape (Perspective

CHAPTER 2
48
Enterprises, Kalamazoo, MI) on the left relaxed arm, midway between the tips of the acromion and olecranon processes. The reading was taken to the nearest 0.1 cm. Skinfold thickness was measured with a Lange caliper (Cambridge Scientific Industries, Cambridge, MD). To reduce intraindividual error, each skinfold thickness measure was performed in triplicate and the mean value was used for analyses. The triceps skinfold was taken to the nearest 0.5 mm at the same mark as the MUAC on the left arm. The subscapular skinfold was measured to the nearest 0.5 mm, below and to the right of the inferior angle of the left scapula, at an angle of 45°.
All measurements were obtained independently by two enumerators, and the mean of their measurements was used as the actual value. If the difference of their measurements exceeded preset limits (0.5 cm for height, 2 mm for triceps and subscapular skinfolds, 0.2 cm for MUAC and 0.1 kg for weight), the measurements had to be repeated, and the mean of this pair of measurements was used. Measurements generally were conducted at school; however, when a child was absent or when the school was closed, measurements were made at the child’s home. All enumerators underwent initial and ongoing training and standardisation. The accuracy of the equipment was checked before every round of measurements. Intra-team and inter-team measurement error was monitored by independently repeating all anthropometry during the same session in a random sample2. The technical error of measurement was expressed as a standard deviation (SD = √Σd2/2n, where d is the difference between paired measurements and n is the number of paired measurements). The intra-team technical errors of measurement were 0.15 kg for weight, 0.11 cm for height, 0.11 cm for MUAC, 0.29 mm for triceps skinfold and 0.23 mm for subscapular skinfold. The inter-team technical errors of measurement were 0.11 kg for weight, 0.30 cm for height, 0.11 cm for MUAC, 0.47 mm for triceps skinfold and 0.38 mm for subscapular skinfold. Estimates of mid-upper-arm muscle area and mid-upper-arm fat area, indicators of body muscle and subcutaneous fat mass31, were derived from measurements of the triceps skinfold and the MUAC by standard formulas32. The EpiInfo2000 program (version 1.0.5; Centers for Disease Control and Prevention, Atlanta, GA), which uses the CDC/WHO 1977/1985 reference curves for age, sex, height and weight33, was used to transform the height and weight measurements into sex- and age-specific Z-scores: height-for-age Z-score (HAZ), weight-for-age Z-score (WAZ) and weight-for-height Z-score (WHZ). For girls aged > 10 years (or > 137 cm) and boys aged > 11.5 years (or > 145 cm), WHZ could not be calculated due to lack of reference data in the EpiInfo program (n 13).
Food Intake
A semiquantitative 24-hours recall method was used to estimate the usual intake of energy, macronutrients, micronutrients, dietary fibre and phytate by the study children. All days of the week except Fridays and Saturdays (because no food intake data was collected on Saturdays and Sundays) were proportionately included in the survey to account for any day-of-the-week
2 Intra-team: weight 6% (n 461), height 2% (n 165), MUAC 6% (n 462), subscapular skinfold 6% (n 462), triceps skinfold 6% (n 462) and inter-team: weight 5% (n 373), height 3% (n 255), MUAC 5% (n 376), subscapular skinfold 5% (n 376), triceps skinfold 5% (n 376).

ANIMAL SOURCE FOODS AND GROWTH
49
effects on food and/or nutrient intakes. Food models and local plastic dishes and utensils were used to estimate the portion sizes. Mothers of the study children were encouraged to maintain the usual home diet for the children in the study. The food intake data were analysed with the WorldFood Dietary Assessment System, version 2.034. For the baseline food intake, an average of three food intake measurements was used.
Physical examination and morbidity
Before the intervention, experienced local physicians performed a clinical examination of each child. All children were dewormed with a single dose of mebendazole before the intervention, and deworming was repeated 8 months later. Retrospective information on morbidity was collected monthly by interview. The enumerator visited the household and asked a caregiver, usually the mother, about any illness or symptoms the child experienced on the day of the visit and/or in the previous week using a structured questionnaire. The questionnaire included general symptoms of diseases and sixteen major illness categories based on previous studies. Guidelines were established as to when the supervising nurse or a physician should revisit a child. Quality control measures included intensive preliminary and ongoing training of enumerators, close supervision of enumerators, and reinterviews of 15% of the children. A score was derived to categorise the diseases/symptoms as mild and severe. Any seriously ill children were referred for treatment to the local health centre.
Demographic information
Data on the socio-economic status (SES) of each family was collected before the intervention. A socio-eonomic status score was derived from the following variables: land ownership and area cultivated, number and type of livestock owned, source and amount of income, income from food products, type and income from cash crops, expenditures, household possessions, the construction of the house and the type of fuel used for cooking. Social factors included church and Sunday school attendance and membership in self-help groups or organizations. An index of ‘‘modernity’’ included use of bank, telephone and/or post office, ownership of a National Social Security Fund card, credit from a cooperative, a bank account, household adoption of agricultural or other improvements or innovations and whether household members listened to radio/TV and/or read the newspaper at least once a week.
Data analysis
All forms were checked by the supervisors in the field to allow immediate revisits for gross errors or missing data. Forms were collected twice a week from the field offices and they were checked and cleaned. The forms then were entered by scanning using TELEform (Cardiff Software, Vista, CA) or they were entered manually in an Access database (Microsoft, Redmond, WA). The data then was printed and checked for errors against the forms and range-checked by computer. Mixed linear regression models, as implemented in the SAS PROC MIXED procedure (SAS version 8; SAS Institute, Cary, NC), were used to test the effect of supplementation on the anthropometric outcome variables. Because the unit of randomisation

CHAPTER 2
50
was not the individual child but the school, a nested factor (i.e., schools nested within supplementation groups) was used as the random factor, and supplementation (in the crude models) or supplementation and other covariates (in the adjusted models) were used as fixed factors. The slopes of each child’s regression of the anthropometric outcome variables on time were used as the dependent variables, reflecting their average change during the study period. The inverse of the squared errors of the slopes of the individual children were used as weights in the analysis. In this way, children with more stable estimates of the outcome variables and higher numbers of observations had more influence in regressions evaluating associations between the food supplements and growth. None of the variables required transformation for departure from normality or skewness. The effect of supplementation on the outcome variables first was examined in unadjusted models. Baseline variables that appeared to be different among the supplementation groups and that were associated with any of the anthropometric outcome variables were examined for their potential of being confounders. This was done by comparing the estimates of supplementation effect in the unadjusted model with the estimates in the model adjusted for the potential confounder. If the difference was > 10%, the variable was deemed to be a confounder and was included in the model of the respective outcome variable. To improve the precision of the estimated supplementation effects, covariates that were considered important determinants of growth (based on a conceptual model) were included in the models. These were sex, socio-eonomic status, baseline age, morbidity (classified as mild and severe illness), baseline energy intake from home diet (average of three 24-hours recalls) and the baseline value of the outcome variables for each model. For the height model, the mother’s height was included, and instead of baseline height, the baseline HAZ of the child was included. In the models of weight, MUAC, triceps and subscapular skinfolds, mid-upper-arm muscle area and mid-upper-arm fat area, baseline WHZ was included as a proxy for wasting. Because the height of the mother is an important determinant of children’s growth, it is probably an indicator of the genetic potential for growth, a shared environment, and the socio-eonomic status of the family. A backward elimination procedure was used for selection of covariates. Covariates with probability values < 0.05 were retained in the model. Confounders were kept in the model irrespective of their statistical significance. The models were used to compute least squares means, standard errors, and contrasts of the outcome variables. Subgroup analyses for sex, baseline age and socio-eonomic status for all outcome variables, and baseline HAZ for change in height and HAZ, were performed using the median as a cutoff. P values presented were based on two-tailed tests and those < 0.05 were regarded as statistically significant.
RESULTS
The trial profile is given in Figure 2.1. Of the 554 children randomised to the three food supplements and the control group, seven left before the feeding intervention started, fourteen were handicapped, thirty-three were siblings and two households were not cooperative, leaving data on 498 children for analysis. Data from children for whom the food supplement was

ANIMAL SOURCE FOODS AND GROWTH
51
changed because of food preferences (n 17) or change of school (n 25) only were included in the analysis for the time period when they ate the originally assigned food supplement. One child died during the study due to illness. Complete data for height (i.e., seven observation points) were available for 78% of the children, whereas 10.8% had five or six observation points, 3% had three or four data points and 8% had only one or two data points. For the other anthropometric variables, the maximum number of observation points was sixteen, which were available for 72% of the children. For 91% of the children > 50% of the complete data points was available. The amount of food supplement consumed, as a proportion of the total amount of food supplement provided, was similar for the supplementation groups: 82.1% for the meat supplement, 80.1% for the milk supplement (79.1% for the milk itself) and 80.4% for the energy supplement.
Figure 2.1 Trial profile.
Assessed for eligibility and randomised
n 554
Meat supplement n 133
Left school: n 3 Received allocated supplement: n 130
Allo
catio
n
Refused to participate: n 0
Refused to participate: n 1
Refused to participate: n 0
Refused to participate: n 1
Excluded Handicapped: n 1 Siblings: n 10 Analysed: n 119
Milk supplement n 144
Left school: n 1 Received allocated supplement: n 143
Energy supplement n 147
Left school: n 1 Received allocated supplement: n 146
Control group n 130
Left school: n 2 No supplement: n 128
Enro
llmen
tFo
llow
upAn
alys
is
Excluded Handicapped: n 0 Siblings: n 10 Analysed: n 132
Excluded Handicapped: n 1 Siblings: n 9 Analysed: n 117
Excluded Handicapped: n 12 Siblings: n 4 Analysed: n 130
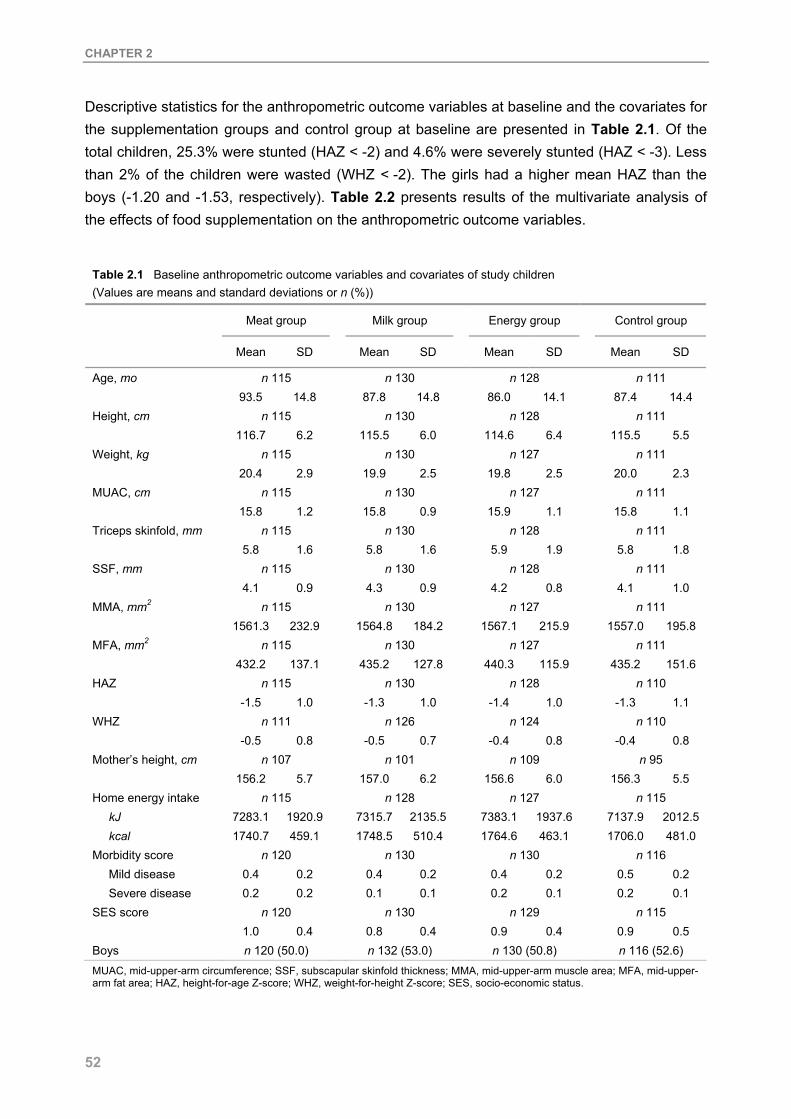
CHAPTER 2
52
Descriptive statistics for the anthropometric outcome variables at baseline and the covariates for the supplementation groups and control group at baseline are presented in Table 2.1. Of the total children, 25.3% were stunted (HAZ < -2) and 4.6% were severely stunted (HAZ < -3). Less than 2% of the children were wasted (WHZ < -2). The girls had a higher mean HAZ than the boys (-1.20 and -1.53, respectively). Table 2.2 presents results of the multivariate analysis of the effects of food supplementation on the anthropometric outcome variables.
Table 2.1 Baseline anthropometric outcome variables and covariates of study children
(Values are means and standard deviations or n (%))
Meat group Milk group Energy group Control group
Mean SD Mean SD Mean SD Mean SD
Age, mo n 115 n 130 n 128 n 111 93.5 14.8 87.8 14.8 86.0 14.1 87.4 14.4 Height, cm n 115 n 130 n 128 n 111 116.7 6.2 115.5 6.0 114.6 6.4 115.5 5.5 Weight, kg n 115 n 130 n 127 n 111 20.4 2.9 19.9 2.5 19.8 2.5 20.0 2.3 MUAC, cm n 115 n 130 n 127 n 111 15.8 1.2 15.8 0.9 15.9 1.1 15.8 1.1 Triceps skinfold, mm n 115 n 130 n 128 n 111 5.8 1.6 5.8 1.6 5.9 1.9 5.8 1.8 SSF, mm n 115 n 130 n 128 n 111 4.1 0.9 4.3 0.9 4.2 0.8 4.1 1.0 MMA, mm2 n 115 n 130 n 127 n 111 1561.3 232.9 1564.8 184.2 1567.1 215.9 1557.0 195.8 MFA, mm2 n 115 n 130 n 127 n 111 432.2 137.1 435.2 127.8 440.3 115.9 435.2 151.6 HAZ n 115 n 130 n 128 n 110 -1.5 1.0 -1.3 1.0 -1.4 1.0 -1.3 1.1 WHZ n 111 n 126 n 124 n 110 -0.5 0.8 -0.5 0.7 -0.4 0.8 -0.4 0.8 Mother’s height, cm n 107 n 101 n 109 n 95 156.2 5.7 157.0 6.2 156.6 6.0 156.3 5.5 Home energy intake n 115 n 128 n 127 n 115
kJ 7283.1 1920.9 7315.7 2135.5 7383.1 1937.6 7137.9 2012.5 kcal 1740.7 459.1 1748.5 510.4 1764.6 463.1 1706.0 481.0
Morbidity score n 120 n 130 n 130 n 116 Mild disease 0.4 0.2 0.4 0.2 0.4 0.2 0.5 0.2 Severe disease 0.2 0.2 0.1 0.1 0.2 0.1 0.2 0.1
SES score n 120 n 130 n 129 n 115 1.0 0.4 0.8 0.4 0.9 0.4 0.9 0.5 Boys n 120 (50.0) n 132 (53.0) n 130 (50.8) n 116 (52.6) MUAC, mid-upper-arm circumference; SSF, subscapular skinfold thickness; MMA, mid-upper-arm muscle area; MFA, mid-upper-arm fat area; HAZ, height-for-age Z-score; WHZ, weight-for-height Z-score; SES, socio-economic status.

ANIMAL SOURCE FOODS AND GROWTH
53
Table 2.2 Changes in anthropometric variables over 23 months # (Values are least squares means and standard errors)
Meat group (n 120)
Milk group
(n 132)
Energy group (n 130)
Control group
(n 116)
Mean SE Mean SE Mean SE Mean SE p ‡
Weight, kg Unadjusted 3.75 0.12 3.78 0.12 3.94 0.13 3.47 0.13 0.151 Adjusted 3.89 0.09 3.86 0.08 3.89 0.09 3.49 0.09 0.036 § Height, cm Unadjusted 9.67 0.33 10.31 0.33 10.30 0.35 10.04 0.34 0.542 Adjusted 9.87 0.31 10.29 0.31 10.29 0.33 9.95 0.31 0.701 WHZ Unadjusted -0.07 0.16 -0.40 0.16 -0.17 0.16 -0.27 0.16 0.526 Adjusted -0.14 0.11 -0.29 0.11 -0.16 0.11 -0.28 0.11 0.681 HAZ Unadjusted -0.03 0.05 -0.01 0.05 -0.02 0.05 -0.02 0.05 1.0 Adjusted -0.03 0.05 0.002 0.05 0.01 0.05 -0.02 0.05 0.923 MUAC, cm Unadjusted 0.71 0.05 0.55 0.05 0.63 0.05 0.40 0.06 0.019 Adjusted 0.71 0.06 0.57 0.06 0.65 0.06 0.38 0.07 0.034║ TSF, mm Unadjusted -0.09 0.11 -0.18 0.11 0.09 0.12 0.02 0.11 0.374 Adjusted -0.16 0.13 -0.26 0.12 0.09 0.14 -0.01 0.13 0.294 SSF, mm Unadjusted -0.34 0.16 -0.46 0.16 -0.48 0.16 -0.33 0.16 0.868 Adjusted -0.47 0.13 -0.51 0.13 -0.59 0.13 -0.47 0.13 0.908 MMA, mm2 Unadjusted 154.22 10.32 116.37 10.29 116.65 10.64 86.00 10.35 0.011 Adjusted 152.91 10.10 117.98 9.96 115.53 10.4 84.64 10.1 0.010 ¶ MFA, mm2 Unadjusted 10.58 9.30 -0.99 8.60 18.46 9.58 10.89 9.32 0.529 Adjusted 7.92 10.7 -4.4 10.0 21.49 11.0 10.71 10.7 0.415
WHZ, weight-for-height Z-score; HAZ, height-for-age Z-score; MUAC, mid-upper-arm circumference; TSF, triceps skinfold thickness; SSF, subscapular skinfold thickness; MMA, mid-upper-arm muscle area; MFA, mid-upper-arm fat area. # Results are of the mixed linear regression models. All estimates are adjusted for baseline age, sex, and socio-economic status. In addition, the models of weight, WHZ, HAZ, TSF, SSF and MFA are adjusted for their baseline values; the model of height for baseline HAZ; the models of WHZ and SSF for morbidity score (mild disease). ‡ P value (two-sided) for supplementation effect. § Difference meat-control: p = 0.013; milk-control: p = 0.019; energy-control: p = 0.014. ║Difference meat-control: p = 0.034; milk-control: p = 0.059; energy-control: p = 0.017. ¶ Difference meat-milk: p = 0.040; meat-energy: p = 0.034; meat-control: p = 0.002; milk-control: p = 0.046; energy-control: p = 0.065.
The estimates of the adjusted models are controlled for the identified confounders and covariates. For weight gain, there was a statistically significant supplementation effect for the duration of the study. Children in each of the supplementation groups gained ~10% more weight than the children in the control group. This supplementation effect was greater in the boys, in the younger children, and in the children with lower socio-economic status (results not shown).

CHAPTER 2
54
The average WHZ decreased for all groups, but the decrease in the meat and the energy groups was ~50% less than that in the milk and control groups. The boys receiving the meat supplement had a decrease in WHZ that was 0.36 (~120%) less than in those who received the milk supplement (p = 0.05), 0.24 (~80%) less than those with the energy supplement (p = 0.18) and 0.39 (~130%) less than those in the control group (p = 0.04). For the girls, no distinct differences in WHZ among the groups were seen (results not shown). For height gain, children in the milk and energy groups gained negligibly more height than those in the meat and control groups.
As shown in Figure 2.2, for children with a higher baseline HAZ (above the median of -1.4), no distinct differences among any of the groups could be seen, but for children with a baseline HAZ below the median, the milk-supplemented children gained 1.3 cm (15%) more height than the children in the control group (p = 0.05) and 1 cm (11%) more height than those in the meat group (p = 0.09). For change in HAZ, no pronounced supplementation effects were seen. For gain in MUAC, compared to control children, those who received the meat supplement gained ~90% more, the children who received the milk supplement gained ~50% more and those who received the energy supplement gained ~70% more in mid-upper-arm circumference (differences were significant for the meat and energy groups). The differences between the supplementation groups and the control group were greater in the boys and in the children with lower socio-economic status (results not shown). Children in the meat group gained ~80% more mid-upper-arm muscle area than those in the control group and ~30% more than those in the milk and energy groups. Children in the milk and energy groups gained ~40% more mid-upper-arm muscle area than those in the control group. No statistically significant differences were found for any of the variables measuring body fat, but children in the energy and control groups tended to have greater average increments in triceps skinfold thickness and mid-upper-arm fat area than children in the meat and milk groups.
DISCUSSION
The above study, we believe, is the first controlled intervention to investigate the effect of supplementation with meat or milk, comparing it to an isoenergetic food supplement and a control group without a supplement. Children provided with a daily school-based food supplement consisting of a local maize and bean dish, irrespective of what other ingredients were added, gained more weight and MUAC than children who did not receive a supplement. The addition of meat had a beneficial effect on gain in lean body mass. Generally, the nutritional status of the children did not improve as much as expected or it worsened over the study period, as indicated by the decreasing WHZ and stagnating HAZ. This could be attributed to the lack of rainfall and two periods of severe food shortage during the study period and/or to the reduction of the usual diet at home because of the food supplementation at school.
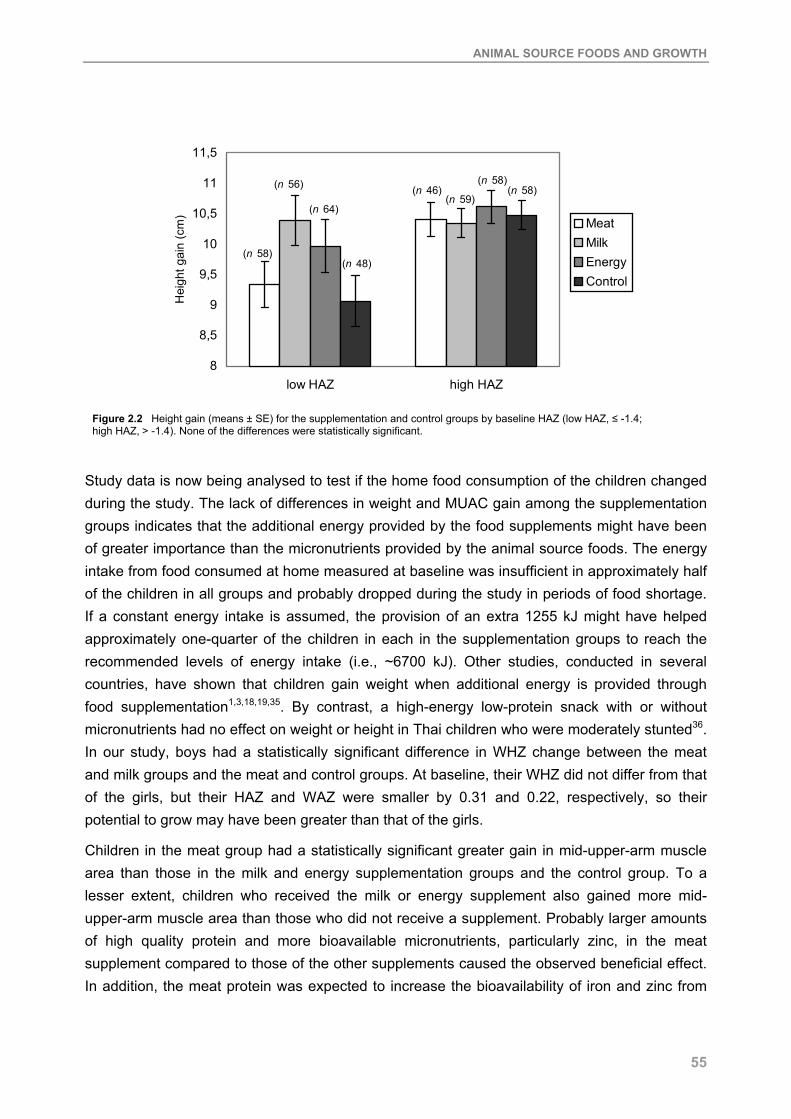
ANIMAL SOURCE FOODS AND GROWTH
55
8
8,5
9
9,5
10
10,5
11
11,5
low HAZ high HAZ
Hei
ght g
ain
(cm
) MeatMilkEnergyControl
(n 58)
(n 56)
(n 64)
(n 48)
(n 46)(n 59)
(n 58)(n 58)
Figure 2.2 Height gain (means ± SE) for the supplementation and control groups by baseline HAZ (low HAZ, ≤ -1.4; high HAZ, > -1.4). None of the differences were statistically significant.
Study data is now being analysed to test if the home food consumption of the children changed during the study. The lack of differences in weight and MUAC gain among the supplementation groups indicates that the additional energy provided by the food supplements might have been of greater importance than the micronutrients provided by the animal source foods. The energy intake from food consumed at home measured at baseline was insufficient in approximately half of the children in all groups and probably dropped during the study in periods of food shortage. If a constant energy intake is assumed, the provision of an extra 1255 kJ might have helped approximately one-quarter of the children in each in the supplementation groups to reach the recommended levels of energy intake (i.e., ~6700 kJ). Other studies, conducted in several countries, have shown that children gain weight when additional energy is provided through food supplementation1,3,18,19,35. By contrast, a high-energy low-protein snack with or without micronutrients had no effect on weight or height in Thai children who were moderately stunted36. In our study, boys had a statistically significant difference in WHZ change between the meat and milk groups and the meat and control groups. At baseline, their WHZ did not differ from that of the girls, but their HAZ and WAZ were smaller by 0.31 and 0.22, respectively, so their potential to grow may have been greater than that of the girls.
Children in the meat group had a statistically significant greater gain in mid-upper-arm muscle area than those in the milk and energy supplementation groups and the control group. To a lesser extent, children who received the milk or energy supplement also gained more mid-upper-arm muscle area than those who did not receive a supplement. Probably larger amounts of high quality protein and more bioavailable micronutrients, particularly zinc, in the meat supplement compared to those of the other supplements caused the observed beneficial effect. In addition, the meat protein was expected to increase the bioavailability of iron and zinc from
CHAPTER 2
56
the plant foods contained in the supplements (i.e., maize, beans and green leaves). Zinc is known to promote protein synthesis and consequently muscle protein. The increase in muscle mass might have led to the observed increased physical activity, which was significantly greater in the meat-supplemented children (C. G. Neumann, personal communication). On the other hand, the increased activity seen in the children receiving the meat supplement might have promoted an increase in muscle mass. Mid-upper-arm fat area increased most in the children receiving the energy supplement and decreased slightly in the children receiving the milk supplement, but changes over time were < 5% and differences between supplementation groups were small. The subcutaneous fat on the trunk (estimated by subscapular skinfold) decreased similarly in all groups over the study period. These findings indicate that the additional energy from the food supplements was not used to increase body fat. Other food supplementation studies showed an overall growth response with increases in mid-upper-arm circumference and triceps skinfold23, but no increase22 or a decrease in skinfold thickness37. In New Guinea school children who consumed a protein-deficient diet, supplementation with energy increased skinfold thickness but not height, whereas supplementation with protein and energy increased height but not skinfold thickness18.
Contrary to our expectations, we did not find an overall effect of supplementation on height gain. Only the subgroup of children who were more stunted (HAZ ≤ -1.4) seemed to benefit from the milk supplement and gained more height than those in the other supplementation groups, particularly compared with those in the meat and control groups. It is known that diets containing animal source foods are beneficial for growth14,16,38-41. Children who are raised on strict vegan diets do not grow normally15,42. Intake of milk and dairy products in the study population generally is small and the calcium intake of school children in the study is low28. Baseline food intake data in the present study indicates that 99% of the children have calcium intake below the recommended daily level of 800 mg, so the additional intake of ~300 mg of calcium through the milk supplement may have had a positive effect on linear growth. On the other hand, the milk calcium might have reduced the absorption of iron43 and zinc44 from the supplement. The protein intake of our study children (home diet at baseline plus supplement) was at least three times the recommended amount; therefore, it is unlikely that protein was the limiting factor for growth. It could be that the high prevalence of micronutrient deficiencies in the study population45 prevented the efficient use of the energy provided by the supplement46. The micronutrients provided by the supplements might not have been sufficient to promote linear growth because of the initial poor status of these nutrients. Because the proportion of wasted children in the study was low, it was not anticipated that an increase in weight would happen first, before linear growth could respond. It might be that the energy provided was sufficient to promote a gain in weight but not in height.
We are not aware of other studies’ supplements in which meat has been fed to children, but trials have been conducted to evaluate the effect of milk supplements on growth. For example, in the United Kingdom, where 1 pint (570 mL) of school milk was provided daily to boys aged 6-11 years, their height increased by 2 cm in 1 year more than in a control group17. Another

ANIMAL SOURCE FOODS AND GROWTH
57
study of socially disadvantaged school children in the United Kingdom showed a positive, significant effect of providing 190 mL of milk on weight and height gain20. The age group, sample size, amount of milk given, and duration of the latter study were very similar to those in our study. Two studies on the effect of skim milk powder on growth in school children in New Guinea showed increased growth in weight and height18,19. The Institute of Nutrition of Central America and Panama food supplementation trial in Guatemala found that child growth was promoted through a supplement providing extra energy and that there were no additional benefits on growth of a supplement that had milk powder added37. This was probably due to nutrients other than protein and energy being inadequate in the milk supplement47. It could be that the 2-year intervention was too short to produce detectable differences in height gain between the different supplement groups and the control group, although other food supplement interventions in children of this age group have lasted for only 10 or 13 weeks18 up to 21.5 months20 and produced an improvement in height. The results suggest that children with higher nutrient need, such as boys, and younger and moderately stunted children benefited more from the food supplements. This is expected because they have a greater potential for growth. Children from households with lower socio-economic status also benefited more from the supplements, probably because their nutrient intake and other factors relating to growth are inadequate.
One strength of our study is the attempt to measure other factors that might have influenced the growth outcomes. These were considered in the multivariate analyses and helped to explain the impact of the supplementation on the outcome variables. The statistical analyses took into account the fact that the study had a nested design, i.e., the food supplement was randomised by school and not by child. Embu District was an appropriate area to test the effects of animal source foods because the habitual diet contains no or very little meat and dairy products and is low in fat and largely cereal- or tuber-based. All analyses were controlled for morbidity; therefore, it is unlikely to have confounded the results to any large degree. We tried to keep the study children and their families, teachers, field workers and everybody else involved in the study unaware of the different types of food supplements, but it is possible that some of them found out. This could not be avoided in the setup of the study within the communities. Although there could have been some bias in favour of the meat and milk supplementation groups because these foods are culturally perceived as nutritious foods, this is not very likely and anthropometric measurements are not subjective. In conclusion, the results show clearly that the weight and mid-upper-arm circumference of children can be improved through the daily provision of a food supplement containing local foods and that enrichment with meat can increase lean body mass.

CHAPTER 2
58
REFERENCES 1. Gopalan C, Swaminathan MC, Kumari VKK, Rao DH & Vijayaraghavan K (1973) Effect of calorie
supplementation on growth of undernourished children. Am J Clin Nutr 26: 563-6. 2. Lutter CK, Mora JO, Habicht J-P, Rasmussen KM, Robson DS & Herrera MG (1990) Age-specific
responsiveness of weight and length to nutritional supplementation. Am J Clin Nutr 51: 359-64. 3. Husaini MA, Karyadi L, Husaini YK, Sandjaja, Karyadi D & Pollitt E (1991) Developmental effects of short-term
supplementary feeding in nutritionally-at-risk Indonesian infants. Am J Clin Nutr 54: 799-804. 4. Schroeder DG, Martorell R, Rivera JA, Ruel MT & Habicht J-P (1995) Age differences in the impact of
nutritional supplementation on growth. J Nutr 125: 1051S-9S. 5. Umeta M, West CE, Haidar J, Deurenberg P & Hautvast JGAJ (2000) Zinc supplementation and stunted infants
in Ethiopia: a randomised controlled trial. Lancet 355: 2021-6. 6. Brown KH, Peerson JM & Allen LH (1998) Effect of zinc supplementation on children's growth: a meta-analysis
of intervention trials. Bibl Nutr Dieta 54: 76-83. 7. Judisch JM, Naiman JL & Oski FA (1966) The fallacy of the fat iron-deficient child. Pediatrics 37: 987-90. 8. Aukett MA, Parks YA, Scott PH & Wharton BA (1986) Treatment with iron increases weight gain and
psychomotor development. Arch Dis Child 61: 849-57. 9. Soewondo S, Husaini M & Pollitt E (1989) Effects of iron deficiency on attention and learning processes in
preschool children: Bandung, Indonesia. Am J Clin Nutr 50: 667-74. 10. Briend A, Hoque BA & Aziz KMA (1990) Iron in tube well water and linear growth in rural Bangladesh. Arch Dis
Child 65: 224-5. 11. Angeles IT, Schultink WJ, Matulessi P, Gross R & Sastroamidjojo S (1993) Decreased rate of stunting among
anemic Indonesian preschool children through iron supplementation. Am J Clin Nutr (58): 339-42. 12. Lawless JW, Latham MC, Stephenson LS, Kinoti SN & Pertet AM (1994) Iron supplementation improves
appetite and growth in anemic Kenyan primary school children. J Nutr 124 (5): 645-54. 13. Higgs J & Pratt J (1998) Meat, poultry and meat products. In Encyclopedia of human nutrition, pp. 1275 [Sadler
MJ, Strain JJ and Caballero B, editors]. San Diego and London: Academic Press. 14. Paik HY, Hwang SH & Lee SP (1992) Comparative analysis of growth, diet, and urinary N excretion in
elementary school children from urban and rural areas of Korea. Int J Vitam Nutr Res 62: 83-90. 15. Dagnelie PC, van Dusseldorp M, van Staveren WA & Hautvast JGAJ (1994) Effects of macrobiotic diets on
linear growth in infants and children until 10 years of age. Eur J Clin Nutr 48: 103S-12S. 16. Marquis GS, Habicht JP, Lanata CF, Black RE & Rasmussen KM (1997) Breast milk or animal-product foods
improve linear growth of Peruvian toddlers consuming marginal diets. Am J Clin Nutr 66 (5): 1102-9. 17. Correy-Mann HC (1926) Diets for boys during school age. Medical Research Council Special Report Series No.
105. London: HMSO. 18. Malcolm LA (1970) Growth retardation in a New Guinea boarding school and its response to supplementary
feeding. Br J Nutr 24: 297-305. 19. Lampl M, Johnston FE & Malcolm LA (1987) The effects of protein supplementation on the growth and skeletal
maturation of New Guinean school children. Ann Hum Biol 5: 219-27. 20. Baker IA, Elwood PC, Hughes J, Jones M, Moore F & Sweetnam PM (1980) A randomized controlled trial of the
effect of the provision of free school milk on the growth of children. J Epidemiol Community Health 34: 31-4. 21. Heikens GT, Schofield WN, Dawson S & Grantham-McGregor S (1989) The Kingston Project. I. Growth of
malnourished children during rehabilitation in the community, given a high energy supplement. Eur J Clin Nutr 43: 145-60.
22. Super C, Herrera M & Mora M (1990) Long-term effects of food supplementation and psychosocial intervention on the physical growth of Colombian infants at risk of malnutrition. Child Development 61: 29-49.
23. Walker SP, Powell CA, Grantham-McGregor SM, Himes JH & Chang SM (1991) Nutritional supplementation, psychosocial stimulation, and growth of stunted children: the Jamaican study. Am J Clin Nutr 54 (4): 642-8.
24. Cook J & Monsen E (1976) Food iron absorption in human subjects. 3 Comparison of the effect of animal proteins on nonheme iron absorption. Am J Clin Nutr 29: 859-67.
25. Lynch S, Hurrell R, Dassenko S & Cook J (1989) The effect of dietary proteins on iron bioavailability in man. Adv Exp Med Biol 248: 117-32.
26. Sandström B, Almgren A, Kivistö B & Cederblad A (1989) Effect of protein level and protein source on zinc absorption in humans. J Nutr 119: 48-53.
27. Calloway DH, Murphy S, Balderston J, Receveur O, Lein D & Hudes M (1992) Village nutrition in Egypt, Kenya, and Mexico: looking across the CRSP projects. Washington DC: Final report to the US Agency for International Development.
28. Murphy SP, Calloway DH & Beaton GH (1995) Schoolchildren have similar predicted prevalences of inadequate intakes as toddlers in village populations in Egypt, Kenya, and Mexico. Eur J Clin Nutr 49: 647-57.
ANIMAL SOURCE FOODS AND GROWTH
59
29. Lohman T, Roche A & Martorell R (1988) Anthropometric standardization reference manual. Champaign, Illinois: Human Kinetics Books.
30. WHO (1995) Physical status: the use and interpretation of anthropometry. Report of a WHO Expert Committee. World Health Organ Tech Rep Ser 854: 1-452.
31. Gibson R (1990) Principles of nutritional assessment. New York: Oxford University Press. 32. Frisancho AR (1981) New norms of upper limb fat and muscle areas for assessment of nutritional status. Am J
Clin Nutr 34: 2540-5. 33. Dibley MJ, Goldsby JB, Staehling NW & Trowbridge FL (1987) Development of normalized curves for the
international growth reference: historical and technical considerations. Am J Clin Nutr 46: 736-48. 34. Calloway DH, Murphy SP, Bunch S & Woerner J (1994) WorldFood Dietary Assessment System User's Guides.
Berkeley: The University of California. 35. Fomon SJ, Filer LJ, Thomas LN, Anderson TA & Nelson SE (1975) Influence of formula concentration on
caloric intake and growth of normal infants. Acta Paediatr Scan 64: 172-81. 36. Gershoff SN, McGandy RB, Nondasuta A & Tantiwongse P (1988) Nutrition studies in Thailand: effects of
calories, nutrient supplements, and health interventions on growth of preschool Thai village children. Am J Clin Nutr 48: 1214-8.
37. Martorell R, Klein R & Delgado H (1980) Improved nutrition and its effect on anthropometric indicators of nutritional status. Nutr Rep Int 21: 219-30.
38. Smit Vanderkooy PD & Gibson RS (1987) Food consumption patterns of Canadian preschool children in relation to zinc and growth status. Am J Clin Nutr 45: 609-16.
39. Allen LH, Backstrand JR, Chávez A & Pelto GH (1992) People cannot live by tortillas alone. The results of the Mexico Nutrition CRSP. Washington, DC: Final report to the US Agency for International Development.
40. Neumann CG & Harrison GG (1994) Onset and evolution of stunting in infants and children. Examples from the Human Nutrition Collaborative Research Support Program. Kenya and Egypt studies. Eur J Clin Nutr 48: 90S-102S.
41. Nathan I, Hackett AF & Kirby S (1997) A longitudinal study of the growth of matched pairs of vegetarian and omnivorous children, aged 7-11 years, in the north-west of England. Eur J Clin Nutr 51: 20-5.
42. van Staveren WA, Dhuyvetter JHM, Bons A, Zeelen M & Hautvast JGAJ (1985) Food consumption and height/weight status of Dutch pre-school children on alternative diets. J Am Diet Assoc 85: 1579-84.
43. Hallberg L, Brune M, Erlandsson M, Sandberg AS & Rossander-Hulthén L (1991) Calcium: effect of different amounts on nonheme- and heme-iron absorption in man. Am J Clin Nutr 53: 112-9.
44. Gibson R (1994) Zinc nutrition in developing countries. Nutr Res Rev 7: 151-73. 45. Siekmann JH, Allen LH, Bwibo NO, Demment MW, Murphy SP & Neumann CG (2003) Kenyan school children
have multiple micronutrient deficiencies, but increased plasma vitamin B-12 is the only detectable micronutrient response to meat or milk supplementation. J Nutr 133 (11): 3972S-80S.
46. Prentice AM & Paul AA (2000) Fat and energy needs of children in developing countries. Am J Clin Nutr 72 (5): 1253S-65S.
47. Allen LH, Backstrand JR, Stanek EJI, et al. (1992) The interactive effects of dietary quality on the growth of young Mexican children. Am J Clin Nutr 56: 353-64.

33
Intake of micronutrients high in animal source foods is associated with better growth in rural
Kenyan school children
Monika Grillenberger, Charlotte G. Neumann, Suzanne P. Murphy, Nimrod O. Bwibo, Robert E. Weiss, Joseph G.A.J. Hautvast, Clive E. West
British Journal of Nutrition 2006; 95: 379-90
CHAPTER 3
62
ABSTRACT
Observational studies have shown that children in developing countries consuming diets containing high amounts of bioavailable nutrients, such as those found in animal source foods, grow better. The present study investigated which specific nutrients from the diet of Kenyan school children predicted their growth. The children (n 544, median age 7 years) participated in a 2-year long food supplementation study with animal source foods. Height gain during the intervention period was positively predicted by average daily intakes of energy from animal source foods, haem iron, preformed vitamin A, calcium and vitamin B12. Weight gain was positively predicted by average daily intakes of energy from animal source foods, haem iron, preformed vitamin A, calcium and vitamin B12. Gain in mid-upper-arm muscle area was positively predicted by average daily intakes of energy from animal source foods and vitamin B12. Gain in mid-upper-arm fat area was positively predicted by average daily intakes of energy from animal source foods. Gain in subscapular skinfold thickness was not predicted by any of the nutrient intakes. Negative predictors of growth were total energy and nutrients that are contained in high amounts in plant foods. The study shows that growth was positively predicted by energy and nutrients that are provided in high amounts and in a bioavailable form in meat and milk, and their inclusion into the diets of children in developing countries should be part of all food-based programmes in order to improve micronutrient status and growth.

PREDICTORS OF GROWTH
63
INTRODUCTION
Growth retardation is still one of the major constraints to full development among children in developing countries and is associated with an increased risk of morbidity and mortality, delayed motor and mental development, and reduced physical capacity1. In Kenya, about one-third of children are stunted and 6% are wasted2. Nutrition and health in the first 2 to 3 years of life can affect the growth and development of children, and most growth faltering occurs during this time. However, the growth of older children is also important for their normal development and some studies have shown that catch-up growth is possible in school-aged children and even in adolescents if factors contributing to impaired growth are eliminated3-6. Multiple micronutrient deficiencies – particularly of iron, iodine, zinc and vitamin A – are a widespread public health problem in Kenya2. Studies in Embu District in the 1980s showed the intake of animal source foods to be low, with only 1% of the energy intakes of school children coming from milk and less than 1% from meat7. Intakes of iron, zinc, calcium and vitamins B12 and E were low in toddlers and school children8. Intakes of energy, macronutrients and micronutrients determine in part how well individuals approach their genetic potential for growth9. Deficiencies of energy and protein have long been known to impair linear growth10,11. Micronutrient deficiencies that can impair growth are those of zinc12, iron13-15, vitamin A16-18, calcium and phosphorus19-21, copper22, iodine, magnesium, potassium and manganese23. Results of studies providing micronutrient supplements in order to improve growth have been inconclusive and the paucity of studies providing micronutrients through food supplements makes an evaluation of their effect on growth difficult. However, some observational studies have shown that the consumption of animal source foods is associated with improved nutritional status and growth among children9,24-28. We carried out a 2-year-long controlled feeding intervention trial to assess growth, morbidity and cognitive outcomes by supplementing rural Kenyan school children with animal source foods, i.e., meat and milk29. Specific effects of the food supplementation on growth, cognition and micronutrient status are reported elsewhere30-32. Home food intake changed differently for the four supplementation groups during the intervention period33, which makes interpretation of the effects of the food supplements on growth more complex. To determine which specific nutrients in the diet from all sources, i.e., home intake and food supplement, predicted interindividual variation in growth of the children, we examined the relation between the intakes of energy and nutrients with growth. Particular attention was paid to those nutrients known to be associated with growth.
MATERIALS AND METHODS
Study design
The study was conducted in Kyeni South Division of Embu District in Eastern Province, Kenya. The study area is rural, with farming as the primary occupation. Staple crops, cultivated in subsistence farming, are maize and beans. Cash crops, which are produced in the area on a

CHAPTER 3
64
small scale, include coffee, cotton and tobacco. All children (n 554) enrolled in class 1 (median age 7.1 years) from twelve selected primary schools participated in the study. The schools were randomised to one of four feeding groups: 1) Control: no food supplement provided; 2) Energy supplement: a food supplement based on a local dish of maize, beans and vegetables (githeri); 3) Milk supplement: githeri plus a glass of milk (200 mL); and 4) Meat supplement: githeri with 60 g minced beef. The food supplements were approximately isoenergetic and contained an estimated energy content of 250 kcal (~1050 kJ) per serving during the first school term of the intervention (from September to November 1998). The energy content of all three food supplements was then increased to 300 kcal (~1255 kJ) per serving, by increasing the portion size of the energy supplement (from 185 to 230 g per child), the milk content of the milk supplement (to 250 mL) and the beef content of the meat supplement (to 85 g). The intervention period was 24 months, starting in August 1998 and ending in July 2000. Schools were in session for 3 months, followed by a 1-month holiday. The food supplements were provided during the six school terms on all school days, but not on weekends or school holidays. Details of the study design have been published elsewhere29. Ethical approval for the research study was obtained from the Human Subject Protection Committee of the University of California, Los Angeles; the Ethics Committee of the University of Nairobi, School of Medicine, Kenya; and the Office of the President, Government of Kenya. All local and district authorities were involved in the implementation of the study, and the community was informed extensively about the aim and procedures of the intervention. Informed verbal consent of the parents of the study children was obtained before the study. After completion of the study, the households in the control group were each given a local milk goat. This was chosen by the parents through representative committees as compensation for the food their children missed during the course of the study.
Data collection
Twelve local women, who had worked as enumerators in the Nutrition Collaborative Research Support Program on Food Intake and Human Function (NCRSP) in the same location in 1984, were retrained to perform the anthropometric data collection. A supervisor monitored the interviews/measurements, checked the forms, and maintained and calibrated the equipment. The area of the twelve schools was divided into three clusters to facilitate data collection and supervision. The enumerators were rotated between clusters and schools to prevent bias. The methods used were based on the NCRSP study. The ages of the children were derived from the census questionnaires or from the school register.
Anthropometry
Weight, mid-upper-arm circumference, triceps skinfold thickness and subscapular skinfold thickness were measured every month in the first year and every other month in the second year. Height was measured every 4 months in the first year and every 8 months in the second year. In total, 24 months of anthropometric measurements were taken, whereby the measurements of the month preceding the intervention period served as baseline

PREDICTORS OF GROWTH
65
measurements. Measurements of triceps skinfold thickness and mid-upper-arm circumference were used to derive estimates of mid-upper-arm muscle area and mid-upper-arm fat area34, indicators of body muscle and subcutaneous fat mass35. Subscapular skinfold thickness was used as an estimate of subcutaneous fat mass on the trunk. Details of the anthropometric measurements have been described earlier30. The height of the mother was measured to the nearest 0.1 cm once during the study with a light portable wooden device with a footplate, a measuring tape and a headboard.
Food intake
A 24-hours recall method reported by the child’s mother was used to estimate the average daily home intake of energy, nutrients, dietary fibre and phytate for each study child. All days of the week apart from Fridays and Saturdays (because no food intake data were collected on Saturdays and Sundays) were proportionately included in the survey to account for any day-of-the-week effects on food and/or nutrient intakes. Food models and local plastic dishes and utensils were used to estimate the portion sizes. The method of the food intake data collection has been described earlier33. Mothers were encouraged to maintain the usual home diet for the children in the study. For the baseline nutrient intake, an average of three home food intake measurements preceding the intervention period was used. Nutrient intake during the intervention period contained an average of nineteen food intake measurements at home to which the actual amount of energy and nutrients from the food supplement consumed on the respective day by the individual child was added. Four of the nineteen measurements were carried out during school holidays where no food supplements were provided and therefore contained only the home food intake.
In the data analyses, we used intakes of nutrients that have been shown in other studies to be related to growth (energy, protein, zinc, iron, vitamin A, copper, calcium, phosphorus, magnesium, potassium, manganese) and intakes of energy and nutrients that are contained in high amounts in animal source foods (energy from animal source foods, preformed vitamin A, vitamin B12, haem iron and riboflavin). We included intakes of available iron and zinc in the data analyses instead of total iron and zinc. The amount of available iron in the diet of the children was predicted using the algorithm of Hallberg and Hulthén36, which considers enhancing and inhibiting effects of a number of dietary factors on haem and non-haem iron absorption if present in the same meal and the iron status of the children. Haem iron in the diet was calculated as 40% of the meat/fish/poultry iron, with the remainder being non-haem iron. Calculations of zinc bioavailability assumed basal requirements (i.e., negligible stores but no functional impairment) and considered phytate as an inhibiting dietary component of zinc absorption. A zinc absorption of 35% was assumed for phytate:zinc molar ratios of 5-15, a zinc absorption of 15% for phytate:zinc molar ratios of 15-30 and a zinc absorption of 10% for phytate:zinc molar ratios > 30. Dietary fibre and phytate, which are contained in large amounts in cereals and legumes, were included in the analyses as a proxy for a diet high in plant foods with a low bioavailability of minerals.

CHAPTER 3
66
Socio-economic status of the family
A composite score for the socio-economic status (SES) of each family was derived from economic and social variables of the household which were collected at baseline by interview. It included land ownership and area cultivated, number and type of livestock owned, source and amount of income, income from food products, type and income from cash crops, expenditures, household possessions, the construction of the house and the type of fuel used for cooking. Social factors included church and Sunday school attendance, membership in self-help groups or organizations. An index of ‘modernity’ included use of bank, telephone and/or post office, ownership of National Social Security Fund card, credit from cooperative, a bank account, household adoption of agricultural or other improvements or innovations, and whether household members listened to radio/television and/or read the newspaper at least once a week. Variables were weighted and answers were assigned points respectively, such as that e.g., for the variable land ownership, a household could get up to 9 points (no land, 0 points; < 2 acres, 2 points; 2-4.9 acres, 4 points; 5-7.9 acres, 6 points; 8-11 acres, 8 points; > 11 acres, 9 points). These points were added up to a total socio-eonomic status score, whereby a higher score represents a higher level of socio-eonomic status.
Data analysis
All forms were checked by the supervisors in the field to allow immediate revisits for gross errors or missing data. Forms were collected twice a week from the field offices and they were checked and cleaned. The forms were then entered by scanning using TELEform (Cardiff Software, Vista, CA, USA) or they were entered manually in an Access database (Microsoft, Redmond, WA, USA). The data then were printed and checked for errors against the forms and range-checked by computer. Longitudinal data models were fit with the SAS mixed procedure (SAS Version 8; SAS Institute, Cary, NC, USA). It was assumed that each subject’s data followed a subject-specific line over time with a subject-specific random intercept and random slope. For covariates, sex, baseline age and socio-eonomic status were considered. Additionally, time squared and interactions of socio-economic status (SES) with time and sex with time were included. Models were adjusted for treatment, i.e., food supplements provided, by including treatment and treatment by time interaction. For each nutrient considered, we included nutrient intake and the nutrient intake by time interaction in the model. Nutrient intake was adjusted for total energy intake in order to evaluate dietary quality and not only dietary quantity. Fixed and random components entered the mixed linear regression models as variables with corresponding parameters in the form:
Yij = b0 + b1 x timeij x timeij + b2 x agei + b3 x sexi + b4 x sexi x timeij + b5 x SESi + b6 x SESi x timeij + b7 x nutrient intakei + b8 x nutrient intakei x timeij+ b9 x energyi + b10 x energyi x timeij + b11 x treatmenti + b12 x treatmenti x timeij + u0i + u1i x timeij + eij,
where i = 1,..., n; j = 1,..., ni (total number of visits for the ith kid); Y is the anthropometric response variable, b0 is the overall intercept (fixed effect); u0i is the random intercept; u1i is the

PREDICTORS OF GROWTH
67
random slope; eij is the random noise. School effect was tested by comparing the above-described models including and excluding a school variable. Models were tested with and without the inclusion of mother’s height, but due to a high number of missing values, it was not included in final models in order to avoid reduced sample size and power. Of the explaining variables, sex was coded as dummy (0/1); the other variables were entered as continuous variables. Models were fit for baseline nutrient intakes as predictors and baseline and intervention period anthropometric variables as responses, and for intervention period nutrient intakes as predictors and intervention period anthropometric variables as responses. A positive coefficient of the intervention period nutrient intake by time interaction indicates that higher levels of nutrient intake lead to increased growth rates over time. The slope estimates for a child at the 10th and 90th percentile daily intake levels over a period of 12 months were used to calculate effect sizes: Effect size (90th percentile daily intake v. 10th percentile intake) of nutrient X over 12 months = slope estimate (nutrient intake x time) x 90th percentile daily intake of nutrient X x 30 days x 12 - slope estimate (nutrient intake x time) x 10th percentile daily intake of nutrient X x 30 days x 12. Differences were reported along with the significance level of the nutrient intake by time interaction. Differences in growth for the different nutrient intakes between boys and girls and stunted (baseline height-for-age Z-score < -2) and non-stunted (baseline height-for-age Z-score ≥ -2) children were checked by including an interaction term of nutrient intake by time by sex and an interaction of nutrient intake by time by stunting (0/1 coded) in the models.
RESULTS
Of the 554 children eligible for the study, anthropometric data could not be collected for children who left before the feeding intervention started (n 7), were handicapped (n 14), were siblings (n 33) and for households that were not cooperative (n 2), leaving 498 children for data analysis (257 boys; 241 girls). Complete data for height (seven measurements) were available for 84% and for weight, skinfold thicknesses and mid-upper-arm circumference (16 measurements) for 76% of the children. Means and standard deviations of baseline age, socio-economic status and anthropometric variables and growth during the intervention period are presented in Table 3.1 overall and by sex. At baseline, boys in the study were significantly older, weighed more and were taller than girls, but had a higher prevalence of stunting and severe stunting at baseline. Boys had a higher mid-upper-arm muscle area and lower subscapular skinfold thickness and mid-upper-arm fat area than girls. During the intervention period, girls gained more height and mid-upper-arm fat area than boys, but only boys improved their height-for-age Z-score. At the end of the intervention period, twelve (2.8%) children who were non-stunted at baseline were stunted, six (1.4%) children became severely stunted, one child who was severely stunted became stunted and nineteen children (4.4%) became non-stunted. Two (0.5%) children became non-wasted, whereas eleven (2.8%) children became wasted. Values for the socio-eonomic status score ranged from 20 to 248 with a median of 83.

CHAPTER 3
68
Table 3.1 Summary of baseline age and anthropometric variables and growth during intervention period # (Values are means and standard deviations or n (%))
All children Boys Girls
n Mean SD Mean SD Mean SD p ‡
Baseline §
Age, mo 496 89.0 15.2 91.0 15.9 86.9 14.2 0.003
Socio-economic status score 494 90.0 39.0 88.5 39.8 91.5 38.2 0.394
Height, cm 484 115.6 6.1 116.3 6.1 114.7 5.9 0.003
Weight, kg 483 19.8 2.6 20.2 2.5 19.2 2.6 <0.0001
WHZ 472 -0.3 0.7 -0.3 0.8 -0.3 0.7 0.961
Wasted (WHZ < -2) 472 3 (0.6) 1 (0.2) 2 (0.4) 0.504
HAZ 483 -1.4 1.0 -1.5 1.1 -1.2 0.9 0.001
Stunted (HAZ < -2) 483 122 (25.3) 74 (15.3) 48 (9.9) 0.026
Severely stunted (HAZ < -3) 483 22 (4.6) 17 (3.5) 5 (1.0) 0.015
SSF, mm 484 4.2 0.9 4.0 0.9 4.4 0.9 <0.0001
Mid-upper-arm muscle area, mm2 483 1562.8 207.0 1599.0 214.7 1524.0 191.4 <0.0001
Mid-upper-arm fat area, mm2 483 435.8 142.9 403.3 129.1 470.7 148.9 <0.0001
Growth during intervention period║
Height, cm 436 10.16 1.8 9.85 1.8 10.51 1.8 0.0001
Weight, kg 435 3.7 1.3 3.65 1.2 3.84 1.4 0.127
WHZ 391 -0.2 0.5 -0.1 0.5 -0.2 0.5 0.567
HAZ 436 0.04 0.3 0.1 0.3 -0.002 0.3 0.008
SSF, mm 436 -0.5 0.8 -0.4 0.8 -0.5 0.7 0.063
Mid-upper-arm muscle area, mm2 435 160.6 135.3 157.2 143.0 164.44 126.5 0.579
Mid-upper-arm fat area, mm2 435 37.5 114.0 18.6 106.0 58.6 119.1 0.0002
WHZ, weight-for-height Z-score; HAZ, height-for-age Z-score; SSF, Subscapular skinfold thickness. # Intervention period, period during which the food supplement was provided (24 months). ‡ Significance of difference between boys and girls. § Measurements in the month preceding the intervention period. ║ Difference between measurements at 24 months and baseline.
In Table 3.2 mean energy and nutrient intakes during the intervention period are shown. Intake of total energy might have been adequate compared with the mean required energy intakes of ~1600 kcal/d (6700 kJ/d) for children of this age and weight37. However, it is difficult to evaluate true adequacy without knowing activity levels. Additional energy might also be needed for catch-up growth in the stunted children38 and furthermore, the high infection and malaria burden31 may contribute to an increased requirement for these children. Recommended protein intakes are ~17 g/d39, whereas actual intakes during the intervention period averaged above 50 g/d.
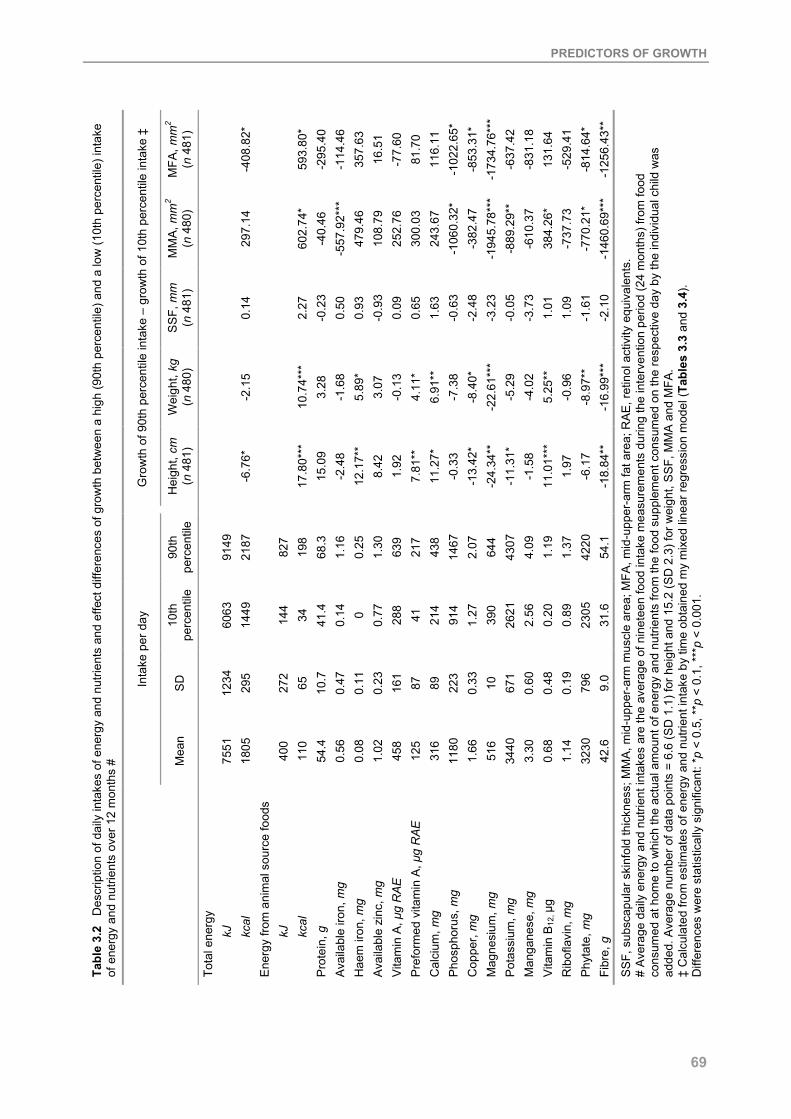
PREDICTORS OF GROWTH
69
MFA
, mm
2
(n 4
81)
-4
08.8
2*
59
3.80
* -2
95.4
0 -1
14.4
6 35
7.63
16
.51
-77.
60
81.7
0 11
6.11
-1
022.
65*
-853
.31*
-1
734.
76**
* -6
37.4
2 -8
31.1
8 13
1.64
-5
29.4
1 -8
14.6
4*
-125
6.43
**
MM
A, m
m2
(n 4
80)
29
7.14
602.
74*
-40.
46
-557
.92*
**
479.
46
108.
79
252.
76
300.
03
243.
67
-106
0.32
* -3
82.4
7 -1
945.
78**
* -8
89.2
9**
-610
.37
384.
26*
-737
.73
-770
.21*
-1
460.
69**
*
SS
F, m
m
( n 4
81)
0.
14
2.
27
-0.2
3 0.
50
0.93
-0
.93
0.09
0.
65
1.63
-0
.63
-2.4
8 -3
.23
-0.0
5 -3
.73
1.01
1.
09
-1.6
1 -2
.10
Wei
ght,
kg
( n 4
80)
-2
.15
10.7
4***
3.
28
-1.6
8 5.
89*
3.07
-0
.13
4.11
* 6.
91**
-7
.38
-8.4
0*
-22.
61**
* -5
.29
-4.0
2 5.
25**
-0
.96
-8.9
7**
-16.
99**
*
Gro
wth
of 9
0th
perc
entil
e in
take
– g
row
th o
f 10t
h pe
rcen
tile
inta
ke ‡
Hei
ght,
cm
( n 4
81)
-6
.76*
17.8
0***
15
.09
-2.4
8 12
.17*
* 8.
42
1.92
7.
81**
11
.27*
-0
.33
-13.
42*
-24.
34**
-1
1.31
* -1
.58
11.0
1***
1.
97
-6.1
7 -1
8.84
**
90th
pe
rcen
tile
91
49
2187
827
198
68.3
1.
16
0.25
1.
30
639
217
438
1467
2.
07
644
4307
4.
09
1.19
1.
37
4220
54
.1
10th
pe
rcen
tile
60
63
1449
144
34
41.4
0.
14
0 0.
77
288
41
214
914
1.27
39
0 26
21
2.56
0.
20
0.89
23
05
31.6
SD
12
34
295
272
65
10.7
0.
47
0.11
0.
23
161
87
89
223
0.33
10
67
1 0.
60
0.48
0.
19
796
9.0 Inta
ke p
er d
ay
Mea
n
75
51
1805
400
110
54.4
0.
56
0.08
1.
02
458
125
316
1180
1.
66
516
3440
3.
30
0.68
1.
14
3230
42
.6
Tabl
e 3.
2 D
escr
iptio
n of
dai
ly in
take
s of
ene
rgy
and
nutri
ents
and
effe
ct d
iffer
ence
s of
gro
wth
bet
wee
n a
high
(90t
h pe
rcen
tile)
and
a lo
w (1
0th
perc
entil
e) in
take
of
ene
rgy
and
nutri
ents
ove
r 12
mon
ths
#
Tota
l ene
rgy
kJ
kcal
E
nerg
y fro
m a
nim
al s
ourc
e fo
ods
kJ
kcal
P
rote
in, g
A
vaila
ble
iron,
mg
Hae
m ir
on, m
g A
vaila
ble
zinc
, mg
Vita
min
A, µ
g R
AE
Pre
form
ed v
itam
in A
, µg
RAE
C
alci
um, m
g P
hosp
horu
s, m
g C
oppe
r, m
g M
agne
sium
, mg
Pot
assi
um, m
g M
anga
nese
, mg
Vita
min
B12
, µg
Rib
ofla
vin,
mg
Phy
tate
, mg
Fibr
e, g
SS
F, s
ubsc
apul
ar s
kinf
old
thic
knes
s; M
MA
, mid
-upp
er-a
rm m
uscl
e ar
ea; M
FA, m
id-u
pper
-arm
fat a
rea;
RA
E, r
etin
ol a
ctiv
ity e
quiv
alen
ts.
# A
vera
ge d
aily
ene
rgy
and
nutri
ent i
ntak
es a
re th
e av
erag
e of
nin
etee
n fo
od in
take
mea
sure
men
ts d
urin
g th
e in
terv
entio
n pe
riod
(24
mon
ths)
from
food
co
nsum
ed a
t hom
e to
whi
ch th
e ac
tual
am
ount
of e
nerg
y an
d nu
trien
ts fr
om th
e fo
od s
uppl
emen
t con
sum
ed o
n th
e re
spec
tive
day
by th
e in
divi
dual
chi
ld w
as
adde
d. A
vera
ge n
umbe
r of d
ata
poin
ts =
6.6
(SD
1.1
) for
hei
ght a
nd 1
5.2
(SD
2.3
) for
wei
ght,
SS
F, M
MA
and
MFA
. ‡
Cal
cula
ted
from
est
imat
es o
f ene
rgy
and
nutri
ent i
ntak
e by
tim
e ob
tain
ed m
y m
ixed
line
ar re
gres
sion
mod
el ( T
able
s 3.
3 an
d 3.
4).
Diff
eren
ces
wer
e st
atis
tical
ly s
igni
fican
t: * p
< 0
.5, *
*p <
0.1
, ***
p <
0.00
1.

CHAPTER 3
70
Prevalences of intakes below estimated average requirements40,41 were 8% for vitamin A, 69% for available zinc and 81% for vitamin B12. Mean total dietary iron intake was 15.3 (SD 3.7) mg/d, but mean fractional iron absorption was only 8% and therefore requirements of absorbed iron of 0.8 mg/d41 would not have been met by 77% of the children. Further, it can be assumed that iron needs are higher in the children due to a high prevalence of infestation with parasites and malaria31 that cause blood losses. Average calcium intakes of 316 mg during the intervention period were much lower than adequate intakes of 800 mg42. Average energy and nutrient intakes at baseline, i.e., during the three months preceding the food supplementation, were not predictive of baseline anthropometric variables and growth during the intervention period. Table 3.3 shows an example of the results of the mixed linear regression models of growth for average daily intake of energy from animal source foods including all covariates. The estimates of the covariates were similar for the models of the other nutrients and therefore in Table 3.4 only the estimates for the interaction of average daily nutrient intakes during the intervention period by time (and not the whole model) are presented, whereby a positive significant coefficient indicates that higher levels of nutrient intake lead to increased growth rates over time. Height gain during the intervention period was positively predicted by average daily intakes of energy from animal source foods, haem iron, preformed vitamin A, calcium, and vitamin B12 and negatively predicted by average daily intakes of total energy, copper, magnesium, potassium, and fibre. Weight gain was positively predicted by average daily intakes of energy from animal source foods, haem iron, preformed vitamin A, calcium and vitamin B12 and negatively predicted by average daily intakes of copper, magnesium, phytate and fibre. Gain in mid-upper-arm muscle area was positively predicted by average daily intakes of energy from animal source foods and vitamin B12 and negatively predicted by average daily intakes of available iron, phosphorus, magnesium, potassium, phytate and fibre. Gain in mid-upper-arm fat area was positively predicted by average daily intakes of energy from animal source foods and negatively predicted by average daily intakes of total energy, phosphorus, copper, magnesium, phytate and fibre. Gain in subscapular skinfold thickness was not predicted by any of the nutrient intakes.
The inclusion of school as a covariate did not change any of the results (results not shown). If mother’s height was included in the models, estimates did not change much. However, potassium intake was no longer a significant predictor for height, intakes of energy from animal source foods, phosphorus, vitamin B12, and phytate were no longer significant predictors of mid-upper-arm muscle area, and intake of total energy and phosphorus did not remain as significant predictors for mid-upper-arm fat area. The inclusion of mother’s height reduced the sample size by 21% and was therefore not included in the final models. To illustrate the effects of energy and nutrients on growth, we calculated differences between a high average daily intake (90th percentile of study children) and a low intake (10th percentile) of energy and nutrients over a period of 12 months (Table 3.2).

PREDICTORS OF GROWTH
71
SE
56.1
22
1.51
8 15
.33
x 10
-3
13
.409
0.41
8
0.47
1 18
7.4
x 10
-3
6.12
9 x
10-3
97.3
2 23
.27
3.
065
0.73
3
0.62
7 0.
647
0.57
6
470.
9 11
2.6
17
.732
4.
240
Mid
-upp
er-a
rm fa
t are
a, m
m2
(n 4
81)
Est
imat
e
349.
03**
* 3.
119*
-1
9.36
x 1
0-3
-7
4.86
7***
0
-1.7
61**
* 0
1.55
0*
555.
6 x
10-3
**
10.6
4 x
10-3
-114
.8
-27.
45
-7
.03*
-1
.68*
0.76
9 0.
679
-0.5
94
0 34
1.08
81
.56
42
.28*
10
.11*
SE
74.9
64
1.53
2 0.
019
17
.914
0.41
5
0.62
9 0.
250
5.96
9 x
10-3
129.
977
31.0
8
3.04
4 0.
728
0.
624
0.64
3 0.
571
62
9.0
150.
4
17.6
35
4.21
7
Mid
-upp
er-a
rm m
uscl
e ar
ea,
mm
2 (n 4
80)
Est
imat
e
1059
.60*
**
9.83
6***
-0
.311
***
67
.207
***
0 -0
.260
0
5.30
2***
0.
884*
**
10.0
91 x
10-3
164.
56
-39.
35
4.
123
0.98
6
-1.2
05
-1.9
87**
-1
.805
**
0 50
9.8
121.
9
42.9
07*
10.2
6*
SE
0.29
0 0.
008
0.12
8 x
10-3
0.07
3
2.22
3 x
10-3
2.26
4 x
10-3
1.
016
x 10
-3
0.32
x 1
0-3
0.
527
0.12
6
16.5
6 x
10-3
3.
96 x
10-3
0.00
3 0.
003
0.00
3
2.55
9 0.
612
0.
092
0.02
2
Sub
scap
ular
ski
nfol
d th
ickn
ess,
m
m (n
481
)
Est
imat
e
3.73
6***
-0
.053
***
1.19
1 x
10-3
***
-0
.388
***
0 1.
734
x 10
-3
0 8.
467
x 10
-3**
* 1.
195
x 10
-3
0.01
8 x
10-3
0.08
-0
.02
19.9
52 x
10-5
4.
771
x 10
-5
-0
.008
* 0.
002
-0.0
08**
0
0.62
3 0.
149
0.
163
0.03
9
SE
0.82
3 0.
015
0.14
2 x
10-3
0.20
4
4.13
2 x
10-3
0.00
7 2.
839
x 10
-3
0.06
0 x
10-3
1.47
6 0.
353
30
.198
x 1
0-3
7.22
1 x
10-3
0.00
6 0.
006
0.00
5
7.14
7 1.
709
0.
171
0.04
1
Wei
ght,
kg
(n 4
80)
Est
imat
e
9.37
0***
0.
162*
**
-0.6
1 x
10-3
***
0.
592*
* 0
-11.
80 x
10-3
**
0 0.
101*
**
11.5
5 x
10-3
***
0.14
2 x
10-3
*
0.23
8 0.
057
-0
.04
-0.0
1 0.
008
-0.0
06
-0.0
06
0 2.
233
0.53
4
0.76
5***
0.
183*
**
SE
1.86
3 0.
024
2.70
x -1
0-4
0.
447
0.
007
0.
016
6.23
9 x
10-3
0.
95 x
10-4
3.24
1 0.
775
0.
046
0.01
1
0.01
0 0.
010
0.00
9
15.6
83
3.75
0
0.27
6 0.
066
Hei
ght,
cm
(n 4
81)
Est
imat
e
89.2
83**
* 0.
497*
**
-3.4
4 x
10-3
***
0.
680
0 -0
.025
***
0 0.
274*
**
21.8
5 x
10-3
***
0.15
0 x
10-3
2.22
-0
.53
-0.1
3**
-0.0
3**
0.03
7***
0.
014
0.02
5**
0
24.7
53
5.91
9
1.26
7***
0.
303*
**
Tabl
e 3.
3 E
ffect
s of
ave
rage
dai
ly in
take
of e
nerg
y fro
m a
nim
al s
ourc
e fo
ods
on g
row
th #
(V
alue
s ar
e pa
ram
eter
est
imat
es a
nd s
tand
ard
erro
rs)
Inte
rcep
t Ti
me,
mo
Tim
e x
time
Sex
Boy
s
Girl
s S
ex x
tim
e
Boy
s
Girl
s A
ge, m
o S
ES
S
ES
x ti
me
Tota
l ene
rgy
inta
ke
M
J
Mca
l To
tal e
nerg
y in
take
x ti
me
MJ
x m
o
Mca
l x m
o Tr
eatm
ent x
tim
e ‡
Trea
tmen
t 1
Trea
tmen
t 2
Trea
tmen
t 3
Trea
tmen
t 4
Ene
rgy
from
ani
mal
sou
rce
food
s
MJ
M
cal
Ene
rgy
from
ani
mal
sou
rce
food
s x
time
M
J x
mo
M
cal x
mo
SE
S, s
ocio
-eco
nom
ic s
tatu
s.
# Fr
om m
ixed
line
ar r
egre
ssio
n m
odel
s. A
vera
ge d
aily
ene
rgy
and
nutri
ent i
ntak
es a
re th
e av
erag
e of
nin
etee
n fo
od in
take
mea
sure
men
ts d
urin
g th
e in
terv
entio
n pe
riod
(24
mon
ths)
from
food
co
nsum
ed a
t hom
e to
whi
ch th
e ac
tual
am
ount
of e
nerg
y an
d nu
trien
ts fr
om th
e fo
od s
uppl
emen
t con
sum
ed o
n th
e re
spec
tive
day
by th
e in
divi
dual
chi
ld w
as a
dded
. Ave
rage
num
ber o
f dat
a
poin
ts =
6.6
(SD
1.1
) for
hei
ght a
nd 1
5.2
(SD
2.3
) for
wei
ght,
subs
capu
lar s
kinf
old
thic
knes
s, m
id-u
pper
-arm
mus
cle
area
and
mid
-upp
er-a
rm fa
t are
a.
‡ Tr
eatm
ent 1
, ene
rgy
supp
lem
ent;
treat
men
t 2, c
ontro
l gro
up; t
reat
men
t 3, m
ilk s
uppl
emen
t; tre
atm
ent 4
, mea
t sup
plem
ent.
Effe
cts
wer
e st
atis
tical
ly s
igni
fican
t: *p
< 0
.5, *
*p <
0.1
, ***
p <
0.00
1.

CHAPTER 3
72
SE
3.07
0 0.
734
50
.146
x 1
0-3
45
1.94
4 29
04.2
86
15
10.1
24
1.
372
2.
868
3.44
2
2.44
3 14
26.9
60
5.
060
0.55
4
1052
.054
482.
006
2.56
8 0.
462
0.04
9
Mid
-upp
er-a
rm fa
t are
a, m
m2
(n 4
81)
Est
imat
e
-6.5
20*
-1.5
59*
-3
0.53
4 x
10-3
-310
.753
39
48.3
85
87
.032
-0.6
14
1.
289
1.44
0
-5.1
37*
-296
1.05
6*
-1
8.94
5***
-1
.050
-150
6.50
8
368.
014
-301
8.82
5 -1
.182
* -0
.155
**
SE
3.04
9 0.
729
49
.881
x 1
0-3
44
9.85
4 28
84.5
60
14
98.3
66
1.
357
2.
840
3.41
5
2.42
7 14
20.9
56
5.
010
0.54
8
1046
.191
476.
312
2547
.455
0.
459
0.04
9
Mid
-upp
er-a
rm m
uscl
e ar
ea,
mm
2 (n 4
80)
Est
imat
e
4.68
0 1.
119
-4
.182
x 1
0-3
-1
515.
721*
**
5293
.455
573.
363
1.
999
4.
735
3.02
2
-5.3
26*
-132
7.19
0
-21.
249*
**
-1.4
65**
-110
6.29
7
1074
.214
* -4
205.
303
-1.1
17*
-0.1
80**
*
SE
16.2
68 x
10-3
3.
89 x
10-3
0.25
9 x
10-3
2.43
3 14
.541
7.74
1
7.21
x 1
0-3
0.
015
0.00
2
0.01
3 7.
532
0.
027
2.93
x 1
0-3
5.
531
2.
525
13.1
47
0.00
2 0.
262
x 10
-3
Sub
scap
ular
ski
nfol
d th
ickn
ess,
mm
(n 4
81)
Est
imat
e
2.25
8 x
10-3
0.
54 x
10-3
-0.0
23 x
10-3
1.36
2 10
.288
-4.8
94
-0
.72
x 10
-3
0.
010
0.02
0
-0.0
03
8.62
3
-0.0
35
-0.0
9 x
10-3
-6.7
61
2.
829
6.19
9 -0
.002
-0
.258
x 1
0-3
SE
30.7
80 x
10-3
7.
36 x
10-3
0.49
2 x
10-3
4.63
8 27
.679
14.7
77
0.
014
0.
028
0.03
3
0.02
4 14
.206
0.05
0 0.
006
10
.477
4.75
1 25
.113
0.
005
0.48
6 x
10-3
Wei
ght,
kg
(n 4
80)
Est
imat
e
-33.
832
x 10
-3
-8.0
9 x
10-3
0.33
9 x
10-3
-4.5
49
64.9
95*
16
.197
-0.0
01
0.
065*
0.
086*
*
-0.0
37
-29.
153*
-0.2
47**
* -0
.009
-7.2
88
14
.679
**
-5.4
61
-0.0
13**
-2
.090
x 1
0-3**
SE
0.05
0 0.
012
0.
797
x 10
-3
7.
423
45.7
69
23
.897
0.02
2
0.04
5 0.
054
0.
039
22.7
15
0.
081
0.00
9
16.7
85
7.
513
40.9
36
7.40
x 1
0-3
0.78
7 x
10-3
Hei
ght,
cm
(n 4
81)
Est
imat
e
-0
.105
* -0
.025
*
1.56
0 x
10-3
-6.7
33
134.
397*
*
44.3
82
0.01
5
0.12
3**
0.14
0*
-0.0
02
-46.
577*
-0.2
66**
-0
.019
*
-2.8
55
30.7
79**
* 11
.251
-0
.009
-2
.319
x 1
0-3**
Tabl
e 3.
4 E
ffect
s of
ave
rage
dai
ly in
take
of t
otal
ene
rgy
and
nutri
ents
on
grow
th #
(V
alue
s ar
e pa
ram
eter
est
imat
es a
nd s
tand
ard
erro
rs)
E
nerg
y/nu
trien
t x ti
me
Tota
l ene
rgy
M
J x
mo
M
cal x
mo
Pro
tein
, g x
mo
Ava
ilabl
e iro
n, g
x m
o
Hae
m ir
on, g
x m
o A
vaila
ble
zinc
, g x
mo
V
itam
in A
, mg
RAE
x m
o
Pre
form
ed v
itam
in A
, mg
RAE
x m
o
Cal
cium
, g x
mo
Pho
spho
rus,
g x
mo
C
oppe
r, g
x m
o M
agne
sium
, g x
mo
Pot
assi
um, g
x m
o M
anga
nese
, g x
mo
Vita
min
B12
, mg
x m
o
Rib
ofla
vin,
g x
mo
Phy
tate
, g x
mo
Fibr
e, g
x m
o
RA
E, R
etin
ol a
ctiv
ity e
quiv
alen
ts.
# Fr
om m
ixed
line
ar re
gres
sion
mod
els.
Ave
rage
dai
ly e
nerg
y an
d nu
trien
t int
akes
are
the
aver
age
of 1
9 fo
od in
take
mea
sure
men
ts d
urin
g th
e in
terv
entio
n pe
riod
(24
mon
ths)
from
food
co
nsum
ed a
t hom
e to
whi
ch th
e ac
tual
am
ount
of e
nerg
y an
d nu
trien
ts fr
om th
e fo
od s
uppl
emen
t con
sum
ed o
n th
e re
spec
tive
day
by th
e in
divi
dual
chi
ld w
as a
dded
. Ave
rage
num
ber o
f dat
a
poin
ts =
6.6
(SD
1.1
) for
hei
ght a
nd 1
5.2
(SD
2.3
) for
wei
ght,
subs
capu
lar s
kinf
old
thic
knes
s, m
id-u
pper
-arm
mus
cle
area
and
mid
-upp
er-a
rm fa
t are
a.
Effe
cts
wer
e st
atis
tical
ly s
igni
fican
t: *p
< 0
.5, *
*p <
0.1
, ***
p <
0.00
1.
PREDICTORS OF GROWTH
73
For example, if a child consumed every day a diet with a high intake of energy from animal source foods (90th percentile, 198 kcal (827 kJ)), she would gain 18 cm more in height, 11 kg more in weight, 2 mm more subscapular skinfold thickness, 603 mm2 more mid-upper-arm muscle area or 594 mm2 more mid-upper-arm fat area in 12 months compared with a child with a low intake of energy from animal source foods (10th percentile, 34 kcal (144 kJ)).
In Figure 3.1, the effect differences between a high average daily intake (90th percentile of study children) and a low intake (10th percentile) of energy from animal source foods, preformed vitamin A, calcium and vitamin B12 and height gain over 12 months are shown as growth slopes. Average daily energy and nutrient intakes did not predict any differences in growth between girls and boys. Most of the nutrient intake variables predicted higher growth rates for the stunted than for the non-stunted children for weight, subscapular skinfold thickness, mid-upper-arm muscle area and mid-upper-arm fat area (Table 3.5). There were no significant differences between stunted and non-stunted children for height.
DISCUSSION
The setting of the present food supplementation study provided the unique opportunity to compare the growth of Kenyan school children with different diets and therefore varying intakes of energy and nutrients. The usual diet consists predominantly of maize and beans with only 4% of energy intake from animal source foods. Energy intake from animal source foods was increased by 65% through supplementation with meat and milk. Unlike in many other studies, in addition to energy intake, the intake of multiple nutrients and bioavailability factors, such as fibre and phytate, over a 2-year period were considered in the analyses. The present study, where the total food intake of the children (i.e., their intake at home plus the intake of the food supplements) was considered and other variables that might have an influence on growth (such as sex, age and socio-eonomic status) were controlled for, shows that growth was positively predicted by energy and nutrients that are provided in high amounts and in a bioavailable form in meat and milk. Height gain was positively predicted by average daily intakes of energy from animal source foods, haem iron, preformed vitamin A, calcium and vitamin B12. Weight gain was positively predicted by average daily intakes of energy from animal source foods, haem iron, preformed vitamin A, calcium and vitamin B12. These findings indicate that with some animal source foods added daily to the children’s diet, significant differences could be made in improving their height and weight. In contrast, we did not see this when we earlier compared the growth of the children on the basis of the food supplement they received30. There was no effect of the food supplementation on height gain and the only difference in weight gain was found between the supplemented groups and the control group, indicating that it was not the effect of the meat or milk that was responsible for weight gain, but probably the extra energy intake through the snacks or the intake of vitamin A with which the cooking fat used for all food supplements was fortified.

CHAPTER 3
74
(a)
05
10152025
0 3 6 9 12
Time (months)
Hei
ght g
ain
(cm
)
(b)
0
5
10
15
20
25
0 3 6 9 12
Time (months)
Hei
ght g
ain
(cm
)
(c)
0
5
10
15
20
25
0 3 6 9 12
Time (months)
Hei
ght g
ain
(cm
)
(d)
0
5
10
15
20
25
0 3 6 9 12
Time (months)
Hei
ght g
ain
(cm
)
Figure 3.1 Effect of intake of energy from animal source foods (a), preformed vitamin A (b), calcium (c) and vitamin B12 (d) over 12 months on height gain among rural Kenyan school children (n 493) with a low intake (10th percentile, ---▪---) and a high intake (90th percentile, ---♦---). Average daily energy and nutrient intakes are the average of nineteen food intake measurements during the intervention period (24 months) from food consumed at home to which the actual amount of energy and nutrients from the food supplement consumed on the respective day by the individual child was added.

PREDICTORS OF GROWTH
75
Table 3.5 Difference in growth over 12 months between stunted and non-stunted children for average daily intake of energy and nutrients #
Weight, kg Subscapular
skinfold thickness, mm
Mid-upper-arm muscle area,
mm2
Mid-upper-arm fat area,
mm2
Total energy Mcal MJ
0.6***
2.51*** 54.24**
Energy from animal source foods Mcal MJ
1.44** 6.03**
Protein, g 0.02*** 1.28** Available zinc, mg 0.73** 0.28* 47.67* Vitamin A, mg RAE 0.96** 0.6** 100.56** 76.44* Preformed vitamin A, mg RAE 0.96* Calcium, g 1.56* 1.08** 148.56* Phosphorus, g 0.96*** 78.0** Copper, mg 0.51** 51.96** Magnesium, g 1.44** 145.92** Potassium, g 0.24* 21.12** Manganese, mg 0.30*** 28.56** Vitamin B12, µg 0.19** Riboflavin, mg 0.92*** 0.39** 84.87** Phytate, g 0.24** 20.16** Fibre, g 0.02** 1.75**
RAE, retinol activity equivalents. # Results are the differences in parameter estimates from the mixed linear regression models for stunted (baseline height-for-age Z-score < -2) and non-stunted (baseline height-for-age Z-score ≥ -2) children calculated for 12 months, n 481 (stunted, 123, non-stunted, 359). Only significant results are shown; there were no significant differences between stunted and non-stunted children for height. Average daily energy and nutrient intakes are the average of nineteen food intake measurements during the intervention period (24 months) from food consumed at home to which the actual amount of energy and nutrients from the food supplement consumed on the respective day by the individual child was added. Differences were statistically significant: *p < 0.05, ** p < 0.01, *** p < 0.001.
However, there was an unforeseen change in the home diet between baseline and the intervention period, such as that total energy intake of the children in the energy group (only maize and beans with no animal source foods added) and milk group decreased, whereas it increased in the control (no supplement) and meat groups33. The current analytical approach might be more sensitive than the previous one because we included total daily intake of energy and nutrients, i.e., the food supplement plus home food intake per child, while controlling for treatment, i.e., the food supplements the children received.
However, it has to be taken into consideration that the fat used in preparing the food supplements was enriched with vitamin A (Kimbo, fortified with 124 IU/g; Unilever Kenya Ltd) and therefore the amount of preformed vitamin A was also high in the supplement that did not contain any animal source foods. Consequently it cannot be assumed that it was only the preformed vitamin A from milk that was beneficial for growth. Intake of total vitamin A, which includes carotenoids, did not have any effect on growth. This finding is in contrast to those of

CHAPTER 3
76
other studies that did not see an association of preformed vitamin A intake and growth, but with intake of dietary carotenoids9,43. However, it was suggested in the other studies that the lack of association might have been due to limitations in the multivariate analyses because the range of intake of animal source foods in the study population was small43. Gain in muscle mass was positively predicted by average daily intakes of energy from animal source foods and vitamin B12. This is in agreement with the earlier findings of the study where the growth was compared between the different food supplementation groups30. The children who received meat had greater gains in muscle mass than those in the other groups and also those children who received milk had greater gains in muscle mass than those in the control group (no supplement). Gain in fat mass was positively predicted only by average daily intakes of energy from animal source foods. This is in contrast to the earlier findings of the study, where we did not find any effect of meat or milk on fat mass.
The findings of the present study indicate that nutrients that are high in plant foods are associated with poorer growth. Negative predictors of height and weight gain were intakes of copper, magnesium and fibre; for height gain additionally total energy and potassium, and for weight gain additionally phytate. This indicates that a diet with no or negligible amounts of animal source foods and high amounts of starchy foods and legumes rich in inhibitors of bioavailability of minerals, such as phytate and fibre, seem to be disadvantageous for child growth. Gain in mid-upper-arm muscle area was negatively predicted by average daily intakes of available iron, phosphorus, magnesium, potassium, phytate and fibre. It is unclear why available iron would be a negative predictor of muscle mass. However, haem iron, which is highly bioavailable, was a positive predictor of height and weight gain. It would be expected that increases in the amounts of highly available zinc and iron through the meat supplement would be beneficial for growth, especially considering that their bioavailability in the children’s habitual diets in the study area is low: 9% for iron and 13% for zinc33. The advantage of the algorithm we used to calculate iron bioavailability36 is that it is based on continuous variables for content of enhancers and inhibitors, takes into consideration interactions between factors and includes more factors than previous algorithms. Calculation of iron absorption is based on meals, which is expected to give more accurate results than day-based analyses that can e.g., overestimate iron absorption if ascorbic acid-rich foods, such as fruits, are consumed between meals, but are considered enhancers of non-haem iron absorption from other meals. However, accuracy of calculations of iron bioavailability can only be ensured if contents of dietary factors are known and exact, which is often not the case. We might therefore have over- or underestimated iron bioavailability. Gain in mid-upper-arm fat area was negatively predicted by average daily intakes of total energy, phosphorus, copper, magnesium, phytate and fibre. These nutrients are mainly contained in the type of diet based on maize and beans with no or only little animal source foods that the study children habitually consume, which is also low in fat (~15% of energy). However, even the increase in fat intake in the children’s diets through the food supplementation increased fat mass only little or not at all30. Children who were stunted at the beginning of the study seem to have benefited more from the intake of total energy and most of

PREDICTORS OF GROWTH
77
the nutrients we examined than the non-stunted children. The nutritional needs of stunted children are higher than those of non-stunted children and probably their food intake at home is generally lower and other environmental factors are more detrimental than those of the non-stunted children (the reason why they became stunted and probably have a general poorer nutritional status). The earlier findings of the food supplementation study showed that the more stunted children had greater benefits for height gain from the milk supplement than the other children30. There is some evidence for maternal inheritance of height44. However, results with and without mother’s height were not much different and, due to a high number of missing values, it was not included in the final models. Height is expected to be influenced not only by genetic but also by environmental factors, and women were found to be short in an earlier study in the same area45. Therefore, at least part of the relation of mother’s height and a child’s height is likely to have been reflected in the food intake and socio-eonomic status variables.
The results of the present study show that the intake of nutrients which are contained in large amounts and in an easily available form in meat and milk was beneficial for the growth of the study children who live on a monotonous diet of maize and beans with little other nutritious foods and who suffer from infectious diseases. The promotion of an increased production of animal source foods and their utilisation in the diets of children should be integrated into all food-based programmes to improve micronutrient status and growth in children in developing countries.
REFERENCES 1. ACC/SCN (2000) Fourth report on the world nutrition situation. Geneva: ACC/SCN with IFPRI. 2. Government of Kenya/UNICEF (1998) Situation analysis of children and women in Kenya 1998. Nairobi:
Ministry of Planning and National Development, Human Resources and Social Services Department and UNICEF Kenya Country Office.
3. Graham G & Adrianzen B (1972) Late 'catch-up' growth after severe infantile malnutrition. Johns Hopkins Med J 131 (3): 204-11.
4. Tanner J (1981) Catch-up growth in man. Br Med Bull 37: 233-8. 5. Kulin HE, Bwibo N, Mutie D & Santer SJ (1982) The effect of chronic childhood malnutrition on pubertal growth
and development. Am J Clin Nutr 36: 527-36. 6. Proos LA, Hofvander Y & Tuvemo T (1991) Menarcheal age and growth pattern of Indian girls adopted in
Sweden. II. Catch-up growth and final height. Indian J Pediatr 58 (1): 105-14. 7. Calloway DH, Murphy S, Balderston J, Receveur O, Lein D & Hudes M (1992) Village nutrition in Egypt, Kenya,
and Mexico: looking across the CRSP projects. Final report to USAID. Berkeley CA: University of California. 8. Murphy SP, Calloway DH & Beaton GH (1995) Schoolchildren have similar predicted prevalences of
inadequate intakes as toddlers in village populations in Egypt, Kenya, and Mexico. Eur J Clin Nutr 49: 647-57. 9. Graham GG, Creed HM, MacLean WC, Kallman CH, Rabold J & Mellits ED (1981) Determinants of growth
among poor children: nutrient intake-achieved growth relationships. Am J Clin Nutr 34: 539-54. 10. Garn SM, Rohmann CG, Behar M, Viteri F & Guzman MA (1964) Compact bone deficiency in protein-calorie
malnutrition. Science 145: 1444-5. 11. Adams P & Berridge FR (1969) Effects of kwashiorkor on cortical and trabecular bone. Arch Dis Child 44: 705-
9. 12. Black MM (1998) Zinc deficiency and child development. Am J Clin Nutr 68: 4645S-95S. 13. Judisch JM, Naiman JL & Oski FA (1966) The fallacy of the fat iron-deficient child. Pediatrics 37: 987-90. 14. Rao KV, Radhiah G & Raju SVS (1980) Association of growth status and the prevalence of anemia in preschool
children. Indian J Med Res 71: 237-46.
CHAPTER 3
78
15. Bouglé D, Laroche D & Bureau F (2000) Zinc and iron status and growth in healthy infants. Eur J Clin Nutr 54: 764-7.
16. Santos LMP, Dricot JM, Asciutti LS & Dricot-d'Ans C (1983) Xerophthalmia in the state of Paraiba, Northeast of Brazil: Clinical findings. Am J Clin Nutr 38: 139-44.
17. Mele L, West KJ, Kusdiono, et al. (1991) Nutritional and household risk factors for xerophthalmia in Aceh, Indonesia: A case-control study. Am J Clin Nutr 53: 1460-5.
18. Tarwotjo I, Katz J, West KJ, Tielsch J & Sommer A (1992) Xerophthalmia and growth in preschool Indonesian children. Am J Clin Nutr 55: 1142-6.
19. Chusilp K, Somnasang P, Kirdpon W, et al. (1992) Observations on the development of stunting in children of the Khon Kaen region of Thailand. Eur J Clin Nutr 46 (7): 475-87.
20. Prentice A & Bates CJ (1994) Adequacy of dietary mineral supply for human bone growth and mineralisation. Eur J Clin Nutr 48: 161S-77S.
21. Black RE, Williams SM, Jones IE & Goulding A (2002) Children who avoid drinking cow milk have low dietary calcium intakes and poor bone health. Am J Clin Nutr 76 (3): 675-80.
22. Castillo-Duran C & Uauy R (1988) Copper deficiency impairs growth of infants recovering from malnutrition. Am J Clin Nutr 47 (4): 710-4.
23. Clausen T & Dorup I (1998) Micronutrients, minerals and growth control. Bibl Nutr Dieta 54: 84-92. 24. Walker SP, Powell CA & Grantham-McGregor SM (1990) Dietary intakes and activity levels of stunted and non-
stunted children in Kingston, Jamaica, Part 1, Dietary Intakes. Eur J Clin Nutr 44: 527-34. 25. Allen LH, Backstrand JR, Stanek EJI, et al. (1992) The interactive effects of dietary quality on the growth of
young Mexican children. Am J Clin Nutr 56: 353-64. 26. Paik HY, Hwang SH & Lee SP (1992) Comparative analysis of growth, diet, and urinary N excretion in
elementary school children from urban and rural areas of Korea. Int J Vitam Nutr Res 62: 83-90. 27. Marquis GS, Habicht JP, Lanata CF, Black RE & Rasmussen KM (1997) Breast milk or animal-product foods
improve linear growth of Peruvian toddlers consuming marginal diets. Am J Clin Nutr 66 (5): 1102-9. 28. Uauy R, Mize CE & Castillo-Duran C (2000) Fat intake during childhood: metabolic responses and effects on
growth. Am J Clin Nutr 72: 1354S-60S. 29. Neumann CG, Bwibo NO, Murphy SP, et al. (2003) Animal Source Foods Improve Dietary Quality,
Micronutrient Status, Growth and Cognitive Function in Kenyan School Children: Background, Study Design and Baseline Findings. J Nutr 133 (11): 3941S-9S.
30. Grillenberger M, Neumann CG, Murphy SP, et al. (2003) Food supplements have a positive impact on weight gain and the addition of animal source foods increases lean body mass of Kenyan schoolchildren. J Nutr 133 (11): 3957S-64S.
31. Siekmann JH, Allen LH, Bwibo NO, Demment MW, Murphy SP & Neumann CG (2003) Kenyan school children have multiple micronutrient deficiencies, but increased plasma vitamin B-12 is the only detectable micronutrient response to meat or milk supplementation. J Nutr 133 (11): 3972S-80S.
32. Whaley SE, Sigman M, Neumann C, et al. (2003) The impact of dietary intervention on the cognitive development of Kenyan school children. J Nutr 133 (11): 3965S-71S.
33. Murphy SP, Gewa C, Liang L-J, Grillenberger M, Bwibo NO & Neumann CG (2003) School snacks containing animal source foods improve dietary quality for children in rural Kenya. J Nutr 133 (11): 3950S-6S.
34. Frisancho AR (1981) New norms of upper limb fat and muscle areas for assessment of nutritional status. Am J Clin Nutr 34: 2540-5.
35. Gibson R (1990) Principles of nutritional assessment. New York: Oxford University Press. 36. Hallberg L & Hulthén L (2000) Prediction of dietary iron absorption: an algorithm for calculating absorption and
bioavailability of dietary iron. Am J Clin Nutr 71: 1147-60. 37. Torun B, Davies PSW, Livingstone MBE, Paolisso M, Sackett R & Spurr GB (1996) Energy requirements and
dietary energy recommendations for children and adolescents 1 to 18 years old. Eur J Clin Nutr 50 (Suppl. 1): 37S-81S.
38. Allen LH (1994) Nutritional influences on linear growth: a general review. Eur J Clin Nutr 48 (Suppl 1): 75S-89S. 39. Dewey KG, Beaton G, Fjeld C, Loennerdal B & Reeds P (1996) Protein requirements of infants and children.
Eur J Clin Nutr 50 (Suppl 1): 119S-50S. 40. Institute of Medicine (1998) Dietary Reference Intakes for thiamin, riboflavin, niacin, vitamin B6, folate, vitamin
B12, pantothenic acid, biotin, and choline. Washington, DC: National Academy Press. 41. Institute of Medicine (2001) Dietary Reference Intakes for vitamin A, vitamin K, arsenic, boron, chromium,
copper, iodine, iron, manganese, molybdenum, nickel, silicon, vanadium and zinc. Washington, DC: National Academy Press.
42. Institute of Medicine (2001) Dietary Reference Intakes for Calcium, Phosphorus, Magnesium, Vitamin D, and Fluoride. Washington, DC: National Academy Press.

PREDICTORS OF GROWTH
79
43. Sedgh G, Herrera MG, Nestel P, el Amin A & Fawzi WW (2000) Dietary vitamin A intake and nondietary factors are associated with reversal of stunting in children. J Nutr 130: 2520-6.
44. Boldsen JL & Mascie-Taylor CGN (1990) Evidence for maternal inheritance of female height in a British national sample. Hum Biol 62 (6): 767-72.
45. Neumann CG & Bwibo NO (1987) Final report: Food intake and human function, Kenya Project, Human Collaborative Support Program, USAID, Office of Nutrition.

44
Impact of supplementation with animal source foods on morbidity of rural Kenyan school children
Monika Grillenberger, Charlotte G. Neumann, Suzanne P. Murphy, Nimrod O. Bwibo,
Werner Wosniok, Joseph G.A.J. Hautvast, Clive E. West Submitted for publication

CHAPTER 4
82
ABSTRACT
Objective: Micronutrient deficiencies are common amongst children in developing countries and can impair the health status of children with serious consequences for growth and cognitive development. Supplementation studies with vitamin A, iron or zinc supplements have been shown to reduce morbidity, but studies using food-based approaches that evaluate this relation are rare. We investigated the effect of the provision of animal source foods on morbidity of school children.
Design: Controlled feeding intervention study over 2 years with schools randomly assigned to one of three food supplements or no supplement (control group).
Setting: Primary schools in a rural area in Embu District, Eastern Province, Kenya with high levels of stunting and micronutrient deficiencies.
Subjects: Of 554 children (median age 7 years) from twelve selected primary schools, data of 498 children was used.
Interventions: Four study groups of which three received isoenergetic food supplements made of a maize and bean stew (githeri) with meat, with milk or plain githeri (energy supplement).
Results: There were no effects of any of the food supplements on period prevalence of upper respiratory tract infection, eye infection, skin infection, gastrointestinal disease, malaria and indicators of illness severity, nor were there significant differences between the food supplements. However, there was a trend predicting a lower risk for most illnesses and indicators of illness severity for children receiving the milk supplement (not statistically significant).
Conclusions: The provision of meat and milk did not significantly reduce the occurrence of common diseases in school children. The apparent positive effect of milk on morbidity needs to be investigated further.
ANIMAL SOURCE FOODS AND MORBIDITY
83
INTRODUCTION
In developing countries infectious diseases are highly prevalent. Besides protein-energy malnutrition even moderate deficiencies of individual nutrients such as trace minerals and vitamins, particularly zinc, iron, selenium, vitamins A, B6, B12, C and E and essential fatty acids adversely affect the immune system1. The impaired nutritional and health status of children not only leads to increased mortality and poor growth performance2, but also diminished cognitive function and school performance3.
A longitudinal observation study, carried out in the 1980s in the same study area as our study, found morbidity prevalence rates in school children of 45.1% for upper respiratory tract infection, 13.5% for gastrointestinal disease, 11.4% for eye infection, 7.5% for clinical malaria, 2.7% for lower respiratory tract infection and 2.2% for skin infection4. Intakes of iron, zinc, calcium, riboflavin and vitamins A, B12, D, and E were inadequate in toddlers and school children5 and pre-existing mild to moderate malnutrition was shown to contribute to an increased risk of respiratory tract infection6.
The timely provision of nutrient supplements, fortified food or a better diet has the potential to stimulate immune response and reduce prevalence, severity and mortality from certain key infections1,7. Supplementation studies with vitamin A have shown a decrease in mortality8,9, malaria10,11, complications of measles9,12,13 and a reduction in severity of measles14 and diarrhoea10,15,16. No effect of vitamin A supplementation on respiratory infections15,16 or incidence or prevalence of disease was found10,17,18. Zinc supplementation can reduce the rates of pneumonia and diarrhoea19. Some studies suggest that zinc may reduce Plasmodium falciparum malaria20,21. Most of the studies evaluating the effect of oral iron therapy in iron deficient subjects have shown a reduction in morbidity22.
If children suffer from multiple micronutrient deficiencies, like the children in the study area, supplementation with single micronutrients may not be suitable, and a different approach to improve the health of children is needed. A medium-term approach could be the fortification of food with micronutrients, which showed a decrease in respiratory- and diarrhoea-related diseases in school-aged children23. For a long-term benefit, sustainable food-based strategies have to be developed. In Kenya as well as in many other developing countries micronutrient deficiencies are highly prevalent because diets are based on plant foods with high contents of phytates and fibre that reduce mineral bioavailability, and diets lack both variety and animal products. No controlled feeding intervention has been carried out thus far to test the effects of supplementing children with different animal source foods on their morbidity. Therefore, we performed a 2-year intervention study that included three levels of isoenergetic supplements (i.e., maize and bean stew (githeri) with meat, with milk or plain githeri) and a control group. The addition of animal source foods to the diet of children might be beneficial to improve their sub-optimal micronutrient status. If this approach proves to be successful and is included into nutrition programs, the long-term detrimental effects of malnutrition and ill-health can be ameliorated or prevented.
CHAPTER 4
84
METHODS AND MATERIALS
Study area and population
The study was conducted in Kyeni South Division of Embu District in Eastern Province, Kenya. The study area is on the slopes of Mt. Kenya, near the Equator at an elevation ranging from 1200 to 1460 m. The region is characterized by distinct rainy and dry seasons, with mild weather year-round. The study area includes a relatively fertile zone with higher rainfall, and a semi-arid area at lower elevations. During the study period there was a drought that resulted in low harvests of the staple crops maize and beans. Cash crops, which are produced in the area on a small scale, include coffee, cotton, and tobacco.
Study design
All children enrolled in class 1 (median age 7.1 years) from twelve selected primary schools (n 554) participated in the study. They received either a daily food supplement or no supplement (control). Schools were assigned randomly to one of three different food supplements. These were isoenergetic and contained a maize and bean stew (githeri) with meat, with milk or plain githeri (referred to as the “energy supplement”). Because three large schools had more than one class 1 classroom, each of these schools was randomly assigned to each of the groups, such that those schools could not be randomised to the same food supplementation group. The feeding started on August 31, 1998, at the beginning of the last school term of the year, and ended in July 2000. The school year in Kenya begins in January and comprises three terms, with three 1-month breaks in April, August and December. The supplement was distributed for 18 months, when schools were in session. In the new school year in 1999, the children moved to class 2 and in January 2000 they moved to class 3. Repeaters were kept in the study and continued to be fed with their original class. Every child in a class where a food supplement was distributed participated in the feeding, irrespective of whether data were collected from them or whether their data were included in the analyses.
Approval was obtained from the University of California, Los Angeles, Human Subject Protection Committee, and the Ethics Committee of the University of Nairobi, School of Medicine, Kenya, and the Office of the President, Government of Kenya. All local and district authorities were involved in the implementation of the study, and the community was extensively informed about the aim and procedures of the intervention. Informed verbal consent of the parents of the study children was obtained before the study.
After completion of the study, the households in the control group were given a local milk goat. This was chosen by the parents through representative committees as compensation for the food their children missed during the course of study.

ANIMAL SOURCE FOODS AND MORBIDITY
85
Preparation, distribution and composition of food supplements
The vehicle for the food supplements was githeri, a local dish made from dry white maize (Zea mays), Mwitemania beans (kidney beans, Phaseolus vulgaris), tomatoes, onions, iodised salt (Kensalt, 168.5 mg potassium iodate/kg, Salt Manufacturers, Kenya), vegetable fat (Kimbo, fortified with 124 IU of retinol/g, Unilever, Kenya), and sukuma wiki (kale or collard greens, Brassica oleracea). For the meat supplement, minced beef (10% fat) was added; for the milk supplement, a glass of ultrahigh-temperature cow’s milk was served after the consumption of the githeri; and the energy supplement contained higher amounts of all ingredients. The food supplement was thoroughly mixed to ensure that all children received the same amount of all ingredients, and that part of the mixture would not be consumed preferentially (such as pieces of meat). It was deemed important that only local foods and familiar preparation methods were used, but for hygienic and logistical reasons, the milk and meat were purchased from reputable wholesalers within the region or from Nairobi. Taste tests were conducted with school children, and where necessary, recipes were adjusted. During the first school term of the intervention (September to November 1998), the meat, milk and energy supplements contained an estimated energy content of ~1050 kJ/serving. Because children were growing in height and weight, the amounts of some ingredients then were increased to achieve a total energy content of ~1255 kJ, which was maintained at this level throughout the intervention phase. The energy and nutrient content of the food supplements is presented in Table 4.1. The milk and meat supplements provided more than half the recommended daily intake of vitamin A and > 75% of the recommended daily amount for vitamin B12. The meat supplement provided nearly one-third of the recommended iron and more than half of the recommended daily amount of zinc, whereas the milk supplement provided > 75% of the recommended intake of riboflavin.
The food was prepared in a central location following strict hygienic preparation methods and weighed into plastic bowls, each of which was labelled with a child’s name, and transported while still hot in insulated containers by car to the schools. The food was served during the first school-break at 9:30 a.m. This time was chosen to avoid breakfast or lunch being replaced by the food supplement. Project staff ensured that each child received the food container that was labelled with his/her name and that no food was spilled or exchanged between the children. Afterwards the bowls and cups were collected. The milk leftovers were measured at school, and later at the cooking site the food leftovers were weighed and the amounts were recorded.
Data collection
Twelve local women who had worked as enumerators in the Nutrition Collaborative Research Support Program on Food Intake and Human Function (NCRSP) in the same location in 1984 were retrained to perform the data collection.

CHAPTER 4
86
Table 4.1 Energy and nutrient content of the food supplements #
Meat supplement Milk supplement Energy supplement
Macronutrients Energy, kJ kcal
1317 315
1317 315
1313 314
Protein, g 21.6 12.7 10.7 Carbohydrate, g 23.4 35.6 53.5 Phytate, mg 368 368 841 Vitamins
Vitamin A, µg RAE ‡ 79 291 240 Riboflavin, mg 0.17 0.49 0.15 Folate, mg 54 65 114
Vitamin B12 , µg 1.27 1.0 0 Minerals Calcium, mg 18 303 35 Available iron, mg § 0.26 0.18 0.36 Available zinc, mg § 0.46 0.23 0.22
RAE, Retinol activity equivalents # Values are based on the supplements for 1999 and 2000. Nutrient values were calculated using food composition data from the International Minilist that was developed for the WorldFood Dietary Assessment System24. ‡ The vegetable fat was fortified with 124 IU of retinol per g. The milk itself provided 138 µg RAE. § Dietary iron and zinc availability were calculated using the approach described by Murphy et al.25. It is assumed that the supplement is consumed alone.
A supervisor monitored the interviews/measurements, checked the forms, and maintained and calibrated the equipment. The area of the twelve schools was divided into three clusters to facilitate data collection and supervision. The enumerators were rotated between clusters and schools to prevent bias. The methods used were based on the NCRSP study. The forms were pretested and adapted. The ages of the children were derived from the census questionnaires or from the school register.
Morbidity. Information on morbidity was collected monthly in the first year and bi-monthly in the second year of the study using a structured illness questionnaire and physical inspection if the child was ill and remained at home. The enumerator visited four to five households daily to carry out an interview with the caregiver, usually the mother. Any illness or symptom the child experienced on the day of the interview and/or the previous week (i.e., 8 days) and the number of days the disease/symptom had been present were recorded. The questionnaire contained a list of names of local diseases that were commonly known to the respondents, such as measles, chicken pox, etc. and clusters of signs and symptoms based on locally familiar terms and related primarily to respiratory, gastrointestinal, skin and other common diseases. Prior to the data collection, the form was translated into Kiembu, the local language that was used to carry out the interview, and the terms to be used for the interview were standardised. The form was in English and was also filled out in English to facilitate quality checks and data entry. If children were found sick at home during the interview, they were examined briefly by a “morbidity

ANIMAL SOURCE FOODS AND MORBIDITY
87
enumerator” and if deemed necessary, according to established guidelines, were visited by the supervising nurse or a physician. Seriously ill children were referred for treatment to the local health centre. A pre-test was carried out to familiarise the enumerators with the data collection techniques and to modify the form in a way to assure the collection of accurate and reliable data and to determine their level of knowledge about illnesses.
Quality control measures included intensive preliminary and ongoing training of enumerators by a physician and a nurse, close supervision of enumerators, reinterviews (on 15% of the children) and routine check of all forms. Further, a thorough physical examination was done on a sub-sample of 25% of the children every month by the enumerators either during their home visits or at school when carrying out anthropometric measurements, and any illness findings were compared to the morbidity reports from that same week on the same child during the morbidity home visit. Extensive training was carried out about the illnesses they would encounter and the recognition of signs and symptoms of illnesses. All children were dewormed with a single dose of mebendazole before the intervention and twice more in the course of the study. Treatments of the sick children at home or at a health facility were recorded whenever possible.
Episodes of illnesses were defined as periods for which the child was reported to have the symptoms listed in Table 4.2. Chronic conditions such as cerebral palsy, retardation and heart disease were noted but excluded for statistical analyses.
Table 4.2 Definition of diseases and indicators of illness severity
Symptoms
Disease Upper respiratory tract infection Common cold, yellow nasal discharge, sore throat, deep repeated
cough, pus on tonsils or throat, croupy crowing cough, ear discharge, pain within the ear or hearing loss
Eye infection Discharge from eye and/or eye was red Skin infection Skin rash, sores/boils, scabies or ringworm Gastrointestinal disease Diarrhoea (passage of three or more watery stools per 24 hours),
stool with blood or pus, vomiting and stomach ache Urinary system problem Pain when passing urine, increased urination, urine with blood or
ulcers/discharge from the genital area Malaria Fever, chills, joint pains, headache, diarrhoea, vomiting, abdominal
pain and cough Other infectious diseases Measles, mumps, chicken pox, whooping cough, pneumonia, typhoid
fever, meningitis and tuberculosis Indicators of illness severity Fever, chills, reduced appetite or confinement to bed
Anthropometry. Weight was measured every month in the first year and every other month in the second year, whereas height was measured every four months in the first year and every eight months in the second year following recommended protocols26,27. The methods of the anthropometric measurements have been described earlier by Grillenberger et al.28. The EpiInfo2000 program (version 1.0.5, Centers for Disease Control and Prevention, Atlanta, GA),

CHAPTER 4
88
which uses the CDC/WHO 1977/1985 reference curves for age, sex, height and weight29, was used to transform the height and weight measurements into sex- and age-specific Z-scores: height-for-age Z-score (HAZ) and weight-for-height Z-score (WHZ). For girls aged > 10 years (or > 137 cm) and boys aged > 11.5 (or > 145 cm), WHZ could not be calculated due to lack of reference data in the EpiInfo program (n 13).
Food Intake. A semi quantitative 24-hours recall method was used to estimate the daily household energy and nutrient intake for the study children, which was administered at the child’s home by trained enumerators. Intakes were measured at baseline, i.e., an average of three months prior to the food supplementation and during the intervention period where twenty-two visits were carried out per child over a period of thirty-two months. All days of the week except Fridays and Saturdays (because no food intake data was collected on Saturdays and Sundays) were proportionately included in the survey to account for any day-of-the-week effects on food and/or nutrient intakes. Food models and local plastic dishes and utensils were used to estimate the portion sizes. Details of the food intake measurements have been described in detail by Murphy et al.30. The resulting list of foods and portion sizes was converted to daily nutrient intakes using SAS (SAS Version 8, SAS Institute, Cary, NC, USA). The food composition data used came from the International Minilist that was developed for the WorldFood Dietary Assessment System, version 2.024. As necessary, the food composition databases were updated to include newer foods available in the area, new levels of fortification for some foods and a 50% lower vitamin A activity for provitamin A carotenoids31. Mothers of the study children were encouraged to maintain the usual home diet for the children in the study.
Demographic information. Data on the socio-economic status of each family was collected before the intervention. A socio-economic status score was derived from the following variables: land ownership and area cultivated, number and type of livestock owned, source and amount of income, income from food products, type and income from cash crops, expenditures, household possessions, the construction of the house and the type of fuel used for cooking. Social factors included church and Sunday school attendance, membership in self-help groups or organizations. An index of “modernity” included use of bank, telephone and/or post office, ownership of National Social Security Fund card, credit from cooperative, a bank account, household adoption of agricultural or other improvements or innovations and whether household members listened to radio/TV and/or read the newspaper at least once a week. The use of an internal or external kitchen was included as a separate variable in the analyses of acute respiratory tract infection for exposure to a smoke-filled environment6.
Information derived from data enquired in the baseline census included a crowding score (number of people living in the house by the number of rooms in the house) and the number of young siblings (children living in the household aged eight months to eight years).
All forms were checked on a daily basis by the supervisors in the field to allow immediate revisits for gross errors or missing data. Forms were collected twice per week from the field. After additional cleaning, the forms were then entered by scanning using TELEform (Cardiff
ANIMAL SOURCE FOODS AND MORBIDITY
89
Software, Inc., Vista, CA) or manually into a database (Access; Microsoft, Redmond, WA), range-checked by computer, and printed out to enable checking for errors against the forms.
Statistical analysis
Statistical analysis was performed using SAS (version 8; SAS Institute Inc, Cary, NC). Logistic regression models were used to evaluate the effect of food supplementation on morbidity, where the proportion of sick children (period prevalence) was treated as dependent variable. The main independent variable was the assigned food supplement, coded by 0/1 dummy variables. Further variables with potential confounding effect (sex, socio-eonomic status, baseline age, baseline WHZ, baseline HAZ, crowding, younger siblings, total energy intake and use of an external kitchen for upper respiratory tract infection) were also included as independent variables. Because each child contributed information at several observation dates, a child-specific effect was incorporated in the models in order to account for individual variability. The child effect was modelled as a normally distributed random intercept with mean zero in the logistic model. Contributions of all other variables, including school effect, where treated as fixed effects. Categorical independent variables were coded as centred dummy variables, such that the sum of dummy parameters adds to zero for each variable. To guarantee the non-negativity of s, the standard deviation of the random intercept, the logarithm of s was estimated instead. In order to allow a clear identification of the random intercept in the logistic model, only children with at least four individual observations were included in the analysis for period prevalence. All estimations were done by a maximum-likelihood procedure following Pinheiro and Bates32. The SAS procedure NLMIXED was used for these computations. Estimated parameter values were tested for significance (difference from zero) by an approximate t-test. P values < 0.05 were regarded as statistically significant. Odds ratios, calculated as exponential of the parameter estimate, and their 95% confidence intervals were used to describe the effect of supplementation on period prevalence. Confidence intervals for the odds ratio (logistic regression) were calculated by using the estimated covariance matrix and the approximate normality of the linear predictor in the models.
RESULTS
The trial profile is given in Figure 2.1. Of the 554 children randomised to the three food supplements and the control group, data were not included in the analysis from seven children who left before the feeding intervention started, fourteen who were handicapped, thirty-three who were siblings and from two children in households that were not co-operative. Thus data were available for analyses for 498 children. Data from children who changed the food supplement due to food preferences (n 17) or change of school (n 25) were only included in the analysis for the time period when they ate the originally assigned food supplement. Data of one child who died during the study due to illness was included up to the time of her death. In 63% of the morbidity interviews, the mother was the respondent, in 9% the father, in 11% a

CHAPTER 4
90
grandparent, in 9% a sibling and in 7% somebody else living in the home. Complete data on morbidity (i.e., fourteen observation points) was available for 71.3% of the children, 92% had at least 50% of the observation points (i.e., seven), 4% had less than three observation points, and 2% had no valid data points (five children in the meat group and five children in the milk group).
The amount of food supplement consumed as a proportion of the total amount of food supplement provided was similar for the supplementation groups: 82.1% for the meat supplement, 80.1% for the milk supplement (79.1% for the milk itself), and 80.4% for the energy supplement. Increases in total intake of vitamin B12 were highest for the meat and milk group; increases in total intake of protein, available iron and available zinc were highest for the meat group and increases in total intake of vitamin A, riboflavin and calcium were highest for the milk group.
Descriptive statistics of the baseline values of the covariates used in the statistical analysis for the study groups and overall are presented in Table 4.3. The prevalence of stunting was 31.9% for boys and 24.6% for girls, whereas more girls (n 21) were wasted than boys (n 12). Due to the small number of cases of urinary system problems (n 4) and other infectious diseases (measles, n 4; mumps, n 14; chicken pox, n 10; typhoid fever, n 2; meningitis, n 2; pneumonia, n 21), these were not included in the multivariate analyses. Whooping cough and tuberculosis were not observed in the children.
In Tables 4.4 and 4.5 are presented the results of the logistic regression analysis for the effect of food supplementation on period prevalence (predicted probabilities and relative risks). There were no statistically significant effects of any of the food supplements, nor were there significant differences between the food supplements. However, there was the trend that the predicted risks were lowest for children receiving the milk supplement compared to those receiving the meat or energy supplement or no supplement (control group) for upper respiratory tract infection, skin infection and gastrointestinal disease. The predicted risks of eye infections and fever, chills, and confinement to bed were also lower for children receiving the milk supplement compared to those receiving the energy or no supplement and to those receiving the meat or energy supplement, respectively. The predicted risks of malaria and most of the indicators of illness severity were lower in children receiving no supplement compared to all other children. Children receiving the meat supplement had lower predicted risks of eye infection and reduced appetite compared to all other children and lower risks of gastrointestinal disease compared to the children receiving the energy or no supplement.
In Table 4.6 are presented the odds ratios corresponding to a one-unit change and p values of the significant covariates of the logistic regression models for predicted period prevalence.

ANIMAL SOURCE FOODS AND MORBIDITY
91
Table 4.3 Summary of baseline values of the covariates used in statistical analysis
(Values are means and standard deviations or n (%))
Meat group Milk group Energy group Control group Overall
Mean SD Mean SD Mean SD Mean SD Mean SD
Age, mo n 115 n 130 n 128 n 111 n 484 93.5 14.8 87.8 14.8 86.0 14.1 87.4 14.4 88.6 14.7 HAZ n 115 n 130 n 128 n 110 n 483 -1.5 1.0 -1.3 1.0 -1.4 1.0 -1.3 1.1 -1.4 1.0 Stunted # 38 (33.0) 37 (28.5) 30 (23.4) 32 (29.1) 137 (28.4) WHZ n 111 n 126 n 124 n 110 n 471 -0.5 0.8 -0.5 0.7 -0.4 0.8 -0.4 0.8 -0.5 0.74 Wasted # 11 (9.9) 8 (6.4) 8 (6.5) 8 (7.3) 35 (7.4) SES score n 120 n 130 n 129 n 115 n 494 1.0 0.4 0.8 0.4 0.9 0.4 0.9 0.5 0.9 0.4 Crowding n 119 n 126 n 129 n 115 n 489 2.6 1.6 2.2 1.1 2.3 1.1 2.4 1.2 2.3 1.2 Use of external kitchen n 120 n 130 n 129 n 115 n 494 102 (85.0) 104 (80.0) 100 (77.5) 93 (80.9) 399 (80.8) Young siblings n 110 n 122 n 124 n 104 n 460 1.7 0.8 1.7 0.7 1.7 0.7 1.7 0.8 1.7 0.7 Total energy intake n 120 n 130 n 130 n 115 n 495 kcal 2001 385 1877 360 1851 360 1775 322 1877 365 kJ 8372 1610 7855 1504 7748 1507 7427 1348 7853 1529 Boys n 120 n 132 n 130 n 116 n 498 60 (50.0) 70 (53.0) 66 (50.8) 61 (52.6) 257 (51.6)
HAZ, height-for-age Z-score; WHZ, weight-for-height Z-score; SES, socio-economic status. # Stunting and wasting were defined as HAZ < -2 and WHZ < -2, respectively.
Baseline age was a significant negative covariate for predicted period prevalence of upper respiratory tract infection and reduced appetite. The odds that an older child develops upper respiratory tract infection or reduced appetite decreases 1.5% and 1.2%, respectively, over that of a younger child with each month of age. The odds of developing skin infections is lower in boys than in girls. Total energy intake is a negative covariate of malaria and all indicators of illness severity, i.e., the higher the energy intake, the lower the disease risk. For all variables at least one of the schools was a significant covariate, indicating that there is a difference in predicted period prevalence between certain schools.

CHAPTER 4
92
95%
CI
10.5
4, 5
8.69
0.37
, 5.2
0
3.70
, 34.
14
0.76
, 30.
67
1.93
, 23.
51
3.18
, 23.
45
1.50
, 18.
55
2.62
, 24.
0
3.63
, 22.
10
Ove
rall
(n 4
11)
%
29.0
4
1.41
12.5
2
5.50
7.21
9.12
5.57
8.43
9.37
95%
CI
11.1
3, 6
0.65
0.42
, 6.3
2
3.89
, 35.
32
0.90
, 35.
33
0.95
, 15.
10
2.19
, 18.
29
1.20
, 16.
34
2.38
, 23.
0
2.81
, 18.
73
Con
trol g
roup
(n
96)
%
30.5
2
1.66
12.9
3
6.59
3.97
6.61
4.65
7.86
7.46
95%
CI
10.3
1, 5
8.80
0.38
, 5.8
8
3.67
, 34.
26
0.95
, 36.
81
2.09
, 25.
96
3.72
, 27.
39
1.49
, 19.
34
3.21
, 28.
87
4.16
, 25.
44
Ene
rgy
grou
p (n
113
)
%
28.8
3
1.52
12.3
6
6.97
7.96
10.7
7
5.67
10.4
0
10.8
5
95%
CI
9.69
, 56.
76
0.32
, 5.1
1
3.31
, 31.
53
0.55
, 24.
80
2.09
, 25.
96
3.05
, 23.
10
1.36
, 17.
48
2.41
, 22.
96
3.61
, 22.
45
Milk
gro
up
(n 1
08)
%
27.2
9
1.31
11.1
5
4.08
8.24
8.86
5.12
7.91
9.44
95%
CI
10.6
8, 5
9.62
0.27
, 5.1
8
4.15
, 36.
95
0.65
, 28.
52
2.76
, 31.
31
3.78
, 27.
50
1.89
, 23.
23
2.35
, 22.
92
3.78
, 23.
70
Mea
t gro
up
(n 9
4)
%
29.5
8
1.21
13.7
5
4.85
10.2
0
10.8
7
7.09
7.80
9.95
Ta
ble
4.4
Effe
ct o
f mea
t, m
ilk a
nd e
nerg
y su
pple
men
ts o
n pe
riod
prev
alen
ce: p
redi
cted
pro
babi
litie
s #
(V
alue
s ar
e m
eans
and
95%
CI)
U
pper
resp
irato
ry tr
act
infe
ctio
n
E
ye in
fect
ion
S
kin
infe
ctio
n
G
astro
inte
stin
al d
isea
se
M
alar
ia
In
dica
tors
of i
llnes
s se
verit
y
Fe
ver
C
hills
R
educ
ed a
ppet
ite
C
onfin
emen
t to
bed
#
From
logi
stic
regr
essi
on a
naly
sis.
Mod
els
wer
e co
ntro
lled
for s
ex, b
asel
ine
age,
bas
elin
e H
AZ
and
WH
Z, s
choo
l, so
cioe
cono
mic
sta
tus,
cro
wdi
ng, t
otal
ene
rgy
inta
ke, a
nd y
oung
si
blin
gs. U
pper
resp
irato
ry tr
act i
nfec
tion
was
add
ition
ally
adj
uste
d fo
r use
of a
n ex
tern
al k
itche
n. N
one
of th
e di
ffere
nces
bet
wee
n fo
od s
uppl
emen
ts w
as s
tatis
tical
ly s
igni
fican
t.
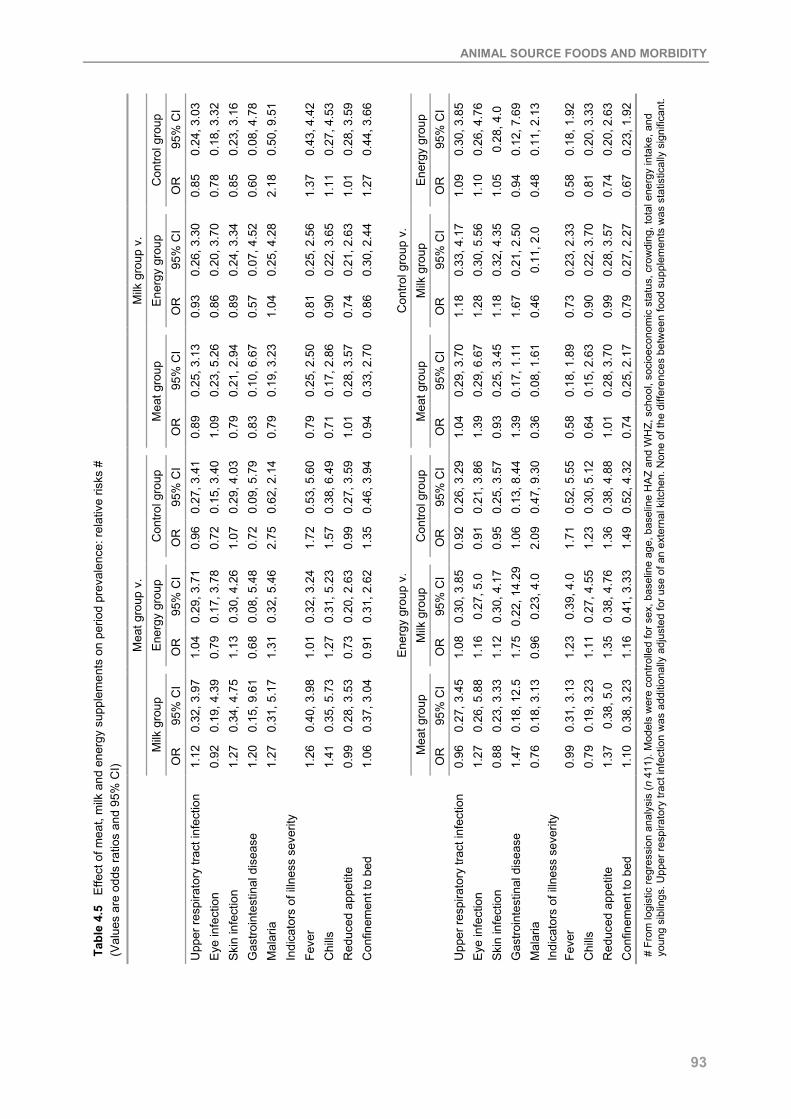
ANIMAL SOURCE FOODS AND MORBIDITY
93
95%
CI
0.24
, 3.0
3 0.
18, 3
.32
0.23
, 3.1
6 0.
08, 4
.78
0.50
, 9.5
1
0.43
, 4.4
2 0.
27, 4
.53
0.28
, 3.5
9 0.
44, 3
.66
95%
CI
0.30
, 3.8
5 0.
26, 4
.76
0.28
, 4.0
0.
12, 7
.69
0.11
, 2.1
3
0.18
, 1.9
2 0.
20, 3
.33
0.20
, 2.6
3 0.
23, 1
.92
Con
trol g
roup
O
R
0.85
0.
78
0.85
0.
60
2.18
1.37
1.
11
1.01
1.
27
Ene
rgy
grou
p O
R
1.09
1.
10
1.05
0.
94
0.48
0.58
0.
81
0.74
0.
67
95%
CI
0.26
, 3.3
0 0.
20, 3
.70
0.24
, 3.3
4 0.
07, 4
.52
0.25
, 4.2
8
0.25
, 2.5
6 0.
22, 3
.65
0.21
, 2.6
3 0.
30, 2
.44
95%
CI
0.33
, 4.1
7 0.
30, 5
.56
0.32
, 4.3
5 0.
21, 2
.50
0.11
, 2.0
0.23
, 2.3
3 0.
22, 3
.70
0.28
, 3.5
7 0.
27, 2
.27
Ene
rgy
grou
p O
R
0.93
0.
86
0.89
0.
57
1.04
0.81
0.
90
0.74
0.
86 Milk
gro
up
OR
1.
18
1.28
1.
18
1.67
0.
46
0.
73
0.90
0.
99
0.79
95%
CI
0.25
, 3.1
3 0.
23, 5
.26
0.21
, 2.9
4 0.
10, 6
.67
0.19
, 3.2
3
0.25
, 2.5
0 0.
17, 2
.86
0.28
, 3.5
7 0.
33, 2
.70
95%
CI
0.29
, 3.7
0 0.
29, 6
.67
0.25
, 3.4
5 0.
17, 1
.11
0.08
, 1.6
1
0.18
, 1.8
9 0.
15, 2
.63
0.28
, 3.7
0 0.
25, 2
.17
Milk
gro
up v
. M
eat g
roup
O
R
0.89
1.
09
0.79
0.
83
0.79
0.79
0.
71
1.01
0.
94
Con
trol g
roup
v.
Mea
t gro
up
OR
1.
04
1.39
0.
93
1.39
0.
36
0.
58
0.64
1.
01
0.74
95%
CI
0.27
, 3.4
1 0.
15, 3
.40
0.29
, 4.0
3 0.
09, 5
.79
0.62
, 2.1
4
0.53
, 5.6
0 0.
38, 6
.49
0.27
, 3.5
9 0.
46, 3
.94
95%
CI
0.26
, 3.2
9 0.
21, 3
.86
0.25
, 3.5
7 0.
13, 8
.44
0.47
, 9.3
0
0.52
, 5.5
5 0.
30, 5
.12
0.38
, 4.8
8 0.
52, 4
.32
Con
trol g
roup
O
R
0.96
0.
72
1.07
0.
72
2.75
1.72
1.
57
0.99
1.
35
Con
trol g
roup
O
R
0.92
0.
91
0.95
1.
06
2.09
1.71
1.
23
1.36
1.
49
95%
CI
0.29
, 3.7
1 0.
17, 3
.78
0.30
, 4.2
6 0.
08, 5
.48
0.32
, 5.4
6
0.32
, 3.2
4 0.
31, 5
.23
0.20
, 2.6
3 0.
31, 2
.62
95%
CI
0.30
, 3.8
5 0.
27, 5
.0
0.30
, 4.1
7 0.
22, 1
4.29
0.
23, 4
.0
0.
39, 4
.0
0.27
, 4.5
5 0.
38, 4
.76
0.41
, 3.3
3
Ene
rgy
grou
p O
R
1.04
0.
79
1.13
0.
68
1.31
1.01
1.
27
0.73
0.
91 Milk
gro
up
OR
1.
08
1.16
1.
12
1.75
0.
96
1.
23
1.11
1.
35
1.16
95%
CI
0.32
, 3.9
7 0.
19, 4
.39
0.34
, 4.7
5 0.
15, 9
.61
0.31
, 5.1
7
0.40
, 3.9
8 0.
35, 5
.73
0.28
, 3.5
3 0.
37, 3
.04
95%
CI
0.27
, 3.4
5 0.
26, 5
.88
0.23
, 3.3
3 0.
18, 1
2.5
0.18
, 3.1
3
0.31
, 3.1
3 0.
19, 3
.23
0.38
, 5.0
0.
38, 3
.23
Mea
t gro
up v
. M
ilk g
roup
O
R
1.12
0.
92
1.27
1.
20
1.27
1.26
1.
41
0.99
1.
06
Ene
rgy
grou
p v.
M
eat g
roup
O
R
0.96
1.
27
0.88
1.
47
0.76
0.99
0.
79
1.37
1.
10
Tabl
e 4.
5 E
ffect
of m
eat,
milk
and
ene
rgy
supp
lem
ents
on
perio
d pr
eval
ence
: rel
ativ
e ris
ks #
(V
alue
s ar
e od
ds ra
tios
and
95%
CI)
Upp
er re
spira
tory
trac
t inf
ectio
n E
ye in
fect
ion
Ski
n in
fect
ion
Gas
troin
test
inal
dis
ease
M
alar
ia
Indi
cato
rs o
f illn
ess
seve
rity
Fev
er
Chi
lls
Red
uced
app
etite
C
onfin
emen
t to
bed
Upp
er re
spira
tory
trac
t inf
ectio
n E
ye in
fect
ion
Ski
n in
fect
ion
Gas
troin
test
inal
dis
ease
M
alar
ia
Indi
cato
rs o
f illn
ess
seve
rity
Fev
er
Chi
lls
Red
uced
app
etite
C
onfin
emen
t to
bed
# Fr
om lo
gist
ic re
gres
sion
ana
lysi
s (n
411
). M
odel
s w
ere
cont
rolle
d fo
r sex
, bas
elin
e ag
e, b
asel
ine
HA
Z an
d W
HZ,
sch
ool,
soci
oeco
nom
ic s
tatu
s, c
row
ding
, tot
al e
nerg
y in
take
, and
yo
ung
sibl
ings
. Upp
er re
spira
tory
trac
t inf
ectio
n w
as a
dditi
onal
ly a
djus
ted
for u
se o
f an
exte
rnal
kitc
hen.
Non
e of
the
diffe
renc
es b
etw
een
food
sup
plem
ents
was
sta
tistic
ally
sig
nific
ant.

CHAPTER 4
94
Table 4.6 Covariates of logistic regression models for period prevalence #
Disease/Indicator of illness severity Covariate OR ‡ p
Upper respiratory tract infection Baseline age, mo 0.9850 0.0003 Skin infection Sex (Boys v. girls) 0.8845 0.0241 Baseline HAZ 1.1287 0.0430 Malaria Total energy intake, 100 kcal 0.9529 0.0053 Fever Total energy intake, 100 kcal 0.9566 0.0044 Young siblings, n 0.8552 0.0192 Chills Total energy intake, 100 kcal 0.9179 <0.0001 Confinement to bed Total energy intake, 100 kcal 0.9419 0.0001 Reduced appetite Total energy intake, 100 kcal 0.9307 <0.0001 Baseline age, mo 0.9884 0.0288
# Presented are only those covariates that were statistically significant (p < 0.05). All models were controlled for sex, baseline age, baseline HAZ and WHZ, school, socioeconomic status, crowding, total energy intake, and young siblings. Upper respiratory tract infection was additionally adjusted for use of an external kitchen. ‡ Odds ratio corresponding to a one unit change in the respective covariate.
DISCUSSION
This study documents that the provision of food supplements containing animal source foods does not reduce the occurrence of the most common diseases in children of school age. Although not statistically significant, there was the tendency that the predicted risks for period prevalence of most diseases and indicators of illness severity were lower in children receiving the milk supplement compared to those receiving an isoenergetic supplement containing meat or no animal source foods or those who did not receive any food supplement (control).
There was a high prevalence of micronutrient deficiencies in the study children. At baseline, ~70% and ~20% of children had moderate and severe vitamin A deficiency, respectively, and almost 50% and ~65% of children had low haemoglobin and zinc levels, respectively33. It was therefore expected that through the provision of foods containing high amounts of bioavailable micronutrients, such as meat and milk, their poor nutritional status, especially that of iron, zinc and vitamin A improves and as a consequence their susceptibility to infections as well as the prevalence of severe diseases reduces. That we did not find a statistically significant effect of any of the food supplements on period prevalence may be a result of the lack of improvement in micronutrient status of the children; only the plasma levels of vitamin B12 improved significantly after one and two years of supplementation33,34. It is not likely that the duration of feeding for two years was too short to see any health benefits in the children. Although the amounts of micronutrients provided by the food supplements were much lower than those usually provided in single dose pharmanutrient supplements, we were able to see an effect of the meat supplement on cognitive development35 and on lean body mass of the children28.
Some studies showed that improving the vitamin A status of children reduces morbidity and mortality8. Milk is a good source of vitamin A and the milk supplement provided the highest amounts of vitamin A of all food supplements. However, the energy supplement contained higher amounts of fat that was fortified with retinol (Kimbo, fortified with 124 IU retinol/g,

ANIMAL SOURCE FOODS AND MORBIDITY
95
manufactured by Unilever Kenya Ltd) than the other food supplements and also their home vitamin A intake during the intervention period was highest. Therefore, our findings that the supplement with milk seemed to show beneficial effects on morbidity, although not statistically significant, cannot easily be attributed to vitamin A intake. But besides providing nutrients important for health, milk also contains substances such as insulin-like growth factors, epidermal growth factor, and nucleotides that may enhance immune function and reduce severity of infection36. As cow’s milk provides immune factors for the calf, like breast milk does for human babies, it might be that there is a positive relation of drinking cow’s milk and human immune function.
Children whose diet mainly consists of tubers and cereals often suffer from multiple micronutrient deficiencies, like the study children, but thus far, not many studies have been carried out to evaluate the effect of multiple micronutrient interventions on morbidity. A study where biscuits fortified with iron, iodine and β-carotene were given to South-African school-aged children showed a decrease in respiratory and diarrhoea-related illnesses37.
Ascorbic acid intake also plays a role in immunity and although the food supplements only provided 3-6 mg ascorbic acid, intake of ascorbic acid does not seem to be a problem in the study area. None of the children had average daily intakes below the estimated average requirements of 22 mg; the mean intake was 120 mg (range 31 - 343 mg). However these are averages over the whole study period and there are great seasonal fluctuations in fruit consumption, which are the main source of ascorbic acid.
Crowded living conditions did not seem to have an influence on the prevalence of diseases in our analyses, and a higher number of younger siblings was even associated with lower prevalences of fever. This is contrary to what would have been expected because these factors might contribute to a higher transmission of acute infectious diseases and are also linked to household hygiene, which plays an important role in the prevention of disease. In the study area 93% of households possess their own latrine on the compound. Problematic is the scarcity of clean drinking water; 65% of households reported their main water source to be from the river. The water is rarely boiled before use for drinking and could therefore be an important source of disease transmission such as typhoid fever, which is prevalent especially in the younger children. Poor hygiene is also related to infections with helminths, such as giardia lamblia. People in the study area often cook inside the house and a smoked-filled room can be a serious irritant and risk factor for respiratory infection6; however, the use of an external kitchen did not seem to be an important factor in our analyses of upper respiratory tract infection.
We believe that the methods we used were suitable to examine the effect of the food supplements on child morbidity. Mothers have been found to report sickness of their children quite accurately38. Children differ in their immune status and susceptibility to disease and therefore correlations of disease events were considered by including a random child effect in the statistical analyses. The statistical analyses were controlled for age, sex, and total daily energy intake of the children, because there were differences between the groups, and for other

CHAPTER 4
96
factors that influence morbidity besides nutrition. It is likely that we underestimated the morbidity rates because we only measured one week out of four in the first year and one week out of eight in the second year. However time sampling over two years and over all seasons should have given a fair estimate of morbidity, and most importantly it was the same for all children in all supplementation and control groups. Children who were found to be seriously ill were examined by the project nurse and if necessary transferred to a health centre. Children who were anaemic at the beginning of the study were also transferred to the health centre for treatment. This might have further reduced the prevalence and recurrence of diseases, which makes the estimates of morbidity more conservative than would be expected under less optimal conditions. However, for purposes of group comparisons it is not necessary to determine the disease prevalence exactly.
Sample size calculations of the study were based on the main cognitive test (Raven’s Progressive Matrices), which was considered the primary outcome of the study. However, post hoc power calculations revealed that the study was adequately powered to detect a statistically significant (p < 0.05) relative difference of 30% in upper respiratory tract infection, which was considered the primary morbidity outcome, between the supplementation groups and the control group.
From the results we conclude that the food supplements containing animal source foods we provided in our study did not appear to reduce the prevalence of the common diseases in the study children. Because the consumption of milk seemed to have a positive effect on morbidity, this should be investigated further in similar settings.
REFERENCES 1. Chandra RK (1999) Nutrition and immunology: from the clinic to cellular biology and back again. P Nutr Soc 58:
681-3. 2. Stephenson CB (1999) Burden of infection on growth failure. J Nutr 129: 534S-8S. 3. ACC/SCN (2000) Fourth report on the world nutrition situation. Geneva: ACC/SCN with IFPRI. 4. Neumann CG, Bwibo NO & Sigman M (1992) Final report phase II: Functional implications of malnutrition,
Kenya Project, Human Nutrition Collaborative Research Support Program: Diet quantity and quality, USAID, Office of nutrition.
5. Murphy SP, Calloway DH & Beaton GH (1995) Schoolchildren have similar predicted prevalences of inadequate intakes as toddlers in village populations in Egypt, Kenya, and Mexico. Eur J Clin Nutr 49: 647-57.
6. Ballard TJ & Neumann CG (1995) The effects of malnutrition, parental literacy and household crowding on acute lower respiratory infections in young Kenyan children. J Trop Pediatrics 41 (1): 8-13.
7. Filteau SM & Tomkins AM (1994) Micronutrients and tropical infections. T Roy Soc Trop Med H 88: 1-3 & 26. 8. Beaton GH, Martorell R, Aronson KJ, et al. (1993) Effectiveness of vitamin A supplementation in the control of
young child morbidity and mortality in developing countries. ACC/SCN State-of-the-Art Series, Nutrition Policy Discussion Paper No. 13. Geneva: ACC/SCN.
9. Glasziou PP & Mackerras DE (1993) Vitamin A supplementation in infectious diseases: a meta-analysis. Brit Med J 306: 366-70.
10. Ghana VAST Study Team (1993) Vitamin A supplementation in northern Ghana: effects on clinic attendances, hospital admissions and child mortality. Lancet 342: 7-12.
11. Shankar AH, Genton B, Semba RD, et al. (1999) Effect of vitamin A supplementation on morbidity due to Plasmodium falciparum in young children in Papua New Guinea: a randomised trial. Lancet 354: 203-9.
12. Barclay AJG, Foster A & Sommer A (1987) Vitamin A supplements and mortality related to measles: a randomised clinical trial. Brit Med J 294: 294-6.
ANIMAL SOURCE FOODS AND MORBIDITY
97
13. Hussey GD & Klein MA (1990) A randomized, controlled trial of vitamin A in children with severe measles. N Engl J Med 323: 160-4.
14. Sommer A & West KP (1996) Vitamin A deficiency. Health, survival, and vision. New York: Oxford University Press.
15. Barreto ML, Santos LMP, Assis AMO, et al. (1994) Effect of vitamin A supplementation on diarrhoea and acute lower-respiratory-tract infections in young children in Brazil. Lancet 344: 228-31.
16. Bhandari N, Bhan MK & Sazawal S (1994) Impact of massive dose of vitamin A given to preschool children with acute diarrhoea on subsequent respiratory and diarrhoeal morbidity. Brit Med J 309: 1404-7.
17. Rahmathullah L, Underwood BA, Thulasiraj RD & Milton RC (1991) Diarrhea, respiratory infections, and growth are not affected by a weekly low-dose vitamin A supplement: a masked, controlled field trial in children in southern India. Am J Clin Nutr 54: 568-77.
18. The Vitamin A and Pneumonia Working Group (1995) Potential interventions for the prevention of childhood pneumonia in developing countries: a meta-analysis of data from field trials to assess the impact of vitamin A supplementation on pneumonia morbidity and mortality. B World Health Organ 73: 609-19.
19. Bhutta ZA, Black RE, Brown KE, et al. (1999) Prevention of diarrhea and pneumonia by zinc supplementation in children in developing countries: pooled analysis of randomized controlled trials. Zinc Investigators' Collaborative Group. J Pediatr 135 (6): 689-97.
20. Bates CJ, Evans PH, Dardenne M, et al. (1993) A trial of zinc supplementation in young rural Gambian children. Br J Nutr 69: 2443-55.
21. Shankar AH, Genton B, Baisor M, et al. (2000) The influence of zinc supplementation on morbidity due to Plasmodium falciparum: a randomized trial in preschool children in Papua New Guinea. Am J Trop Med Hyg 62 (6): 663-9.
22. Tomkins A & Watson F (1989) Malnutrition and infection: a review, ACC/SCN State-of-the-art series nutrition policy discussion paper no. 5. Geneva: ACC/SCN.
23. van Stuijvenberg ME (2001) A biscuit fortified with iron, iodine and ß-carotene as a strategy to address micronutrient deficiencies in primary school children. Doctoral thesis, University of Cape Town.
24. Calloway DH, Murphy SP, Bunch S & Woerner J (1994) WorldFood 2 Dietary Assessment System. Available at http://www.fao.org/infoods/software_worldfood_en.stm (accessed 1 April 2005).
25. Murphy SP, Beaton GH & Calloway DH (1992) Estimated mineral intakes of toddlers: predicted prevalence of inadequacy in village populations in Egypt, Kenya, and Mexico. Am J Clin Nutr 56: 565-72.
26. Lohman TG, Roche AF & Martorell R (1988) Anthropometric standardization reference manual. Champaign: Human Kinetics Books.
27. WHO (1995) Physical status: the use and interpretation of anthropometry. Report of a WHO Expert Committee. World Health Organ Tech Rep Ser 854: 1-452.
28. Grillenberger M, Neumann CG, Murphy SP, et al. (2003) Food supplements have a positive impact on weight gain and the addition of animal source foods increases lean body mass of Kenyan schoolchildren. J Nutr 133 (11): 3957S-64S.
29. Dibley MJ, Goldsby JB, Staehling NW & Trowbridge FL (1987) Development of normalized curves for the international growth reference: historical and technical considerations. Am J Clin Nutr 46: 736-48.
30. Murphy SP, Gewa C, Liang L-J, Grillenberger M, Bwibo NO & Neumann CG (2003) School snacks containing animal source foods improve dietary quality for children in rural Kenya. J Nutr 133 (11): 3950S-6S.
31. Institute of Medicine (2001) Dietary Reference Intakes for vitamin A, vitamin K, arsenic, boron, chromium, copper, iodine, iron, manganese, molybdenum, nickel, silicon, vanadium and zinc. Washington, DC: National Academy Press.
32. Pinheiro JC & Bates DM (1995) Approximations to the Log-Likelihood Function in the Nonlinear Mixed-Effects-Model. J Comput Graph Stat 4: 12-35.
33. Siekmann JH, Allen LH, Bwibo NO, Demment MW, Murphy SP & Neumann CG (2003) Kenyan school children have multiple micronutrient deficiencies, but increased plasma vitamin B-12 is the only detectable micronutrient response to meat or milk supplementation. J Nutr 133 (11): 3972S-80S.
34. Reid ED, Neumann CG, Siekmann JH, Bwibo NO, Murphy SP & Allen LH (2002) Supplementation with beef or milk markedly improves vitamin B12 status of Kenyan schoolers. Global Livestock CRSP. Research Brief 02–04-CNP. Davis: University of California.
35. Whaley SE, Sigman M, Neumann C, et al. (2003) The impact of dietary intervention on the cognitive development of Kenyan school children. J Nutr 133 (11): 3965S-71S.
36. Haskell MJ & Brown KH (1997) The nutritional value of animal products and their role in the growth and development of young children in developing countries. Unpublished review. Davis: University of California.
37. Stuijvenberg van ME, Kvalsvig JD, Faber M, Kruger M, Kenoyer DG & Benadé AJS (1999) Effect of iron-, iodine-, and ß-carotene-fortified biscuits on the micronutrient status of primary school children: a randomized controlled trial. Am J Clin Nutr 69: 497-503.

CHAPTER 4
98
38. Kalter HD, Gray RH, Black RE & Gultiano SA (1991) Validation of the diagnosis of childhood morbidity using maternal health interviews. Int J Epidemiol 20: 193-8.

55
High prevalence of inadequate iron intake in rural Kenyan school children
Monika Grillenberger, Charlotte G. Neumann, Suzanne P. Murphy, Nimrod O. Bwibo,
Hans Verhoef, Joseph G.A.J. Hautvast Submitted for publication
CHAPTER 5
100
ABSTRACT
Objective: To estimate the amount of iron absorbed from the habitual diet of rural Kenyan school children and to determine the prevalence of inadequate iron intake.
Design: An algorithm of iron absorption was used for meal-based analyses of food intake data obtained over a period of 34 months from children participating as controls in a feeding intervention.
Setting/subjects: School children aged 6-9 years from a rural area in Embu District, Eastern Province, Kenya (n 78).
Results: Of the iron ingested from different meals, it was estimated that absorption was reduced by 35-78%, 20-57%, and 11-18% due to the presence of phytates, polyphenols, and calcium, respectively, in these meals. The increase in iron absorption due to the presence of ascorbic acid and meat in the same meal was 14-139% and 0-9%, respectively. The fractional absorption of non-haem iron ranged from 5.3% for dinner to 13% for the afternoon meal, whilst the fractional absorption of haem iron ranged from 28.5% at lunch to 31.1% at the mid-morning meal. The mean amount of absorbed iron was estimated at 0.56 (SD 0.47) mg/d, and the prevalence of inadequate iron intake was 77%.
Conclusion: The habitual diet supplies inadequate amounts of iron to the children, largely due to the presence of phytates, polyphenols and calcium. Interventions must be developed and evaluated to improve dietary iron bioavailability.
IRON INTAKE AND IRON BIOAVAILABILITY
101
INTRODUCTION
Iron deficiency anaemia is highly prevalent in developing countries1 and can be partly attributed to the low iron bioavailability in the customary cereal and legume-based diet. Iron status, the content of haem and non-haem iron, and the bioavailability of the two kinds of iron determine the amount of iron absorbed from a meal2 that is actually available for metabolic processes and storage. Iron bioavailability in turn is determined by the presence of dietary components enhancing or inhibiting iron absorption. Non-haem iron absorption can vary between 2-35%, depending on the presence of enhancers and inhibitors in a meal3,4. Ascorbic acid is probably the most efficient enhancer of non-haem iron absorption4,5. The absolute amount of ascorbic acid in the meal and the ratio between the concentration of ascorbic acid and iron absorption inhibitors may be more important than the molar ratio of ascorbic acid to iron6 and sufficient amounts of ascorbic acid in a meal can counteract the inhibition of iron absorption by phytates7. Meat can provide high amounts of bioavailable iron; the absorption of haem iron present in meat is not greatly influenced by other dietary components in the meal. Also, factors in meat are known to have enhancing effects on non-haem iron absorption8,9.
Phytates, the storage form of phosphates and minerals, are found in all kinds of grains, seeds, legumes, nuts, vegetables, roots and fruits and strongly inhibit iron absorption in a dose-dependent fashion and in even small amounts10,11. Polyphenols, also strong inhibitors of iron absorption, are ubiquitous in all plant foods (vegetables, cereals, legumes, fruits, nuts, etc.) and beverages (wine, cider, tea, beer, tea, cocoa, etc.)12. Calcium reduces the absorption of both haem and non-haem iron in a meal13 in a dose-effect relation4 and none of the iron absorption enhancers seems to counteract these inhibiting effects14. A number of other dietary components have been suggested to inhibit or enhance iron absorption. Possible iron absorption inhibitors are phosphorus15, flavonoids4, soy protein16, fibre17,18, egg19 and casein20. Possible iron absorption enhancers are organic acids6, vitamin A, and ß-carotene21. There are strong relations between iron requirements, iron bioavailability and amounts of stored iron and as iron stores rise, the percentage of dietary iron absorption falls22.
To design effective strategies for improving iron nutrition, it is important to establish the content of iron in the diet, iron bioavailability, as well as the prevalence of inadequate iron intake in the population. We therefore examined the habitual diet of rural Kenyan primary school children using food intake data of children who participated as controls in a feeding intervention study with animal source foods23. To estimate iron absorption, the algorithm of Hallberg and Hulthén4 was applied. This algorithm uses the sum of several iron absorption enhancers and inhibitors present in a meal, is based on continuous variables and considers interactions between them, and takes into account the effect of an individual’s iron status on iron absorption.

CHAPTER 5
102
METHODS
Study design and study area
The data is derived from a study that was conducted to investigate the causal link of the intake of animal source foods with growth, morbidity and cognitive function in Kenyan school children23.
The study was conducted in Kyeni South Division of Embu District in Eastern Province, Kenya. The study area is located on the slopes of Mt. Kenya, near the Equator, with altitudes ranging from 1200 to 1460 metres. It is characterized by distinct rainy and dry seasons, with mild weather year-round, and includes a relatively fertile zone with higher rainfall, and a semi-arid area at lower elevations. The people are mostly smallholder agriculturalists producing both subsistence and market crops. The habitual diet mainly consists of maize and beans with no or little animal source foods. In the children, multiple micronutrient deficiencies are prevalent, particularly those of iron and vitamins A and B12
24. Cultivated cash crops include coffee, tea, cotton, tobacco, and flowers25. People keep few cattle, goats, and chicken. The area is subject to drought every three to five years, with acute food shortages. During the study period there were droughts in 1998 and 1999 that resulted in low harvests of maize and beans.
Study subjects
Children enrolled in class 1 (median age 7 years) from twelve primary schools participated in the study (n 554). The analyses of this article were restricted to children who did not receive food supplements (n 128). For analyses of iron absorption, we excluded children with an energy intake > 5000 kcal (n 1), inflammation as indicated by plasma C-reactive protein concentrations > 10 mg/L and malaria as been tested positive with the Plasmodium falciparum malaria antigen test (in vitro antigen-capture strip method, Vision Biotech, Cape Town, South Africa) (n 46 of 124 children of whom data was available). The details of biochemical analyses have been described earlier24. This resulted in a sample size of 78.
Food intake measures
A semi quantitative 24-hours recall method was administered at the child’s home by trained enumerators to estimate the daily energy and nutrient intake. The details of food intake measures have been described by Murphy et al.26,27. For each household, twenty-four food intake data sets were collected over a period of thirty-four months (twenty-three data sets from June 1998 to September 2000 and one data set in February/March 2001).
Calculations of iron absorption
The method used to predict the amount of absorbed iron is based on an algorithm containing the value for iron absorption from a single basal meal that contains no components known to inhibit or enhance iron absorption4. This basal value can then be multiplied by dietary factors of iron bioavailability expressing the effect of different dietary components present in the meal

IRON INTAKE AND IRON BIOAVAILABILITY
103
known to influence iron absorption. The dietary factors of iron bioavailability were calculated for each child and for each meal of the day when food intake data was available. Variables included in the calculations of the factors were phytate (P as phytate-P, in mg), ascorbic acid (AA, in mg), meat (M, uncooked meat, in g), tannic acid equivalents (TA, in mg), calcium (Ca, in mg) and number of eggs. The factors were calculated using the following equations:
Phytate factor: Log absorption ratio = −0.30 x log (1 + P);
Ascorbic acid factor: Absorption ratio = 1 + 0.01 AA + log (P + 1) x 0.01 x 100.8875 x log (AA + 1);
Polyphenol factor: Absorption ratio = (1 + 0.01 M) x 100.4515 − [0.715 − 0.1825 x log (1 + AA)] x log (1 + TA);
Calcium factor: Absorption ratio = 0.4081 + {0.6059/1 + 10-[2.022 – log (Ca + 1)] x 2.919};
Meat factor: Absorption ratio = 1 + 0.00628 x M x [1 + 0.006 P];
Egg factor: Absorption ratio = 1 – 0.27 x number of eggs.
Polyphenols considered were tannic acid and chlorogenic acid (expressed as tannic acid equivalents) from tea, coffee, chocolate, cocoa, and sorghum and certain fruits, vegetables, and legumes for which their content was available4. We assumed that one cup of the type of black tea (200 mL) or black coffee (150 mL) that was habitually consumed by the study children reduced iron absorption by 75% or 60% respectively, if consumed with a meal as suggested by Hallberg and Hulthén4. The fractional absorption of non-haem iron was calculated by multiplying the basal factor 22.1 by the dietary factors. The absorption of haem iron was adjusted by the calcium factor. The amount of absorbed non-haem and haem iron were obtained by multiplying the fractional absorption by the amounts of the two kinds of iron in the meal and adjusting them for iron status as indicated by individual plasma ferritin concentrations4. Haem iron in the diet was calculated as 40% of the meat/fish/poultry iron, with the remainder being non-haem iron3. Animal tissue content of the food was included in the algorithm as uncooked food, whereby 1.3 g raw weight was assumed to be 1.0 g cooked weight of meat, poultry and fish28.
Contents of nutrients and phytate were obtained from the food composition data of the International Minilist that was developed for the WorldFood Dietary Assessment System, version 2.029. Calculations of iron absorption were based on meals. The whole-day diet of the children was divided into time periods. Dishes and foods consumed were grouped into dish groups, such as tea, porridge, rice dishes, etc., and the frequency of consumption calculated for all data points combined. Times where dishes/foods from the same dish groups were most frequently consumed were selected as meal times: 6 to 8 am as breakfast, 9 to 12 am as mid-morning meal, 1 pm as lunch, 2 to 6 pm as afternoon meal and from 7 pm as dinner.
To estimate the group prevalence of inadequate iron intake, the Estimated Average Requirement (EAR) cut-point method30 was used. The prevalence of inadequate iron intake is the proportion of children with mean iron intakes during the study period below the median requirement (EAR) for absorbed iron of 0.80 mg/d (average of 0.81 mg/d for boys and

CHAPTER 5
104
0.79 mg/d for girls)31. All analyses were performed using SAS software (version 8; SAS Institute Inc, Cary, NC).
RESULTS
Foods that contributed most to the iron intake were white maize (42%) and kidney beans (36%). Milk and beef contributed 0.6% and 0.3%, respectively, to the total iron intake. The average daily iron intake by meals and for the whole day is presented in Table 5.1. Mean total iron intake was 15.74 (SD 5.88) mg/d, the intake of non-haem iron was 15.7 (SD 5.91) mg/d and the intake of haem iron was 0.05 (SD 0.01) mg/d. Lunch and dinner each contributed ~40% to the iron intake. Daily intakes of energy and dietary components considered in calculations of iron absorption and calculated dietary factors of iron bioavailability by meals are presented in Tables 5.2 and 5.3. Iron absorption was adjusted to individual serum ferritin concentrations. The mean serum ferritin concentration of the children was 35.2 µg/L.
The average inhibiting effect of phytate on non-haem iron absorption was greatest at lunch (78% reduction) and dinner (88% reduction). The average inhibiting effect of polyphenols alone on non-haem iron absorption was 65% (SD 9%) at breakfast, 56% (SD 24%) at the mid-morning meal, 42% (SD 12%) at lunch, 48% (SD 46%) at the afternoon meal, and 38% (SD 27%) at dinner.
Ascorbic acid and meat can counteract the inhibiting effect of polyphenols on iron absorption7,32; the calculated inhibiting effect of polyphenols on non-haem iron absorption was reduced by ascorbic acid and meat by 8% at breakfast, 19% at the mid-morning meal, 22% at lunch, 15% at the afternoon meal, and 16% at dinner. The resulting total inhibiting effect by polyphenols on non-haem iron absorption is shown in Table 5.3. The inhibiting effect of calcium on haem and non-haem iron absorption ranged from 11% reduction for the afternoon meal to 18% reduction for lunch. The enhancing effect of ascorbic acid ranged from 14% at breakfast to 139% at the afternoon meal. Intake of ascorbic acid varies seasonally and the average daily enhancing effect of ascorbic acid on non-haem iron absorption ranged e.g., for lunch from 49% in September 1999 to 265% in February 2000.
If no other enhancing or inhibiting effect on iron absorption was considered, the enhancing effect of meat alone on non-haem iron absorption was 0.1% (SD 0.3%) at breakfast, 1% (SD 3.4%) for the mid-morning meal, 1.8% (SD 7.9%) for lunch, 1.2% (SD 3.5%) for the afternoon meal and 3.5% (SD 5.1%) for dinner. Meat very effectively counteracts the inhibition of non-haem iron absorption by phytate and polyphenols33 and the enhancing effect of meat, if the high phytate content in the diet is also considered, was therefore more pronounced (Table 5.3).
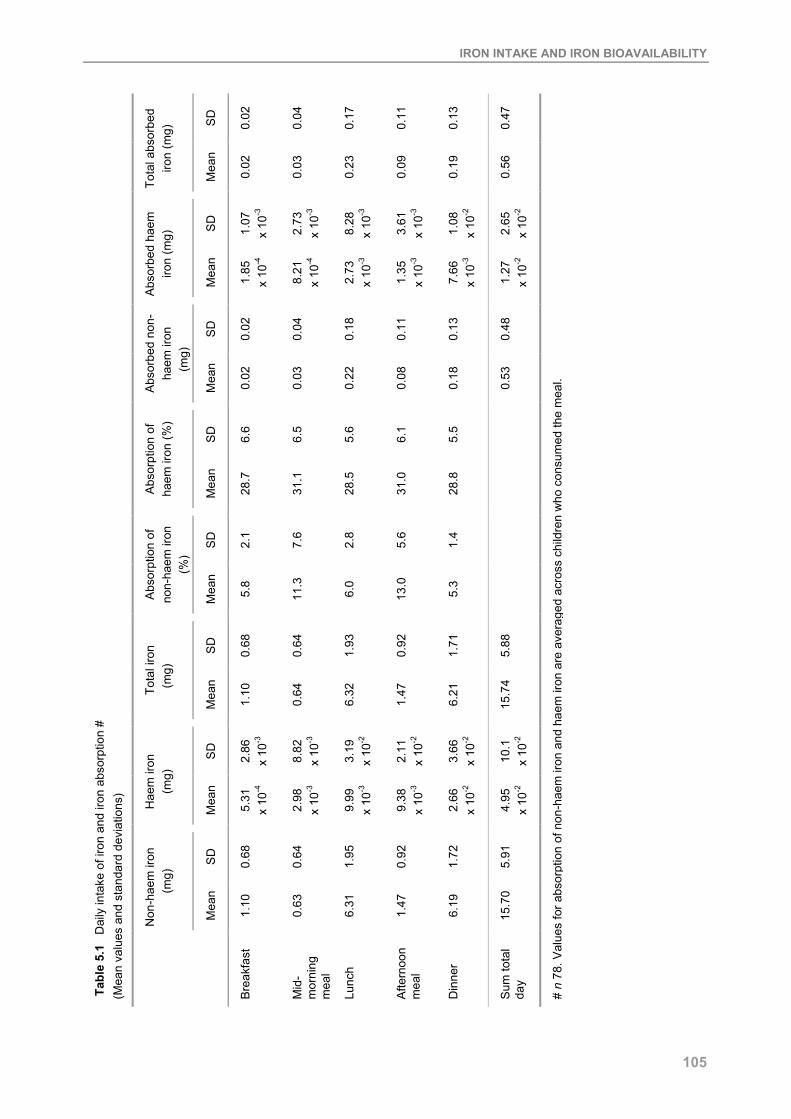
IRON INTAKE AND IRON BIOAVAILABILITY
105
SD
0.02
0.04
0.17
0.11
0.13
0.47
Tota
l abs
orbe
d iro
n (m
g)
Mea
n
0.02
0.03
0.23
0.09
0.19
0.56
SD
1.07
x
10-3
2.73
x
10-3
8.28
x
10-3
3.61
x
10-3
1.08
x
10-2
2.65
x
10-2
Abs
orbe
d ha
em
iron
(mg)
Mea
n
1.85
x
10-4
8.21
x
10-4
2.73
x
10-3
1.35
x
10-3
7.66
x
10-3
1.27
x
10-2
SD
0.02
0.04
0.18
0.11
0.13
0.48
Abs
orbe
d no
n-
haem
iron
(m
g)
Mea
n
0.02
0.03
0.22
0.08
0.18
0.53
SD
6.6
6.5
5.6
6.1
5.5
Abs
orpt
ion
of
haem
iron
(%)
Mea
n
28.7
31.1
28.5
31.0
28.8
SD
2.1
7.6
2.8
5.6
1.4
Abs
orpt
ion
of
non-
haem
iron
(%
)
Mea
n
5.8
11.3
6.0
13.0
5.3
SD
0.68
0.64
1.93
0.92
1.71
5.88
Tota
l iro
n (m
g)
Mea
n
1.10
0.64
6.32
1.47
6.21
15.7
4
SD
2.86
x
10-3
8.82
x
10-3
3.19
x
10-2
2.11
x
10-2
3.66
x
10-2
10.1
x
10-2
Hae
m ir
on
(mg)
Mea
n
5.31
x
10-4
2.98
x
10-3
9.99
x
10-3
9.38
x
10-3
2.66
x
10-2
4.95
x
10-2
SD
0.68
0.64
1.95
0.92
1.72
5.91
Non
-hae
m ir
on
(mg)
Mea
n
1.10
0.63
6.31
1.47
6.19
15.7
0
Tab
le 5
.1
Dai
ly in
take
of i
ron
and
iron
abso
rptio
n #
(Mea
n va
lues
and
sta
ndar
d de
viat
ions
)
Bre
akfa
st
Mid
-m
orni
ng
mea
l
Lunc
h
Afte
rnoo
n m
eal
Din
ner
Sum
tota
l da
y
# n
78. V
alue
s fo
r abs
orpt
ion
of n
on-h
aem
iron
and
hae
m ir
on a
re a
vera
ged
acro
ss c
hild
ren
who
con
sum
ed th
e m
eal.

CHAPTER 5
106
SD
1.0
0.3
0.7
1.1
0.4
0.8
Egg
s (n
)
Mea
n
0.3
0.0
0.2
0.2
0.1
3.5
SD
0.5
1.9
6.9
4.6
7.6
21.5
Mea
t (g
) ‡
Mea
n
0.1
0.6
2.0
1.3
5.3
9.3
SD
6.0
15.8
15.7
28.3
8.6
74.4
Asc
orbi
c ac
id
(mg)
Mea
n
6.2
17.4
35.1
50.8
23.2
132.
7
SD
39.2
19.0
19.5
40.7
29.4
96.9
Cal
cium
(mg)
Mea
n
74.2
20.6
76.4
41.3
83.3
295.
8
SD
15.3
16.8
17.6
25.2
20.0
94.9
Tann
ic a
cid
equi
vale
nts
(mg)
Mea
n
29.5
11.7
25.3
22.6
29.8
118.
9
SD
131.
0
126.
0
386.
3
168.
5
344.
9
1156
.7
Phy
tate
s (m
g)
Mea
n
184.
4
95.7
1200
.7
223.
6
1192
.1
2896
.5
SD
82.3
89.2
139.
8
104.
1
123.
2
538.
6
Ene
rgy
(kca
l)
Mea
n
207.
6
9.6
603.
9
221.
8
617.
2
1750
.1
Tabl
e 5.
2 D
aily
inta
kes
of e
nerg
y an
d di
etar
y co
mpo
nent
s of
iron
abs
orpt
ion
# (M
ean
valu
es a
nd s
tand
ard
devi
atio
ns)
Bre
akfa
st
Mid
-m
orni
ng
mea
l
Lunc
h
Afte
rnoo
n m
eal
Din
ner
Tota
l
# n
78.
‡ U
ncoo
ked
mea
t.

IRON INTAKE AND IRON BIOAVAILABILITY
107
Table 5.3 Factors of iron bioavailability # (Mean values and standard deviations)
Phytate factor Polyphenol
factor Calcium factor Ascorbic acid
factor Meat factor
n Mean SD Mean SD Mean SD Mean SD Mean SD
Breakfast 66 0.65 0.17 0.43 0.10 0.83 0.11 1.14 0.13 1.0 0.01 Mid-morning meal
21 0.63 0.18 0.63 0.22 0.89 0.08 1.91 0.75 1.02 0.07
Lunch 64 0.22 0.05 0.80 0.08 0.82 0.05 1.98 0.42 1.03 0.12 Afternoon meal
44 0.58 0.12 0.67 0.15 0.89 0.06 2.39 0.69 1.03 0.09
Dinner 68 0.22 0.04 0.78 0.07 0.83 0.06 1.62 0.19 1.09 0.14
# Factors are averaged across children who consumed the meal.
The consumption of eggs has been reported to inhibit iron absorption from a meal, probably due to their content of phosphoprotein and albumin19. One egg included in a meal is likely to reduce non-haem iron absorption by 27%4. The daily average number of eggs consumed by the study children was 0.9 and therefore the consumption of eggs is not expected to influence iron bioavailability in the study area.
Other dietary components that influence iron bioavailability and that can be included in the algorithm to estimate iron absorption are soy protein and alcohol4. Soybeans were consumed by only 0.1% of the study children and alcohol not at all. These factors were therefore not considered in calculations of iron absorption.
The fractional absorption of haem and non-haem iron and the amounts of absorbed iron per meals and per day are presented in Table 5.1. Fractional absorption of non-haem iron ranged from 5.3% for dinner to 13% for the afternoon meal and fractional absorption of haem iron ranged from 28.5% at lunch to 31.1% at the mid-morning meal. The mean amount of absorbed iron was estimated at 0.56 (SD 0.47) mg/d, and the prevalence of inadequate iron intake was 77%.
DISCUSSION
Our examination of the habitual diet of rural Kenyan school children showed that the content of dietary factors inhibiting non-haem iron absorption was high, resulting in a high prevalence of inadequate iron intake. Mean total dietary iron intake from the habitual diet over thirty-four months was 15.7 mg/d, which is even slightly higher than the usual iron intake of ~13 mg/d in US children aged 4-8 years31. However, fractional absorption of non-haem iron in our study children was as low as 5.3% and 6.0% for dinner and lunch, respectively, due to the presence of a number of iron absorption inhibitors in the meal; resulting in only 0.6 mg absorbed iron per day. An expert group estimated ~5% iron to be absorbed from a simple, monotonous diet containing cereals, roots; and/or tubers and negligible quantities of animal products and ascorbic acid-rich foods, as dominant in poor people in developing countries34. The cereal and

CHAPTER 5
108
legume-based diets of children in Bangladesh and Morocco were estimated to have iron bioavailabilities of ~6% and 2%, respectively35,36, resulting in 0.2 mg/d of absorbed iron in the Moroccan children36. In contrast, the iron from typical diversified diets in the US and Canada, which contains ample amounts of flesh foods and ascorbic acid, is thought to be 15% bioavailable31.
Phytates were the components in the diet that most reduced non-haem iron absorption. Their intake of 2.9 g/d was extremely high compared with the usual intake of phytates in children of the same age group in e.g., Canada (0.3 g/d)37, India (0.9 g/d)37, Guatemala (1 g/d)38, or Malawi (1.8 g/d)37. A reduction of non-haem iron absorption by phytates of ~80% was found for lunch and dinner and of ~40% for the other meals.
The inhibiting effect of polyphenols on non-haem iron absorption was calculated to be as high as 57% at breakfast, where ~70% of children consumed tea. However, ~65% of those children consuming tea at breakfast did not consume anything else with it and therefore iron absorption from other food stuffs is not affected. At the main meals, which contain most of the iron, polyphenols reduced non-haem iron absorption by only ~20%, probably because only ~8% and ~12% of children consumed polyphenol containing drinks, such as tea, with their lunch and dinner, respectively. However, it is likely that the inhibiting effect of polyphenols on non-haem iron absorption was underestimated, because we only included the effect of tannic acid and chlorogenic acid in our calculations. The effect of polyphenols found in legumes on iron bioavailability has not been conclusively resolved, but because legumes and green leafy vegetables contain, besides tannic acid, other polyphenols the inhibition of iron absorption might have been higher. Further, not for all foods the polyphenol content was available and included in the analyses.
The foods that contributed most to the calcium intake of the children were milk (36%), kidney beans (20%), green leafy vegetables (17%), and fruits (12%). Mean calcium intakes were low (295.9 (SD 96.9) mg/d; Adequate intake, 800 mg/d39) and therefore the inhibiting effect of calcium on haem and non-haem iron absorption was only ~17% for the main meals.
The main source of ascorbic acid in the habitual diet was fruits, of which the majority were consumed as snacks at the mid-morning and afternoon meals. The potential enhancing effect of ascorbic acid on non-haem iron absorption at those meals is therefore lost if no foods containing iron are consumed at the same time. However, an enhancing effect of 98% and 62% for lunch and dinner, respectively, is still considerable and substantially counteracted the inhibiting effect of phytates and polyphenols present in the respective meals. Because the consumption of meat was very low, not much of an enhancing effect on non-haem iron was observed.
The food intake data we collected in the course of the intervention study provided a good possibility to gain knowledge about the composition of the diet of the children and to estimate their habitual daily iron intake and iron bioavailability. The method used to collect food intake data from the households, i.e., a detailed 24-hours recall, is suitable to estimate habitual energy

IRON INTAKE AND IRON BIOAVAILABILITY
109
and nutrient intakes because it has been found to give similar results as weighed records in validation studies26. We measured food intake monthly over a period of 34 months, which is expected to have accounted for potential seasonal variations in nutrient intakes.
An advantage of the algorithm used in the present analyses is that calculations of iron absorption are meal-based, which is expected to give more accurate results than day-based analyses that can overestimate iron absorption if e.g., fruits are consumed in between meals, but are considered enhancers of non-haem iron absorption from other meals. However, if foods were consumed within a short time period, but were allocated to different meals, it could be that enhancing or inhibiting effects of dietary components on iron absorption were missed out in our calculations; e.g., coffee has been shown to affect non-haem iron absorption to the same degree if taken one hour after a meal40.
A further limitation of our study is that insufficient knowledge is available about the exact content of dietary components in foods, such as phytate and polyphenols, particularly for those foods used in developing countries. In addition, quantification of the effect of polyphenols on iron bioavailability is difficult because of the complexity of this wide group of plant metabolites. Information in the literature on the content and composition of polyphenols in plant foods is not only incomplete but also sometimes contradictory and difficult to compare12.
Serum ferritin concentrations correlate well with body iron stores41 and the relation between the absorption of haem and non-haem iron with serum ferritin concentrations has been evaluated in several studies42-44. However, serum ferritin is a very sensitive acute-phase reactant and may be increased even in asymptomatic infections, such as malaria45. It has also been suggested that serum ferritin remains increased for weeks even after a simple infection with fever for a day or two46. This somehow limits the application of serum ferritin as an indicator of iron status, especially for the use in developing countries, where infections and inflammatory disorders are common in children. In our analyses, however, we only included children without malaria and inflammations as measured by elevated C-reactive protein (CRP) concentrations to minimize the effect of inflammation on serum ferritin. Nevertheless, the mean serum ferritin concentration of 35.2 µg/L of children without malaria and/or elevated CRP still seemed to be high considering the high prevalence of iron deficiency anaemia in the children24, and it might have been that serum ferritin concentrations were elevated due to inflammation in some children despite a CRP below the cut-off. The reference dose absorption of 40% used in the algorithm of Hallberg and Hulthén4 that was used to estimate iron absorption corresponds to a serum ferritin concentration of 23 µg/L and therefore we might have underestimated the amount of iron absorbed, if actual iron stores of the children had been lower. Further, measurements of serum ferritin at baseline were used and iron absorption might have been different had serum ferritin concentrations at a different time point been included in our calculations.
Because other dietary components that have been suggested to inhibit or enhance iron absorption have not been studied rigorously and studies carried out so far gave contradicting results, we did not consider them in our calculations of iron bioavailability. The fact that dietary
CHAPTER 5
110
iron often contains substantial amounts of “contaminant” iron, which usually enters food during collection and storage (dirt, soil), preparation (from cooking pots), or processing (milling)47, was ignored in the analyses. Some further factors are likely to have affected iron absorption that we did not account for in our calculations. Gastrointestinal parasites can impair iron absorption47 and study children were infected with parasites, such as Entamoeba histolytica, Giardia lamblia and Iodamoeba butschlii24 and had elevated antibody titres of Helicobacter pylori indicating a high prevalence of infections48. Over and above, real absorption and bioavailability of iron might be different if its utilisation is impaired by deficiencies of vitamin A49 and other vitamins47.
These findings from examinations of the habitual diet of rural Kenyan school children point at the importance of improving iron bioavailability in order to increase the amount of iron absorbed. Household-level dietary strategies focus on increasing iron bioavailability through the addition of iron absorption enhancers, such as meat or ascorbic acid, to the diet or the reduction of iron absorption inhibitors, such as phytates. Increasing the consumption of meat could be an efficacious strategy because meat provides highly bioavailable haem iron in addition to enhancing iron absorption from other food sources. The use of genetically modified food crops with lower phytate and higher iron contents is another approach currently tested. The different approaches should be evaluated in various settings for their efficacy and effectiveness in improving dietary iron bioavailability. Further, public health measures, such as treatment and prevention of intestinal parasites that cause blood loss and impair iron absorption, have to be undertaken.
ACKNOWLEDGEMENTS
We thank the children, families, and staff involved in the Kenya Child Nutrition Project, especially Constance Gewa who was in charge of all aspects of the feeding and food intake data collection and processing. We gratefully acknowledge Clive West (deceased August 2004) for his contribution in the formative stage of this article.
REFERENCES 1. ACC/SCN (2000) Fourth report on the world nutrition situation. Geneva: ACC/SCN with IFPRI. 2. Hallberg L (1981) Bioavailability of dietary iron in man. Annu Rev Nutr 1: 123-47. 3. Monsen ER, Hallberg L, Layrisse M, et al. (1978) Estimation of available dietary iron. Am J Clin Nutr 31: 134-
41. 4. Hallberg L & Hulthén L (2000) Prediction of dietary iron absorption: an algorithm for calculating absorption and
bioavailability of dietary iron. Am J Clin Nutr 71: 1147-60. 5. Lynch SR (1997) Interaction of iron with other nutrients. Nutr Rev 55: 102-10. 6. Lynch SR & Stoltzfus RJ (2003) Iron and ascorbic acid: proposed fortification levels and recommended iron
compounds. J Nutr 133: 2978S-84S. 7. Siegenberg D, Baynes RD, Bothwell TH, et al. (1991) Ascorbic acid prevents the dose-dependent inhibitory
effects of polyphenols and phytates on nonheme-iron absorption. Am J Clin Nutr 53: 537-41. 8. Martinez-Torres C & Layrisse M (1971) Iron absorption from veal muscle. Am J Clin Nutr 24: 531-40. 9. Cook JD & Monsen ER (1976) Food iron absorption in human subjects. 3 Comparison of the effect of animal
proteins on nonheme iron absorption. Am J Clin Nutr 29: 859-67.

IRON INTAKE AND IRON BIOAVAILABILITY
111
10. Gillooly M, Bothwell TH, Torrance JD, et al. (1983) The effect of organic acids, phytates and polyphenols on the absorption of iron from vegetables. Br J Nutr 49 (3): 331-42.
11. Hallberg L, Brune M & Rossander L (1989) Iron absorption in man: ascorbic acid and dose-dependent inhibition by phytate. Am J Clin Nutr 49: 140-4.
12. Bravo L (1998) Polyphenols: chemistry, dietary sources, metabolism, and nutritional significance. Nutr Rev 56: 317-33.
13. Hallberg L, Brune M, Erlandsson M, Sandberg AS & Rossander-Hulthén L (1991) Calcium: effect of different amounts on nonheme- and heme-iron absorption in man. Am J Clin Nutr 53: 112-9.
14. Hallberg L, Rossander-Hulten L, Brune M & Gleerup A (1992) Calcium and iron absorption: mechanism of action and nutritional importance. Eur J Clin Nutr 46: 317-27.
15. Monsen ER & Cook JD (1976) Food iron absorption in human subjects. IV. The effects of calcium and phosphate salts on the absorption of nonheme iron. Am J Clin Nutr 29: 1142–8.
16. Cook JD, Morck TA & Lynch SR (1981) The inhibitory effect of soy products on nonheme iron absorption in man. Am J Clin Nutr 34: 2622-9.
17. Gillooly M, Bothwell TH, Charlton RW, et al. (1984) Factors affecting the absorption of iron from cereals. Br J Nutr 51: 37-46.
18. Rossander L (1987) Effect of dietary fiber on iron absorption in man. Scand J Gastroenterol 129: 68S-72S. 19. Callender ST, Marney SRJ & Warner GT (1970) Eggs and iron absorption. Br J Haematol 19: 657-65. 20. ACC/SCN (2001) What works? A Review of the Efficacy and Effectiveness of Nutrition Interventions. [Allen LH
and Gillespie SR, editors]. Geneva: ACC/SCN in collaboration with the Asian Development Bank, Manila. 21. Garcia-Casal MN, Layrisse M, Solano L, et al. (1998) Vitamin A and b-carotene can improve nonheme iron
absorption from rice, wheat and corn by humans. J Nutr 128: 646-50. 22. Hallberg L, Hulthén L & Garby L (1998) Iron stores in man in relation to diet and iron requirements. Eur J Clin
Nutr 52: 623-31. 23. Neumann CG, Bwibo NO, Murphy SP, et al. (2003) Animal Source Foods Improve Dietary Quality,
Micronutrient Status, Growth and Cognitive Function in Kenyan School Children: Background, Study Design and Baseline Findings. J Nutr 133 (11): 3941S-9S.
24. Siekmann JH, Allen LH, Bwibo NO, Demment MW, Murphy SP & Neumann CG (2003) Kenyan school children have multiple micronutrient deficiencies, but increased plasma vitamin B-12 is the only detectable micronutrient response to meat or milk supplementation. J Nutr 133 (11): 3972S-80S.
25. Office of the Vice-President and Ministry of Planning and National Development/Republic of Kenya (1997) Embu District Development Plan 1997-2001. Nairobi: Government Printer.
26. Murphy SP, Gewa C, Liang L-J, Grillenberger M, Bwibo NO & Neumann CG (2003) School snacks containing animal source foods improve dietary quality for children in rural Kenya. J Nutr 133 (11): 3950S-6S.
27. Murphy SP, Gewa C, Grillenberger M & Neumann CG (2004) Adapting an international food composition table for use in rural Kenya. J Food Comp Anal 17: 523-30.
28. Monsen ER (1982) Calculating dietary iron bioavailability: refinement and computerization. J Am Diet Assoc 80: 307-11.
29. Calloway DH, Murphy SP, Bunch S & Woerner J (1994) WorldFood 2 Dietary Assessment System. Available at http://www.fao.org/infoods/software_worldfood_en.stm (accessed 1 April 2005).
30. Institute of Medicine (2000) Dietary reference intakes: Applications in dietary assessment. Washington, DC: National Academy Press.
31. Institute of Medicine (2001) Dietary Reference Intakes for vitamin A, vitamin K, arsenic, boron, chromium, copper, iodine, iron, manganese, molybdenum, nickel, silicon, vanadium and zinc. Washington, DC: National Academy Press.
32. Tuntawiroon M, Sritongkul N, Brune M, et al. (1991) Dose-dependent inhibitory effect of phenolic compounds in foods on nonheme-iron absorption in men. Am J Clin Nutr 53: 554–7.
33. Hallberg L & Hulthen L (2002) Perspectives on iron absorption. Blood Cells Mol Dis 29 (3): 562-73. 34. FAO/WHO (1988) Requirements of vitamin A, iron, folate and vitamin B12. FAO Food Nutr Ser no. 23. Rome:
FAO/WHO Expert Consultation. 35. Davidsson L, Jamil KA, Sarker SA, Zeder C, Fuchs G & Hurrell R (2004) Human milk as a source of ascorbic
acid: no enhancing effect on iron bioavailability from a traditional complementary food consumed by Bangladeshi infants and young children. Am J Clin Nutr 79: 1073-7.
36. Zimmermann MB, Chaouki N & Hurrell RF (2005) Iron deficiency due to consumption of a habitual diet low in bioavailable iron: a longitudinal cohort study in Moroccan children. Am J Clin Nutr 81 (1): 115-21.
37. Reddy NR & Sathe SK (2002) Food phytates. [Reddy NR and Sathe SK, editors]. Boca Raton, FA: CRC Press. 38. Cavan KR, Gibson RS, Grazioso CF, Isalgue AM & Riz M (1993) Growth and body composition of periurban
Guatemalan children in relation to zinc status: a cross-sectional study. Am J Clin Nutr 57: 334-43.

CHAPTER 5
112
39. Institute of Medicine (2001) Dietary Reference Intakes for Calcium, Phosphorus, Magnesium, Vitamin D, and Fluoride. Washington, DC: National Academy Press.
40. Morck TA, Lynch SR & Cook JD (1983) Inhibition of food iron absorption by coffee. Am J Clin Nutr 37: 416-20. 41. Hunt JR (2001) How important is dietary iron bioavailability? Am J Clin Nutr 73 (1): 3-4. 42. Skikne BS, Flowers CH & Cook JD (1990) Serum transferrin receptor: A quantitative measure of tissue iron
deficiency. Blood 75: 1870-6. 43. Gleerup A, Rossander-Hulthén L, Gramatkowski E & Hallberg L (1995) Iron absorption from the whole diet:
Comparison of the effect of two different distributions of daily calcium intake. Am J Clin Nutr 61: 97-104. 44. Hulthén L, Gramatkowski E, Gleerup A & Hallberg L (1995) Iron absorption from the whole diet. Relation to
meal composition, iron requirements and iron stores. Eur J Clin Nutr 49: 794-808. 45. Verhoef H, West CE, Ndeto P, Burema J, Beguin Y & Kok FJ (2001) Serum transferrin receptor concentration
indicates increased erythropoiesis in Kenyan children with asymptomatic malaria. Am J Clin Nutr 74: 767-75. 46. Hulthén L (1998) Effect of a mild infection on serum ferritin concentration - clinical and epidemiological
implications. Eur J Clin Nutr 52: 1-4. 47. Allen L & Ahluwalia N (1997) Improving Iron Status through Diet. The Application of Knowledge Concerning
Dietary Iron Bioavailability in Human Populations. Washington, DC: OMNI Project. 48. Siekmann JH, Allen LH, Watnik MR, et al. (2003) Titers of antibody to common pathogens: relation to food-
based interventions in rural Kenyan schoolchildren. Am J Clin Nutr 77 (1): 242-9. 49. Suharno D, West CE, Muhilal, Karyadi D & Hautvast JG (1993) Supplementation with vitamin A and iron for
nutritional anaemia in pregnant women in West Java, Indonesia. Lancet 342: 1325-8.

66
The potential of household dietary strategies to improve iron nutrition in rural Kenyan school children
Monika Grillenberger, Charlotte G. Neumann, Suzanne P. Murphy,
Nimrod O. Bwibo, Hans Verhoef, Joseph G.A.J. Hautvast Submitted for publication

CHAPTER 6
114
ABSTRACT
Objective: To determine the potential of household dietary strategies to reduce the prevalence of inadequate iron intake in rural Kenyan school children.
Design: Strategies were simulated by theoretically modifying the habitual diet. Changes in the amount of absorbed iron and the prevalence of inadequate iron intake were evaluated.
Setting/subjects: School children (6-9 years) from a rural area in Embu District, Eastern Province, Kenya (n 78).
Results: The prevalence of inadequate iron intake decreased from 77% to 54% through the theoretical addition of 50 g beef or 100 mg ascorbic acid and to 23% through the combined addition of these amounts to dinner each day. To reduce the prevalence of inadequate iron intake to 5%, the addition of 100 g meat plus 150 mg ascorbic acid to dinner each day would be necessary. An extra 75 g meat would help meeting recommended intakes of zinc and vitamin B12. The addition of a mango to a meal would provide 50 mg ascorbic acid and sufficient retinol activity equivalents to meet recommended amounts. Avoidance of polyphenol containing drinks at meals or the application of household-level food processing methods were not found to decrease the prevalence of inadequate iron intake.
Conclusion: Of the household dietary strategies examined, the combined addition of meat and ascorbic acid to a meal seems to be the most efficacious in reducing the prevalence of inadequate iron intake in rural Kenyan school children. However, to reduce the prevalence of inadequate iron intake to 5%, these strategies must be combined with other approaches.

HOUSEHOLD DIETARY STRATEGIES TO IMPROVE IRON NUTRITION
115
INTRODUCTION
Low dietary iron bioavailability and infections with intestinal parasites1 are the main causes for iron deficiency anaemia, which affects more than 3.5 billion people in developing countries2. Household dietary strategies to improve iron nutrition mainly focus on improving iron bioavailability and aim at increasing enhancers of iron absorption, such as ascorbic acid, and decreasing inhibitors, such as phytates. Increasing the consumption of meat could be an efficacious strategy because meat provides highly bioavailable haem iron in addition to enhancing iron absorption from other food sources. Food processing methods that can be applied at household level to reduce phytates include physical removal (extraction and dehulling) and enzymatic degradation by soaking, germination, malting, and fermentation. Some studies in developing countries testing those strategies have been able to demonstrate improvements in micronutrient intake3-5. The consumption of polyphenol containing drinks, particularly tea and coffee, with a meal is known to inhibit iron absorption6-8 and because this practice is common in many areas in developing countries, a behaviour change might contribute to an improvement in iron nutrition.
Iron bioavailability was found to be particularly low in the habitual diet of rural Kenyan school children, mainly due to the high intake of phytates, and the prevalence of inadequate iron intake was estimated to be 77%9. These children live on a diet that mainly consists of maize and beans with no or little animal source foods and suffer from multiple micronutrient deficiencies, particularly those of iron, vitamins A and B12
10. With a view to design effective dietary strategies for improving iron nutrition, we simulated different household dietary strategies and evaluated their potential efficacy towards reducing the prevalence of inadequate iron intake11. Further, we explored the effect of the modifications on the adequacy of intakes of other nutrients that were critically low in the diet.
METHODS
Study design and study area
The data was derived from a study that was conducted to investigate the causal link of the intake of animal source foods with growth, morbidity, and cognitive function in Kenyan school children. Details of the study design were described previously11.
The study was conducted in Kyeni South Division of Embu District in Eastern Province, Kenya. The study area is located on the slopes of Mt. Kenya, near the Equator, with altitudes ranging from 1200 to 1460 metres. It is characterized by distinct rainy and dry seasons, with mild weather year-round, and includes a relatively fertile zone with higher rainfall and a semi-arid area at lower elevations. The people are mostly smallholder agriculturalists producing both subsistence and market crops. Main food crops include maize, beans, potatoes and bananas. Cultivated cash crops include coffee, tea, cotton, and tobacco12. People keep few cattle, goats and chicken. The area is subject to drought every three to five years, with acute food shortages.
CHAPTER 6
116
During the study period there were droughts in 1998 and 1999 that resulted in low harvests of maize and beans.
Study subjects
Children enrolled in class 1 (median age 7 years) from twelve primary schools participated in the study (n 554). The analyses of this article were restricted to children who did not receive food supplements (n 128). For analyses of iron bioavailability, we excluded children with an energy intake > 5000 kcal (n 1), inflammation as indicated by plasma C-reactive protein concentrations > 10 mg/L and malaria as been tested positive with the Plasmodium falciparum malaria antigen test (in vitro antigen-capture strip method, Vision Biotech, Cape Town, South Africa) (n 46 of 124 children of whom data was available). The details of biochemical analyses have been described earlier10. This resulted in a sample size of 78.
Food intake measures
A semi-quantitative 24-hours recall method was administered at the child’s home by trained enumerators to estimate the daily energy and nutrient intakes of the study children. The details of food intake measures have been described by Murphy et al.13,14. For each household, a total of twenty-four food intake data sets were collected over a period of thirty-four months (twenty-three data sets from June 1998 to September 2000 and one data set in February/March 2001).
Calculations of iron absorption
The method used to predict iron absorption is based on an algorithm containing the value for iron absorption from a single basal meal that contains no components known to inhibit or enhance iron absorption15. This basal value can then be multiplied by dietary factors of iron bioavailability expressing the effect of different dietary components present in the meal known to influence iron absorption. Variables included in the calculations of the factors were phytate, ascorbic acid, meat, tannic acid equivalents, calcium and number of eggs. The dietary factors of iron bioavailability were calculated for each child and for each meal of the day when food intake data was available. Calculations of absorbed iron and zinc were based on meals9. The details of the calculations of iron absorption9 and zinc absorption16 have been described earlier.
Contents of energy, nutrients and phytate were obtained from the food composition data of the International Minilist that was developed for the WorldFood Dietary Assessment System, version 2.017.
Calculations of inadequate intakes of nutrients
The estimation of group prevalence of inadequate mineral and vitamin intakes used the Estimated Average Requirement (EAR) cut-point method18. The prevalence of inadequacy is the proportion of children with mean nutrient intakes during the study period below the median requirement (EAR)1,19,20.

HOUSEHOLD DIETARY STRATEGIES TO IMPROVE IRON NUTRITION
117
Modifications of the habitual diet
Theoretical modifications of the habitual diet were carried out by adjusting a meal of each of the twenty-four food intake data sets. Meat and ascorbic acid were used as iron absorption enhancers and an increase simulated by adding varying amounts of beef and mango to a meal. Similarly, we assessed the effects of reducing amounts of phytates and polyphenols, as could theoretically be achieved by food processing or excluding polyphenol containing beverages from a meal, respectively.
All analyses were performed using SAS software (version 8; SAS Institute Inc, Cary, NC).
RESULTS
Nutrient intakes from the habitual diet
Average daily intakes of energy and nutrients by the children are presented in Table 6.1. Iron intake, the fractional absorption of haem and non-haem iron, and the amount of absorbed iron had been estimated earlier9. Foods that contributed most to the iron intake were white maize (42%) and kidney beans (36%). Milk and beef contributed 0.6% and 0.3%, respectively, to the total iron intake. Lunch and dinner each contributed ~40% to the iron intake. Phytates and polyphenols reduced non-haem iron absorption from dinner by 78% and 22%, respectively, and calcium reduced non-haem and haem iron absorption from dinner by 17%. Ascorbic acid and meat increased the amount of absorbed non-haem iron from dinner by 62% and 9%, respectively. The resulting intake of absorbed iron was calculated to be 0.2 (SD 0.1) mg for dinner and 0.6 (SD 0.5) mg for the day9.
The prevalence of inadequate intake of vitamin B12 was 88%. The average daily calcium intake (296 (SD 97) mg) was much below the Adequate Intake of calcium for this age group (800 mg)19. The prevalence of inadequate iron and zinc intake in the study children was 77% and 51%, respectively. Intake of vitamin A was also low, with a prevalence of inadequate intake of 19%.
Modifications of the habitual diet
Increase in iron absorption enhancers
Beef is the type of meat mostly consumed in the study area and therefore we simulated the inclusion of varying amounts of beef to the daily dinner of the children (Table 6.2). The inclusion of 50 g beef at dinner increased the haem iron content by 0.27 mg and resulted in an increase by 95% (from 9% to 104%) of the enhancing effect of meat on non-haem iron absorption.

CHAPTER 6
118
Table 6.1 Daily intakes of energy and nutrients #
Mean SD Median Range
Energy Total energy, kJ 7319 1046 7440 4997-9987 kcal 1750 250 1779 1195-2388 Energy from animal source, kJ 381 326 293 29-2012 kcal 91 78 70 7-481
Macronutrients Protein, g 50.2 7.7 50.2 31.0-76.7 Protein from animal source, g 5.2 4.9 4.0 0.36-31.0 Carbohydrate, g 342 50.1 351.4 239.6-438.2 Fat, g 28.5 8.0 26.1 15.5-60.7 Fibre, g 41.2 8.7 41.3 19.0-58.4 Phytate, mg 2897 687 2932 1023-4250
Vitamins
Vitamin A, µg RAE 389.8 129.9 386.1 143.9-727.9 Vitamin E, mg α-TE 6.6 2.5 6.5 2.3-14.6 Ascorbic acid, mg 132.7 43.7 126.2 53.9-262.3 Thiamin, mg 1.7 0.3 1.7 0.8-2.3 Riboflavin, mg 1.1 0.2 1.1 0.8-1.8 Niacin, mg 13.7 2.6 13.9 7.5-18.8 Vitamin B6, mg 2.3 0.5 2.2 1.5-3.8 Folate, mg 492.7 114.9 500.0 200.2-707.2
Vitamin B12, µg 0.5 0.5 0.4 0.04-2.6 Minerals
Total Iron, mg 15.8 3.4 16.0 6.1-21.2 Haem iron, mg 0.05 0.07 0.03 0-0.6 Non-haem iron, mg 15.7 3.5 15.9 6.0-21.2 Absorbed iron, mg 0.56 0.36 0.45 0-1.55 Zinc, mg 8.0 1.3 8.2 5.1-10.7 Absorbed zinc, mg 1.1 0.2 1.1 0.7-1.9 Calcium, mg 295.9 96.9 276.5 143.8-756.9 Phosphorus, mg 1107 183 1121 712.0-1503.9 Magnesium, mg 487 94 496 249.2-661.9 Potassium, mg 3368 628 3401 1980.6-4791.0 Sodium, mg 1796 468 1175 912.1-2708.7 Copper, mg 1.6 0.3 1.6 1.0-2.2
RAE, retinol activity equivalents; α-TE, α-tocopherol equivalents. # n 78.
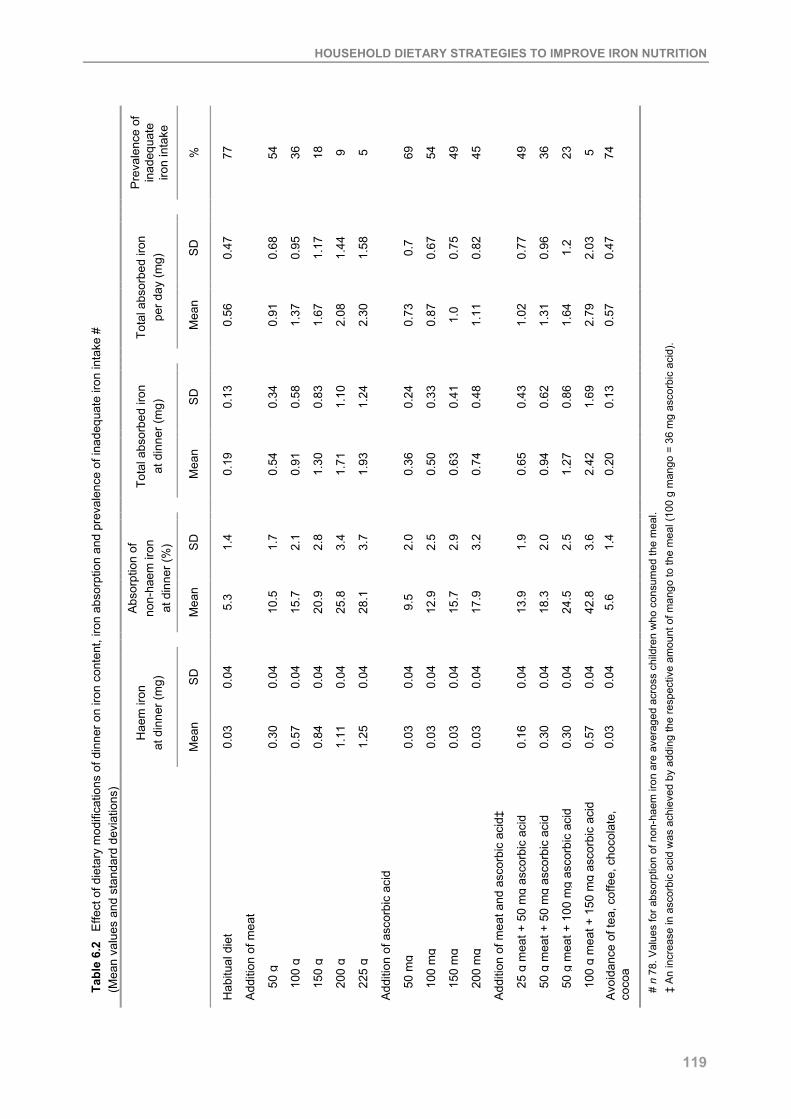
HOUSEHOLD DIETARY STRATEGIES TO IMPROVE IRON NUTRITION
119
Pre
vale
nce
of
inad
equa
te
iron
inta
ke
%
77 54
36
18
9 5 69
54
49
45 49
36
23
5 74
S
D
0.47
0.68
0.95
1.17
1.44
1.58
0.7
0.67
0.75
0.82
0.77
0.96
1.2
2.03
0.
47
Tota
l abs
orbe
d iro
n
per d
ay (m
g)
Mea
n
0.56
0.91
1.37
1.67
2.08
2.30
0.73
0.87
1.0
1.11
1.02
1.31
1.64
2.79
0.
57
S
D
0.13
0.34
0.58
0.83
1.10
1.24
0.24
0.33
0.41
0.48
0.43
0.62
0.86
1.69
0.
13
Tota
l abs
orbe
d iro
n
at d
inne
r (m
g)
Mea
n
0.19
0.54
0.91
1.30
1.71
1.93
0.36
0.50
0.63
0.74
0.65
0.94
1.27
2.42
0.
20
S
D
1.4
1.7
2.1
2.8
3.4
3.7
2.0
2.5
2.9
3.2
1.9
2.0
2.5
3.6
1.4
Abs
orpt
ion
of
non-
haem
iron
at
din
ner (
%)
Mea
n
5.3
10.5
15.7
20.9
25.8
28.1
9.5
12.9
15.7
17.9
13.9
18.3
24.5
42.8
5.
6
S
D
0.04
0.04
0.04
0.04
0.04
0.04
0.04
0.04
0.04
0.04
0.04
0.04
0.04
0.04
0.
04
Hae
m ir
on
at d
inne
r (m
g)
Mea
n
0.03
0.30
0.57
0.84
1.11
1.25
0.03
0.03
0.03
0.03
0.16
0.30
0.30
0.57
0.
03
Tabl
e 6.
2 E
ffect
of d
ieta
ry m
odifi
catio
ns o
f din
ner o
n iro
n co
nten
t, iro
n ab
sorp
tion
and
prev
alen
ce o
f ina
dequ
ate
iron
inta
ke #
(M
ean
valu
es a
nd s
tand
ard
devi
atio
ns)
Hab
itual
die
t
Add
ition
of m
eat
50
g
10
0 g
15
0 g
20
0 g
22
5 g
Add
ition
of a
scor
bic
acid
50
mg
10
0 m
g
15
0 m
g
20
0 m
g
Add
ition
of m
eat a
nd a
scor
bic
acid
‡
25
g m
eat +
50
mg
asco
rbic
aci
d
50
g m
eat +
50
mg
asco
rbic
aci
d
50
g m
eat +
100
mg
asco
rbic
aci
d
10
0 g
mea
t + 1
50 m
g as
corb
ic a
cid
Avo
idan
ce o
f tea
, cof
fee,
cho
cola
te,
coco
a
# n
78. V
alue
s fo
r abs
orpt
ion
of n
on-h
aem
iron
are
ave
rage
d ac
ross
chi
ldre
n w
ho c
onsu
med
the
mea
l. ‡
An
incr
ease
in a
scor
bic
acid
was
ach
ieve
d by
add
ing
the
resp
ectiv
e am
ount
of m
ango
to th
e m
eal (
100
g m
ango
= 3
6 m
g as
corb
ic a
cid)
.

CHAPTER 6
120
Non-haem iron absorption was increased from 5.3% to 10.5% and the total amount of absorbed iron at dinner increased from 0.19 mg to 0.54 mg, resulting in an increase from 0.56 mg to 0.91 mg of absorbed iron for the whole day.
We assessed the effect of increasing the intake of ascorbic acid by adding an amount of mango (fresh weight) providing an equivalent amount of ascorbic acid to the meal (Table 6.2). Dinner was chosen as the meal to be modified because a greater enhancing and counteracting effect of ascorbic acid was expected compared with the other meals due to a higher phytate and iron content and a lower consumption of fruits. The addition of 50 mg and 100 mg ascorbic acid, resulted in an increase in ~120% and ~230%, respectively, of the enhancing effect of ascorbic acid on non-haem iron absorption at dinner. However, to overcome the inhibiting effect of the average amount of phytates present at dinner, ~350 mg ascorbic acid would have to be consumed at the same meal. The inhibiting effect of polyphenols could be overcome with 100 mg ascorbic acid. The inclusion of either 50 g meat or 100 mg ascorbic acid to dinner of the habitual diet resulted in a decrease of the prevalence of inadequate iron intake by 23% from 77% of the habitual diet to 54% of the modified diet.
The combined addition of 50 g meat and 100 mg ascorbic acid to dinner resulted in an increase in non-haem iron absorption by 19% (from 5.3% of the habitual diet to 24.5% of the modified diet) and a decrease in the prevalence of inadequate iron intake by 54% from 77% of the habitual diet to 23% of the modified diet. In order to decrease the prevalence of inadequate iron intake to ~5%, 225 g beef or 100 g beef plus 150 mg ascorbic acid would have to be added to dinner.
Reduction of iron absorption inhibitors
Black tea, cocoa, and coffee were consumed by ~70%, ~5%, and ~2%, respectively, of the children per day. If the inhibiting effect of tea on iron absorption was tested by adding a cup of black tea (200 mL) to a meal of a typical dish (230 g of githeri, the staple dish based on maize and beans), the inhibiting effect of polyphenols increased from 27% to 78%. If the enhancing effect of ascorbic acid/meat/fish was considered, too, the inhibiting effect of polyphenols increased from 1% to 62%. The addition of a cup of tea to the meal would reduce non-haem iron absorption from 5% to 3%. At dinner, ~12% of the children consumed coffee, tea, cocoa, or chocolate and the exclusion of these drinks from all dinner meals resulted in an average increase in the absorption of non-haem iron by 0.3% and an increase in the amount of absorbed total iron by 0.01 mg, resulting in a decrease in the prevalence of inadequate iron intake of 3% (Table 6.2).
Use of household-level food processing methods to reduce the phytate content of foods
Of the household-level food processing methods known to reduce the phytate content of foods, only fermentation is commonly used in the study area in the process of preparing porridge. Habitually, ~18% of maize, sorghum and millet flour used to prepare porridge were fermented flours. However, porridge only contributed to 4% of the children’s phytate intake and therefore

HOUSEHOLD DIETARY STRATEGIES TO IMPROVE IRON NUTRITION
121
changes in food preparation of porridge are not expected to substantially increase iron bioavailability.
An increase in iron bioavailability might be achieved by household-level food processing methods that reduce the phytate content of the staple foods maize (Zea mays) and beans (kidney beans, Phaseolus vulgaris) as they contributed to 43% and 36% of the total iron intake and to 49% and 42% of the phytate intake, respectively. Almost 60% and 77% of maize and beans, respectively, were used in the staple dish githeri, which contributed to 60% of the total daily phytate intake of the children. Maize and beans used to prepare githeri could be soaked prior to cooking as is occasionally done in the study area. Soaking reduces the phytate content by passive diffusion and by enzymatic hydrolysis of higher inositol phosphates induced by the enhanced activity of endogenous phytase21. Soaking red kidney beans for 18 hours at 22°C prior to cooking for 90 minutes has been found to reduce phytate by 58%22. Soaking of maize flour or pounded maize was found to reduce content of higher inositol phosphates by 57% and 51% respectively23, but soaking of whole dry maize as used in the preparation of githeri is not likely to reduce the phytate content because it is difficult to be leached out of the whole grain (R. Gibson & C. Hotz, personal communication, August 2005). However, assuming that soaking the maize and beans used to prepare githeri would reduce phytate concentrations by 50%, this would result in a decrease in the daily phytate intake from 2897 (SD 687) mg to 2059 (SD 781) mg and an increase in the average daily non-haem iron absorption by 0.2% and an increase in daily absorbed total iron of 0.04 mg. Assuming again a 50% reduction in phytate in maize and beans used for all dishes and not just githeri, the daily phytate intake would decrease to 1584 (SD 585) mg, the average daily non-haem iron absorption increase by 0.4%, and the daily absorbed total iron increase by 0.06 mg. The prevalence of inadequate iron intake would be reduced by 3% for both methods.
Effect of dietary modifications on the intake of nutrients
Calcium intake would not be improved by any of the household dietary methods described above. The addition of 50 g meat to the habitual diet would reduce the prevalence of inadequate intake of vitamin B12 from 88% to 26%. Prevalences of inadequate intakes of zinc and vitamin B12, would be reduced to zero by the addition of 50 g meat and 75 g meat, respectively. If 50 mg ascorbic acid were added to the habitual diet by means of adding one mango (~140 g) to a meal, the prevalence of inadequate intake of vitamin A would be reduced to zero. Of the modifications we carried out, the combined inclusion of 75 g meat and 140 g mango (to provide 50 mg ascorbic acid) to dinner of the habitual diet would be sufficient to eliminate inadequate intakes of zinc and vitamins A and B12.
DISCUSSION
Simulations of household dietary strategies show that the addition of meat or ascorbic acid, both strong iron absorption enhancers, to a meal are the most efficacious approaches to increase

CHAPTER 6
122
dietary iron bioavailability in Kenyan school children. The calculated absorption-promoting effect of meat and ascorbic acid on non-haem iron in a meal was considerable. Additions of 50 g or 100 g beef resulted in an increase in non-haem iron absorption at dinner from 5.3% to 10.5% and 15.7%, respectively, and the addition of 50 mg and 100 mg ascorbic acid increased non-haem iron absorption from 5.3% to 9.5% and 12.9%, respectively. Adding 50 g beef or 100 mg ascorbic acid daily to a meal could reduce the prevalence of inadequate iron intake in the study population by 23%. However, to substantially reduce the prevalence of inadequate iron intake in the study population to 5%, large amounts of meat alone or in combination with ascorbic acid would be needed, such as 225 g meat or 100 g meat plus 150 mg ascorbic acid. With the addition of ascorbic acid alone to a meal it is not possible to reduce the prevalence of inadequacy to a level of 5%.
An increase in iron absorption through the addition of meat or ascorbic acid to meals has been shown in several studies. The addition of 50 g and 75 g pork meat to a phytate-rich meal was found to increase non-haem iron absorption by 44% and 57%, respectively24. Iron absorption was increased by 85% if 20 g meat were added to a weaning meal of whole wheat gruel25. An enhancing effect of ~140% and 165% on non-haem iron absorption was observed by adding 50 mg ascorbic acid or 75 g meat, respectively, to a simple Latin-American-type meal of maize, rice, and beans26. In another study, where 50 mg ascorbic acid was added to wheat rolls with no detectable phytate, an increase in iron absorption of 75% was found27.
Meat is rarely consumed by children in the study area, their average daily intake was 9 (SD 15) g (weight for uncooked meat), of which ~70% was beef. Meat was mostly used as an ingredient in stew. Several approaches exist to overcome economic, socio-cultural and household-level constraints in the production and consumption of animal source foods3,28-31. Most of these focus on rearing small animals such as rabbits, goats, or poultry or the inclusion of locally available low cost animal source foods, such as milk, eggs, offal, blood, or fish into the diets of children. Nevertheless an increase in the daily meat intake by 100 g or higher amounts needed to substantially decrease the prevalence of inadequate iron intake in the study population does not seem feasible.
Improvements in iron status were observed in community trials in anaemic Indian and Chinese children who were supplemented with 100 mg synthetic ascorbic acid at each of the two main meals for two months32 and 50 mg ascorbic acid for eight weeks33, respectively. Natural ascorbic acid consumed as foods has been shown to be as effective as synthetic ascorbic acid to improve iron absorption. Fruits and vegetables might even have a stronger iron enhancing effect because they contain also other acids besides ascorbic acid that might enhance iron absorption34. However, so far, no community interventions have been carried out using local food sources of ascorbic acid.
Fruits were the main source of ascorbic acid in the diet of the study children and the amount of 50 mg ascorbic acid is approximately contained in 1/5 of a papaya, one mango, one lemon, one orange, or two tomatoes. Our theoretical modifications show that additional amounts of more

HOUSEHOLD DIETARY STRATEGIES TO IMPROVE IRON NUTRITION
123
than 100 mg ascorbic acid daily to a main meal would be necessary to decrease the prevalence of inadequate iron intake in the study population to a level below 50%. The average ascorbic acid intake of our study children was 133 mg/d (Table 6.1) and children consume on average 200 g fruits at breakfast, lunch, and dinner, so an increase in ascorbic acid intake by 100 mg or 150 mg, e.g., provided by two (280 g) or three (420 g) mangoes, respectively, seems difficult to achieve. Further, little benefit has been found in quantities of ascorbic acid beyond 100 mg added to meals, and it appears that it is only useful to increase ascorbic acid intake in the range of 25 to 100 mg/meal34. Moreover, fruits are only available during certain seasons and are mostly consumed as snacks in between meals and not with the main meals that contain most of the iron. Other sources of ascorbic acid, such as vegetables, might not provide sufficient amounts to enhance iron absorption and it has to be considered that ascorbic acid is susceptible to losses during food preparation.
The comparison of a typical meal with and without tea showed that the exclusion of drinks like tea and coffee containing high amounts of polyphenols known as strong inhibitors of iron absorption from dinner can increase non-haem iron absorption. However, the avoidance of those drinks did not seem to have a noteworthy effect on the reduction of the prevalence of inadequate iron intake, probably because only 12% of the children consumed those drinks with their dinner. Further, it has to be considered that, because 84% of the milk consumed was used in tea, a negative consequence of excluding those drinks from the diet of the children, i.e., if they are not simply shifted to a different time, would be a reduction in calcium and vitamin B12 intakes, which are already critically low.
We found only a small increase in iron absorption for the study group if we assumed a 50% reduction in the phytate content of the staple foods maize and beans through household-level food processing methods, such as soaking. Further, almost all maize in the study area is consumed as whole grain and even a 50% reduction of phytate seems to be unlikely if only household food processing and preparation methods are used. In settings where cereal flour is the staple food, soaking, fermentation, and/or germination of cereals prior to grinding are likely to achieve greater reductions in phytate content and improvements in iron bioavailability. A study carried out in Malawi found improvements in iron status of children if phytate was reduced by 93% by soaking maize flour prior to cooking35. However, a commercial phytase was used in the soaking process, which is not likely to be accessible and affordable by rural people in developing countries. Improvements in iron status but no reduction in the prevalence of inadequate iron intake was found in a community-based study in Malawi where a number of dietary interventions, including food-processing methods, were combined3. In an earlier paper, we discussed the limitations inherent to estimating iron bioavailability and amount of iron absorbed using algorithms9. However, we believe that our methods give a good approximation and indication for further evaluations.
We conclude that of the household dietary strategies evaluated, only the addition of meat in combination with ascorbic acid, as potent iron absorption enhancers, may be efficacious in

CHAPTER 6
124
improving iron bioavailability. Increasing the consumption of meat seems to be the most logical strategy because it provides highly bioavailable haem iron in addition to enhancing iron absorption from other food sources. However, it is questionable if sufficient meat can be delivered to eliminate iron deficiency as a public health problem in rural Kenyan children. Also increasing fruit consumption to supply the amounts of ascorbic acid needed to substantially improve iron bioavailability might not be feasible and therefore the effectiveness of the use of synthetic ascorbic acid, such as powder or tablets, with the meals should be further evaluated. Nevertheless, because an increase in even small amounts of meat and fruits in the diet of children and/or the application of the other dietary strategies evaluated in the present article can improve iron bioavailability and help meeting requirements of zinc and vitamins A and B12 for an individual child, these approaches should be considered in any program aiming at improving micronutrient nutrition.
To substantially decrease the prevalence of inadequate iron intake for the total study population, the above mentioned dietary strategies must be combined with other strategies, such as iron supplementation, food fortification, and the use of genetically modified food crops with lower phytate and higher iron contents. A potential low-cost method to increase the iron content in foods is the use of iron pots for cooking36,37. Further, public health measures, such as treatment and prevention of intestinal parasites that cause blood loss and impair iron absorption, have to be undertaken.
ACKNOWLEDGEMENTS
We thank the children, families, and staff involved in the Kenya Child Nutrition Project, especially Constance Gewa who was in charge of all aspects of the feeding and food intake data collection and processing. We gratefully acknowledge Clive West (deceased August 2004) for his contribution in the formative stage of this article.
REFERENCES 1. Institute of Medicine (2001) Dietary Reference Intakes for vitamin A, vitamin K, arsenic, boron, chromium,
copper, iodine, iron, manganese, molybdenum, nickel, silicon, vanadium and zinc. Washington, DC: National Academy Press.
2. ACC/SCN (2000) Fourth report on the world nutrition situation. Geneva: ACC/SCN with IFPRI. 3. Gibson RS, Yeudall F, Drost N, Mtitimuni BM & Cullinan TR (2003) Experiences of a Community-Based Dietary
Intervention to Enhance Micronutrient Adequacy of Diets Low in Animal Source Foods and High in Phytate: A Case Study in Rural Malawian Children. J Nutr 133 (11): 3992S-9S.
4. Gibson RS & Hotz C (2001) Dietary diversification/modification strategies to enhance micronutrient content and bioavailability of diets in developing countries. Br J Nutr 85, Suppl 2: 159S-66S.
5. Yeudall G, Gibson R, Kayira C & Umar E (2002) Efficacy of a multi-micronutrient dietary intervention based on haemoglobin, hair zinc concentrations, and selected functional outcomes in rural Malawian children. Eur J Clin Nutr 56 (12): 1176-85.
6. Disler PB, Lynch SR, Torrance JD, Sayers MH, Bothwell TH & Charlton RW (1975) The mechanism of the inhibition of iron absorption by tea. S Afr J Med Sci 40: 109-16.
7. Prystai EA, Kies CV & Driskell JA (1999) Calcium, copper, iron, magnesium and zinc utilization of humans as affected by consumption of black, decaffeinated black and green teas. Nutr Res 19 (2): 167-77.
HOUSEHOLD DIETARY STRATEGIES TO IMPROVE IRON NUTRITION
125
8. Bravo L (1998) Polyphenols: chemistry, dietary sources, metabolism, and nutritional significance. Nutr Rev 56: 317-33.
9. Grillenberger M, Neumann C, Bwibo NO, Murphy SP, Verhoef H & Hautvast JGAJ. High prevalence of inadequate iron intake in rural Kenyan schoolchildren [submitted for publication]. (Chapter 5)
10. Siekmann JH, Allen LH, Bwibo NO, Demment MW, Murphy SP & Neumann CG (2003) Kenyan school children have multiple micronutrient deficiencies, but increased plasma vitamin B-12 is the only detectable micronutrient response to meat or milk supplementation. J Nutr 133 (11): 3972S-80S.
11. Neumann CG, Bwibo NO, Murphy SP, et al. (2003) Animal Source Foods Improve Dietary Quality, Micronutrient Status, Growth and Cognitive Function in Kenyan School Children: Background, Study Design and Baseline Findings. J Nutr 133 (11): 3941S-9S.
12. Office of the Vice-President and Ministry of Planning and National Development/Republic of Kenya (1997) Embu District Development Plan 1997-2001. Nairobi: Government Printer.
13. Murphy SP, Gewa C, Liang L-J, Grillenberger M, Bwibo NO & Neumann CG (2003) School snacks containing animal source foods improve dietary quality for children in rural Kenya. J Nutr 133 (11): 3950S-6S.
14. Murphy SP, Gewa C, Grillenberger M & Neumann CG (2004) Adapting an international food composition table for use in rural Kenya. J Food Comp Anal 17: 523-30.
15. Hallberg L & Hulthén L (2000) Prediction of dietary iron absorption: an algorithm for calculating absorption and bioavailability of dietary iron. Am J Clin Nutr 71: 1147-60.
16. Murphy SP, Beaton GH & Calloway DH (1992) Estimated mineral intakes of toddlers: predicted prevalence of inadequacy in village populations in Egypt, Kenya, and Mexico. Am J Clin Nutr 56: 565-72.
17. Calloway DH, Murphy SP, Bunch S & Woerner J (1994) WorldFood 2 Dietary Assessment System. Available at http://www.fao.org/infoods/software_worldfood_en.stm (accessed 1 April 2005).
18. Institute of Medicine (2000) Dietary reference intakes: Applications in dietary assessment. Washington, DC: National Academy Press.
19. Institute of Medicine (2001) Dietary Reference Intakes for Calcium, Phosphorus, Magnesium, Vitamin D, and Fluoride. Washington, DC: National Academy Press.
20. Institute of Medicine (1998) Dietary Reference Intakes for thiamin, riboflavin, niacin, vitamin B6, folate, vitamin B12, pantothenic acid, biotin, and choline. Washington, DC: National Academy Press.
21. Lásztity R & Lásztity L (1990) Phytic acid in cereal technology. Advances in Cereal Science Technology 10: 309-71.
22. Iyer V, Salunkhe DK, Sathe SK & Rockland LB (1980) Quick-cooking beans (Phaseolus vulgaris L). 2. Phytates, oligosaccharides, and anti-enzymes. Plant Food Hum Nutr 30: 45-52.
23. Hotz C & Gibson RS (2001) Assessment of home-based processing methods to reduce the phytate content and phytate/zinc molar ratios of white maize. J Agric Food Chem 49: 692-8.
24. Bæch SB, Hansen M, Bukhave K, et al. (2003) Nonheme-iron absorption from a phytate-rich meal is increased by the addition of small amounts of pork meat. Am J Clin Nutr 77 (1): 173-9.
25. Hallberg L, Hoppe M, Andersson M & Hulthén L (2003) The role of meat to improve the critical iron balance during weaning. Pediatrics 111: 864-70.
26. Hallberg L & Rossander L (1984) Improvement of iron nutrition in developing countries: comparison of adding meat, soy protein, ascorbic acid, citric acid, and ferrous sulphate on iron absorption from a simple Latin American-type of meal. Am J Clin Nutr 39 (4): 577-83.
27. Hallberg L, Brune M & Rossander L (1989) Iron absorption in man: ascorbic acid and dose-dependent inhibition by phytate. Am J Clin Nutr 49: 140-4.
28. Ayele Z & Peacock C (2003) Improving Access to and Consumption of Animal Source Foods in Rural Households: The Experiences of a Women-Focused Goat Development Program in the Highlands of Ethiopia. J Nutr 133 (11): 3981S-6S.
29. Creed-Kanashiro HM, Bartolini RM, Fukumoto MN, Uribe TG, Robert RC & Bentley ME (2003) Formative Research to Develop a Nutrition Education Intervention to Improve Dietary Iron Intake among Women and Adolescent Girls through Community Kitchens in Lima, Peru. J Nutr 133 (11): 3987S-91S.
30. Maretzki AN & Mills EW (2003) Applying a NutriBusiness Approach to Increase Animal Source Food Consumption in Local Communities. J Nutr 133 (11): 4031S-5S.
31. Roos N, Islam MM & Thilsted SH (2003) Small Indigenous Fish Species in Bangladesh: Contribution to Vitamin A, Calcium and Iron Intakes. J Nutr 133 (11): 4021S-6S.
32. Seshadri S, Shah A & Bhade S (1985) Haematologic response of anaemic preschool children to ascorbic acid supplementation. Hum Nutr Appl Nutr 39 (2): 151-4.
33. Mao X & Yao G (1992) Effect of vitamin C supplementations on iron deficiency anemia in Chinese children. Biomed Environ Sci 5: 125-9.
34. Allen L & Ahluwalia N (1997) Improving Iron Status through Diet. The Application of Knowledge Concerning Dietary Iron Bioavailability in Human Populations. Washington, DC: OMNI Project.

CHAPTER 6
126
35. Manary M, Krebs N, Gibson R, Broadhead R & Hambidge K (2002) Community-based dietary phytate reduction and its effect on iron status in Malawian children. Ann Trop Paediatr 22 (2): 133-6.
36. Prinsen Geerligs PD, Brabin BJ & Omari AAA (2003) Food prepared in iron cooking pots as an intervention for reducing iron deficiency anaemia in developing countries: a systematic review. J Hum Nutr Diet 16 (4): 275-81.
37. Prinsen Geerligs PD, Brabin BJ, Hart DJ & Fairweather-Tait SJ (2004) Iron contents of Malawian foods when prepared in iron cooking pots. Int J Vitam Nutr Res 74 (1): 21-6.

77
GGeenneerraall ddiissccuussssiioonn

CHAPTER 7
128
The research presented in this thesis is based on a randomised controlled feeding intervention study. The study was designed to compare the efficacy of three food supplements in improving cognitive function, growth and morbidity in rural Kenyan school children. The food supplements contained meat or milk or no animal source foods and were provided over a period of 2 years1. The effects of the food supplementation on growth (chapter 2) and morbidity (chapter 4) were examined and it was determined which specific nutrients from the total diet predicted growth (chapter 3). The habitual diet of the children was evaluated for its content in iron and components influencing iron absorption. The amount of iron absorbed from the habitual diet was estimated and the prevalence of inadequate iron intake in the study population determined (chapter 5). Simulations of household dietary strategies were carried out and their potential for improving iron nutrition examined (chapter 6). The main findings of the thesis are summarised in Table 7.1. Methodological issues of the study, which have already been discussed to some extent in the previous chapters, are further evaluated for their effects on the validity of the study results. The findings of the study are reviewed and a final conclusion, implications, and suggestions for future research presented.
METHODOLOGICAL ISSUES
Selection of subjects
Only school children and only twelve of the eighteen primary schools that exist in the study area were included in the study (chapter 1). This selection can be assumed to have substantially increased provision of food supplements to each subject, compliance to the feeding and completeness of information obtained and consequently internal validity of the study. Children living in the study area who were excluded from the study, e.g., those who did not attend school or those who live in the remote areas, might have differed in certain characteristics from subjects under study with the consequence that results cannot easily be extrapolated to them. However, the study was designed as an efficacy study where external validity is subordinate. Further, it is likely that an effect of the intervention might have even been greater in children who were younger and/or, due to less favourable living conditions, were more stunted, less well nourished, and/or more prone to infectious diseases.
Allocation of subjects to study groups
The twelve primary schools selected for participation in the study were randomised to the three supplementation groups and the control group. However, in order to achieve comparable sample sizes for each group randomisation was restricted, such as that three of the larger schools comprising two or more standard I classes were first randomised among the groups and the other smaller schools with one standard I class were then randomised to each of the four groups. Although desirable, it was not feasible to randomise treatment by subjects for reasons of logistics and blinding of treatments.

GENERAL DISCUSSION
129
Table 7.1 Summary of main findings
Research question Main findings
What are the effects of animal source foods on growth and body composition? (Chapter 2)
Mean weight gain (23 months) Meat group: 3.89 (SD 0.09) kg*1 Milk group: 3.86 (SD 0.08) kg*1 Energy group: 3.89 (SD 0.09) kg*1
Control group: 3.49 (SD 0.09) kg Mean mid-upper-arm muscle area gain (23 months) Meat group: 153.91 (SD 10.10) mm2 *2,3,4 Milk group: 117.98 (SD 9.96) mm2 *1 Energy group: 115.53 (SD 10.4) mm2 Control group: 84.64 (SD 10.1) mm2 Children who were more stunted (HAZ < 1.4 (median)): Children in milk group gained 1.3 cm (15%) more height than children in
control group and 1 cm (11%) more height than children in meat group. Which specific nutrients from the total diet predict growth? (Chapter 3)
Positive predictors of growth Height Energy from animal source foods, haem iron, preformed vitamin A,
calcium, vitamin B12 Weight Energy from animal source foods, haem iron, preformed vitamin A,
calcium, vitamin B12 Mid-upper-arm muscle area Energy from animal source foods, vitamin B12 Mid-upper-arm fat area Energy from animal source foods
Negative predictors of growth Height Total energy, copper, magnesium, phosphorus, potassium, fibre Weight Copper, magnesium, phytate, fibre Mid-upper-arm muscle area Available iron, magnesium, phosphorus, potassium, phytate, fibre Mid-upper-arm fat area Total energy, copper, magnesium, phosphorus, phytate, fibre
What are the effects of animal source foods on morbidity? (Chapter 4)
No effects of any of the food supplements on period prevalence of diseases and indicators of illness severity. No significant differences between the study groups. Trend of lower predicted risks for most diseases and indicators of illness severity for milk group (not statistically significant).
What is the amount of iron absorbed from the habitual diet and what is the prevalence of inadequate iron intake in the study population? (Chapter 5)
Habitual diet Daily intakes Total iron: 15.8 (SD 3.4) mg Non-haem iron: 15.7 (SD 3.5) mg Haem iron: 0.05 (SD 0.07) mg Absorbed iron: 0.56 (SD 0.47) mg Prevalence of inadequate iron intake: 77%
What is the potential of household dietary strategies to improve iron nutrition? (Chapter 6)
Modification of habitual diet Addition of iron absorption enhancers to a meal + 50 g beef + 100 mg ascorbic acid + 50 g beef + 100 mg ascorbic acid + 100 g beef + 150 mg ascorbic acid
Absorbed iron, mg
0.91 (SD 0.68) 0.87 (SD 0.67) 1.64 (SD 1.2)
2.79 (SD 2.03)
Prevalence of inadequate iron intake
(%)
54 54 23 5
Other dietary strategies did not decrease the prevalence of inadequate iron intake.
* Differences were statistically significant: 1from control group (p < 0.05); 2from control group (p < 0.01); 3from milk group (p < 0.05); 4from energy group (p < 0.05).

CHAPTER 7
130
If treatment had been randomised by subjects, each school would have had to be accessed for food delivery, and food supplement distribution would have been more complicated and prone to errors. If children in the same school class had received different types of food supplements or no supplement, they would have been aware of the different treatments in the study, which might have led to an undesirable change in their home diet. For these reasons, it is common practice in food intervention studies where the study groups don’t receive similar food stuffs that cannot easily be distinguished to allocate treatments by larger units, such as villages or schools. Our study outcomes, i.e., growth and morbidity, are not likely to have been directly influenced by choosing schools as the unit of randomisation because these are outcomes independent of school (in contrast to measurements related to schools such as classroom observations). Nevertheless, the validity of our results might have been affected by this randomisation process if children in the study groups differed in certain characteristics that influence the outcome measures. In fact, children in the meat group were older, taller, and heavier at baseline than the other children. Further, all schools in the meat group happened to be located in the lower, less fertile zone of the study area, whereas two schools of each of the other groups were located in the upper zone and only one school in the lower zone. In addition to possible habitual differences in socio-economic status, nutrition, and health, people living in the lower zone of the study area were more affected by the droughts that occurred during the study period. Their food production and consumption might therefore have been more hampered than that of people living in the upper zone. However, in our statistical analyses we accounted for the fact that food supplements were randomised by schools by including school as a random factor. Further, other factors, such as sex, age, and socio-economic status were controlled for in all analyses and we therefore believe that the results are valid.
Blinding
In order to avoid information bias, it would have been preferable to carry out the study with triple-blindness, i.e., subjects, project staff, and data analysts are kept unaware of school allocation to supplementation or control group. The nature of a community-based study of this magnitude and duration providing food supplements made blinding virtually impossible to be maintained throughout the study. However, the community and project staff were kept blind to study hypotheses as much as possible. Lack of blinding could have led to differences in measurements of outcome variables between groups. Measurements of anthropometry were not likely to having been influenced by subjectivity of the enumerators, as against measurements of morbidity that were more prone to participant and observer effects because they were collected by interview. In order to minimize subjective influence on data collection, a number of procedures were incorporated in the study, such as duplicate or triplicate measurements of anthropometry by two enumerators, monitoring of intra-team and inter-team measurement error, reliability checks, repeated training, and rotation of enumerators between all schools. The lack of complete blinding is therefore not expected to having biased the study results.

GENERAL DISCUSSION
131
Assessment of outcome
Morbidity was measured as disease events having occurred in the week prior to the interview. This has the advantage that respondents are more likely to remember facts compared with a longer recall period. Interviews are more prone to bias than measurements such as those carried out for anthropometry, because e.g., the educational status of the respondent might influence their knowledge about diseases. However in our study, the educational level of mothers and fathers, who were the main respondents in the interviews, were comparable between groups and this was not likely to have affected the validity of the morbidity measurements. Due to financial and logistical restrictions, morbidity interviews were carried out only once per month in the first study year and once every two months in the second study year. Children who were found severely ill or anaemic at any time point of the study were referred for treatment, which would have been unethical not to do so. For these reasons, illness prevalence and severity might have been underestimated. Of particular concern are diseases that do not occur frequently and might not have always been captured by the interviews. However time sampling over two years and over all seasons should have given a fair estimate of morbidity. Most importantly assessment of morbidity was similar for all children in all supplementation and control groups and validity of results, which is based on group comparisons, is therefore not likely to be affected. Nevertheless the lack of sensitivity in measuring morbidity might explain our null-findings on the effect of the food supplements on morbidity.
Study duration
Food supplements were provided for 23 months and this duration can be expected to having been sufficiently long to detect any changes in growth and morbidity. Studies of single micronutrient supplementations could already demonstrate an effect on growth for durations as short as eight weeks2. One study was carried out for ~2 years, a similar duration than our study3. However, quantities of micronutrients provided in those studies were much higher than those provided by the food supplements and impacts expected to be seen faster. A study showing positive effects on growth through the provision of a milk powder supplement to children was carried out for five months4 and another study providing milk-based formula for 1 year found beneficial effects on growth during the first six months of the study5.
Compliance and follow-up
Compliance to the food supplements was very high, of those who attended school, 99.4% ate all of the food provided. As can be expected in a large-scale 2-year long intervention study, a number of children were lost to follow-up. Of the 554 children who were eligible for participation in the study seven moved out of the study area before the feeding started and fifty-one moved out mid-study. Some children never came to school (n 17) and some children left school, but came back later (n 9). Two households refused participation throughout the study period. One child died during the study period. The total amount of food supplement consumed therefore decreased in the course of the study. However, absenteeism from school and the amount of

CHAPTER 7
132
food supplement consumed as a proportion of the total amount provided was similar for the supplementation groups: 82.7% for the meat supplement, 81.5% for the milk supplement (81.1% for the milk itself), and 82.1% for the energy supplement. Non-compliance to the food supplement was small and similar for all supplementation groups and results are not likely to having been biased by selective dropout.
Data analysis
Data analysis was carried out on an intention-to-treat basis and involved all children who were originally included in the study irrespective of their compliance or dropout. However, data from children who changed school (n 17) or received the energy supplement instead of the originally assigned meat or milk supplement due to food preferences or health reasons (n 17) were excluded from the time point of change of supplement or dropout. This was deemed necessary because the study was an efficacy trial and including data from a child receiving a different food supplement than analysed for might have confounded the results. Further, our investigations were of explanatory nature and intention-to-treat is more suitable for pragmatic trials of effectiveness6.
Confounding
The study outcomes can be influenced by various other factors than the provision of the food supplement. Growth as well as morbidity is the result of genetic and environmental influences. Growth can largely be attributed to nutritional wellbeing (chapter 1) and exposure to and treatment of infectious diseases. Morbidity in turn is determined by the nutritional status of a person (chapter 1) and the health care received. Underlying factors are therefore socio-economic status and other family characteristics. Randomisation should have assured that potential known and unknown confounding factors were balanced amongst groups. However, due to restrictions in randomisation, as mentioned above, study groups might have differed in certain characteristics affecting the outcomes. This problem was addressed by adjusting the multivariate models for age, sex, socio-economic status, and various others potential confounders. Nevertheless, statistical analysis cannot fully control the problem and it cannot be ruled out that confounding factors remained unrecognised and/or that the factors we measured at baseline changed differently over time in the study groups.
Intake of energy and nutrients from food supplements and home diet
The habitual diet of the children was deficient in nutrients that are important for growth and health. The food supplements were designed to improve dietary quality, i.e., to increase the intake of the deficient nutrients and to meet gaps between actual daily energy and nutrient intakes and recommended amounts. Certain aspects related to the study design, type of study, unforeseen circumstances, and the study population itself are evaluated in the following section for their consequences on the intake of energy and nutrients in the children and the validity of the results.
GENERAL DISCUSSION
133
Frequency of distribution and amount of food supplement consumed
Because schools were chosen as the feeding site, children did not receive the food supplement on a daily basis. No food was provided on week-ends and holidays and during several teachers’ strikes, resulting in 54% days of feeding of the total days of the supplementation period. Considering leftovers of food, absenteeism from school, and drop outs, ~80% of the total amount of food supplements was actually consumed on the days when food was provided.
Proximate analysis of food supplements
In a study where foods are provided and not tablets of which the nutrient content is exactly known and constant, it is possible that the actual content of energy and nutrients slightly varies over time and/or differs from what is theoretically calculated. Reasons could be an unknown nutrient content of the food items used and/or inconsistencies in the food preparation. The latter is not very likely to have occurred in our study, because detailed preparation protocols were followed and regular checks performed. Once per school term, the food supplements were examined for their energy and macronutrient content. The average analysed energy content was consistently lower for all supplements than the targeted energy content, i.e., 250 kcal for the first school term and 300 kcal for the consecutive school terms. The energy content was on average 69 kcal lower for the meat supplement, 33 kcal lower for the milk supplement and 54 kcal lower for the energy supplement. However, each time immediately after the results of the food analyses were known, the food preparation methods were verified and if necessary adjustments done accordingly. It could also just be that the sample collected for analyses had a too high portion of gravy (the soupy or liquid portion) and too little solid food and therefore the total energy content was analysed to be lower. Nevertheless, it cannot be ruled out that the children were actually provided with lower amounts of energy and nutrients than was planned.
Content of bioavailable iron and zinc in food supplements
If the iron absorption algorithm of Hallberg and Hulthén7 (chapter 5) was applied to calculate the content of bioavailable iron in the food supplements, results differed from those originally calculated using the approach by Murphy et al.8 (Table 1.2, chapter 1). The difference can be mainly attributed to the meal-based (Hallberg and Hulthén) v. day-based (Murphy et al.) calculations. The content of bioavailable iron in the food supplements as calculated using the approach of Hallberg and Hulthén v. that of Murphy et al. was 0.28 mg v. 0.26 mg in the meat supplement, 0.03 mg v. 0.18 mg in the milk supplement, and 0.10 mg v. 0.36 mg, respectively, in the energy supplement. Similarly, values for bioavailable zinc differed if they were calculated meal-based v. day-based: 1.24 mg v. 0.46 mg for the meat supplement, 0.26 mg v. 0.23 mg for the milk supplement, and 0.17 mg v. 0.22 mg for the energy supplement. These revised values are more likely to reflect reality and substantiate the study hypothesis, i.e., that the meat supplement would provide significantly higher amounts of bioavailable iron and bioavailable zinc compared with the other food supplements. Consequently the effects of meat on growth and morbidity would have been expected to be even stronger than anticipated.
CHAPTER 7
134
Bioavailability of iron and zinc in the home diet
Intakes of bioavailable iron from the home diet using the meal-based algorithm of Hallberg and Hulthén7 (chapter 5), would be only about 1/3 compared with intakes that were calculated using the day-based algorithm of Murphy et al.8 (0.47 mg v. 1.44 mg for baseline intakes, 0.43 mg v. 1.35 mg for feeding period intakes). Meal-based calculations of bioavailable zinc would result in slightly higher intakes compared with day-based calculations (1.21 mg v. 1.06 mg for baseline intakes, 1.08 mg v. 0.90 mg for feeding period intakes). The lower than previously assumed intake of bioavailable iron would negatively affect study outcomes because this was a nutrient specifically targeted for by the study. This could explain why we did not find some of the anticipated effects of the meat supplement on growth and morbidity.
Changes in energy and nutrient intake during the feeding period
During both study years there was a drought impairing harvests of crops and consequently food intake by the study children. Further, it could be that the provision of food to the children at home was changed as a consequence of the food supplementation, although the importance of maintaining their normal diet was explained to the study participants. A lower than usual home food intake might have counterbalanced energy and nutrient intakes from the food supplements and led to a reduction in the magnitude of the effects on growth and morbidity. However, it could also be argued that the effect of the provision of food supplements might have even had a greater impact if their proportion increased in relation to the home food intake. It also has to be considered that the anticipated difference in energy and nutrient intakes between study groups might not have been achieved if the home food intake changed differently between study groups. Energy and nutrient intakes at baseline and during the feeding period and intakes from the food supplements are presented in Table 7.2.
Changes in energy intake during the feeding period
Increases in energy intakes through the food supplements should have been similar for the meat, milk and energy groups. However, it seems that the food intake at home during the study period changed differently amongst the study groups. This had been indicated by preliminary analyses on part of the food intake data9. Home energy intake decreased in children in the milk and energy groups and increased in children in the meat and control group. Home energy intakes during the feeding period in the meat group were therefore ~100 kcal (418 kJ) higher compared with the children in the milk group and energy group but almost the same as energy intakes in the control group.
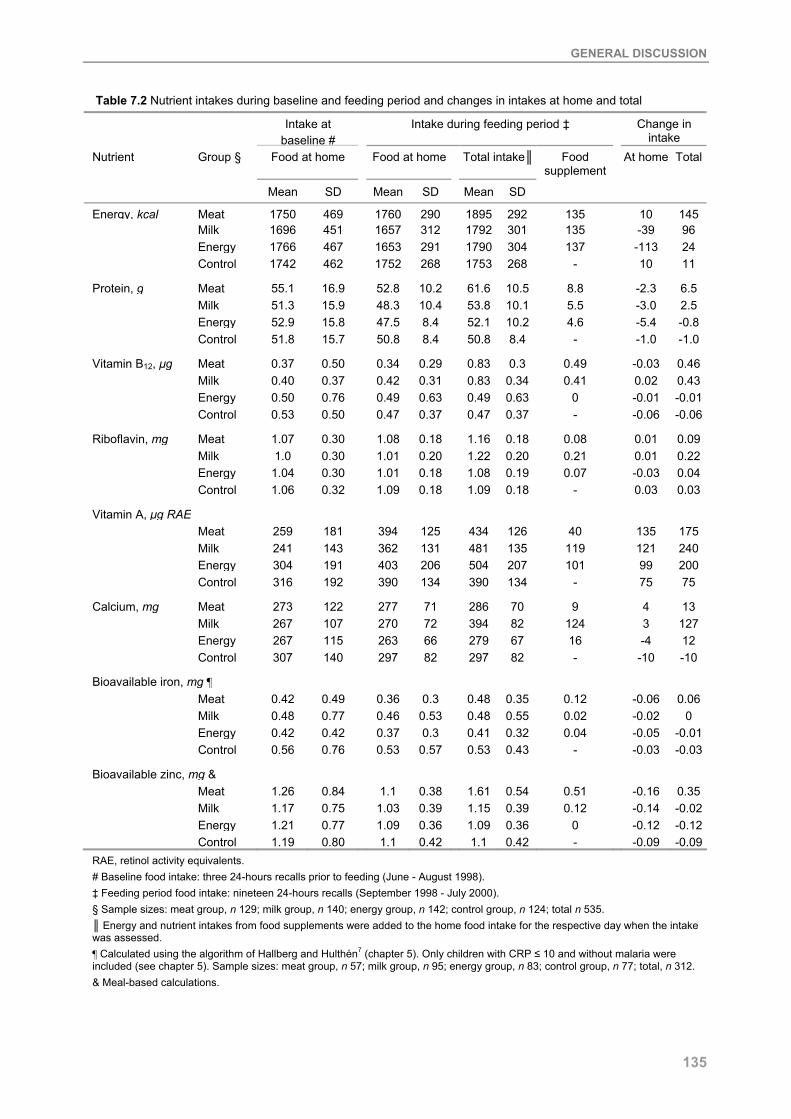
GENERAL DISCUSSION
135
Table 7.2 Nutrient intakes during baseline and feeding period and changes in intakes at home and total
Intake at baseline #
Intake during feeding period ‡ Change in intake
Nutrient Group § Food at home Food at home Total intake║ Food supplement
At home Total
Mean SD Mean SD Mean SD
Energy, kcal Meat 1750 469 1760 290 1895 292 135 10 145 Milk 1696 451 1657 312 1792 301 135 -39 96 Energy 1766 467 1653 291 1790 304 137 -113 24 Control 1742 462 1752 268 1753 268 - 10 11
Protein, g Meat 55.1 16.9 52.8 10.2 61.6 10.5 8.8 -2.3 6.5 Milk 51.3 15.9 48.3 10.4 53.8 10.1 5.5 -3.0 2.5 Energy 52.9 15.8 47.5 8.4 52.1 10.2 4.6 -5.4 -0.8 Control 51.8 15.7 50.8 8.4 50.8 8.4 - -1.0 -1.0
Vitamin B12, µg Meat 0.37 0.50 0.34 0.29 0.83 0.3 0.49 -0.03 0.46 Milk 0.40 0.37 0.42 0.31 0.83 0.34 0.41 0.02 0.43 Energy 0.50 0.76 0.49 0.63 0.49 0.63 0 -0.01 -0.01 Control 0.53 0.50 0.47 0.37 0.47 0.37 - -0.06 -0.06
Riboflavin, mg Meat 1.07 0.30 1.08 0.18 1.16 0.18 0.08 0.01 0.09 Milk 1.0 0.30 1.01 0.20 1.22 0.20 0.21 0.01 0.22 Energy 1.04 0.30 1.01 0.18 1.08 0.19 0.07 -0.03 0.04 Control 1.06 0.32 1.09 0.18 1.09 0.18 - 0.03 0.03
Vitamin A, µg RAE Meat 259 181 394 125 434 126 40 135 175 Milk 241 143 362 131 481 135 119 121 240 Energy 304 191 403 206 504 207 101 99 200 Control 316 192 390 134 390 134 - 75 75
Calcium, mg Meat 273 122 277 71 286 70 9 4 13 Milk 267 107 270 72 394 82 124 3 127 Energy 267 115 263 66 279 67 16 -4 12 Control 307 140 297 82 297 82 - -10 -10
Bioavailable iron, mg ¶ Meat 0.42 0.49 0.36 0.3 0.48 0.35 0.12 -0.06 0.06
Milk 0.48 0.77 0.46 0.53 0.48 0.55 0.02 -0.02 0 Energy 0.42 0.42 0.37 0.3 0.41 0.32 0.04 -0.05 -0.01 Control 0.56 0.76 0.53 0.57 0.53 0.43 - -0.03 -0.03
Bioavailable zinc, mg & Meat 1.26 0.84 1.1 0.38 1.61 0.54 0.51 -0.16 0.35
Milk 1.17 0.75 1.03 0.39 1.15 0.39 0.12 -0.14 -0.02 Energy 1.21 0.77 1.09 0.36 1.09 0.36 0 -0.12 -0.12 Control 1.19 0.80 1.1 0.42 1.1 0.42 - -0.09 -0.09RAE, retinol activity equivalents. # Baseline food intake: three 24-hours recalls prior to feeding (June - August 1998). ‡ Feeding period food intake: nineteen 24-hours recalls (September 1998 - July 2000). § Sample sizes: meat group, n 129; milk group, n 140; energy group, n 142; control group, n 124; total n 535. ║ Energy and nutrient intakes from food supplements were added to the home food intake for the respective day when the intake was assessed. ¶ Calculated using the algorithm of Hallberg and Hulthén7 (chapter 5). Only children with CRP ≤ 10 and without malaria were included (see chapter 5). Sample sizes: meat group, n 57; milk group, n 95; energy group, n 83; control group, n 77; total, n 312. & Meal-based calculations.
CHAPTER 7
136
If energy intake is not appropriately controlled for in statistical analyses, interpretation of results could be affected for those analyses where the direct effect of the food supplements on growth and morbidity was examined (chapters 2 and 4). At the time the effects of the food supplements on growth were evaluated, complete food intake data was not yet available and statistical analyses therefore only controlled for baseline, but not total energy intake.
It is therefore difficult to disentangle if the higher energy intake in the children in the meat group or the nutrients provided by meat were responsible for the growth outcomes. In contrast, the analyses of the effects of the food supplements on morbidity were controlled for total energy intake. It is therefore not likely that the validity of the results for morbidity is restricted by the inequality of energy intakes between groups.
Changes in nutrient intakes during the feeding period
It was assumed that children receiving the meat supplement would have higher increases in intakes of vitamin B12, bioavailable iron, and bioavailable zinc and that children receiving the milk supplement would have higher increases in intake in vitamin A, calcium, and riboflavin compared with the children in the energy group who received a food supplement that does not contain animal source foods or those in the control group who did not receive a food supplement.
At baseline, children in the control group had higher home vitamin A intakes than those in the milk group and children in the energy group had higher vitamin A intakes than those in the milk and meat groups9. It seems that home vitamin A intake was higher in all groups during the feeding period compared with baseline. A possible explanation is that seasons with high fruit intake (the main source of retinol equivalents) fell into the feeding period. Because increases in home vitamin A intake were greater in the meat and milk group than in the energy and control group, the baseline differences were alleviated to some degree. However, it seems that total vitamin A intake was highest for the energy group, which is due to the high vitamin A intake at home, but also due to the use of fat that is fortified with retinol in the preparation of the food supplements. Consequently, the anticipated higher intakes of vitamin A through the provision of milk might not have been achieved. This could partly explain why we did not find all anticipated effects of the milk supplement on growth and morbidity.
At baseline, children in the control group had higher calcium intakes than those in all other groups9. However, it seems that the difference in calcium intake between the milk group and the other groups during the feeding period was almost as large as anticipated. Home intakes of riboflavin, vitamin B12, and bioavailable iron seemed to have been more or less constant from baseline to the feeding period in all groups. Therefore the increase in total intake in these nutrients by the amount provided by the food supplements should have been as high as anticipated. However, for bioavailable iron, it could be that the anticipated higher intake in the meat group compared with the other groups was not achieved. This might have been due to the above mentioned lower than previously assumed intake in bioavailable iron from the food

GENERAL DISCUSSION
137
supplements and home diet, the less frequent distribution of the food supplements, and differences in home iron intake during the feeding period between study groups. Effects of meat on growth and morbidity might therefore have been less pronounced.
The baseline intake of bioavailable zinc was significantly higher for the meat group than for the milk and control groups9. Home intakes of bioavailable zinc decreased in all study groups, probably as a consequence of the droughts that occurred during the study period with less maize and beans available for consumption. The decrease was highest for the meat and lowest for the control group, which alleviated the baseline differences to some extent. However, the decrease in home zinc intake might have counterbalanced increases in bioavailable zinc through the meat supplement and effects on growth and morbidity might have been less strong.
Adequacy of energy and nutrient intakes
Total daily energy expenditure of children aged 5-9 years in developing rural areas is estimated to be ~80 kcal/kg (335 kJ/kg)10. At baseline, the children weighed ~20 kg, suggesting an energy requirement of ~1600 kcal/d (6694 kJ/d). Energy intakes might have been adequate on average at baseline9. During the feeding period, average energy intakes at home ranged from 1568 (SD 650) kcal during a drought period in November/December 1999 to 1923 (SD 639) kcal in February/March 2000 when there was a good harvest of staple crops. By the end of the study, children had gained 3-4 kg, increasing their energy needs by 240-320 kcal/d (1004-1339 kJ/d). Therefore, during periods of poor harvest and towards the end of the study, it is questionable if children received sufficient energy even those who consumed the supplements. Further, it is difficult to evaluate true adequacy without knowing activity levels, because these children often walk long distances to and from school and participate in many household chores. In addition, because a number of the children are small for their age (chapter 2), it is possible that additional energy would be needed for catch-up growth. More children (2.4%) were wasted at the end of the study, which could also be indicative of an insufficient energy intake.
Recommended intakes of riboflavin (0.6 mg)11 and vitamin A (400 µg RAE)12 were probably met on average by children in all study groups during the feeding period. Approximately 60% of the children in the energy and control groups and 30% of the children in the meat and milk groups did not meet the recommended intake of vitamin B12 (1.2 µg)11. Adequate intake of calcium (800 mg)13 was not met by ~65% of children in the meat, energy and control groups and 50% of the children in the milk group. Recommended intakes of bioavailable zinc (1.32 mg)12 were likely to having been met only by children in the meat group. Considering the revised calculations of bioavailable iron and the changes in home food intake as described above, children in all study groups had similar total intakes of available iron of ~25% of the recommended amounts (1.85 mg)12. Although the intake of a number of nutrients increased due to the provision of the food supplements9, it could be that not all expected effects of meat and milk on growth and morbidity were found if energy and/or any of the growth-limiting nutrients or those important for
CHAPTER 7
138
health were still deficient. Further, energy will only be used with maximal efficiency if all other necessary nutrients are present in adequate amounts14.
Environmental stressors
The high prevalence of diseases, such as malaria and intestinal parasites15, in the study children may have contributed to anorexic effects, impaired nutrient absorption14, micronutrient losses in urine, increased metabolism, and/or impaired transport of nutrients to target tissues16,17. Consequently, energy and nutrient requirements might have been increased in the children and nutrients provided by the food supplements are likely to not having been used to their full potential.
REVIEW AND SUMMARY OF FINDINGS
The analyses of the effect of food supplements with animal source foods showed that all supplemented children irrespective of the type of food supplement had greater gains in weight and mid-upper-arm circumference than children who did not receive a food supplement (chapter 2). Only the total intake of vitamin A was higher for children in all supplementation groups compared with intakes for children in the control group (Table 7.2). Intake of vitamin A and growth have been found to be associated in a number of studies (chapter 1), but our study does not provide conclusive evidence if it was the energy and/or nutrients provided by the food supplements that resulted in an improvement in weight. It seems that the total energy intake by the children in the control group was only slightly lower than that by the children in the milk and energy groups (Table 7.2). Boys who received the meat supplement seemed to have had smaller decreases in weight-for-height Z-score during the study period than boys of all other groups. Because boys might have higher energy and nutrient needs than girls, it could be that the unexpected higher energy intake in the children in the meat group as explained above was responsible for this finding.
No effect of meat or milk was found for the overall sample on height and height-for-age Z-scores. However, there was some indication that the milk supplement was beneficial for height gain in children who were more stunted at baseline, probably because there is more scope for improvement in their growth. The results are difficult to compare with those of other intervention studies of supplementary milk because of the many different study designs and because most studies included other components that may have contributed to the effects observed. Three studies, in which skim-milk powder was provided to stunted Papua New Guinean boarding school children (5-15 years), resulted in accelerations in height and weight in the first two studies4 and in height in the other study18. Stunted Jamaican children (9-24 months) who received a milk-based formula for one year gained more height and weight during the first six months of the study than children who did not receive any food5. However, from these studies and also from a number of other studies that provided milk in different forms to mostly malnourished children and reported improvements in growth19-25 it is difficult to determine which

GENERAL DISCUSSION
139
specific macro- or micronutrients contributed to the growth response. The improvements in growth in the New Guinean children were attributed to an increase in protein intake rather than micronutrients because habitual diets of tubers were protein-deficient. In a study in 12-months and 18-months old Indonesian children, the provision of a high-energy milk supplement plus micronutrients resulted in improved growth compared with a low-energy milk supplement plus micronutrients and a low-energy milk supplement without micronutrients26.
Measurements of body composition are indicative of body nutrient stores and give information on nutritional status in addition to height and weight measurements. Children who received the meat supplement had greater gains in mid-upper-arm muscle area (MMA) than children in all other groups. Children receiving the milk supplement had greater gains in MMA than children in the control group. MMA is correlated with measures of total body muscle mass and is used to predict changes in protein nutritional status. The observed effect of the food supplementation could have been due to the higher intake of protein and/or bioavailable zinc. Zinc supplementation has been shown in some studies to increase lean body mass in children27-30, possibly through its effects on protein metabolism and/or stimulation of appetite31. However, it seems that children in the meat group were more active than children in the other groups32 and it could be that they therefore gained more muscles than the other children. No effect of the food supplements was found on measures of body fat, probably because no extra energy was available to be stored.
In chapter 3 of this thesis, the total diet, i.e., intakes from the home diet plus intakes from the food supplements, was examined to find out which particular nutrients predicted the children’s growth. This approach is likely to have circumvented the above-mentioned problems, such as the differential change in home food intake within and between study groups and a possible insufficient intake of energy and nutrients during the study period. Further, several factors were considered as covariates in the data analysis and we are therefore confident that the results are valid. Findings indicate that energy from animal source foods, but not total energy was predictive of gain in height, weight, mid-upper-arm muscle area, and mid-upper-arm fat area. Further, haem iron, preformed vitamin A, calcium, and vitamin B12 positively predicted height and weight gain of the study children. These nutrients are provided in high amounts and in a bioavailable form only in meat and/or milk. In contrast, nutrients predominantly found in plant foods and dietary components that reduce micronutrient bioavailability, such as fibre and phytate, negatively predicted the children’s growth. These findings are in line with a number of observational studies showing associations between intake of animal source foods and growth in children (chapter 1).
Micronutrients that are important for health are provided in high amounts and in a highly bioavailable form in animal source foods (chapter 1); however, we did not find an effect of any of the food supplements on period prevalence of the most common childhood diseases and indicators of illness severity (chapter 4). In contrast, a number of studies with single micronutrient supplementation, particularly with zinc, iron, and vitamin A, have found positive

CHAPTER 7
140
results on health in children (chapter 1). Our null-findings might in part be attributed to the lack of sensitivity of methods used to assess disease prevalence and/or by the limitations in energy and nutrient intake mentioned above, although statistical analysis were controlled for total energy intake. However, there was the trend that the predicted risks were lowest for children receiving the milk supplement for most diseases and indicators of illness severity. Of the factors that we considered in our analyses besides the food supplement, total energy intake was a significant negative covariate in the statistical models for malaria and indicators of illness severity, indicating that children with higher total energy intakes had lower disease prevalences, which also shows the importance of a sufficient energy intake in reducing morbidity. Studies evaluating the effect of animal source foods on morbidity in children are mostly about infant cow’s milk-based formulas. As is the case for growth, the designs of the studies are very different from that of our study and also vary in measurements of disease outcomes making it difficult to compare results.
Although the total iron intake from the habitual diet of the study children was high, the content of iron absorption inhibitors, particularly phytate, was also high and the prevalence of inadequate iron intake was calculated to be 77% (chapter 5). Simulations of household dietary strategies revealed that the addition of meat and other iron absorption enhancers, such as ascorbic acid contained in fruits, are the most efficacious approach to substantially increase the amount of iron absorbed (chapter 6). However, in order to reduce the prevalence of inadequate iron intake to 5%, a combination of 100 g beef and 150 mg ascorbic acid would be needed. Food-processing methods that can be applied at household level, such as soaking, germination and fermentation have been shown to effectively reduce dietary components that inhibit micronutrient bioavailability33 and were successfully applied in some regions in developing countries34. However, this does not seem to be a suitable strategy to decrease the prevalence of inadequate iron intake in the setting the Kenyan study children live in. Avoidance of polyphenol containing drinks at meals can increase non-haem iron absorption, but did not improve iron intakes for the study population as a whole.
CONCLUSION
The habitual diet of the children in the study area is of poor dietary quality with low intakes of animal source foods and high prevalences of inadequate intakes of certain nutrients, particularly of vitamin B12, calcium, bioavailable iron and bioavailable zinc. The linkage between nutrient supply, growth and morbidity is critical, mostly though in the very early years of life, but also thereafter. Prevalences of simultaneous multiple nutrient deficiencies, stunting and diseases in the children were high and it was assumed that the provision of food supplements with animal source foods would improve their growth and morbidity. Energy intake seems to have played an important role in the observed findings and it is likely that insufficient energy and nutrients needed for an improvement of growth and morbidity in the children was supplied by the children’s total food intake, including the food supplements. This might explain that not all

GENERAL DISCUSSION
141
hypothesised effects of the food supplements on growth and morbidity were found. This could also explain why of all nutrients targeted by the food supplementation, a detectable response in micronutrient status to the meat and milk supplements was only seen for vitamin B12
15,35. Methods to assess morbidity might not have been sensitive enough to detect an impact of the food supplementation. Further, the children’s energy and nutrient intakes changed differently within and between study groups during the feeding period leaving unresolved if the energy and/or nutrients provided by the food supplements were responsible for the improvement in weight gain observed in all supplemented children. It is likely that the increase in protein and zinc intake by the meat supplement was responsible for the greater gains in muscle mass compared with the control group, but also a higher level of activity in the children in the meat group might have contributed to an increase in muscles. Study findings suggest that the milk supplement was beneficial for height gain in the more stunted children and there was a trend that children who received the milk supplement had lower predicted prevalences of most diseases and indicators of illness severity. Nutrients that are provided in insufficient quantities in the habitual diets in many rural areas in developing countries are contained in high amounts and in a bioavailable form in animal source foods, and the study findings indicate their importance for growth. The meat and milk supplements improved intakes of a number of nutrients important for growth and health and deficiencies of vitamin B12 could be reversed15,35. However, the amounts of other micronutrients provided by the food supplements are likely to having been insufficient to reverse micronutrient deficiencies already present and might be more suitable to prevent them. Meat and milk are not interchangeable in regard to the nutrients they provide and both foods need to be part of a complete diet of young children in order to improve growth and morbidity. Iron bioavailability was found to be very low in the diet of the children, which mainly consists of cereals and legumes with high amounts of dietary components that inhibit iron absorption. Simulations of household dietary strategies suggest that the addition of meat in combination with ascorbic acid to the habitual diet is the most efficacious of those strategies to improve iron nutrition in the study area. However, increasing the consumption of meat and ascorbic acid to the amount needed to substantially reduce the prevalence of inadequate iron intake does not seem feasible and therefore other strategies to improve iron nutrition, such as iron supplementation and food fortification, have to be applied simultaneously.
IMPLICATIONS
There are enormous educational and economic gains to be achieved from improving the nutrition and health of children. Optimal growth in infants and children is an important public health goal because impaired growth is associated with poor health, increased risk of morbidity and mortality, and delayed psychomotor development. The alleviation of growth impairment is complicated by the complexity of growth mechanisms, however, it is almost certain that simultaneous multiple nutrient deficiencies play a role in its aetiology (chapter 1). Multiple

CHAPTER 7
142
micronutrient deficiencies seem to be the norm rather than the exception in rural areas in developing countries. When choosing a suitable nutrition intervention strategy to address micronutrient malnutrition it therefore has to be considered that functional deficits may not be alleviated by the provision of single micronutrients. Although the supplementation with meat and milk did not bring about all the expected effects, study findings indicate that micronutrients contained in high amounts and in a bioavailable form in animal source foods are beneficial for growth. Further, the addition of meat combined with ascorbic acid seems to be an efficacious approach to improve iron bioavailability in the setting of the study population. The promotion of animal source food consumption by children therefore seems to be a viable food-based approach to provide highly bioavailable nutrients simultaneously to children and at the same time to improve iron bioavailability.
The study findings suggest a possible beneficial effect of milk intake for health and growth, particularly in the more stunted children. In the study area, milk is regularly consumed although only in small quantities that are mostly added to tea. The average daily amount of cow’s milk consumed was 130 (SD 76.0) g and consequently dietary calcium intake in the study children was very low (276.0 (SD 76.6) mg calcium/d). Besides milk, green leafy vegetables are sources of calcium in the diet of the children, but they cannot provide the amounts of calcium actually needed by growing children, particularly for skeletal growth. The addition of ~400 mL of milk to the diet would be needed on average for the children to meet adequate calcium intakes of 800 mg13. The occurrance of milk allergies or lactose intolerance in Kenya has not been well documented, however, it did not seem to be common in the study area. Nevertheless, because these disorders have been shown to be prevalent in other regions in developing countries, benefits and possible adverse effects have to be weighed up if milk consumption is to be encouraged. Fermented milk products may be another option because they are also more amenable than fresh milk to non-refrigerated storage. School-milk programs, which are ongoing in several countries, should be encouraged, because they are a good possibility to improve dietary quality, particularly in primary school children. In Kenya, there was a school milk program in the 1980s, but due to financial constraints this was discontinued after a few years. Today only sporadic short-term milk programs are implemented, mostly by the World Food Program36.
Foods that can provide ascorbic acid should be identified and their consumption with meals promoted within the specific context in order to improve iron bioavailability. A study in Egyptian children showed that the provision of an orange every day with an iron-fortified school-meal improved iron status37. However, fruits are only available during certain seasons. Food processing techniques, such as solar drying of fruits, might be a strategy to make fruits available throughout the year38. The consumption of the amounts of fruits that would have to be consumed in order to substantially decrease the prevalence of inadequate iron intake in the study population cannot be achieved by fruits alone. The provision of vitamin C tablets might be an option worthwhile to consider.

GENERAL DISCUSSION
143
Obviously, food-based approaches take time and are complex, as they require interdisciplinary approaches39. However, in contrast to pharmanutrient supplementation, they are not "top-down" approaches but they involve the target population and are likely to be the most effective means of addressing the problem at its source. If locally available and familiar foods and preparation methods are used, the food-based approach is likely to be accepted by the population and therefore sustainable. It may also be more economically feasible without the risk of antagonistic interactions than e.g., pharmanutrient supplementation40,41. Food-based approaches are rather long term solutions aiming at the prevention of micronutrient deficiencies than a short-term correction of the problem and can lead to more diverse diets with an improvement of the overall diet quality. Another advantage is the potential for households to benefit economically from increased production of high value foods41.
The question arises how feasible it is for low-income households in developing countries to increase production and consumption of animal source foods. No doubt there are several constraints that might limit an increase in household production of animal source foods, such as land, money, labour, feed quality, water, disease, animal genetics, roles for animals beyond food production, grazing techniques, etc.42. Solutions exist to overcome these constraints42. However, in some settings, the most vulnerable population groups, such as children and pregnant and lactating women, might not benefit from an increase in availability of animal source foods if additionally socio-cultural and household-level constraints exist43. Studies using a variety of approaches indicate that an increase in the consumption of animal source foods could be achieved. It might also be linked with other positive outcomes, such as increased knowledge about foods, nutrition and health, an increase in dietary diversity, an improvement in nutritional status, and income generation44-48. Most approaches focus on raising small animals such as rabbits, goats or poultry or the inclusion of locally available low cost animal source foods, such as milk, eggs, offal, blood or fish into the diets of children. These foods are often culturally unacceptable to be eaten by men and therefore are sure to be consumed by children (and maybe women) and not as much input is needed to raise them compared with other livestock. Processed foods based on meat have been developed, such as chicken liver chips49 or rabbit-sweet potato dried snacks47, and might be another possibility to increase meat consumption. When developing programs that aim at increasing the consumption of animal source foods in children, potential constraints have to be evaluated within the specific context and nutrition education components such as social marketing and positive deviance approaches have to be included. Key to any successful and sustainable food-based program is the involvement of the community through participatory approaches.
Despite the advantages that a food-based approach including animal source foods in the prevention of micronutrient deficiencies might have, there are also some critical aspects associated with an increase in the consumption of animal source foods. An increase in nutrition-related non-communicable diseases such as diabetes, cancer, and cardiovascular disease is now apparent in large segments of many developing countries that are undergoing the so-called nutrition transition with changing lifestyle and dietary patters including increased meat

CHAPTER 7
144
consumption50. However, the view of some researchers is that particularly in low-income countries, the contribution of meat to improved nutrient intakes more than offsets the uncertain association with these diseases51,52. In places, where there is a large variety of healthy foods to choose from, a vegetarian diet has been associated with several health benefits and is definitely a worthwhile alternative. However, diets that exclude animal source foods are not recommended for small children due to the energetic demands of their rapidly expanding large brain and generally high metabolic and nutritional demands relative to adults53. Given that the diets of children in developing countries are generally very low in fat, the dietary fat provided by animal source foods is even advantageous because it is a concentrated source of energy and enhances absorption of fat-soluble nutrients. Further, it is not likely that any additional fat provided by animal foods would result in fat intakes that exceed current recommendations54. However, the potential adverse health effects linked with an increased intake of animal source foods should not be ignored by policy makers that focus on livestock promotion55.
Findings from the study point at the importance of an improvement in micronutrient bioavailability, particularly iron. This needs to be an integral part of any nutritional approach with the aim to improve micronutrient malnutrition. Several household dietary approaches to reduce the content of components that inhibit micronutrient absorption, such as phytates, exist. However, as was demonstrated in the present study, not all possible approaches can achieve an overall improvement in dietary iron bioavailability and therefore their feasibility and sustainability need to be evaluated in the specific context.
Nutrition is interrelated with poverty and environmental factors, and issues of safe water, sanitation and caring practices need to be addressed in any nutrition program. Deworming children has been shown to improve the iron status and physical growth of children41 and the prevention and treatment of infections, particularly helminths and malaria, can have immediate benefits for growth and health of affected children. Finally, all the above-mentioned actions should be aligned and focused on the principal aim: allowing children to reach their full potential for growth, health and development.
SUGGESTIONS FOR FUTURE RESEARCH
In order to design effective programs, efficacy studies, such as the one presented in this thesis, are the first logical step to investigate if the regular consumption of animal source foods can improve dietary quality, growth and health of children under controlled conditions. However, a community-based study, where food supplements are provided over a long period necessary to see an effect, is likely to be accompanied by a number of constraints that might complicate interpretation of findings. Randomisation should be paid sufficient attention to, and if feasible within a specific setting, provision of food supplements should be randomised by individuals and not by clusters as was done in the present study because this might confound study results. However, this is more difficult to realise and requires a high number of personnel and funding. If the supplements could be blinded, i.e., brought into a form that they look and taste similar,

GENERAL DISCUSSION
145
some confounding might be avoided. However, it has to be considered that processed foods that the study population is not used to might lead to a loss in compliance. Methods to assess morbidity need to be more sensitive in order to increase the chance of finding an impact of an intervention. Optimally, disease occurrence should be assessed continuously for the whole study period through frequent interviews.
If the effect of an increase in specific nutrients is examined, irrespective of the approach used, it would be ideal if the overall diet is sufficient in energy and all other nutrients critical for the outcome measured. However, this is difficult to achieve as the exact energy and nutrient requirements are unknown in a real life setting. Further, not all foods consumed by the children can be provided and certain circumstances defy control by the investigators, such as a drought that occurs during the study period. If food-based approaches including animal source foods are evaluated in children with multiple micronutrient deficiencies, the inclusion of meat and milk into one feeding group might be useful in order to provide all critical nutrients simultaneously. Growth and health are usually the product of several other factors besides nutritional inadequacy and these should first be identified and quantified within the specific context and considered to be included in the study design. The conditions needed to maximise the efficacy of an increased intake in animal source foods should be determined, and a combination of potential approaches could be tested, e.g., children supplemented with meat could be compared with children supplemented with meat plus deworming. In developing countries, the mix of solid foods introduced during the weaning period at age 6-12 months is commonly deficient in energy and several micronutrients, particularly iron, zinc, and B-vitamins, contributing to growth faltering. It might be therefore worthwhile to carry out an efficacy study on the effect of animal source foods on growth in this age group.
The acquisition of knowledge about detailed composition of common meals, particularly their content of micronutrients and their absorption promoters and inhibitors is required if realistic recommendations in dietary modification are to be made to improve micronutrient bioavailability. More studies aiming at an increase in micronutrient bioavailability, particularly iron and zinc, are urgently needed for different settings evaluating combinations of different approaches that have already been tested successful in the laboratory or individually in field studies. Further, the effects of proposed changes on the intake of other nutrients need to be taken into consideration. Plant breeding strategies offer a great potential for the increase in micronutrients important for growth and health in staple foods as well as the reduction of absorption inhibitors, but their efficacy and effectiveness still need to be evaluated under field conditions.
More research is needed to improve the understanding of the potential of food-based approaches to improve micronutrient malnutrition, growth, health, and development of children. Once efficacy studies on the intake of animal source foods in children have established their potential for impact and the exact amounts of foods required and the frequency of intake are determined, interventions that aim at increasing an intake of animal source foods have to be identified and their effectiveness studied under real life conditions in various settings. However,

CHAPTER 7
146
in developing countries where resources are even inadequate to meet basic needs, not all promising approaches can be adopted and choices have to be made considering their relative benefit, cost, and feasibility.
REFERENCES 1. Neumann CG, Bwibo NO, Murphy SP, et al. (2003) Animal Source Foods Improve Dietary Quality,
Micronutrient Status, Growth and Cognitive Function in Kenyan School Children: Background, Study Design and Baseline Findings. J Nutr 133 (11): 3941S-9S.
2. Rivera JA, Hotz C, Gonzalez-Cossio T, Neufeld L & Garcia-Guerra A (2003) The Effect of Micronutrient Deficiencies on Child Growth: A Review of Results from Community-Based Supplementation Trials. J Nutr 133 (11): 4010S-20S.
3. Hadi H, Stoltzfus R, Dibley M, et al. (2000) Vitamin A supplementation selectively improves the linear growth of Indonesian preschool children: results from a randomized controlled trial. Am J Clin Nutr 71 (2): 507-13.
4. Malcolm LA (1970) Growth retardation in a New Guinea boarding school and its response to supplementary feeding. Br J Nutr 24: 297-305.
5. Walker SP, Powell CA, Grantham-McGregor SM, Himes JH & Chang SM (1991) Nutritional supplementation, psychosocial stimulation, and growth of stunted children: the Jamaican study. Am J Clin Nutr 54 (4): 642-8.
6. Hollis S & Campbell F (1999) What is meant by intention to treat analysis? Survey of published randomised controlled trials. Brit Med J 319: 670-4.
7. Hallberg L & Hulthén L (2000) Prediction of dietary iron absorption: an algorithm for calculating absorption and bioavailability of dietary iron. Am J Clin Nutr 71: 1147-60.
8. Murphy SP, Beaton GH & Calloway DH (1992) Estimated mineral intakes of toddlers: predicted prevalence of inadequacy in village populations in Egypt, Kenya, and Mexico. Am J Clin Nutr 56: 565-72.
9. Murphy SP, Gewa C, Liang L-J, Grillenberger M, Bwibo NO & Neumann CG (2003) School snacks containing animal source foods improve dietary quality for children in rural Kenya. J Nutr 133 (11): 3950S-6S.
10. Torun B, Davies PSW, Livingstone MBE, Paolisso M, Sackett R & Spurr GB (1996) Energy requirements and dietary energy recommendations for children and adolescents 1 to 18 years old. Eur J Clin Nutr 50 (Suppl. 1): 37S-81S.
11. Institute of Medicine (1998) Dietary Reference Intakes for thiamin, riboflavin, niacin, vitamin B6, folate, vitamin B12, pantothenic acid, biotin, and choline. Washington, DC: National Academy Press.
12. Institute of Medicine (2001) Dietary Reference Intakes for vitamin A, vitamin K, arsenic, boron, chromium, copper, iodine, iron, manganese, molybdenum, nickel, silicon, vanadium and zinc. Washington, DC: National Academy Press.
13. Institute of Medicine (2001) Dietary Reference Intakes for Calcium, Phosphorus, Magnesium, Vitamin D, and Fluoride. Washington, DC: National Academy Press.
14. Prentice AM & Paul AA (2000) Fat and energy needs of children in developing countries. Am J Clin Nutr 72 (5): 1253S-65S.
15. Siekmann JH, Allen LH, Bwibo NO, Demment MW, Murphy SP & Neumann CG (2003) Kenyan school children have multiple micronutrient deficiencies, but increased plasma vitamin B-12 is the only detectable micronutrient response to meat or milk supplementation. J Nutr 133 (11): 3972S-80S.
16. Stephenson CB (1999) Burden of infection on growth failure. J Nutr 129: 534S-8S. 17. Brown KH, Stallings RY, de-Kanashiro HC, Lopez-de RG & Black RE (1990) Effects of common illnesses on
infants' energy intakes from breast milk and other foods during longitudinal community-based studies in Huascar (Lima), Peru. Am J Clin Nutr 52: 1005-13.
18. Lampl M, Johnston FE & Malcolm LA (1987) The effects of protein supplementation on the growth and skeletal maturation of New Guinean school children. Ann Hum Biol 5: 219-27.
19. Golden BE & Golden MHN (1981) Plasma zinc, rate of weight gain and energy cost of tissue deposition in children recovering from severe malnutrition on cow's milk or soya protein based diet. Am J Clin Nutr 34: 892-9.
20. Mora J, Herrera M, Suescun J, de Navarro L & Wagner M (1981) The effects of nutritional supplementation on physical growth of children at risk of malnutrition. Am J Clin Nutr 34: 1885-92.
21. Vaughan J, Zumrawi F, Waterlow J & Kirkwood B (1981) An evaluation of dried skimmed milk on children's growth in Khartoum Province, Sudan. Nutr Res 1: 243-52.
22. Zumrawi F, Vaughan JP, Waterlow JO & Kirkwood BR (1981) Dried skimmed milk, breast-feeding and illness episodes - a controlled trial in young children in Karthoum Province, Sudan. Int J Epidemiol 10: 303-8.

GENERAL DISCUSSION
147
23. Heikens GT, Schofield WN, Dawson S & Grantham-McGregor S (1989) The Kingston Project. I. Growth of malnourished children during rehabilitation in the community, given a high energy supplement. Eur J Clin Nutr 43: 145-60.
24. Lutter CK, Mora JO, Habicht J-P, Rasmussen KM, Robson DS & Herrera MG (1990) Age-specific responsiveness of weight and length to nutritional supplementation. Am J Clin Nutr 51: 359-64.
25. Schroeder DG, Martorell R, Rivera JA, Ruel MT & Habicht J-P (1995) Age differences in the impact of nutritional supplementation on growth. J Nutr 125: 1051S-9S.
26. Beckett C, Durnin J, Aitchison T & Pollitt E (2000) Effects of an energy and micronutrient supplement on anthropometry in undernourished children in Indonesia. Eur J Clin Nutr 54: 52S-9S.
27. Golden BE & Golden MHN (1992) Effect of zinc on lean tissue synthesis during recovery from malnutrition. Eur J Clin Nutr 46: 697-706.
28. Bates CJ, Evans PH, Dardenne M, et al. (1993) A trial of zinc supplementation in young rural Gambian children. Br J Nutr 69: 2443-55.
29. Frijs H, Ndhlovu P, Mduluza T, et al. (1997) The impact of zinc supplementation on growth and body composition: A randomized, controlled trial among rural Zimbabwean schoolchildren. Eur J Clin Nutr 51: 38-45.
30. Kikafunda JK, Walker AF, Allan EF & Tumwine JK (1998) Effect of zinc supplementation on growth and body composition of Ugandan preschool children: a randomized, controlled, intervention trial. Am J Clin Nutr 68 (6): 1261-6.
31. Prentice A & Bates CJ (1994) Adequacy of dietary mineral supply for human bone growth and mineralisation. Eur J Clin Nutr 48: 161S-77S.
32. Sigman M, Whaley SE, Kamore M, Bwibo NO & Neumann CG (2005) Supplementation increases physical activity and selected behaviors in rural Kenyan schoolchildren. Global Livestock CRSP. Research Brief 05–04-CNP. Davis: University of California.
33. Hotz C, Gibson RS & Temple L (2001) A home-based method to reduce phytate content and increase zinc bioavailability in maize-based complementary diets. Int J Food Sci Nutr 52 (2): 133-42.
34. Gibson RS & Hotz C (2001) Dietary diversification/modification strategies to enhance micronutrient content and bioavailability of diets in developing countries. Br J Nutr 85, Suppl 2: 159S-66S.
35. Reid ED, Neumann CG, Siekmann JH, Bwibo NO, Murphy SP & Allen LH (2002) Supplementation with beef or milk markedly improves vitamin B12 status of Kenyan schoolers. Global Livestock CRSP. Research Brief 02–04-CNP. Davis: University of California.
36. Bwibo NO & Neumann CG (2003) The Need for Animal Source Foods by Kenyan Children. J Nutr 133 (11): 3936S-40S.
37. Elguindi M, Rashed M, Galal O & Stormer A (2003) A food-based approach to improve iron status in Egyptian children [abstract]. In Abstracts of the INACG Symposium, Integrating Programs to Move Iron Deficiency and Anemia Control Forward, held at Marrakech, Morocco, 2003, p. 27.
38. Linehan M, McKigney J, Toussaint T & Mansour M (1994) Solar drying as an appropriate technology for vitamin A food preservation [abstract]. In Two decades of progress: linking knowledge to action. Report of the XVI IVACG Meeting, Washington, DC, p. 71.
39. Demment MW, Young MM & Sensenig RL (2003) Providing Micronutrients through Food-Based Solutions: A Key to Human and National Development. J Nutr 133 (11): 3879S-85S.
40. Gibson R & Ferguson E (1998) Nutrition intervention strategies to combat zinc deficiency in developing countries. Nutr Res Rev 10: 1-18.
41. ACC/SCN (2001) What works? A Review of the Efficacy and Effectiveness of Nutrition Interventions. [Allen LH and Gillespie SR, editors]. Geneva: ACC/SCN in collaboration with the Asian Development Bank, Manila.
42. Brown DL (2003) Solutions Exist for Constraints to Household Production and Retention of Animal Food Products. J Nutr 133 (11): 4042S-7S.
43. Gittelsohn J & Vastine AE (2003) Sociocultural and Household Factors Impacting on the Selection, Allocation and Consumption of Animal Source Foods: Current Knowledge and Application. J Nutr 133 (11): 4036S-41S.
44. Ayele Z & Peacock C (2003) Improving Access to and Consumption of Animal Source Foods in Rural Households: The Experiences of a Women-Focused Goat Development Program in the Highlands of Ethiopia. J Nutr 133 (11): 3981S-6S.
45. Creed-Kanashiro HM, Bartolini RM, Fukumoto MN, Uribe TG, Robert RC & Bentley ME (2003) Formative Research to Develop a Nutrition Education Intervention to Improve Dietary Iron Intake among Women and Adolescent Girls through Community Kitchens in Lima, Peru. J Nutr 133 (11): 3987S-91S.
46. Gibson RS, Yeudall F, Drost N, Mtitimuni BM & Cullinan TR (2003) Experiences of a Community-Based Dietary Intervention to Enhance Micronutrient Adequacy of Diets Low in Animal Source Foods and High in Phytate: A Case Study in Rural Malawian Children. J Nutr 133 (11): 3992S-9S.
47. Maretzki AN & Mills EW (2003) Applying a NutriBusiness Approach to Increase Animal Source Food Consumption in Local Communities. J Nutr 133 (11): 4031S-5S.

CHAPTER 7
148
48. Roos N, Islam MM & Thilsted SH (2003) Small Indigenous Fish Species in Bangladesh: Contribution to Vitamin A, Calcium and Iron Intakes. J Nutr 133 (11): 4021S-6S.
49. Chavasit V, Pisaphab R, Sungpuag P, Jittinandana S & Wasantwisut E (2002) Changes in b-Carotene and Vitamin A Contents of Vitamin A-rich Foods in Thailand During Preservation and Storage. J Food Sci 67 (1): 375-9.
50. Popkin BM (1994) The nutrition transition in low-income countries: an emerging crisis. Nutr Rev 52: 285-98. 51. Biesalski H (2002) Meat and cancer: meat as a component of a healthy diet. Eur J Clin Nutr 56: 2S-11S. 52. Hill M (2002) Meat, cancer and dietary advice to the public. Eur J Clin Nutr 56: 36S-41S. 53. Milton K (2003) The Critical Role Played by Animal Source Foods in Human (Homo) Evolution. J Nutr 133 (11):
3886S-92S. 54. Haskell MJ & Brown KH (1997) The nutritional value of animal products and their role in the growth and
development of young children in developing countries [Unpublished review]. Davis: University of California. 55. Popkin BM & Du S (2003) Dynamics of the Nutrition Transition toward the Animal Foods Sector in China and its
Implications: A Worried Perspective. J Nutr 133 (11): 3898S-906S.

SSuummmmaarryy

SUMMARY
150
In Kenya, as in other developing countries, many children suffer from varying degrees of protein energy malnutrition and multiple micronutrient deficiencies, which can impair growth and immunity with an increased risk of morbidity, mortality, and poor psychomotor development. Some but not all studies supplementing children with nutrients, particularly iron, zinc, and vitamin A were successful in improving growth and health. Because multiple micronutrient deficiencies often occur simultaneously, approaches are needed that can improve the intake of all limiting micronutrients at the same time. An increase in the consumption of animal source foods by children offers a viable solution to increasing the intake of highly bioavailable nutrients. Animal source foods can also improve the absorption of micronutrients from plant foods that are less bioavailable. Observational studies in Kenya and elsewhere have shown that children who consumed even small amounts of animal source foods had better growth and cognitive function. However, findings from observational studies might be confounded by other factors and intervention studies with animal source foods are not only rare but also vary widely in their approach, making it difficult to isolate factors that are responsible for the observed outcomes.
The research presented in this thesis is part of a randomised controlled feeding intervention study that was carried out with the aim of evaluating the causal relation of increasing the consumption of animal source foods with growth, morbidity, and cognitive function. The study area is located in Kenya at Kyeni Division, Embu District in Eastern Province where most people are subsistance farmers. The habitual diet mainly consists of maize and beans with little or no animal source foods, and children suffer from stunting and micronutrient deficiencies. Food supplements containing meat or milk were designed based on findings from a previous study in the same area to meet gaps between actual intakes of energy and nutrients and recommended amounts. Children from twelve primary schools aged 6-9 years were recruited to participate in the study (n 554) and schools were randomly assigned to four study groups: 1) Control: no food supplement provided; 2) Energy supplement: a food supplement based on a local dish of maize, beans, and vegetables (githeri); 3) Milk supplement: githeri plus a glass of milk (200 mL); and 4) Meat supplement: githeri with 60 g minced beef. The food supplements were approximately isoenergetic and contained an estimated energy content of ~250 kcal/serving (1050 kJ) during the first three months of the intervention. Because children grew in height and weight, the food supplements were then modified to obtain a total energy content of ~300 kcal/serving (1255 kJ). This was achieved by increasing the portion size of the energy supplement (from 185 g to 230 g), the milk content of the milk supplement (to 250 mL) and the beef content of the meat supplement (to 85 g). Food supplements were provided for six school terms from September 1998 to July 2000 as a mid-morning snack at school. The supplements would supply ~20% of the daily energy requirement, yet the meat supplement would provide highest proportions of recommended amounts of micronutrients, particularly vitamin B12, bioavailable iron, and bioavailable zinc, and the supplement containing milk would provide highest amounts of vitamin A, riboflavin, calcium, and phosphorus. Thus dietary quality would be improved for children receiving the meat or milk supplement compared with children receiving the energy

SUMMARY
151
supplement, and dietary quantity would be improved for all supplemented children compared with children from the control group.
The effect of the food supplements on growth was evaluated using data of 498 children in multivariate analyses that were controlled for a number of covariates. Prevalences of stunting and severe stunting at baseline were 25.3% and 4.6%, respectively. Less than 2% of the children were wasted. Weight gain was significantly higher (~10%) in the children receiving any type of food supplement compared with the control group. Children receiving the meat supplement, milk supplement or energy supplement gained 3.89 kg [95% Confidence interval, 3.72; 4.07], 3.86 kg [3.69; 4.02] or 3.89 kg [3.72; 4.06], respectively, and children in the control group gained 3.49 kg [3.30; 3.67]. This finding indicates that dietary quantity was more important than dietary quality for weight gain. However, it seems that the home diet of the children changed differently within and between study groups from baseline to the feeding period resulting in higher home energy intakes in children receiving the meat supplement compared with children receiving the milk or energy supplements. Therefore an ultimate conclusion cannot be drawn if it was the energy and/or nutrients provided by the food supplements that resulted in an improvement in weight.
No overall effect of the food supplementation was found on height; however, in the group of children who were more stunted (height-for-age Z-Score < -1.4), those children who received the milk supplement gained 1.3 cm more height than children in the control group, a finding of borderline significance, probably because there is more scope for improvement in their growth. Gain in mid-upper-arm muscle area, indicative of protein nutritional status, was highest for the children receiving the meat supplement (mean [95% Confidence interval], 152.9 mm2
[132.9; 172.9]). They gained ~80% more mid-upper-arm muscle area than those in the control group (84.6 [64.6; 104.6]) (p = 0.002). They also gained ~30% more than those receiving the milk supplement (118.0 [98.3; 137.7]) (p = 0.040), and ~30% more than those receiving the energy supplement (115.5 [94.9; 136.1]) (p = 0.034). Children receiving the milk supplement gained ~40% more mid-upper-arm muscle area than those in the control group (p = 0.046). These observed positive effects of the food supplementation could have been due to the higher intakes of protein and/or bioavailable zinc. Zinc supplementation has been shown in some studies to increase lean body mass in children, possibly through its effects on protein metabolism and/or stimulation of appetite. However, it could also be that children in the meat group were more active and therefore gained more muscles than the other children. No effect of the food supplements was found on measures of body fat, probably because no extra energy was available to be stored.
Which specific nutrients predicted the growth of the children were examined in linear regression models using food intake data from the total diet of the children, i.e., their home diet and the food supplements. Energy from animal source foods but not total energy was predictive of gain in height, weight, mid-upper-arm muscle area and mid-upper-arm fat area. Further, haem iron, preformed vitamin A, calcium and vitamin B12 positively predicted height and weight gain of the
SUMMARY
152
study children. In contrast, nutrients predominantly found in plant foods and dietary components that reduce micronutrient bioavailability, such as fibre and phytate, negatively predicted the children’s growth. The results indicate that energy and nutrients that are provided in high amounts and in a bioavailable form in meat and milk are beneficial for growth.
Animal source foods are a good source of micronutrients that are important for health. However, no effect of any of the food supplements in the logistic regression models was found on the prevalence of upper respiratory tract infection, eye infection, skin infection, gastrointestinal disease, malaria and indicators of illness severity, such as fever, decreased appetite, and confinement to bed. Nevertheless, there was the tendency that the predicted risks were lowest for children receiving the milk supplement for most diseases and indicators of illness severity (not statistically significant).
The low bioavailability of certain nutrients, particularly iron and zinc, from habitual cereal-legume based diets in developing countries is assumed to contribute to the high prevalence of micronutrient deficiencies. Intakes of iron and dietary components that influence iron absorption were determined from food intake data obtained over a period of 34 months of the children who participated as controls in the feeding intervention study (n 78). Iron absorption was estimated using an algorithm that is based on the sum of several iron absorption enhancers and inhibitors present in a meal, takes into consideration interactions between them, and adjusts iron absorption to the individual iron status of the children. Total iron intake was 15.74 (SD 5.88) mg/d of which only 0.05 (SD 0.01) mg/d was haem iron. The amount of absorbed iron was very low (0.56 (SD 0.47) mg/d). This was mainly due to the high intake of phytates (2.9 (SD 1.2) g/d), which were found to reduce non-haem iron absorption by 35% (for breakfast) up to 78% (for lunch and dinner). The reduction of iron absorption by polyphenols and calcium ranged from 20-57% and 11-18%, respectively, at the different meals. The increase in iron absorption due to the presence of ascorbic acid and meat in the same meal was 14-139% and 0-9%, respectively. The fractional absorption of non-haem iron ranged from 5-13% for the different meals, whilst the fractional absorption of haem iron was ~30% for all meals. The prevalence of inadequate iron intake in the study children was estimated to be 77%, pointing at the importance of improving dietary iron bioavailability in order to improve iron nutrition in the children.
Different approaches that aim at increasing iron absorption enhancers or reducing iron absorption inhibitors were evaluated for their potential to improve iron nutrition and the effect they might have on the intakes of other nutrients. The simulation of household dietary strategies using food intake data from children who participated as controls in the feeding intervention study (n 78) revealed that the prevalence of inadequate iron intake can be reduced from 77% to 54% through the theoretical addition of 50 g beef or 100 mg ascorbic acid and to 23% through the combined addition of these amounts to dinner each day. To substantially reduce the prevalence of inadequate iron intake to 5%, the addition of 100 g meat plus 150 mg ascorbic acid to dinner each day would be necessary. An extra 75 g meat added daily to the diet would

SUMMARY
153
help meeting recommended intakes of zinc and vitamin B12. The addition of a mango to a meal would provide 50 mg ascorbic acid and sufficient retinol activity equivalents to meet recommended amounts. Avoidance of polyphenol containing drinks, particularly tea, at meals was not found to decrease the prevalence of inadequate iron intake. Household-level food processing methods, such as soaking or fermentation of cereals, have been used successfully in some studies to reduce the phytate content of foods. However, these methods were shown not to be successful in decreasing the prevalence of inadequate iron intake within the study setting.
In conclusion, the present study showed that the supplementation with food improved the weight of rural Kenyan school children irrespective of the type of food supplement, and that the food supplement containing meat improved their lean body mass. Children who were more stunted seemed to have benefited from the supplement containing milk as indicated by a greater increase in height compared with the other study groups. Analyses of the total food intake of the children, i.e., home food intake plus food supplements, showed that energy from animal source foods as well as nutrients contained in high amounts and in a bioavailable form in animal source foods were positive predictors of growth. Supplementation with meat or milk did not decrease the prevalence of the most common childhood diseases nor illness severity, but there was a trend indicating that milk could be beneficial for health of the children. Several reasons are possible why the anticipated effects of the meat and milk supplements on growth were not seen or less strong than anticipated. Increases in nutrients critical for growth provided by the food supplements might have been counterbalanced by decreases in intakes of these nutrients from the home diet. Further it is likely that the children’s intakes of energy and certain nutrients essential for growth and health were still insufficient. The high content of dietary components that inhibit iron absorption in the habitual diet of the children is responsible for the high prevalence of inadequate iron intake. The combined addition of meat and ascorbic acid to a meal seems to be the most efficacious household dietary strategy to improve iron bioavailability. However, increases in meat and fruit consumption to amounts needed to substantially reduce the prevalence of inadequate iron intake in the study population have not been thoroughly explored or do not seem feasible. Therefore these strategies will have to be combined with other approaches in order to improve iron nutrition. The findings of the study highlight the importance of an increase in the consumption of animal source foods as an element of programs that aim at alleviating micronutrient malnutrition in children in developing countries.


SSaammeennvvaattttiinngg

SAMENVATTING
156
Veel kinderen in Kenia en andere ontwikkelingslanden lijden aan ondervoeding als gevolg van gebrek aan energie, eiwitten, en meerdere micronutriënten. Deze tekorten kunnen leiden tot een vertraagde groei en verstoorde immuniteit, met als gevolg een verhoogd ziekte-sterfte-risico en verstoorde psychomotorische ontwikkeling. Een aantal studies hebben aangetoond dat het toevoegen van met name ijzer, zink en vitamine A aan het dieet een positief effect heeft op de groei en gezondheid van kinderen. Omdat een gebrek aan verschillende micronutriënten vaak gelijktijdig voorkomt, is een aanpak vereist waarbij de inname van alle benodigde micronutriënten tegelijkertijd wordt verhoogd. Een hogere consumptie van dierlijke voedselproducten biedt een goede oplossing om de inname van voedingsstoffen met een hoge biobeschikbaarheid te vergroten. Bovendien kunnen dierlijke voedselproducten tevens de absorptie verbeteren van micronutriënten uit plantaardig voedsel die minder biobeschikbaar zijn. Observationele studies uit Kenia en andere landen hebben aangetoond dat zelfs kleine hoeveelheden dierlijke voedselproducten kinderen in staat stellen om beter te groeien en cognitief te functioneren. De resultaten van deze studies kunnen echter zijn vertekend door verstorende factoren. Interventiestudies met dierlijke voedselproducten zijn zeldzaam en variëren ook in hun benadering, waardor het moeilijk is in zulke studies de factoren te identificeren die verantwoordelijk zijn voor de waargenomen effecten.
Het onderzoek dat in dit proefschrift wordt gepresenteerd, werd uitgevoerd in het kader van een gerandomiseerde interventiestudie naar de effecten van een verhoogde consumptie van dierlijke producten op groei, ziekte en cognitieve ontwikkeling. Het studiegebied ligt in Kyeni Division, Embu District, van Eastern Province in Kenia. De meeste mensen in dit gebied zijn zelfvoorzienende boeren, en het gebruikelijke dieet bestaat voornamelijk uit maïs en bonen, met weinig of geen dierlijke voedselproducten. Kinderen zijn veelal te klein voor hun leeftijd, en hebben een gebrek aan micronutriënten. In eerdere studies werden de inname van energie en voedingsstoffen vergeleken met de aanbevolen hoeveelheden; op basis hiervan werden voor de huidige studie vlees- en melkbevattende voedselsupplementen samengesteld om de tekorten aan te vullen. Kinderen in de leeftijd van 6 tot 9 jaar van 12 lagere scholen (n 554) werden uitgenodigd om aan de studie deel te nemen. Deze scholen werden willekeurig toegewezen aan vier studiegroepen: 1) controle: geen voedingssupplement; 2) energie-supplement: een voedingssupplement op basis van een lokaal gerecht van maïs, bonen en groenten (githeri); 3) melksupplement: githeri plus een glas melk (200 mL); en 4) vleessupplement: githeri met 60 g rundergehakt. Gedurende de eerste drie maanden van de interventie bevatten de voedingssupplementen min of meer dezelfde hoeveelheid energie, namelijk ~250 kcal/portie (1050 kJ). Om rekening te houden met de groei van kinderen qua lengte en gewicht, werden de voedingssupplementen daarna aangepast tot een totale energie-inhoud van ~300 kcal/portie (1255 kJ). Dit werd bereikt door de hoeveelheid van het energiesupplement te verhogen van 185 g naar 230 g, de melk van het melksupplement te verhogen naar 250 mL, en de hoeveelheid rundvlees in het vleessupplement te verhogen naar 85 g. De voedselsupplementen werden tussen september 1998 en juli 2000 gedurende zes schooltrimesters dagelijks halverwege de ochtend gegeven als snack. De supplementen

SAMENVATTING
157
voorzagen in ~20% van de dagelijks benodigde hoeveelheid energie, maar het vleessupplement zou het meest voorzien in de aanbevolen hoeveelheid micronutriënten, vooral vitamine B12, biobeschikbaar ijzer en biobeschikbaar zink. Het melksupplement zou het meest voorzien in vitamine A, riboflavine, calcium en fosfor. De kwaliteit van de voeding werd dus verbeterd voor kinderen die een vlees- of melksupplement ontvingen, in vergelijking tot degenen die het energiesupplement ontvingen. De hoeveelheid voedsel werd verhoogd voor alle gesupplementeerde kinderen behalve voor degene in de controlegroep.
Ter evaluatie van het effect van de voedselsuppletie op groei, werd gebruik gemaakt van data van 498 kinderen. In multivariate analyses werd daarbij gecorrigeerd voor een aantal covariabelen. De prevalentie van kinderen die te klein voor hun leeftijd waren, of ernstig te klein voor hun leeftijd waren, was bij aanvang van de studie 25.3% respectivelijk 4.6%. Minder dan 2% van de kinderen hadden een te laag gewicht voor hun lengte. Onder kinderen die een voedselsupplement ontvingen, was de gewichtstoename beduidend hoger (~10%) dan in de controlegroep. Kinderen die het supplement van vlees, melk of energie ontvingen, namen met respectievelijk 3.89 kg [95% betrouwbaarheidsinterval, 3.72; 4.07], 3.86 kg [3.69; 4.02] of 3.89 kg [3.72; 4.06] in gewicht toe, terwijl kinderen in de controlegroep slechts 3.49 kg [3.30; 3.67] in gewicht toenamen. Deze bevindingen duidden erop dat het voor het verhogen van het lichaamsgewicht belangrijker is om de kwaliteit van de voeding te verbeteren dan om de kwantiteit van voedsel te verhogen. Er waren echter aanwijzingen dat er zowel binnen als tussen studiegroepen verschillen waren in de hoeveelheid en soort voeding die kinderen thuis innamen in de interventieperiode, waarbij kinderen die een vleessupplement ontvingen een hogere inname van energie hadden dan kinderen die het supplement van melk of energie ontvingen. Daarom kon uiteindelijk niet worden geconcludeerd of de gewichtstoename te danken was aan een hogere energie inname en/of ann een hogere inname van voedingsstoffen in de voedingssupplementen.
Een effect van de voedingssuppletie op lengte in de totale studie populatie werd niet gevonden. Echter, kinderen in de melkgroep bij wie de groei ernstiger verstoord was bij aanvang van de studie namen 1.3 cm meer toe in lengte dan vergelijkbare kinderen in de controlegroep, een bevinding die bijna statistisch significant was. Deverklaring voor deze bevinding is waarschijnlijk dat deze kinderen qua lengte meer potentieel hadden om te groeien. De spieroppervlakte halverwege de bovenarm – een indicator voor voedingsstatus met betrekking tot eiwitten – nam bij kinderen die het vleessupplement ontvingen het meeste toe (gemiddeld: 152.9 mm2
[132.9; 172.9]). Deze toename was ~80% meer dan bij kinderen in de controlegroep (84.6 [64.6; 104.6]) (p = 0.002), en ~30% meer dan bij kinderen in de groepen die supplementen met melk (118.0 [98.3; 137.7]) (p = 0.040) of energie (115.5 [94.9; 136.1]) (p = 0.034) ontvingen. Kinderen die een melksupplement ontvingen, namen ~40% meer toe in spieroppervlakte halverwege de bovenarm dan hen in de controlegroep (p = 0.046). Deze positieve effecten van voedingssuppletie kunnen mogelijk worden toegeschreven aan hogere innames van eiwit en/of biobeschikbaar zink. In sommige studies onder kinderen leidde zinksuppletie tot een toename in het vetvrije lichaamsgewicht, wellicht door effecten op het
SAMENVATTING
158
eiwitmetabolisme en/of stimulatie van de eetlust. Het kan echter ook zijn dat de kinderen in de vleesgroep actiever waren, en dat hun spiermassa daarom meer toenam dan in andere kinderen. Er waren geen aantoonbare effecten van de voedingssupplementen op de indicatoren van lichaamsvet, waarschijnlijk omdat er geen extra energie voorhanden was voor opslag.
Om te onderzoeken welke specifieke nutriënten de groei van kinderen voorspelden, werden lineaire regressiemodellen gebruikt. Hierbij werd de totale inname van voedingsstoffen geschat op basis van zowel de inname van nutriënten thuis én van de voedingssupplementen. Energie van dierlijk voedsel maar niet de totale energie voorspelde de toename in lengte, gewicht, spier- en vetoppervlakte halverwege de bovenarm. De toename in lengte en gewicht werd bovendien positief voorspeld door de inname van haem-ijzer, vitamine A, calcium en vitamine B12. Daarentegen werd de groei van kinderen negatief beïnvloed door inname van nutriënten die voornamelijk in plantaardig voedsel aanwezig zijn, en door bestanddelen in het dieet die de biobeschikbaarheid van micronutriënten verlagen, zoals vezels en fytaat. Deze bevindingen duiden erop dat energie en voedingsstoffen die in hoge hoeveelheden worden toegevoerd door vlees en melk, en die daarin in een beschikbare vorm voorkomen, gunstig zijn voor groei.
Dierlijk voedsel is een goede bron van micronutriënten die belangrijk voor de gezondheid zijn. Echter, in logistische regressiemodellen was er geen effect van de voedingssupplementen op de prevalentie van infectie van de bovenste luchtwegen, oog- en huidinfecties, gastrointestinale ziekte, malaria en indicatoren van de ernst van ziekte zoals koorts, verminderde eetlust, en bedlegerigheid. Voor de meeste ziekten en indicatoren van ernst van ziekte, leek het desalniettemin dat de risico’s het laagst waren voor kinderen die melksupplementen hadden ontvangen (statistisch niet significant).
In ontwikkelingslanden zijn diëten gewoonlijk gebaseerd op granen en peulvruchten. In het algemeen wordt aangenomen, dat de lage biobeschikbaarheid van bepaalde voedingsstoffen, in het bijzonder ijzer en zink, bijdragen aan de hoge prevalentie van gebrek aan micronutriënten. De inname van ijzer en componenten uit het dieet die de ijzerabsorptie beïnvloeden werd bepaald uit gegevens over de voedselinname. Deze werden verkregen gedurende een periode van 34 maanden van kinderen die deelnamen in de controlegroep van de interventiestudie (n 78). De absorptie van ijzer werd geschat met behulp van een algoritme dat was gebaseerd op de som van verschillende stoffen in een maaltijd die de opname van ijzer bevorderen of remmen. Hierbij werden interacties tussen deze stoffen in beschouwing genomen, en werd de ijzerabsorptie van individuele kinderen geschat op basis van hun ijzerstatus. De totale ijzerinname was 15.74 (SD 5.88) mg/d, waarvan slechts 0.05 mg/d (SD 0.01 mg/d) als haem-ijzer. De hoeveelheid geabsorbeerd ijzer was laag (0.56 (SD 0.47) mg/d. Dit was voornamelijk te wijten aan de hoge inname van fytaten (2.9 g/d; SD 1.2 g/d), waarvan geschat werd dat ze de absorptie van niet-haem-ijzer remden met 35% (ontbijt) tot 78% (lunch en avondmaaltijd). De vermindering van ijzerabsorptie tijdens verschillende maaltijden door polyfenolen en calcium varieerde van 20-57% respectievelijk 11-18%. De toename in ijzerabsorptie als gevolg van ascorbinezuur en vlees in dezelfde maaltijd was

SAMENVATTING
159
14-139% respectievelijk 0-9%. De relatieve absorptie van niet-haem-ijzer varieerde van 5-13% voor de verschillende maaltijden, terwijl de relatieve absorptie van haem-ijzer ~30% was voor alle maaltijden. De geschatte prevalentie van onvoldoende ijzeriname van de onderzoekspopulatie was 77%, hetgeen het belang aanduidt om de biobeschikbaarheid van ijzer te verbeteren teneinde de ijzerstatus van deze kinderen te verbeteren.
Verschillende methoden werden geëvalueerd met betrekking tot hun vermogen om ijzerstatus te verbeteren en hun effect op de inname van andere voedingsstoffen. Deze methoden waren gericht op het verhogen van de inname van voedingsstoffen die de ijzerabsorptie verbeteren, of op het verlagen van voedingsstoffen die de ijzerabsorptie remmen. Hiertoe werden strategieën gesimuleerd die op huishoudelijk niveau zouden kunnen worden doorgevoerd, gebruik makend van data over de voedselinname van kinderen die deelnamen in de controlegroep van de voedingsinterventiestudie (n 78). Deze theoretische studie toonde aan dat de prevalentie van inadequate ijzerinname kan worden verlaagd van 77% naar 54% als 50 g rundvlees respectievelijk 100 mg ascorbinezuur dagelijks aan de avondmaaltijd zou worden toegevoegd. Een combinatie van deze interventies zou leiden tot een substantiële verlaging van de prevalentie tot 23%. Om de prevalentie van inadequate ijzerinname omlaag te brengen tot 5%, zou het nodig zijn om dagelijks 100 g vlees plus 150 mg ascorbinezuur aan de avondmaaltijd toe te voegen. Een dagelijkse toevoeging van 75 g vlees zou voorzien in de behoefte van zink en vitamine B12. Toevoegen van een mango aan een maaltijd zou 50 mg ascorbinezuur leveren, en zou voldoen in de behoefte aan retinol equivalenten. De prevalentie van inadequate ijzerinname zou niet verlagen door het vermijden tijdens maaltijden van thee en andere polyfenolhoudende dranken. Sommige studies hebben met succes methoden toegepast om op huishoudniveau het fytaatgehalte van voedsel omlaag te brengen, zoals in het in de week zetten of fermenteren van granen. Onder de door ons onderzochte condities, zouden deze methoden echter geen succes hebben om de prevalentie van onvoldoende ijzerinname te verlagen.
In conclusie, de huidige studie liet zien dat voedselsuppletie het gewicht van Keniaanse plattelands schoolkinderen verbeterde, ongeacht het type voedselsupplement, en dat suppletie met vlees leidde tot een verhoging van de vetvrije massa. Met betrekking tot lengtegroei hadden kinderen die kleiner voor hun leeftijd waren meer baat bij de extra melk vergeleken ten opzichte van de andere groepen. Analyse van de totale voedselinname van kinderen, de inname van huis uit plus de supplementen, toonden aan dat hoge hoeveelheden van energie en voedingsstoffen, die in een beschikbare vorm in dierlijke voedselbronnen, voorkomen een positief effect hadden op de groei van de kinderen. De prevalentie of ernst van de meest gangbare kinderziekten werd niet verminderd door suppletie met vlees of melk, maar de data leken erop te wijzen dat melk goed was voor de gezondheid van de kinderen. Er zijn verschillende oorzaken mogelijk waarom de effecten van vlees- en melksupplementen op groei niet werden waargenomen, of minder sterk waren dan verwacht. Door suppletie nam de voorziening in voedingsstoffen toe die essentieel zijn voor groei; mogelijk is dit effect tegengegaan doordat kinderen thuis minder van deze voedingsstoffen innamen. Het is
SAMENVATTING
160
bovendien mogelijk dat de inname van energie en bepaalde voedingsstoffen die essentieel zijn voor groei en gezondheid nog steeds onvoldoende waren. De hoge prevalentie van inadequate ijzerinname was te wijten aan het hoge gehalte in het normale dieet van voedselcomponenten die de ijzerabsorptie remmen. Het toevoegen aan maaltijden van zowel vlees als ascorbinezuur lijkt de meest werkzame strategie op huishoudniveau om de biobeschikbaarheid van ijzer te verhogen. De extra hoeveelheid vlees en fruit die nodig zijn om de prevalentie van inadequate ijzerinname aanzienlijk te verminderen, is echter onvoldoende verkend, of lijkt onuitvoerbaar. Deze strategieën moeten daarom worden gecombineerd met een andere aanpak om de ijzerinname te verbeteren. De bevindingen van deze studie tonen het belang aan van een verhoogde consumptie van dierlijke voedselbronnen als onderdeel van programma’s die zich richten op de bestrijding van het gebrek aan micronutriënten in ontwikkelingslanden.

ZZuussaammmmeennffaassssuunngg

ZUSAMMENFASSUNG
162
Viele Kinder in Kenia und anderen Entwicklungsländern leiden an Protein-Energie-Mangelernährung und Mikronährstoffmängeln, welche Wachstum und Immunität beeinträchtigen können und zu einem erhöhten Morbiditäts- und Mortalitäts-Risiko und verminderter psychomotorischer Entwicklung führen. Die Supplementierung mit Nährstoffen, v. a. Eisen, Zink und Vitamin A, konnte in einigen der durchgeführten Studien das Wachstum und den Gesundheitsstatus von Kindern verbessern. Da mehrfache Mikronährstoffmängel häufig simultan auftreten, sind Ansätze nötig, die zu einer Erhöhung der Aufnahme aller fehlenden Mikronährstoffe gleichzeitig führen. Ein erfolgsversprechender Ansatz um die Mikronährstoffversorgung von Kindern zu verbessern ist die Erhöhung des Verzehrs von Nahrungsmitteln tierischer Herkunft. Diese haben einen hohen Anteil an Mikronährstoffen mit einer guten Bioverfügbarkeit und können zusätzlich die Absorption von Mikronährstoffen aus Nahrungsmitteln pflanzlicher Herkunft, die normalerweise weniger gut verfügbar sind, verbessern. Beobachtende Studien in Kenia und anderen Ländern haben gezeigt, dass Kinder, die selbst kleine Mengen an Nahrungsmitteln tierischer Herkunft verzehren, besser wachsen. Jedoch können Ergebnisse beobachtender Studien durch den Einfluss von Störfaktoren fehlinterpretiert werden. Interventionsstudien mit Nahrungsmitteln tierischer Herkunft sind nicht nur selten, sondern variieren auch in ihren Methoden, was eine Isolierung der Faktoren erschwert, die für die beobachtenden Resultate verantwortlich sind.
Die Untersuchungen der vorliegenden Doktorarbeit sind Teil einer randomisierten kontrollierten Ernährungsinterventionsstudie. Diese wurde mit dem Ziel durchgeführt, Erkenntnisse über den kausalen Zusammenhang zwischen einer Erhöhung des Verzehrs von Nahrungsmitteln tierischer Herkunft und Wachstum, Morbidität und kognitiver Entwicklung zu erlangen. Die Studienregion befindet sich in Kyeni im Embu District (Eastern Province) in Kenia wo die meisten Menschen von Subsistenzlandwirtschaft leben. Die übliche Ernährung besteht aus Mais und Bohnen mit nur wenig oder gar keinen Nahrungsmitteln tierischer Herkunft und die Kinder leiden häufig unter Stunting (Wachstumsverzögerung) und Mikronährstoffmängeln. Basierend auf den Ergebnissen einer vorhergehenden Studie im gleichen Gebiet wurden Nahrungsmittelsupplemente mit Fleisch und Milch entwickelt, um Lücken zwischen der tatsächlichen Energie- und Nährstoffaufnahme und empfohlenen Mengen zu schließen.
Kinder im Alter von 6-9 Jahren aus zwölf Grundschulen wurden für die Teilnahme an der Studie ausgewählt (n 553). Die Schulen wurden nach einem Zufallsprinzip den Interventionsgruppen und der Kontrollgruppe zugeteilt: 1) Kontrollgruppe: kein Nahrungsmittelsupplement; 2) Energie-supplement: Nahrungsmittelsupplement basierend auf einem lokalen Gericht aus Mais, Bohnen und Gemüse (Githeri); 3) Milchsupplement: Githeri und ein Glas Milch (200 mL); und 4) Fleisch-supplement: Githeri mit 60 g Rindfleisch. Die Nahrungsmittelsupplemente hatten einen ähnlichen Energiegehalt von ~250 kcal/Portion (1050 kJ) während der ersten drei Monate der Intervention. Da die Kinder an Gewicht und Größe zunahmen, wurden die Supplemente dann verändert, um einen Energiegehalt von ~300 kcal/Portion (1255 kJ) zu erzielen. Dies wurde erreicht, indem die Portionsgröße des Energiesupplements von 185 g auf 230 g, die Milchmenge des Milchsupplements auf 250 ml und der Fleischgehalt des Fleischsupplements

ZUSAMMENFASSUNG
163
auf 85 g erhöht wurden. Die Nahrungsmittelsupplemente wurden für sechs Schultrimester von September 1998 bis Juli 2000 als Pausensnack in den Schulen ausgegeben. Es wurde angenommen, dass die Supplemente ~20% des täglichen Energiebedarfs decken würden, dass jedoch das Fleischsupplement den höchsten Anteil der empfohlenen Mengen an Mikronährstoffen, insbesondere Vitamin B12, bioverfügbarem Eisen und bioverfügbarem Zink und das Milchsupplement die höchsten Mengen an Vitamin A, Riboflavin, Calcium und Phosphor liefern würden. Folglich würde sich die Qualität der Nahrung der Kinder, die das Fleisch- oder Milchsupplement erhalten, im Vergleich zu den Kindern, die das Energie-supplement erhalten, verbessern. Die Quantität der Nahrung aller supplementierten Kinder würde im Vergleich zur Kontrollgruppe erhöht werden.
Der Effekt der Nahrungsmittelsupplemente auf das Wachstum der Kinder wurde anhand von multivariaten Analysen der erhobenen Daten von 498 Kindern untersucht, wobei eine Reihe von Merkmalen berücksichtigt wurde. Die Prävalenz von Stunting und schwerwiegendem Stunting zum Zeitpunkt der Baseline-Erhebung lag jeweils bei 25.3% und 4.6%. Weniger als 2% der Kinder litten unter Wasting (Auszehrung). Die Gewichtszunahme der Kinder, die ein Nahrungs-mittelsupplement erhielten, war signifikant höher (~10%) im Vergleich zu den Kindern in der Kontrollgruppe. Kinder, die das Fleisch-, Milch- oder Energiesupplement erhielten, nahmen jeweils 3.89 kg [95% Konfidenzintervall, 3.87; 3.91], 3.86 kg [3.88; 3.90] oder 3.87 kg [3.87; 3.91] zu. Kinder in der Kontrollgruppe nahmen nur 3.49 kg [3.47; 3.51] zu. Dieses Ergebnis deutet an, dass für die Gewichtszunahme die Nahrungsquantität von größerer Bedeutung als die Nahrungsqualität war. Jedoch scheint es, dass sich der Nahrungsmittel-verzehr zu Hause von der Baseline-Erhebung zum Zeitraum der Supplementierung veränderte und dies außerdem in unterschiedlicher Weise zwischen den Studiengruppen geschah. Dies hatte zur Folge, dass die Kinder, die das Fleischsupplement erhielten, eine höhere mittlere Energieaufnahme zu Hause hatten, als die Kinder, die das Milch- oder Energiesupplement erhielten. Deshalb kann keine endgültige Schlussfolgerung gezogen werden, ob die Energie und/oder die Nährstoffe, die die Supplemente lieferten, für die Gewichtsverbesserung verantwortlich waren.
Es konnte kein übergreifender Effekt der Nahrungsmittelsupplemente auf das Größenwachstum der Kinder festgestellt werden. Betrachtete man jedoch die Gruppe der Kinder, die zu Studienbeginn unter einem höheren Maß an Stunting litten, so sah man, dass die Kinder, die das Milchsupplement erhielten, 1.3 cm mehr wuchsen, als die Kinder in der Kontrollgruppe, ein nahezu signifikantes Ergebnis. Dies war wahrscheinlich dadurch bedingt, dass es bei diesen Kindern einen größeren Spielraum für Wachstum gab. Eine Zunahme im Oberarmmuskel-bereich, indikativ für den Proteinstatus, war am höchsten für die Kinder, die das Fleisch-supplement erhielten (Mittelwert [95% Konfidenzintervall], 152.9 mm2 [151.1; 154.7]). Sie nahmen ~80% mehr im Oberarmmuskelbereich zu als Kinder in der Kontrollgruppe (84.6 [82.8; 86.5]) (p = 0.002). Sie nahmen auch ~30% mehr zu, als Kinder, die das Milchsupplement erhielten (118.0 [116.3; 119.7]) (p = 0.040), und ~30% mehr als die Kinder, die das Energie-supplement erhielten (115.5 [113.7; 117.3]) (p = 0.034). Kinder, die das Milchsupplement

ZUSAMMENFASSUNG
164
erhielten, nahmen ~40% mehr im Oberarmmuskelbereich zu als die Kinder in der Kontrollgruppe (p = 0.046). Diese positiven Effekte der Nahrungsmittelsupplementierung könnten durch eine höhere Aufnahme an Protein und/oder bioverfügbarem Zink zustande gekommen sein. In einigen Studien wurde festgestellt, dass eine Supplementierung mit Zink zu einer Zunahme der fettfreien Körpermasse führt, wahrscheinlich durch einen Einfluss auf den Proteinmetabolismus und/oder auf eine Stimulierung des Appetits. Es könnte jedoch auch sein, dass die Kinder, die das Fleischsupplement erhielten, aktiver waren als die anderen Kinder und deshalb mehr Muskelmasse aufbauten. Es wurde kein Effekt der Nahrungsmittelsupplemente auf Maße des Körperfetts festgestellt, wahrscheinlich weil keine überschüssige Energie zur Speicherung zur Verfügung stand.
Lineare Regressionsanalysen dienten der Vorhersage welche Nährstoffe das Wachstum der Kinder bestimmen. Dabei wurden Nährstoffdaten der gesamten Ernährung, d.h. die des Nahrungsmittelverzehrs zu Hause und die der Nahrungsmittelsupplemente, zu Grunde gelegt. Energie, die von tierischen Nahrungsmitteln geliefert wurde, jedoch nicht Gesamtenergie, bestimmte den Zuwachs an Größe, Gewicht, Oberarmmuskelbereich und Oberarmfettbereich. Zusätzlich wurden Gewichts- und Größenzunahme durch die Aufnahme von Hämeisen, Vitamin A, Calcium und Vitamin B12 positiv beeinflusst. Im Gegensatz dazu hatten Nährstoffe die vorwiegend in Nahrungsmitteln pflanzlicher Herkunft vorkommen, sowie Nahrungsbestand-teile die die Nährstoffbioverfügbarkeit vermindern, wie z.B. Ballaststoffe und Phytate, einen negativen Einfluss auf das Wachstum der Kinder. Die Ergebnisse weisen darauf hin, dass Energie und Nährstoffe, die in hohen Mengen und in einer bioverfügbaren Form in Fleisch und Milch vorhanden sind, einen positiven Einfluss auf das Wachstum von Kindern haben.
Mikronährstoffe, die eine wichtige Rolle für ein gut funktionierendes Immunsystem haben, sind in großen Mengen und in einer leicht bioverfügbaren Form in Nahrungsmitteln tierischer Herkunft enthalten. Jedoch wurde in logistischen Regressionsmodellen kein Effekt der Nahrungsmittelsupplemente auf die Prävalenz von Atemwegserkrankungen, Augen- und Haut-infektionen, Erkrankungen des Magen-Darm-Traktes, Malaria und Indikatoren der Krankheits-schwere, wie Fieber, verminderter Appetit oder Bettlägerigkeit, festgestellt. Es war jedoch ein Trend zu erkennen, dass die vorhergesagten Risiken der meisten Krankheiten und Indikatoren der Krankheitsschwere für die Kinder am niedrigsten waren, die das Milchsupplement erhielten (statistisch nicht signifikant).
Die habituelle Ernährung in Entwicklungsländern basiert meistens auf Getreide und Hülsenfrüchten. Es wird angenommen, dass die schlechte Bioverfügbarkeit bestimmter Nährstoffe, besonders von Eisen und Zink, aus diesen Nahrungsmitteln zu der hohen Prävalenz von Mikronährstoffmängeln beiträgt. In der vorliegenden Studie wurde die Menge des aufgenommen Eisens und der Nahrungsbestandteile, die die Eisenabsorption beeinflussen, geschätzt. Dafür wurden Daten des Nahrungsmittelverzehrs verwendet, die über einen Zeitraum von 34 Monaten von den Kindern erhoben wurden, die als Kontrollen an der Ernährungs-interventionsstudie teilnahmen (n 78). Ein Algorithmus wurde verwendet, um die Menge des
ZUSAMMENFASSUNG
165
absorbierten Eisens abzuschätzen. Diese Berechnungen basierten auf der Summe von mehreren Nahrungsbestandteilen in einer Mahlzeit, die die Eisenabsorption fördern oder hemmen. Gleichzeitig wurden deren Wechselwirkungen berücksichtigt und die Eisenabsorption dem individuellen Eisenstatus der Kinder anpasst. Die Aufnahme an Gesamteisen betrug 15.74 ± 5.88 mg/Tag, wovon nur 0.05 ± 0.01 mg/Tag Hämeisen waren. Die Menge an absorbiertem Eisen war sehr gering (0.56 ± 0.47 mg/Tag). Dies war v. a. durch die hohe Aufnahme an Phytaten (2.9 ± 1.2 g/Tag) bedingt, die die Nichthämeisenabsorption um 35% (für das Frühstück) bis zu 78% (für das Mittag- und Abendessen) reduzierten. Die Verminderung der Eisenabsorption durch Polyphenole und Calcium lag bei jeweils 20-57% und 11-18% für die verschiedenen Mahlzeiten. Die Erhöhung der Eisenabsorption durch das Vorhandensein von Ascorbinsäure und Fleisch in einer Mahlzeit lag bei jeweils 14-139% und 0-9%. Die Absorption von Nichthämeisen reichte von 5% bis 13% für die verschiedenen Mahlzeiten, während die Absorption von Hämeisen ~30% für alle Mahlzeiten betrug. Für die Kinder in der Studie wurde die Prävalenz der unzureichenden Eisenaufnahme auf 77% geschätzt. Die Ergebnisse zeigen, wie wichtig eine Verbesserung der Eisenbioverfügbarkeit ist, um die Versorgung der Kinder mit diesem Nährstoff zu optimieren.
Ansätze zur Verbesserung der Eisenbioverfügbarkeit zielen darauf ab, die Menge an Nahrungsbestandteilen, die die Eisenabsorption fördern, zu erhöhen oder die Nahrungsbestandteile, die die Eisenabsorption hemmen, zu vermindern. Unterschiedliche Strategien, die auf Haushaltsebene durchgeführt werden können, wurden simuliert und auf ihr Potential die Eisenversorgung zu verbessern untersucht. Weiterhin wurden ihre möglichen Auswirkungen auf die Aufnahme anderer Nährstoffe beachtet. Die Analyse beruhte auf Daten des Nahrungsmittelverzehrs von Kindern, die als Kontrollen in der Ernährungsinterventions-studie teilnahmen (n 78). Die Ergebnisse zeigen, dass ein theoretischer täglicher Zusatz von 50 g Fleisch oder 100 mg Ascorbinsäure zum Abendessen die Prävalenz der unzureichenden Eisenaufnahme von 77% auf 54% reduzieren kann. Werden diese Mengen Fleisch und Ascorbinsäure kombiniert, kann die Prävalenz der unzureichenden Eisenaufnahme auf 23% reduziert werden. Eine wesentliche Reduzierung der Prävalenz der unzureichenden Eisenaufnahme auf 5% würde jedoch einen täglichen Zusatz von 100 g Fleisch plus 150 mg Ascorbinsäure zu einer Mahlzeit nötig machen. Die empfohlene Zufuhr an Zink und Vitamin B12 könnte durch einen täglichen Zusatz von 75 g Fleisch zur Ernährung erreicht werden. Der zusätzliche Verzehr einer Mango zu einer Mahlzeit würde 50 mg Ascorbinsäure liefern und genügend Retinoläquivalente, um die empfohlene Zufuhrmenge zu erreichen. Das Vermeiden des Trinkens von Polyphenolhaltigen Getränken, besonders Tee, zu den Mahlzeiten führte nicht zu einer Verminderung der Prävalenz der unzureichenden Eisenaufnahme. Durch die Anwendung von Haushaltsmethoden, wie z.B. das Einweichen oder Fermentieren von Getreide, konnte in einigen Studien eine Verminderung des Phytatgehalts der Nahrungsmittel erzielt werden. Die Simulation dieser Methoden führte jedoch im Rahmen der im Studiengebiet vorherrschenden Ernährungsgewohnheiten zu keiner Verminderung der Prävalenz der unzureichenden Eisenaufnahme.

ZUSAMMENFASSUNG
166
Aus den Ergebnissen der Studie kann die Schlussfolgerung gezogen werden, dass die Nahrungsmittelsupplementierung - unabhängig von der Art des Nahrungsmittelsupplements - die Gewichtszunahme von Schulkindern in einer ländlichen Region Kenias verbessern konnte und dass das Nahrungsmittelsupplement, das Fleisch enthielt, die fettfreie Körpermasse der Kinder erhöhte. In Bezug auf das Größenwachstum schienen Kinder, die unter einem höheren Maß an Stunting litten, von dem Milchsupplement zu profitieren. Energie und Nährstoffe, die Nahrungsmittel tierischer Herkunft in großen Mengen sowie in guter Bioverfügbarkeit liefern, beeinflussten das Wachstum der Kinder positiv. Dies wurde deutlich durch die Analyse der Nährstoffdaten der gesamten Ernährung der Kinder, d.h. die des Nahrungsmittelverzehrs zu Hause und die der Nahrungsmittelsupplemente. Die Supplementierung mit Fleisch oder Milch konnte die Prävalenz der am häufigsten vorkommenden Krankheiten und der Krankheits-schwere nicht vermindern. Es wurde jedoch ein Trend sichtbar, dass sich die Aufnahme von Milch positiv auf die Gesundheit der Kinder auswirken könnte. Mehrere Gründe sind denkbar, warum nicht alle erwarteten Effekte der Fleisch- und Milchsupplemente zu beobachten waren, bzw. weniger stark ausfielen als vorhergesagt. Der beobachtete Rückgang in der Aufnahme von für das Wachstum kritischen Nährstoffen in der Ernährung zu Hause könnte einer Erhöhung der Aufnahme dieser Nährstoffe durch die Nahrungsmittelsupplemente entgegengewirkt haben. Weiterhin ist es wahrscheinlich, dass die Aufnahme von Energie und Nährstoffen, die für Wachstum und Gesundheit essentiell sind, insgesamt immer noch nicht ausreichend war. Der beträchtliche Anteil an Nahrungsbestandteilen, die die Eisenabsorption hemmen, war die Ursache der hohen Prävalenz der unzureichenden Eisenaufnahme. Der kombinierte Zusatz von Fleisch und Ascorbinsäure zu einer Mahlzeit scheint der wirksamste Ernährungsansatz zu sein, um die Eisenbioverfügbarkeit der Kinder in der Studienregion zu verbessern. Allerdings ist der Zusatz der Mengen an Fleisch und Obst, die nötig wären, um die Prävalenz der unzureichenden Eisenaufnahme wesentlich zu reduzieren, noch nicht ausreichend untersucht oder scheint nicht realisierbar. Deshalb ist es unerlässlich diesen Ansatz mit anderen Strategien zu kombinieren, um eine tatsächliche Verbesserung der Eisenversorgung der Kinder zu erreichen. Die Ergebnisse der Studie zeigen, dass es wichtig ist, eine Förderung des Verzehrs von Nahrungsmitteln tierischer Herkunft in Programme zu integrieren, die das Ziel haben, Mikronährstoffmängel von Kindern in Entwicklungsländern zu vermindern.

167
AAcckknnoowwlleeddggeemmeennttss
Many people were involved in the study and the making of this thesis. It truly was an international effort with inputs from people in Germany, Kenya, USA and the Netherlands. This made the work interesting, but it was also more difficult to fit in everybody’s view and interest. I have gained experience, knowledge and insights of many issues related to nutritional research, particularly in an African country. I would like to take this opportunity to thank everybody who supported and accompanied me along this journey, which has finally come to an end.
The Division of Human Nutrition at Wageningen University, the Netherlands, became the “home” of my PhD, after having started working with the Child Nutrition Project in Kenya. The late Professor Clive West is the person at Wageningen University who adopted me and my work and became my main supervisor. Indeed, he was more like a father and cared a lot about me and my family. He has always believed in me and supported me as much as he could. His strive for high quality research, particularly in developing countries, has inspired me and contributed a lot to the success of this thesis. I wish there had been more of the fruitful meetings we had, and it is sad that he cannot see the final product of our combined effort. Special thanks go to Professor Joseph Hautvast: Thank you for accepting to be my supervisor and for all your assistance. Professor Frans Kok: Thank you very much for your valuable advice and support in the final phase of the thesis writing and for becoming my supervisor at the “last minute”.
I feel deeply indebted to Professor Charlotte Neumann from University of California, Los Angeles, the principal investigator of the study and my co-supervisor. Dear Charlotte, I can’t find words to express my gratitude to you for all you have done for me in the past years. Without you, I would not have had the chance to join this interesting project and accomplish a PhD. I clearly remember our first meeting at Fairview hotel in Nairobi together with Suzanne, where you told me about the study and that you are looking for a nutritionist to work with you in Embu. Since then, a lot of time has passed and many things happened. The time we spent together in Kenya was always nice, as were our meetings in the Netherlands and in Washington, DC. I always admired your wise ability to accommodate everybody’s needs and interests in such a big study and to make everybody feel as an important piece of the study. Thanks also for the uncountable emails that have crossed the ocean during the writing of my thesis and for sharing your profound knowledge and experience with me and for all the encouragement. I don’t think that I would have made it without you.
Professor Suzanne Murphy from University of Hawaii was the co-principle investigator of the study. Suzanne, my sincere thanks go to you for all your support and patience in answering my many questions concerning the food intake data and other issues. I have learned a lot from you, and enjoyed the time we spent together in several different places in Kenya and the USA. You were the person who always answered my emails first – THANK YOU!

ACKNOWLEDGEMENTS
168
The Kenyan counterpart of Professor Neumann was Professor Nimrod Bwibo, from University of Nairobi, Kenya. Prof. Bwibo, I would like to say “Asante sana” to you for all your help and for the effort you put into making the study a success and disseminating the results in Kenya and elsewhere, and for your life-long effort in improving the health and lives of Kenyan children.
Special thanks go to the other people from the USA who were involved in the initiation and conduct of the study and who made my participation possible: Professor Marian Sigman from UCLA, Professor Lindsay Allen from University of California, Davis and Dr. Montague Demment of Global Livestock CRSP, University of California, Davis. A number of students, PhDs, post-docs and workers from different universities in the USA spent some time in Embu and some of them have become good friends. Shannon, I really enjoyed the time we spent together in Embu at my house and elsewhere. I always cherished the exchange with you, which was interesting and contributed a lot to the accomplishment of this thesis. Jonathan, the time you spent in Embu has definitely been the most cheerful. It was super meeting you and finding a true friend in you. Tamara, Susan Johnson, Susan de Souza, Michelle, Sybille, Erin, Kat: It was great working with you in this project and sharing some time (and githeri) together in Embu. I am thankful to some other people from the USA who I have never met in person, but who have assisted me on various data related issues, Rob Weiss, Lois, Luohua, Li-Jung, Susan and Vern: Your help was essential for me to manage the data analyses!
And last, but not least, I have to express my gratitude to another person in the USA, Professor Audrey Maretzki from Penn State University. Dear Audrey, Thank you very much for all your support during the NutriBusiness Project and also later during the Embu project. It was a great pleasure working with you. I certainly have learned a lot during my time at ANP. You are the one who introduced me to Charlotte, and I guess without you I would not have stayed in Kenya for 3.5 years, would not have started a PhD and would not have met my husband!
Without the children and their parents who participated in the study none of this work would have been accomplished. We acknowledge the assistance of all government officials, headmasters, teachers, doctors, hospital workers and others who facilitated our work. It is highly appreciated that the study was well received amongst the communities and that we were always welcomed and immediately assisted on any issue.
It is impossible to individually name and thank all the people who were involved in the field work, including data collection, cooking and delivery of the food supplement, supervision of feeding, cleaning, supervision of field offices, driving and so forth. They all contributed to successfully accomplish the study. I particularly want to thank Anisia Warue Nyaga, Beatrice Njoki Muvutano, Catherine Mbere Njeru, Cecilia Wambui Kivare, Elizabeth Kaumbutho, Fides Rwamba, Florence Wambura Njoki, Jane Emily Guceca, Joyce Nyawira Njiru, Martha Mwandiko, Muthoni Josephine Ruria and Ruth Nancy Njagi. My dear “anthro enumerators”, ASANTE SANA for your hospitality and the good time we spent together during the 2.5 years. Without you and all the other enumerators, none of the work would have been accomplished. I know that I demanded a lot from you and that the work was not always easy,

ACKNOWLEDGEMENTS
169
but you rarely complained and tried to do your best. You made me feel at home in Embu and I will never forget your farewell-song and dance for me.
Thank you Zakayo Akula, Minnie Kamore, Rosemary Ngaruro, Connie Gewa, and Edith Mukudi for the collegiality and friendship throughout the time at CNP. You made me feel well received and at home in Kenya. My thanks also go to the data entry team, David Maina Gichobi, Rosalid Muthoni, Maina Watare, Martin Ehenzo and Bernice Gitiri Njagi. I acknowledge the assistance of Sister Njue of Runyenjes hospital in any health-related issues of the children. Dear Anne, thanks for your help during my time in Embu, you made my house a home for me.
I am obligated to a number of people at the University of Nairobi: Prof. Immungi, Dr. Wambui Kogi-Makau, Dr. Jane Muita, Dr. Abuid Omwega, the late Dr. Gabriel Maritim, Dr. Muroki, Dr. Keya, Gichia, Mugo, Lydia, and Naomi. At ANP hostel in Nairobi I met a lot of students from all over the world and some became good friends and relatives. Thanks Eddie, Peter, Hilda, Harriette and Paul and all the others for the good time we had together. You made my time in Kenya so much more enjoyable.
This work would not have been possible without the help of several people at Wageningen University. I want to express my gratitude to Pieter van’t Veer who always took time to sit down with me and answer my questions; Hans Verhoef who contributed a lot to the making of the two articles on iron bioavailability and who translated the summary into Dutch; Gerrit Gort and Jan Burema for their statistical advice; Grietje, Lous, Lidwien, and Marie for all their assistance in getting things organised, the late Dirk and Ben for their help on computer-related issues; Fré for his support and interesting talks. During the time I lived in Wageningen and also afterwards during several visits, the other PhD fellows made me feel at home and were always ready to help: Alida, Annemien, Astrid, Edine, Hilda, Jane, Judith, Kim, Mariska, Marjanka, Marlen, Maureen, Monica, Petra, Rosalie, Tiny and Wieke. Dank voor je gezelligheid! Simone and Kristel: Thank you very much for being my paranimfs and all your help (particularly in the translation of the summary)! Thanks also go to the foreign PhD fellows for the exchange and good time we had together: Alice, Elvina, Ragaa, Romain, Shufang, Siti and Young-Hee. Thank you, Eira, for being a great neighbour at Bornsesteeg hostel and later for letting me stay at your house during several visits to Wageningen and not to forget, for the delicious Mexican meals!
I want to express my gratitude to Werner Wosniok of Bremen University for his exceptional help in statistical analyses. Herr Wosniok, ohne Sie hätte ich die Statistik nie hingekriegt. 1000 Dank für Ihre Hilfe und für die Zeit, die Sie sich genommen haben, um mir geduldig alles zu erklären!
Danke, Kilian, für das Entwerfen des schönen Covers und der Einladungskarte!
Financial support of my research work is gratefully acknowledged. The research and part of my data analyses was financially supported by the Collaborative Research Support Program

ACKNOWLEDGEMENTS
170
(CRSP) at University of California, Davis. I received a Huygens Scholarship from the Netherlands organization for international cooperation in higher education (NUFFIC). I am also very grateful to Prof. Dr. Paul Walter who arranged financial support for me from the International foundation for the promotion of nutrition research (ISFE).
My family and friends have supported me throughout these past few years and showed understanding that I did not always have much time for them. I promise that this will change now! Danke Oma, Hermann und Thomas für Eure Unterstützung. Dear George, thank you for always being there for me and for believing in me. I admire your perseverance in following your professional career and hope that you can achieve what you strive for. Mein allerliebster Jeremy, die letzen zwei Jahre warst Du der Mittelpunkt in all meinem Denken und Tun und ich weiß jetzt was wirklich wichtig ist im Leben. Auch wenn es anstrengend war, Arbeit und Kind unter einen (Doktor-)hut zu bringen, möchte ich diese Zeit niemals missen. Ich verspreche, dass Du ab jetzt eine weniger müde Mama haben wirst!
Of all the people, I feel most deeply indebted to my parents. Mama und Papa, Ihr habt mich immer unterstützt, meine Entscheidungen respektiert und mir Liebe und Rückhalt gegeben. Obwohl diese Doktorarbeit kein Ende zu nehmen schien, habt Ihr nie daran gezweifelt, dass ich es schaffen werde (oder es mich zumindest nicht merken lassen). Mama, es war schön, dass Du mich in Kenia besucht hast. So konntest Du einen Eindruck bekommen, wie es dort ist, wo ich über 3 Jahre gelebt habe und wie es in den Dörfern und Schulen des Projektes aussieht. Danke auch für’s Babysitten in Bayreuth und Bremen, so dass ich die Arbeit voranbringen konnte. Was wäre ich ohne Euch?

171
CCuurrrriiccuulluumm VViittaaee
Monika Grillenberger was born on May 11, 1969, in Munich, Germany. In 1988, she completed secondary school at Feodor-Lynen-Gymnasium in Planegg. In 1990, she started her studies in Oecotrophologie (science of nutrition and home economics) at the Justus-Liebig-University, Giessen. She specialised in nutrition with particular interest in nutrition in developing countries. During the course of her studies, she did a number of internships within institutions in Germany, but also abroad, e.g., at the Research Institute for Health Sciences, Chiang Mai University, Thailand and with the Programme régional d'aménagement des bassins versants du Haut Niger et de la Haute Gambie, Guinea, West-Africa. Her thesis was entitled The status of nutrition and health of children in a rural area in Guinea/West-Africa – Strategies to improve nutrition security. In 1996 she received the Diplom (equivalent to an MSc degree).
After completing her studies in 1996, she worked for one year at the Division of Applied Human Nutrition at the University of Nairobi, Kenya, as an intern of the Deutsche Gesellschaft für Technische Zusammenarbeit (GTZ). In 1998, she joined the Child Nutrition Project in Embu, Kenya, and participated in carrying out the research work of the longitudinal food supplementation study Role of Animal Source Foods to Improve Diet Quality, Growth and Cognitive Development in East African Children. This study on which the work described in this thesis was based on was a collaborative effort of the Small Ruminant - Global Livestock Collaborative Research Support Program at University of California, Davis, USA; the University of California, Los Angeles, USA; and the University of Nairobi, Kenya.
In 2000, she joined the PhD Program of the Division of Human Nutrition and Epidemiology at Wageningen University, the Netherlands. She received scholarships from the Netherlands Organization for International Cooperation in higher Education (NUFFIC) and the International Foundation for the Promotion of Nutrition Research (ISFE), Germany. In 2000, she attended the postgraduate summer course Public Health Nutritional Epidemiology at the University of Southhampton, UK. In 2001, she attended the course Food security, the postgraduate course Advanced Statistics and the international advanced course Nutritional and Lifestyle Epidemiology at Wageningen University and the distance learning course Nutrition in Humanitarian Contexts with Action Against Hunger, London, UK.
In August 2001, she attended the 17th International Congress in Nutrition, Vienna, Austria. She presented her research work at the Conference Animal source foods and nutrition in developing countries, Washington DC, USA in June 2002 and at the 1st Africa Nutritional Epidemiology Conference, Vanderbijlpark, South Africa in August 2002. In 2002, she was selected to participate in the 8th European Nutrition Leadership Program (ENLP) in Luxembourg and is now a member of the ENLP Alumni Association.

172
LLiisstt ooff ppuubblliiccaattiioonnss
Peer-reviewed papers
Grillenberger M, Neumann CG, Murphy SP, Bwibo NO, van't Veer P, Hautvast JGAJ, West CE (2003) Food supplements have a positive impact on weight gain and the addition of animal source foods increases lean body mass of Kenyan schoolchildren. J Nutr 133 (11): 3957S-64S (Chapter 2).
Murphy SP, Gewa C, Liang L-J, Grillenberger M, Bwibo NO, Neumann CG (2003) School snacks containing animal source foods improve dietary quality for children in rural Kenya. J Nutr 133 (11): 3950S-6S.
Murphy SP, Gewa C, Grillenberger M, Neumann CG (2004) Adapting an international food composition table for use in rural Kenya. J. Food Comp. Anal. 17: 523-30.
Grillenberger M, Neumann CG, Murphy SP, Bwibo NO, Weiss RE, Hautvast JGAJ, West CE (2006) Intake of micronutrients high in animal source foods is associated with better growth in rural Kenyan school children. Br J Nutr 95: 379-90 (Chapter 3).
Grillenberger M, Neumann CG, Bwibo NO, Murphy SP, Wosniok W, Hautvast JGAJ, West CE. Impact of daily supplementation with animal source foods on morbidity of rural Kenyan school children [Submitted for publication] (Chapter 4).
Grillenberger M, Neumann CG, Bwibo NO, Murphy SP, Verhoef H, Hautvast JGAJ. High prevalence of inadequate iron intake in rural Kenyan school children [Submitted for publication] (Chapter 5).
Grillenberger M, Neumann CG, Murphy SP, Bwibo NO, Verhoef H, Hautvast JGAJ. The potential of household dietary strategies to improve iron nutrition in rural Kenyan school children [Submitted for publication] (Chapter 6).
Abstracts
Neumann CG, Siekmann JH, Bwibo NO, Allen LH, Grillenberger M (2001) Impact of infection and malaria on micronutrient status in rural Kenyan children [abstract]. Ann Nutr Metab 45 (Suppl 1): 16.
Murphy SP, Gewa C, Grillenberger M, Bwibo NO, Neumann CG (2001) Changes in dietary quality for school children in Kenyan villages [abstract]. Ann Nutr Metab 45 (Suppl 1): 24.
Murphy SP, Gewa C, Grillenberger M, Bwibo NO, Neumann CG (2005) Designing snacks to meet micronutrient deficiencies in rural Kenya [abstract]. S Afr J Clin Nutr 49 (Suppl 1): 11.

173
EEdduuccaattiioonnaall pprrooggrraammmmee Organising Institute Year Courses Public Health Nutritional Epidemiology University of Southhampton, UK 2000 Advanced Statistics WUR 2001 Food security WUR 2001 Nutritional and Lifestyle VLAG 2001 Epidemiology Nutrition in Humanitarian Contexts Action Against Hunger, UK 2001 Epidemiologic Data Analysis RIVM 2002 8th European Nutrition Leadership ENLP 2002 Programme, Luxemburg Presentations at conferences 17th International Congress in Nutrition, The Austrian Nutrition Society 2001 Vienna, Austria Conference Animal source foods and International Nutrition Program, 2002 nutrition in developing countries, UC Davis, USA Washington D.C., USA 1st Africa Nutritional Epidemiology Vaal Triangle Technikon 2002 Conference, Vanderbijlpark, South Africa ENLP, European Nutrition Leadership Programme RIVM, National Institute for Public Health and the Environment, Bilthoven, The Netherlands VLAG, Graduate School (Advanced Studies in Food Technology, Agrobiotechnology, Nutrition and Health Sciences), The Netherlands WUR, Wageningen University and Research Centre, Wageningen, The Netherlands

FINANCIAL SUPPORT
The study described in this thesis was funded by the Global Livestock Collaborative Research and Support Program, USAID Grant No. DAN-1328-G-00-0046-00 119-18.
Financial support for the author’s research work by the Global Livestock Collaborative Research and Support Program (CRSP), the Netherlands Organization for international cooperation in higher education (NUFFIC), the International foundation for the promotion of nutrition research (ISFE), Germany, and Wageningen University is gratefully acknowledged.
COVER
Children during their school break (Kinthithe Primary school, Kenya) (picture by Monika Grillenberger, 1998) Cover design: Kilian Neddermeyer, Munich, Germany
PRINTING
Grafisch bedrijf Ponsen & Looijen BV, Wageningen, the Netherlands
© Monika Grillenberger, 2006

175