Impact of a Diesel High Pressure Common Rail Fuel … titrator. Peroxide value was measured...
12
INTRODUCTION AND BACKGROUND Concerns about fuel security and greenhouse gas emissions are driving increased use of renewable fuels. Biodiesel, a leading renewable fuel used globally, is derived from vegetable oils or animal fats via transesterification with an alcohol to generate mono-alkyl esters of fatty acids [1]. This process is most often carried out with methanol producing fatty acid methyl esters (FAMEs) [2]. Biodiesel can fuel a compression ignition engine and is commonly used as a blend with diesel fuel. The current ASTM International specification for diesel fuel (D975) includes biodiesel blended to 5% by volume (B5), which is considered equivalent to standard diesel fuel. Blends Impact of a Diesel High Pressure Common Rail Fuel System and Onboard Vehicle Storage on B20 Biodiesel Blend Stability Earl Christensen and Robert L. McCormick National Renewable Energy Laboratory Jenny Sigelko and Stuart Johnson Volkswagen Group of America Inc. Stefan Zickmann Volkswagen AG Shailesh Lopes General Motors Co. Roger Gault Truck and Engine Manufacturers Association David Slade Renewable Energy Group Inc. ABSTRACT Adoption of high-pressure common-rail (HPCR) fuel systems, which subject diesel fuels to higher temperatures and pressures, has brought into question the veracity of ASTM International specifications for biodiesel and biodiesel blend oxidation stability, as well as the lack of any stability parameter for diesel fuel. A controlled experiment was developed to investigate the impact of a light-duty diesel HPCR fuel system on the stability of 20% biodiesel (B20) blends under conditions of intermittent use and long-term storage in a relatively hot and dry climate. B20 samples with Rancimat induction periods (IPs) near the current 6.0-hour minimum specification (6.5 hr) and roughly double the ASTM specification (13.5 hr) were prepared from a conventional diesel and a highly unsaturated biodiesel. Four 2011 model year Volkswagen Passats equipped with HPCR fuel injection systems were utilized: one on B0, two on B20-6.5 hr, and one on B20-13.5 hr. Each vehicle was operated over a one-hour drive cycle in a hot running loss test cell to initially stress the fuel. The cars were then kept at Volkswagen’s Arizona Proving Ground for two (35°C average daily maximum) to six months (26°C average daily maximum). The fuel was then stressed again by running a portion of the one-hour dynamometer drive cycle (limited by the amount of fuel in the tank). Fuel rail and fuel tank samples were analyzed for IP, acid number, peroxide content, polymer content, and ester profile. The HPCR fuel pumps were removed, dismantled, and inspected for deposits or abnormal wear. Analysis of fuels collected during initial dynamometer tests showed no impact of exposure to HPCR conditions. Long-term storage with intermittent use showed that IP remained above 3 hours, acid number below 0.3 mg KOH/g, peroxides low, no change in ester profile, and no production of polymers. Final dynamometer tests produced only small changes in fuel properties. Inspection of the HPCR fuel pumps revealed no deposits or abnormal wear for any fuel. The results provide some confidence that the ASTM D7467 stability requirement of 6 hr. minimum IP for B6 to B20 blends provides adequate protection for modern engine fuel systems. CITATION: Christensen, E., McCormick, R., Sigelko, J., Johnson, S. et al., "Impact of a Diesel High Pressure Common Rail Fuel System and Onboard Vehicle Storage on B20 Biodiesel Blend Stability," SAE Int. J. Fuels Lubr. 9(1):2016, doi:10.4271/2016-01-0885. 2016-01-0885 Published 04/05/2016 Copyright © 2016 SAE International doi:10.4271/2016-01-0885 saefuel.saejournals.org 203 NREL/CP-5400-65397. Posted with permission. Presented at the SAE 2016 World Congress & Exhibition, 12-14 April 2016, Detroit, Michigan.
Transcript of Impact of a Diesel High Pressure Common Rail Fuel … titrator. Peroxide value was measured...

INTRODUCTION AND BACKGROUNDConcerns about fuel security and greenhouse gas emissions are driving increased use of renewable fuels. Biodiesel, a leading renewable fuel used globally, is derived from vegetable oils or animal fats via transesterification with an alcohol to generate mono-alkyl
esters of fatty acids [1]. This process is most often carried out with methanol producing fatty acid methyl esters (FAMEs) [2]. Biodiesel can fuel a compression ignition engine and is commonly used as a blend with diesel fuel. The current ASTM International specification for diesel fuel (D975) includes biodiesel blended to 5% by volume (B5), which is considered equivalent to standard diesel fuel. Blends
Impact of a Diesel High Pressure Common Rail Fuel System and Onboard Vehicle Storage on B20 Biodiesel Blend Stability
Earl Christensen and Robert L. McCormickNational Renewable Energy Laboratory
Jenny Sigelko and Stuart JohnsonVolkswagen Group of America Inc.
Stefan ZickmannVolkswagen AG
Shailesh LopesGeneral Motors Co.
Roger GaultTruck and Engine Manufacturers Association
David SladeRenewable Energy Group Inc.
ABSTRACTAdoption of high-pressure common-rail (HPCR) fuel systems, which subject diesel fuels to higher temperatures and pressures, has brought into question the veracity of ASTM International specifications for biodiesel and biodiesel blend oxidation stability, as well as the lack of any stability parameter for diesel fuel. A controlled experiment was developed to investigate the impact of a light-duty diesel HPCR fuel system on the stability of 20% biodiesel (B20) blends under conditions of intermittent use and long-term storage in a relatively hot and dry climate. B20 samples with Rancimat induction periods (IPs) near the current 6.0-hour minimum specification (6.5 hr) and roughly double the ASTM specification (13.5 hr) were prepared from a conventional diesel and a highly unsaturated biodiesel. Four 2011 model year Volkswagen Passats equipped with HPCR fuel injection systems were utilized: one on B0, two on B20-6.5 hr, and one on B20-13.5 hr. Each vehicle was operated over a one-hour drive cycle in a hot running loss test cell to initially stress the fuel. The cars were then kept at Volkswagen’s Arizona Proving Ground for two (35°C average daily maximum) to six months (26°C average daily maximum). The fuel was then stressed again by running a portion of the one-hour dynamometer drive cycle (limited by the amount of fuel in the tank). Fuel rail and fuel tank samples were analyzed for IP, acid number, peroxide content, polymer content, and ester profile. The HPCR fuel pumps were removed, dismantled, and inspected for deposits or abnormal wear. Analysis of fuels collected during initial dynamometer tests showed no impact of exposure to HPCR conditions. Long-term storage with intermittent use showed that IP remained above 3 hours, acid number below 0.3 mg KOH/g, peroxides low, no change in ester profile, and no production of polymers. Final dynamometer tests produced only small changes in fuel properties. Inspection of the HPCR fuel pumps revealed no deposits or abnormal wear for any fuel. The results provide some confidence that the ASTM D7467 stability requirement of 6 hr. minimum IP for B6 to B20 blends provides adequate protection for modern engine fuel systems.
CITATION: Christensen, E., McCormick, R., Sigelko, J., Johnson, S. et al., "Impact of a Diesel High Pressure Common Rail Fuel System and Onboard Vehicle Storage on B20 Biodiesel Blend Stability," SAE Int. J. Fuels Lubr. 9(1):2016, doi:10.4271/2016-01-0885.
2016-01-0885Published 04/05/2016
Copyright © 2016 SAE Internationaldoi:10.4271/2016-01-0885
saefuel.saejournals.org
203
NREL/CP-5400-65397. Posted with permission. Presented at the SAE 2016 World Congress & Exhibition, 12-14 April 2016, Detroit, Michigan.

with higher content, from B6 to B20, are subject to the quality specification ASTM D7467, which includes additional properties specific to biodiesel blends. In both cases, the B100 used for blending must meet ASTM D6751.
A key property for biodiesel blend quality is the oxidation stability. This is due in part to the presence of unsaturated esters. Unsaturated alkyl chains of fatty esters can autoxidize when in contact with oxygen via a free radical mechanism [3]. Polyunsaturated structures are more susceptible to oxidation than are monounsaturated structures [4,5]. The mechanism occurs in three steps: initiation, propagation, and termination [6]. In the initiation step, a radical initiator causes abstraction of a hydrogen atom from a carbon adjacent to the double bond of an unsaturated alkyl chain. The resulting free radical reacts with doublet oxygen to form a peroxy radical, which then abstracts hydrogen from the alkyl chain of another unsaturated ester forming a long-chain hydroperoxy ester and a second radical ester, which in turn abstracts a hydrogen atom, thus propagating the chain reaction. The reaction is terminated when a resultant free radical reacts with another radical to form a stable product or when an antioxidant donates a hydrogen atom to form two stable products. The peroxides formed during this mechanism can degrade into lower molecular weight compounds such as acids, aldehydes, alcohols, and ketones or these peroxides can form higher molecular weight compounds through polymerization [7,8,9]. Once sufficient peroxide radicals are formed, the peroxide value grows exponentially prior to reaching a maximum as the rate of peroxide degradation outpaces that of peroxide formation, leading to an eventual decline in peroxide concentration [10]. As these peroxides degrade, the acid content will increase along with high-molecular-weight materials eventually becoming insoluble, leading to precipitation [11]. This mechanism and the resulting products, as well as strategies for mitigation, have been well studied in the literature of food science as these compounds lead to off flavors (rancidity) and reduce food quality [3,10]. These products of oxidation such as acids and polymers can degrade fuel quality, leading to corrosion, injector fouling, and fuel filter plugging if oxidation is allowed to proceed to extreme levels [12]. The mechanism of oxidation is accelerated by heat, oxygen exposure, and radical initiators. Fuel oxidation can be mitigated by adding antioxidants that terminate the chain reaction and by limiting exposure to heat, air, and radical initiators such as transition metals [13,14,15,16,17].
The oxidation stability of a biodiesel or biodiesel blend is a relative measure of its resistance to oxidation or oxidation reserve. The test employed to rate biodiesel blend oxidation stability is method EN 15751, which measures an oxidation induction period (IP) and is commonly known as the Rancimat test. A 7.5 g sample of the fuel is placed in a glass reaction vessel that is heated to 110°C with air bubbled through the liquid at 10 L/hr. The effluent air is carried through a beaker of distilled water containing an electrode for measuring conductivity. As the fuel oxidizes, volatile acids are produced that are carried over into the water with the effluent air, increasing the conductivity as they are collected [18]. The IP is determined from the point of inflection of the conductivity curve, which is reported in hours. This IP value is referred to as the
oxidation stability of the fuel. The conditions of this test method do not represent those encountered by the fuel during storage or onboard a vehicle, but are intended to quickly induce oxidation for the purpose of rating fuel stability. The higher the IP the higher its oxidation reserve and therefore the more stable the fuel.
The current minimum IP in ASTM D7467 for biodiesel blends up to B20 is 6 hours. This value has been found to provide adequate protection against the production of oxidation products during conditions encountered in fuel storage and use [17]. However, since the inception of this specification the United States has introduced ultra-low sulfur diesel (ULSD, <15 ppm S), and diesel engines equipped with high-pressure-common-rail (HPCR) fuel systems. HPCR fuel systems expose fuel to higher temperatures and pressures than previous models. There is concern that these fuel changes and more extreme conditions may necessitate greater oxidation stability to adequately protect against the production of acids and polymers inside the vehicle fuel system. This is of particular concern as some fuel passing through the HPCR is returned to the fuel tank where degraded fuel may propagate the oxidation mechanism, depleting storage stability. However, it is notable that Stromberg and coworkers found no autocatalytic impact for mixing of aged B7 or B100 with fresh B7 or B100 [19].
In this study, we examine the impacts of exposing B20 biodiesel blends to HPCR conditions in vehicles, as well as the stability of fuel during storage in the fuel tank to evaluate the adequacy of the oxidation stability minimum for protecting modern engine designs. Our hypothesis: if a B20 fuel made with ULSD has sufficient oxidation stability it will retain adequate oxidation reserve to prevent acid or insoluble material formation, or problematic peroxide growth, after stressing in HPCR fuel injection conditions followed by either intermittent use and longer-term storage onboard a vehicle or long-term storage onboard a vehicle in a relatively hot climate.
METHODS
Fuels and Fuel PreparationDiesel fuel (B0) was obtained from a terminal and confirmed to be free of biodiesel by ASTM test method D7371. A soy-derived, distilled biodiesel (B100) was acquired from a biodiesel producer prior to the addition of synthetic antioxidants. The properties of these base fuels are provided in Table 1 along with the test methods used. Except where stated in the following section, fuel properties were measured following standard procedures. Both blendstocks were found to have properties within their respective ASTM specification limits. An exception was the B100, which was below the oxidation stability limit of 3 hr IP minimum stated in ASTM D6751 for biodiesel (as expected due to the lack of antioxidant additive as requested). A portion of this biodiesel was treated with 100 ppm of butylated hydroxytoluene (BHT) antioxidant to raise the IP to 3.0 hr. This treated biodiesel was used to prepare a B20 blend with an IP of 13.5 hr, referred to as “B20 High.” A lower stability B20 near the IP minimum of 6 hr was prepared by lowering the IP of the untreated B100. To lower the B100 stability, the fuel was heated to 60°C with bubbling air for 50 hours. The resulting B100 had an IP of 1.5 hr. A B20 blend prepared with the lower stability B100 had an IP of 6.5 hr,
Christensen et al / SAE Int. J. Fuels Lubr. / Volume 9, Issue 1 (April 2016)204

referred to as “B20 Low.” Biodiesel content was confirmed to be 20% in both B20s by ASTM D7371. These two B20 blends were used throughout the study as high and low stability fuels.
Table 1. Base fuel properties.
Fuel Property TestingThe condition of the fuels was tracked during this study using multiple analyses to determine stability and monitor the production of oxidation products. The IP was measured following EN 15751 using a Metrohm 873 Biodiesel Rancimat. Total acid number (TAN) was measured by ASTM method D664 using a Metrohm 809 Titrando automatic titrator. Peroxide value was measured following American Oil Chemists Society (AOCS) method Cd 8b-90, modified for potentiometric endpoint detection using the same automatic titrator as for acid number with a platinum electrode. Viscosity was measured at
40°C by ASTM D445. Water content was measured by ASTM method D6304 (Karl Fischer method). FAME profiles of the blends were determined following EN 14331 for separation of FAME from middle distillates and characterization by gas chromatography using an Agilent 7890A gas chromatograph. BHT concentration of the B20 High was measured by gas chromatography-mass spectrometry by a third party testing laboratory.
Polymeric material formation was tracked with gel permeation chromatography (GPC) and solid phase extraction (SPE). This methodology was adapted from studies on measuring high-molecular-weight polar materials in fats and oils [20,21,22]. B20 samples were diluted in heptane at a concentration of 25 mg/mL with vanillin added as an internal standard at 0.5 mg/mL. This solution was extracted using a silica SPE cartridge (1 g silica, 6-mL capacity, Sigma-Aldrich). The extraction procedure was as follows: the column was rinsed with 10 mL 90:10 petroleum ether-diethyl ether, followed by addition of 2 mL of diluted sample; the sample matrix was eluted using 15 mL of 90:10 petroleum ether-diethyl ether; and finally, the polar material was rinsed from the column with 15 mL of diethyl ether. The diethyl ether rinse was evaporated to dryness under nitrogen flow, and the residue was dissolved with 0.5 mL tetrahydrofuran. The extracted material was measured by GPC using a Waters Acquity ultra-performance liquid chromatograph equipped with a refractive index detector. The columns used for compound separation by molecular weight were Waters Acquity APC XT 200, 125, and 45 Å (4.6 × 75 mm, 2.5 μm). Resolution of the molecular weight range of oxidized and polymerized FAMEs was confirmed by analyzing a solution of methyl stearate, monostearin, and tristearin. A standard prepared with monostearin and vanillin was used to determine the response factor of the refractive index detector for quantification. Spike analysis of the SPE method using monostearin determined the limit of quantitation of the method was 2 mg/100 mL of sample with precision of 0.4 mg/100mL (95% confidence on six replicates).
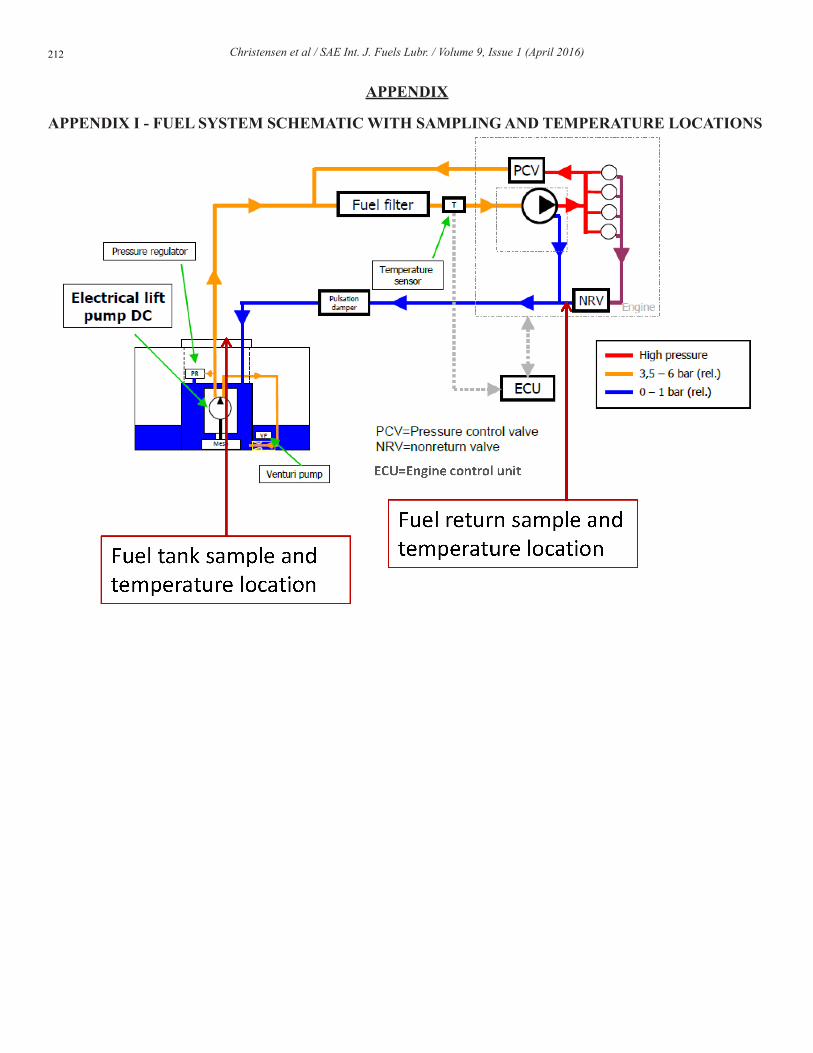
Vehicles and Vehicle PreparationFour identical 2011 model year Volkswagen Passat light-duty diesel vehicles equipped with HPCR fuel injection were instrumented to study conditions of the fuel in the vehicle’s fuel system. These were outfitted to record the fuel tank temperature, fuel return temperature at the rail exit, and fuel return rate using a Coriolis flow meter. The fuel rail pressure was measured with the on-board diagnostics tool. A passive sampling valve was installed in the rail fuel return line for collection of fuel prior to return to the fuel tank. Fuel tank samples were drawn through the tank flange vent port using a syringe. A schematic showing sampling locations is presented in Appendix I.
Drive Cycle and Fuel StressingA drive cycle was developed to provide a high temperature, high pressure, and high fuel return rate. Standard drive cycles for vehicle emission and fuel economy testing were compared including the LA4, HWFET, and US06. Each cycle was run three times, and conditions were recorded throughout. Of these cycles it was found that the US06 drive cycle provided the highest fuel return temperatures and rail pressures. These cycles were also compared to
Christensen et al / SAE Int. J. Fuels Lubr. / Volume 9, Issue 1 (April 2016) 205

steady-state operation at 65 mph in gear positions 5 and 6. To maximize the fuel temperatures and return rates, a combination of steady-state operation and the US06 drive cycle was applied to stress the fuels. The complete 60 minute drive cycle is provided in Table 2. To simulate vehicle operation in a hot environment, the drive cycle was run in a running loss test cell with ambient temperature maintained at 35°C (95°F) with underbody heating of 49°C (120°F) to simulate radiant heat loads from the road. An example of drive cycle data, including temperatures and pressures attained, is presented in Appendix II. Prior to running the cycle, each vehicle was fueled with one of the test fuels and allowed to equilibrate in the heated cell for 24 hours. Each vehicle fuel tank was filled with 6 gallons of an individual test fuel to provide adequate fuel for the drive cycle and fuel sampling while also providing a large amount of tank headspace and minimizing thermal inertia.
Table 2. Fuel exposure drive cycle.
The four vehicles were identified by the fuel used for testing. One was filled with B0 as a reference, a second vehicle was filled with B20 High, and the third and fourth cars were filled with B20 Low. Each of the four vehicles was run through the test cycle with fuel sampling from the tank after the 24-hour soak, from the rail return line early into steady-state operation, and from the tank after completion of the cycle.
Vehicle StorageAfter fuel stressing, the four vehicles were shipped from the test lab in Colorado to the Volkswagen Proving Grounds in Arizona for long term storage in a hot climate. Three of the cars (B0, B20 Low, and B20 High) were driven every 2 weeks according to the following drive cycle: 3 minute stop-and-go slow drive, two laps at steady 60- 65 mph on an oval (5 miles each), and 3 minute stop-and-go slow drive. This was conducted for a total of 8 weeks (nominally 2 months) of fuel storage with intermittent driving. A fuel sample was drawn from the tank prior to vehicle operation at each two-week interval and shipped to Colorado for analysis. At the week 6 and 8 intervals, the fuel in the HPCR return line was sampled for analysis prior to vehicle operation to provide a sample of fuel that was allowed to remain in the rail line for 2 weeks. After the initial 8-week storage period, these three cars were shipped back toColorado to repeat the test cycle and collect final samples foranalysis from the tank and rail.
The fourth car, filled with B20 Low, was not driven during the storage time, referred to as No-Start. This car remained parked for 26 weeks with periodic sampling of fuel in the tank to monitor storage stability. This car was not returned to Colorado for a final drive cycle.
The ambient temperatures at the proving grounds during the time the vehicles were stored are shown in Figure 1. Temperatures experienced during the start of storage and throughout the 2-month storage period were relatively high with an average dailymaximum of 35°C; however, temperatures during the bulk of the26-week storage period of the No-Start car were moderate withaverage daily maximum of 26°C.
Figure 1. Ambient temperatures during vehicle storage at the Arizona Proving Ground.
Final Vehicle TestingDue to insufficient fuel remaining, the final cycle was not fully completed. The fuel level was at 1/8 tank when the cars were received for final testing. The test was terminated when the vehicle’s onboard range calculation was between 5 to zero miles The B0 and B20 Low cars were able to run half-way through the cycle, running too low on fuel during the third US06 cycle (Step 5). The B20 High car overheated during the initial steady-state operation (Step 3). This vehicle overheating was not related to the fuel system, but was found by Volkswagen (after the vehicle was returned to its facility) to be caused by the cooling fan not operating. Samples were taken from the tanks and rails of all three vehicles after the incomplete cycle for end-of-test analysis. After test completion, the vehicles were returned to Volkswagen for inspection of the high-pressure fuel pumps.
Fuel Property CriteriaTo determine if the test fuels retained adequate oxidation reserve, limits were set on fuel properties as success or failure criteria. For a B20 to successfully maintain oxidation reserve at the end of the test, it must have maintained an IP greater than 3 hours. This limit allowed for a decline in IP from time of vehicle filling, but not a complete loss due to HPCR exposure or storage. The D7467 IP minimum of 6 hr applies at the retail fuel dispenser and is intended to provide adequate oxidation reserve to allow some antioxidant consumption as the fuel is stored and used in the vehicle. Previous studies have shown that deleterious acids and polymers generally do not form if the IP is kept
Christensen et al / SAE Int. J. Fuels Lubr. / Volume 9, Issue 1 (April 2016)206

above 3 hr [11,14,17]. Additionally, the TAN must not have exceeded the limit of 0.3 mg KOH/g set in ASTM D7467. The peroxide value was not used as a success criterion as no limit has been established for this value; however, this was tracked and was reviewed as it indicates fuel oxidation. An indication of oxidation would be an exponential increase in peroxides as well as high values achieved. Previous studies on biodiesel blend oxidation have shown that peroxide values of ∼500-1,000 mg/kg are reached in conjunction with acid production and fuel degradation [11,13,16]. Additionally, there was to be no significant difference in polymer content measured by GPC of the B20 compared to the B0 reference fuel. The viscosity of the B20 must not have increased significantly more than the B0. Finally, no fuel-related issues should be reported by the vehicle onboard diagnostics codes during operation.
RESULTS AND DISCUSSION
Fuel Properties - Fuel from TanksThe IP of samples taken from the tanks of the B20 Low, B20 Low, No-Start, and B20 High vehicles are shown in Figure 2. The error bars on this chart represent the reproducibility stated in EN 15751. The B0 samples were not analyzed for IP as this test method is not applicable to pure diesel fuel. The samples taken at 2 weeks from the proving ground are not shown on this chart. The IP values measured were significantly lower than subsequent samplings. Investigation of peroxides and acids in the two-week sample set showed increases for every sample, including B0. The IP, peroxide, and acid values could not have changed in the tank and then returned to their previous values; therefore, it was concluded that the samples had been compromised either during sample collection or shipping.
The samples taken after the initial soak in the test cell and after the test cycle showed no difference in IP, indicating the drive cycle did not deplete the IP of the fuel in the tank. Samples taken during vehicle storage showed a decline in the IP that is within the precision of the test method. The final value of the B20 High was not significantly different from the initial value. It is notable that B20 High values measured for samples shipped from Arizona to Colorado at weeks 4, 6, and 8 appear to be lower than values measured at the end of the test when the vehicles were returned to Colorado, although this difference is within test precision. This may be due to sample collection or shipping, but a cause has not been established. The B20 Low samples had a small decline in IP by the end of the test that was within the method precision. The final values measured were above 3 hr. The B20 Low, No-Start samples remained above 3 hr at the final sampling at 26 weeks, indicating the sample maintained adequate oxidation reserve.
The peroxide values of the tank samples were measured to monitor for increases that would indicate the onset of fuel oxidation. Although a peroxide value limit has not been established, an exponential growth in peroxides would indicate fuel oxidation that would lead to degradation of fuel quality. Values in the range of ∼500-1,000 mg/kg are expected upon production of acids and other degradation products. Peroxide values measured for the tank samples are provided
in Figure 3. The error bars in this figure represent intralaboratory repeatability of this methodology as inter-laboratory precision has not been established. The peroxide values measured for all fuels showed an increase by the end of the test; however, the final values are far lower than would be expected for degraded fuels. None of the fuels exceeded 100 mg/kg peroxides. The peroxide growth detected was not exponential; indicating widespread propagation of the free radical chain reaction had not taken place.
Figure 2. IP of B20 samples taken from fuel tanks. Error bars represent the reproducibility of EN 15751.
Figure 3. Peroxide value of samples taken from fuel tanks. Error bars represent in-house repeatability determined from the 95% confidence interval of 10 replicates of representative samples.
The TANs of the fuels showed no significant change throughout the test cycle and vehicle storage periods. The measured TAN values are shown in Figure 4. Error bars on this figure represent the reproducibility stated in ASTM D664. No TAN values measured differed significantly from the B0 values, indicating the B20s had not produced acids during the test cycle or subsequent storage.
Christensen et al / SAE Int. J. Fuels Lubr. / Volume 9, Issue 1 (April 2016) 207

Figure 4. TAN of samples taken from fuel tanks. Error bars represent the reproducibility of ASTM D664.
Fuel Properties - Fuel from Rail Return LineFuel samples were collected at the HPCR return line to measure the impacts of this high temperature and high pressure exposure on the fuel stability. The IPs of the B20 High and B20 Low rail line samples did not differ from their initial values when taken during the drive cycle, as shown in Figure 5 (initial and mid-cycle values). The rail line sample collected at 6 weeks for both fuels from the proving grounds showed a significant decrease in IP from the initial value, outside the test method variability; therefore, this was a statistically significant decrease. Subsequent sampling at 8 weeks showed a slightly higher value. IPs of the rail line fuels at the end of the test were similar to the samples taken at 8 weeks, which were nearly identical to values for samples taken from the fuel tanks (Figure 2). The temperatures experienced by the vehicle, shown in Figure 1, do not indicate higher ambient temperatures between weeks 4 and 6 compared to weeks 6 to 8. A possible explanation for this decline in IP is contamination of the sample, which was notable in the 6-week rail samples. A picture of the 6-week B20 High sample is shown in Figure 6. The composition of this contamination was not established; therefore, it is unknown whether this had a significant impact on the sample stability or if the decline in IP was due to HPCR conditions and fuel storage in the return line during hot ambient temperatures. Properties of the tank samples shown in Figures 2, 3, and 4 indicate the fuel stored in the tank was not impacted by fuel recirculation during the previous two driving intervals; therefore, return of the HPCR fuel to the tank did not significantly reduce storage stability.
Peroxide values of the rail return fuels collected during the drive cycle did not show a change compared to the initial values (Figure 7), and are the same or lower than tank sample values (Figure 3), indicating the HPCR did not cause peroxide formation. An increase in peroxides is notable at the 6-week interval sample; however, these values were low in comparison to oxidized B20. The values measured for all fuels were low at the end of test, although all showed a small
increase from the initial values. Acid concentrations of the samples taken from the rail return lines did not show any change throughout the test and did not differ significantly from the B0 (Figure 8).
Figure 5. IP of B20 samples taken from fuel rail return line. Error bars represent the reproducibility of EN 15751.
Figure 6. Fuel rail return line sample containing unknown contamination.
Figure 7. Peroxide value of samples taken from fuel rail return line. Error bars represent in-house repeatability determined from the 95% confidence interval of 10 replicates of representative samples.
Christensen et al / SAE Int. J. Fuels Lubr. / Volume 9, Issue 1 (April 2016)208

Figure 8. TAN of samples taken from fuel rail return line. Error bars represent the reproducibility of ASTM D664.
Fuel Properties - Other Indicators of OxidationAlthough an antioxidant was not added to the B20 Low or B0 samples, BHT was added to the B100 used to prepare the B20 High. An indication of oxidation would be depletion of this compound as it reacted with peroxide radicals to terminate the propagation of the chain reaction. Measurement of this compound using mass spectrometry allows for identification of the intact antioxidant. A quantitative analysis for BHT was made at Intertek. The results are provided in Table 3. The precision of this test method has not been established; therefore, the significance of the variation in values measured is unknown. The values measured remained close to the initially measured value of 24.8 mg/kg throughout the test. At the end of the test, the measured values in the tank and rail return line were both 25 mg/kg, indicating no measurable depletion of the antioxidant in this fuel from the HPCR exposure or storage time.
Table 3. BHT content of B20 High throughout test.
During oxidation of FAMEs, the ester composition is known to change due to consumption of the polyunsaturated esters [10]. As this occurs, the saturated and monounsaturated esters will become more concentrated relative to polyunsaturated esters as these more reactive species degrade to form oxidation products. To determine if the FAMEs in these B20s were degrading, we measured the FAME profiles following method EN 14331 at the beginning and end of the test as well as for the rail return samples taken at 8 weeks. The final sample of the B20 No-Start was also examined. The FAME compositions of these samples are shown in Figure 9. No significant change in polyunsaturated esters was detected.
Figure 9. FAME profiles of B20s at beginning and end of test. FAMEs are represented by the alkyl chain length and number of double bonds (CXX:Y).
The initial and final B0 and B20 samples as well as the rail return line samples were measured for polymeric material content by GPC. None of the samples showed any polymeric material detectable above the method limit of quantitation of 2 mg/100mL.
Water content of all samples went down over the test period. The B20 values were on average 100 mg/kg at the start of the test, which were reduced to 60 mg/kg on average at the end of the test. The B0 value began at 40 mg/kg and was reduced to 25 mg/kg. These changes likely occurred because of the many weeks of storage in the very low-humidity Arizona environment.
The viscosity of the B0 and B20 samples was measured at the beginning and end of the test by ASTM D445. An increase in viscosity could indicate the formation of polymeric materials and fuel degradation. The measured values for these fuels are provided in Table 4. The method reproducibility for these values is provided along with the change from beginning to end of test. A small increase was noted for both the B0 and B20 Low that was slightly outside the method precision, but the change in the B20 High was within the method precision. The final values measured for the B0 and B20 Low are well within the D975 and D7467 limits of 4.1 cSt.
Christensen et al / SAE Int. J. Fuels Lubr. / Volume 9, Issue 1 (April 2016) 209

Table 4. Viscosity of B20 at beginning and end of test.
Fuel Pump InspectionWhile the focus of the study was potential changes to the fuels upon exposure to onboard vehicle conditions, the high-pressure fuel pumps from the vehicles were dismantled and inspected for signs of wear and deposits. Photographs of the inlet filter, camshaft, and roller-follower from each vehicle are provided in Appendix III. The pumps were evaluated by comparison to the pump from the B0 reference fuel vehicle. No deposits were observed on the inlet filters for any pumps. The camshafts and roller-followers showed no abnormal wear, and the B20-fueled vehicles showed no difference from the B0-fueled vehicle.
SUMMARY/CONCLUSIONSBiodiesel blends were exposed to relatively high temperatures and high pressures in HPCR-equipped vehicles, and changes in the fuel related to oxidation stability were monitored. These experiments were conducted in a manner intended to simulate harsh, but realistic driving that could compromise fuel stability. Storage stability in the fuel tank was monitored after exposure of the entire vehicle to a hot and dry environment during a test cycle designed to create high fuel temperatures, pressures, and fuel return rates. The biodiesel (B100) utilized for the lower stability blend was out of specification for oxidation stability as the IP value of this blendstock was 1.5 hr compared to the 3 hr minimum requirement in D6751. Additionally, it was artificially aged prior to blending to achieve a low enough stability such that the B20 stability was only slightly above 6 hr. The use of highly unsaturated B100 ensured a high concentration of polyunsaturated esters, which are most susceptible to oxidation. This experiment was designed to introduce a potentially problematic, but on-specification B20 to harsh HPCR conditions.
Analysis of fuel from the HPCR return line showed no signs of fuel degradation as a result of the short-term exposure to these extreme conditions. Formation of peroxides is the first step in FAME oxidation, which was not observed in fuels collected in the HPCR return line. The acid numbers and Rancimat IPs were also not impacted by passing through the HPCR. These results indicate the HPCR conditions did not significantly induce fuel degradation via oxidation. The oxidation of FAME to form acids and peroxides requires the presence of oxygen and time for the reaction to occur. The reaction can be accelerated by heat. Because no peroxides or acids formed during exposure to HPCR conditions, it appears that the level of dissolved oxygen present in the fuel, the temperature, and the residence time are such that the initiation of oxidation does not occur.
Subsequent storage stability of the fuel in the tank showed a small decrease in IP over time for the low-stability blend, but no significant change in the high-stability blend. Peroxide values of the B0 and B20s increased during storage; however, the final values measured would not indicate significant fuel degradation. Acid values did not change for any fuel, and the B20s did not differ from the B0; therefore, secondary oxidation products generated by peroxide degradation were not formed during storage. Storage of the low-stability B20 in the fuel tank for 26 weeks showed no change in acid number and an IP above 3 hr at the end of this time frame. These results indicate that a B20 with an IP of 6.5 hr has adequate oxidation reserve to protect against acid and insoluble production when exposed to HPCR conditions and subsequently stored in a fuel tank under the conditions of this study.
The ambient conditions during the 26-week storage time were relatively moderate for the majority of this exposure. It is possible that hotter conditions could accelerate oxidation, leading to a different result. These ambient conditions did not impact the samples taken during the drive cycle (beyond their exposure history) as these were conducted in a running loss test cell with controlled temperature, but do impact conclusions regarding longer-term storage.
This study examined the impacts of HPCR exposure on fuel quality using only one vehicle design. These results may not apply to all light-duty diesel vehicle designs. Additionally, other engines and/or vehicles may generate more extreme conditions than experienced in these vehicles. However, these results provide some confidence that the ASTM D7467 stability requirement of 6 hr minimum IP provides adequate protection for modern fuel systems.
REFERENCES1. Knothe, G., Van Gerpen, J., and Krahl, J., “The Biodiesel Handbook,
Second edition,” (Champaign, Illinois, AOCS Press, 2010), ISBN 978-1-893997-62-2.
2. Van Gerpen, J., Shanks, B., Pruszko, R., Clements, D., et al., “Biodiesel Production Technology,” (Golden, National Renewable EnergyLaboratory, 2004), NREL/SR-510-36244.
3. Frankel, E.N., “Lipid Oxidation,” (Dundee Scotland, The Oily Press,1998). ISBN 978-0-9531949-8-8.
4. Knothe, G., “Structure Indices in FA Chemistry. How Relevant Is the Iodine Value?” JAOCS 79(9):847-854, 2002, doi: 10.1007/s11746-002-0569-4.
5. Knothe, G., “Some Aspects of Biodiesel Oxidative Stability,” Fuel Processing Technology 88:669-677, 2007, doi:10.1016/j.fuproc.2007.01.005.
6. Jain, S., and Sharma, M.P., “Stability of Biodiesel and its Blends: A Review,” Renewable and Sustainable Energy Reviews 14:667-678, 2010,doi:10.1016/j.rser.2009.10.011.
7. Chuck, C.J., Jenkins, R.W., Bannister, C.D., Han, L., et al., “Design and preliminary Results of an NMR Tube Reactor to Study Oxidative Degradation of Fatty Acid Methyl Ester,” Biomass and Bioenergy47:188-194, 2012, doi:10.1016/j.biombioe.2012.09.043.
8. Neff, W.E., Frankel, E.N., and Fujimoto, K., “Autoxidative Dimerizationof Methyl Linolenate and its Monohydroperoxides, HydroperoxyEpidioxides and Dihydroperoxides,” JAOCS 65(4):616-623, 1988, doi:10.1007/BF02540690.
9. Fang, H. and McCormick, R., "Spectroscopic Study of Biodiesel Degradation Pathways," SAE Technical Paper 2006-01-3300, 2006,doi:10.4271/2006-01-3300.
10. Kamal-Eldin, A., and Pokorny, J., “Analysis of Lipid Oxidation,” (Champaign, Illinois, AOCS Press, 2005). ISBN 1-893997-86-3.
11. McCormick, R.L., and Westbrook, S.R., “Storage Stability ofBiodiesel and Biodiesel Blends,” Energy Fuels 24(1):690-698, 2010,DOI:10.1021/ef900878u.
Christensen et al / SAE Int. J. Fuels Lubr. / Volume 9, Issue 1 (April 2016)210

12. Bouilly, J., Mohammadi, A., Iida, Y., Hashimoto, H. et al., "Biodiesel Stability and its Effects on Diesel Fuel Injection Equipment," SAETechnical Paper 2012-01-0860, 2012, doi:10.4271/2012-01-0860.
13. Mittlebach, M., and Schober, S., “The Influence of Antioxidants on the Oxidation Stability of Biodiesel,” JAOCS 80(8):817-823, 2003. DOI:10.1007/s11746-003-0778-x.
14. Christensen, E., and McCormick, R.L., “Long-Term Storage Stability ofBiodiesel and Biodiesel Blends,” Fuel Processing Technology 128:339-348, 2014, doi:10.1016/j.fuproc.2014.07.045
15. Karavalakis, G., and Stournas, S., “Impact of Antioxidant Additives on the Oxidation Stability of Diesel/Biodiesel Blends,” Energy Fuels 24:3682-3686, 2010, DOI: 10.1021/ef1004623.
16. Knothe, G., Dunn, R.O., “Dependence of Oil Stability Index of Fatty Compounds on Their Structure and Concentration and Presence of Metals,” JAOCS 80(10): 1021-1026, 2003, doi: 10.1007/s11746-003-0814-x.
17. McCormick, R.L., and Westbrook, S.R., “Empirical Study of theStability of Biodiesel and Biodiesel Blends,” (Golden, National Renewable Energy Laboratory, 2007), NREL/TP-540-41619.
18. de Man, J. M., Tie, F., and de Man, L., “Formation of Short ChainVolatile Organic Acids in the Automated AOM Method,” JAOCS64(7):993-996, 1987, doi: 10.1007/BF02542435.
19. Stromberg, N., Saramat, A., and Eriksson, H., “Biodiesel Degradation Rate after Refueling,” Fuel 105: 301-305, 2013, doi:10.1016/j.fuel.2012.09.072
20. Márquez-Ruiz, G., Jorge, N., Martin-Polvillo, M., and Dobarganes, M. C., “Rapid, Quantitative Determination of Polar Compounds in Fats and Oils by Solid-Phase Extraction and Size-Exclusion ChromatographyUsing Monostearin as Internal Standard,” Journal of Chromatography A 749:55-60, 1996, doi:10.1016/0021-9673(96)00429-3
21. Hopia, A. I., Lampi, A. M., Piironen, V. I., Hyvonen, L. E. T., et al.,“Application of High-Performance Size-Exclusion Chromatography toStudy Autoxidation of Unsaturated Triglycerols,” JAOCS 70(8):779-784,1993, DOI: 10.1007/BF02542600.
22. Marmesat, S., Velasco, J., Márquez-Ruiz, G., and Dobarganes, M. C., “A Rapid Method for Determination of Polar Compounds in Used Frying Fats and Oils,” Grasas y Aceites 58(2):179-184, 2007, DOI: 10.3989/gya.2007.v58.i2.83.
CONTACT INFORMATIONEarl [email protected]
ACKNOWLEDGMENTSThis work was supported by the National Biodiesel Board under Cooperative Research and Development Agreement CRD-05-153 with the National Renewable Energy Laboratory. Additional support was provided by the U.S. Department of Energy Vehicles Technologies Office, under Contract No. DE347AC36-99GO10337 with the National Renewable Energy Laboratory. Passat vehicles, proving ground storage, sampling and driving at the proving ground, and vehicle component teardown and analysis were provided by Volkswagen.
DEFINITIONS/ABBREVIATIONSAOCS - American Oil Chemists Society
B0 - base diesel fuel containing no biodiesel
B100 - biodiesel blendstock, 100 % biodiesel
Bxx - diesel-biodiesel blend containing xx% biodiesel by volume
BHT - butylated hydroxytoluene
FAME - fatty acid methyl ester
GPC - gel permeation chromatography
HPCR - high pressure common rail
HWFET - Highway fuel economy test
IP - induction period
LA4 - Also known as the EPA Urban Dynamometer Driving Schedule, it is a light duty vehicle driving cycle used for emission testing
mph - miles per hour
SPE - solid phase extraction
TAN - total acid number expressed as mg KOH/g
ULSD - ultra-low sulfur diesel
US06 - a high acceleration aggressive driving schedule for light duty vehicle emission testing. Often identified as the "Supplemental FTP" driving schedule
Christensen et al / SAE Int. J. Fuels Lubr. / Volume 9, Issue 1 (April 2016) 211
APPENDIX
APPENDIX I - FUEL SYSTEM SCHEMATIC WITH SAMPLING AND TEMPERATURE LOCATIONS
Christensen et al / SAE Int. J. Fuels Lubr. / Volume 9, Issue 1 (April 2016)212

APPENDIX II - EXAMPLE DRIVE CYCLE RESULTS
Christensen et al / SAE Int. J. Fuels Lubr. / Volume 9, Issue 1 (April 2016) 213

APPENDIX III - HIGH PRESSURE FUEL PUMP INSPECTION
Figure III-1. Parts from high-pressure fuel pump from vehicle fueled with B0: inlet filter, camshaft, and corresponding roller-follower.
Figure III-2. Parts from high-pressure fuel pump from vehicle fueled with B20 Low: inlet filter, camshaft, and corresponding roller-follower.
Figure III-3. Parts from high pressure fuel pump from vehicle fueled with B20 Low, No-Start vehicle: inlet filter, camshaft, and corresponding roller-follower.
Figure III-4. Parts from high pressure fuel pump from vehicle fueled with B20 High: inlet filter, camshaft, and corresponding roller-follower.
Photos provided by Volkswagen.
All rights reserved. No part of this publication may be reproduced, stored in a retrieval system, or transmitted, in any form or by any means, electronic, mechanical, photocopying, recording, or otherwise, without the prior written permission of SAE International.
Positions and opinions advanced in this paper are those of the author(s) and not necessarily those of SAE International. The author is solely responsible for the content of the paper.
Christensen et al / SAE Int. J. Fuels Lubr. / Volume 9, Issue 1 (April 2016)214


![Karl Fischer Moisture Titrator - MRCLAB · 2019-01-30 · Karl Fischer Moisture Titrator [Volumetric titration] Karl Fischer Moisture Titrator [Coulometric titration] 2 3 Unique flexibility](https://static.fdocuments.us/doc/165x107/5ea76e185906362b716d093d/karl-fischer-moisture-titrator-mrclab-2019-01-30-karl-fischer-moisture-titrator.jpg)