Impact Evaluation of Maternal-Child Health and Family Planning Services Utilization in...
18
1 Impact Evaluation of Maternal-Child Health and Family Planning Services Utilization in Rural Uttar Pradesh (India) Chander Shekhar 1 and Diwakar Yadav 2 Background: Does utilization of antenatal care services influence the use of succeeding institutional delivery, post natal care services and modern contraceptive use among women in rural Uttar Pradesh? And if so, to what extent MCH services as a package influence the use of modern methods of family planning. The answers to these questions have important implications for reproductive health programme which assumes a strong association between its two domains. If propensity for adopting modern contraception were to be related to the coverage of MCH services, the pace of improvement in contraceptive prevalence might be accelerated through increasing the population coverage and intensity of MCH services. A review of literature on integrated service delivery, however, found no consistent benefit of integration on patient outcomes, costs or health system performance in less developed settings, although the number of studies was small and their designs limited to make comparisons (Briggs et al., 2001). Nonetheless, two of the studies demonstrated that integration of family planning service delivery results in increased contraceptive use (Huntington and Aplogan, 1994; Taylor et al., 1987). Because the demand for contraception fluctuates over the course of women’s reproductive life, the timing of service delivery must be considered as part of any integration effort. The postpartum period is particularly important because appropriate birth spacing can improve maternal-child health (Levitt et al., 2004). Moreover, the demand for effective contraception may be high felt immediately after delivery. Previous cross sectional studies report positive associations between maternal-child health care service use and subsequent contraceptive use (Hotchkiss et a., 1999; Zerai and Tusi, 2001; Seiber et al. 2005). In addition, the prenatal care services offer the opportunity to reach women who generally would be the primary client of family planning services. As a result, global strategies have used prenatal care 1 Associate Professor, Department of Mathematical Demography and Statistics, International Institute for Population Sciences (IIPS), Mumbai, India. Email: [email protected] 2 Technical Officer, FHI 3600, India
Transcript of Impact Evaluation of Maternal-Child Health and Family Planning Services Utilization in...

1
Impact Evaluation of Maternal-Child Health and Family Planning Services Utilization in
Rural Uttar Pradesh (India)
Chander Shekhar1
and Diwakar Yadav2
Background:
Does utilization of antenatal care services influence the use of succeeding institutional delivery,
post natal care services and modern contraceptive use among women in rural Uttar Pradesh? And
if so, to what extent MCH services as a package influence the use of modern methods of family
planning. The answers to these questions have important implications for reproductive health
programme which assumes a strong association between its two domains. If propensity for
adopting modern contraception were to be related to the coverage of MCH services, the pace of
improvement in contraceptive prevalence might be accelerated through increasing the population
coverage and intensity of MCH services.
A review of literature on integrated service delivery, however, found no consistent benefit of
integration on patient outcomes, costs or health system performance in less developed settings,
although the number of studies was small and their designs limited to make comparisons (Briggs
et al., 2001). Nonetheless, two of the studies demonstrated that integration of family planning
service delivery results in increased contraceptive use (Huntington and Aplogan, 1994; Taylor et
al., 1987). Because the demand for contraception fluctuates over the course of women’s
reproductive life, the timing of service delivery must be considered as part of any integration
effort. The postpartum period is particularly important because appropriate birth spacing can
improve maternal-child health (Levitt et al., 2004). Moreover, the demand for effective
contraception may be high felt immediately after delivery. Previous cross sectional studies report
positive associations between maternal-child health care service use and subsequent
contraceptive use (Hotchkiss et a., 1999; Zerai and Tusi, 2001; Seiber et al. 2005). In addition,
the prenatal care services offer the opportunity to reach women who generally would be the
primary client of family planning services. As a result, global strategies have used prenatal care
1 Associate Professor, Department of Mathematical Demography and Statistics, International Institute for Population Sciences (IIPS), Mumbai,
India. Email: [email protected] 2 Technical Officer, FHI 3600, India
2
as an entry point in the delivery of core reproductive health services, including family planning
(WHO, 2004).
Primarily, in this paper an attempt has been made to understand the propensity of using any
family planning method among those women who availed at least one maternal healthcare service
(antenatal, delivery or postnatal) verses who did not. The later part of it deals with the effects of
community level factors and intensity of MCH services on propensities of using a modern family
planning method.
Data and Methodology:
In this study, the third rounds of the district level household survey (DLHS) 2007-08 dataset has
been analyzed. DLHS is the only source that provides sociodemographic information at the
district level for the whole country. It collects information from households on socioeconomic
aspects, and background characteristics, reproductive and child health information from ever-
married women aged 15-49 years. A multi-stage stratified systematic sampling design was
adopted for DLHS-3. In each district, 50 primary sampling units (PSUs), which were census
villages in rural area and census enumeration blocks (CEB) in urban area. In rural, villages were
selected by probability proportional to size (PPS) systematic sampling and in the second stage
households were selected by systematic sampling. In urban, first wards were selected by PPS
systematic sampling, and CEBs at the second stage using PPS sampling. Finally, at the third
stage, urban households were sampled using systematic sampling from the selected CEBs. In
both areas, all ever-married women aged 15-49 years from the selected households were
interviewed. In Utter Pradesh, it covered 90,415 surveyed households, and 87,564 ever-married
women from them. First of all, currently married women who have given births since 1st Jan,
2004 were selected from the dataset. Nearly half of total currently married women (63,040) had
at least one live birth since the above reference date. The number of such currently married
women aged 15-44 years is 31,423, and is the final sample size for this paper.
The first part of the analysis has been performed by using statistical software STATA 12.1
version. MlwiN 2.15 software package was used to extend the analysis for the second objective.

3
An indicator for using at least one maternal healthcare service out of the three broad domains of
maternal care has been developed. Thereafter, a cross-tabulation analysis has been carried out to
understand the use of any family planning method among those who received at least one
maternal care service, and otherwise. Thereafter, propensity score matching technique has been
used. This technique is appropriate to overcome the problem of selection bias, especially while
generalizing the findings. Thereafter, an indicator for maternal and child health intensity has also
been developed to understand the community level effects in the integration between MCH and
family planning indicator (using any modern method). To understand the community level
effects, multilevel statistical technique has been used.
Propensity score matching (PSM)
Propensity score matching method has been used to examine the average effects on treatment
group to understand the problem of selection bias or endogeneity. In order to have a valid
estimation of the effect of receiving maternal healthcare services on contraceptive use, one needs
to have a variable that explains variation in our exposure variable (receiving at least one maternal
health service) but not on the outcome variable. As a part of this estimation, we estimate the
correlation between the unobservables (atrho in the model) and test whether it is significantly
different from zero. If it is so, then we conclude that receiving at least one MH service is an
endogenous variable then we should proceed to the estimate of effectiveness that control for this
endogeneity using biprobit analysis. If there is no statistically significant correlation in the
unobservable variables, we can conclude that receiving at least one maternal healthcare service is
an exogenous in equation. In such situation, we should proceed to estimate of effectiveness
determined from a simple probit estimation of equation controlling only for observable
characteristics of respondents.
a. Problem of selection bias
An impact evaluation is essentially a problem of missing data, because one cannot observe the
outcomes of programme participants had they not been beneficiaries. Without information on the
counterfactual, the next best alternative is to compare outcomes of treated (beneficiaries of a
particular service i.e. at least one maternal health care services) individuals or households with
those of a comparison group that has not been treated (non-beneficiaries of the some service). In

4
doing so, one attempts to pick a comparison group that is very similar to the treated group, such
that those who received treatment would have had outcomes similar to those in the comparison
group in absence of treatment. Successful impact evaluations centered on the findings of a good
comparison group. There are two broad approaches that researchers resort to in order to mimic
the counterfactual of treated group: (i) create a comparable group through a statistical design, (ii)
modify the targeting strategy of the program itself to wipe out differences that would have existed
between the treated and non-treated groups before comparing outcomes across the two groups.
Equation 1.0 presents the basic evaluation problem comparing outcomes Y across treated and non
treated individuals ‘i’ is
Here T is a dummy equal to 1 for those who participate and 0 for those who do not participate. X
is set of other observed characteristics of the individual and perhaps of his or her household and
local environment. Finally, ε is an error term reflecting unobserved characteristics that also affect
Y. The problem with estimating equation is that treatment assignment is not often because of the
following factors: (i) purposive programme placement and (ii) self-selection in to programme.
That is, programmes are placed according to the need of the women, who in turn self-selected
given programme design and placement. Self-selection could be based on unobserved
characteristics, unobserved factors, or both. In the case of unobserved factors, the error term in
the estimating equation will contain variables that are also correlated with the treatment dummy
T. One cannot measure and account for these unobserved characteristics in equation, which leads
to unobserved selection bias. That is cov (T, ε) ≠ 0 implies the violations of one of the key
assumption of ordinary least square in obtaining unbiased estimates: independence of regressors
from the disturbance term ε. The correlation between T and ε naturally biases the other estimates
in the equation, including the estimate of the programme effect β.
This problem can also be represented like the impact of ANC on outcome variable such as
institutional delivery in a conceptual manner, aimed at to increase institutional delivery. Let Yi
represents the status of institutional delivery of woman i. For individuals, Ti =1 and the value of
Yi under treatment is represented as Yi (1). For nonparticipants, Ti = 0 and Yi can be represented

5
as Yi (0). If Yi (0) is used across non-participating individuals as a comparison outcome for
participant’s outcomes Yi (1), the average effects of the programme might be presented as
follows:
The problem is that the treated and non treated groups may not be the same as prior to the
intervention, so the expected difference between those groups may not be entirely due to
programme intervention. If, in equation (1.1), one adds and subtracts the expected outcome for
non-participants had they participated in the programme i.e. , or another way to
specify the counterfactual one gets
In this equation, ATE is the average treatment effect
namely, the average gain in outcomes of treated (participants) relative to non-treated (non-
participants), as if non-participating women’s were also treated. The ATE corresponds to a
situation in which a randomly chosen woman from the population is assigned to participate in the
programme, so participating and non-participating women have an equal probability of receiving
the treatment T. The term B, is the extent of selection bias
that crops up in using D as an estimate of the ATE.
Because is unknown therefore, one cannot calculate the magnitude of selection
bias. As a result, if one does not know the extent to which selection bias makes up D, one may
never know the exact difference in outcomes between the treated and the control groups. The
basic objective of a sound impact assessment is then to find ways to get rid of selection bias
(B=0) or to find ways to account for it. It has been argued that selection bias would disappear if
one could assume that whether or not households or individuals receive treatment were
independent of the outcomes that they have. This assumption is called the assumption of
unconfoundedness also referred to as the conditional independence assumption.

6
The PSM method in STATA generates regression coefficients using the probit analysis by
default. In case of Rho comes out as significant in the probit analysis with selected predictors
indicating that the effects of the first stage variable (i.e. at least maternal health care service) on
contraceptive use will be underestimated. Therefore, biprobit analysis needs to be carried out to
overcome such situation (Rosenbaum and Rubin, 1983; Hustchinson and Wheeler, 2006).
b. Multilevel regression analysis
To study the effects of community level variables that play significant role in utilizing any
healthcare service, multilevel regression analysis has been carried out. Analysis for the second
objective has been organized in two stages. Firstly, the random intercept model has been carried
out by taking individual-household level variables at level one and primary sampling unit (PSU)
as the community at the level second. Secondly, the random slope model of utilization a specific
service as predictor has also been carried out at the same levels.
For each of the dependent variable, a general form of random intercept model is:
where “i” is individual and household level and “j” is community level, is fixed component
and a community specific component, the random effect . Here it assume that the follow a
normal distribution with mean zero and variance .
For each of dependent variable, general form for random slope model is
Where a “j” subscript have been added to the coefficient of x, indicating that the coefficient
depends on community. The effect of x is , for community “j” which is shown in equation
(4.1 b). Where is a normally distributed random effects with mean zero and variance .

7
Allowing the coefficient of X to vary across community has also introduced the parameter ,
which is the covariance between and . The Variance Partition Coefficient (VPC), which
for a two level random intercept model, is the proportion of total residual variance is attributable
to level 2 can be calculated as
.
Results:
Dropout and continuity of Maternal Healthcare and Family Planning services in rural Uttar
Pradesh
Figure 1 (Flowchart) shows the proportion of currently married women aged 15-44 years who
received antenatal care (ANC) and their continuity for institutional delivery, postnatal care and
using any or modern contraceptive methods in rural Uttar Pradesh. One can easily observed that
if a woman receives all the maternal healthcare services she possess higher propensity to use a
family planning method. In case of using a modern method, the difference between those who
received all the maternal healthcare services and who did not receive any service is found to be
quite large (10 percentage points). The flowchart can easily give an idea about continuity of
women from ANC to subsequent services. Around 37 percent women are getting excluded at the
stage of antenatal care. Only 29 percent of those who receive any antenatal care service had
institutional delivery. On the contrary, this proportion is almost three times higher than among
those who did not receive any ANC service. Further, those women who had ANC as well as
institutional delivery, they show much higher propensity to receive postnatal care service (68%)
than those who did not receive prior services (17%).
So, if one follows a positive path of receiving service at each stage of maternal healthcare in the
flowchart, the propensity of using modern/any method of family planning is found to be much
above (36% for any method and 24% for any modern method) than passing through the
absolutely negative path (14% for any method).
Sociodemographic differentials in using any family planning by status of receiving at least one
maternal health (MH) care service in rural Uttar Pradesh
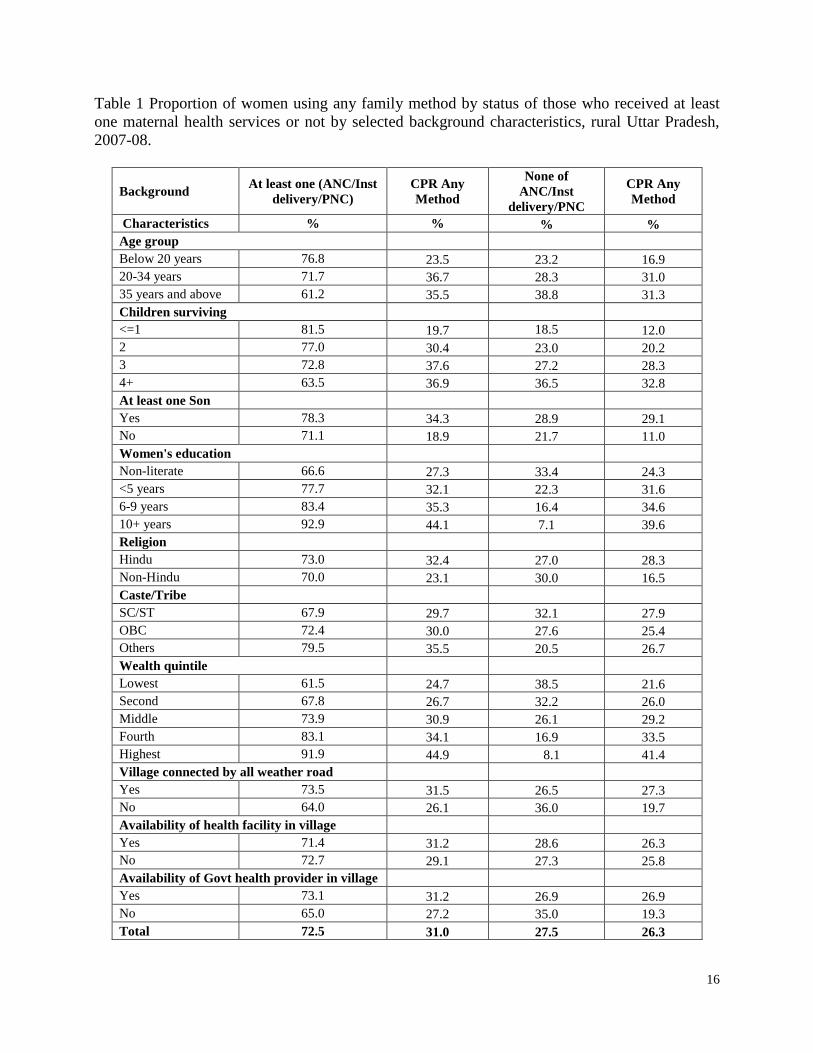
Table 1 shows the proportion of women using any method of family planning among those
women who had received any maternal healthcare service (Treatment) and who did not (Control)

8
in Uttar Pradesh. Ironically, almost 28 percent of women who had their last birth during 1st
January 2004 and the survey did not receive any maternal healthcare service. The Table shows
that the proportion of those who received at least one of these services varies by background
characteristics. Older women (35 years and above), women with four or higher number of
surviving children, non-literate, from the lowest wealth quintile households have lower
propensity to receive at least one of these services. A higher proportion of women, who did not
live in the villages with connected all weather roads or in villages where any public health
provider is not available, gets deprived of any such service.
Thirty one percent of women those nearly three-fourths (72%) who got at least one MH care
service were using a family planning method. On the contrary, only 26 percent of women were
using them among those (28%) who did not get any maternal healthcare service. Thus, the
difference between two groups is found to be almost five percentage points. Across all the
sociodemographic backgrounds, the level of contraceptive prevalence rate (CPR) is found to be
higher among those who received at least one maternal healthcare service than those who did not.
The difference between the CPR of two groups of women (Treatment and Control) are wider in
case of women with two or three surviving children, other castes, not having any son, and village
with no public health providers. However, women from social and economic better off
backgrounds had high CPR in both the groups.
Results from Probit analysis
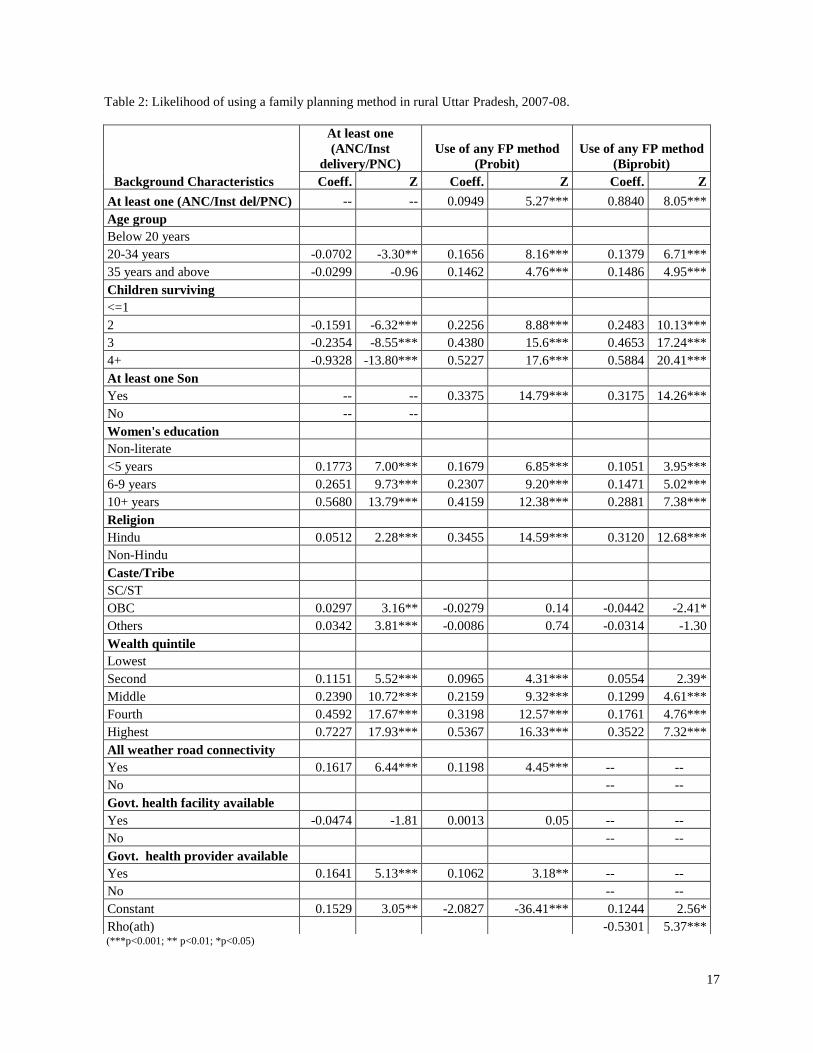
Table 2 presents results of three statistical models. In the first model, the dependent variable is
receiving at least one of the three maternal healthcare services and use of any contraceptive
method in the second. In the third model, two dependent variables are taken, first is use of any
contraceptive method and the second is receiving at least one maternal health care service.
The first model shows that women who were below age of 20 years produce positive coefficients
i.e. higher likelihood to receive at least one of the three maternal healthcare services than their
older counterparts. Similarly, women with two or more surviving children had show statistically
significant and lower chances of receiving any of these services as compared to women who had
one or no surviving child. As expected, women who possessed 10 or more years of education had

9
higher propensity to receive at least one maternal health care service than those who were less or
uneducated women. Women's religious and caste/tribe faith also had significant influence on the
likelihood or propensity to receive at least one of such services. Hindu women show positive and
statistically significant coefficient for receiving such a service as compared to Muslim
counterparts. Women from OBCs or other castes had positive association with receiving the
propensity for one of these services. This analysis shows that upward movement of women's
household in wealth quintile increases significantly the probability of getting at least one of the
maternal healthcare services. Similar to cross-tabulation, it also shows that there is a positive and
significant association between receiving such a service and women living in villages with all
weather roads or in villages where at least one public health provider is available.
The model in the second panel of the Table 2 shows the coefficients and Z-scores produced
maximum-likelihood for using a family planning method by background characteristics. The
second model clearly predicts positive and statistically significant likelihood to use a family
planning for those women who received at least one maternal healthcare service in case of their
last birth than those who did not receive it. Women age and number of children surviving are
positive associated with the likelihood of using a family planning method. Likelihood to use a
contraceptive method is found to be higher and statistically significant for those women who had
least one son as compared to those who did not. More the years of schooling a woman possess,
the higher is the likelihood to use a contraceptive method. Caste/tribe of women do not show any
influence on likelihood of using a contraceptive method. Likelihood of using a contraceptive
method for Hindu women is found to be higher and statistically significant than Muslim women.
Women from upper quintiles of household's wealth index have produced higher and statistically
significant likelihood to use a contraceptive method than women from lower level of quintiles.
Women living in villages connected with all weather roads and villages where at least one health
provider is available have higher and statistically significant likelihood to adopt a family
planning method after a live birth.
The third model shown in the last panel of the Table 2 shows the result obtained from the biprobit
statistical technique. The model produces the significant value for Rho. It means problem of
endogeneity influences the impact of receiving at least one of the maternal healthcare services on

10
likelihood of using a contraceptive method. The biprobit has taken care of it and produce the
results over here without such influences. By observing the coefficients of receiving at least one
maternal healthcare service in panel 2 and panel 3, one can conclude that effects of MH services
on contraceptive use would have been underestimated without considering endogeneity problem.
In addition, it could have inflated the influence of some background variables or deflated the
others'. For example, likelihood of using a family planning method has increased across all the
categories of number of surviving children and education. In contrast, it has decreased across
household wealth quintiles. The influence i.e. likelihood of women having at least one son on
contraceptive remain more or less similar in both the panels. Slight reduction has also been seen
in likelihood of women belonging to Hindu religion. It should be kept in mind that the effects of
community variables are not shown here but these have been controlled in the third model too.
Effects of community characteristics and intensity of MCH services on utilization of FP
services
MCH intensity and use of modern contraceptive methods
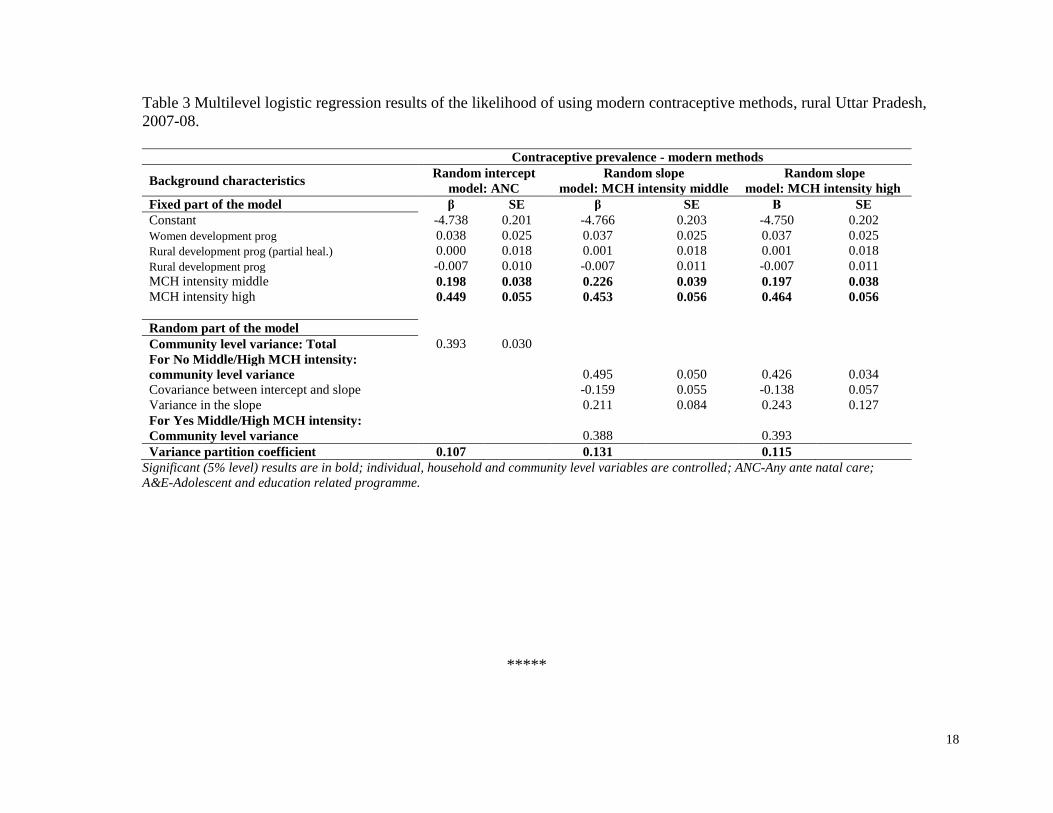
Table 3 shows the association between the intensity of MCH and use of modern contraceptive
method. Here, the effects of community level effects on modern contraceptive method by
adjusting for the differences in MCH service utilization across communities. After controlling
individual and community level predictors, effects of intensity of MCH are statistically
significant on the likelihood of using modern contraceptive methods in the model. Allowing for
community level variation, women who had middle level intensity of MCH (β=0.198, SE=.038),
and who had higher level intensity of MCH (β=0.449, SE=.055) are more likely to utilize the
modern contraceptive methods than the women who had lower level intensity of MCH. At all
levels of intensity of MCH services, the residual variation attributable to differences across
communities varies somewhere from 11 percent to 13 percent.
The random slope model of intensity of MCH describes level of intensity that the log-odds of
using modern contraceptives are 0.226 higher for women who were at the middle than who were
at lower level of intensity of MCH. The effects of middle level of MCH intensity on using
modern contraceptive method varied significantly across community, and the estimated

11
community level variance in modern contraceptive methods are 0.495 for lower level of MCH
intensity and 0.388 for who were at the middle level of intensity. The random slope model of
higher level of MCH intensity describes that the log-odds of using modern contraceptives are
0.464 the higher for women who are at the higher levels of using MCH intensity compared to the
lower of using MCH intensity.
Discussion and Conclusion:
The analysis indicates that women from poor socioeconomic background are less likely to receive
even at least one of the three necessary maternal healthcare services. One can imagine what will
be the status if one considers all recommended services. It also indicates that there is a huge
dropout from one maternal healthcare service to the subsequent in rural Uttar Pradesh. Women's
educational status and household wealth index have generated highest likelihood in receiving at
least of the aforementioned service. The connectivity of villages with all weather roads and
availability of public health provider in village have the next set of variable that produced high
likelihood of women to receive such services. Only 29 percent of currently women who have
given birth since January 1, 2004 were using a method of family planning. Once we consider
modern method of family planning it reduces to 18 percent. This much lower level of modern
contraceptive method use makes women vulnerable to get pregnant again. Of which most of the
pregnancy will be unwanted, untimed and unplanned in rural Uttar Pradesh.
It is surprising to observe that women who had more surviving number of children are less likely
to receive such services. The whole approach of synergy between MCH and FP services was
based on the hypothesis that women once meet with health providers on the occasion of receiving
MCH services may easily get convinced for using family planning methods. However, those who
(higher parity women) require most to use family planning to avoid/delay children do not access
these services. It is also interesting to see that developmental programmes as whole do have an
independent impact on utilization of maternal health care services. For example, all weather roads
connectivity to villages is found to significant across all three models. It means that the local
administration should have wider approach and understanding of such linkages. However,
experiences in planning suggest that these have always been water tight compartments (health
and rural development) till the recent decade. Findings show that mere availability of health

12
facility cannot promote the utilization of such services unless they are manned by qualified and
trained health professionals. Facilities also must be equipped and free from frequent and acute
shortage of drug and supply.
This analysis shows that receiving any maternal healthcare services makes improvements in the
use of family planning methods. However, independent effects of social, economic and
demographic factors remain crucial in use of family planning methods. In understanding the
impact of MCH on use of family planning services, one should use an appropriate statistical
technique such as PSM or structural equation modeling. Using simple logistic, probit or OLS
regression techniques may misrepresent the contribution of factors affecting because of the
presence of self-section bias or endogeneity.
It indicates that propensity to use a modern family planning method gets diminished when a
woman lives among lower proportion of MCH services receivers' community, or the opposite to
it may also be found true. This analysis shows that role of community level variables is not so
high (only 11-13 percent). A diffusion of knowledge and care received might have reduced the
effects of community level variations. The contribution of unobserved factors remains a big
challenge to any of such analyses. It is also possible that large-scale sample surveys like DLHS
or DHS may not have micro level information that becomes critical in explaining the low level of
utilization of MCH/FP services. Therefore, quantitative and qualitative aspects of programme
executions are important to take into account before making recommendations to programme
managers. There may be various reasons behind low level of use of maternal healthcare services.
For example, Figure 2 clearly shows that almost 42 percent of women reported that they did not
receive any antenatal care services because either it was not necessary or not customary. Thus,
programme managers need to segregate non-programme and programme factors responsible for
low level of utilization of maternal healthcare services. Accordingly they are required to modify
the programme strategies for better programme outcomes. It is clear from the analysis that
appropriate strategies to improve knowledge and awareness about the importance of such service
are urgently needed in rural Uttar Pradesh. They must be provisioned especially to socially and
economically disadvantaged women.
13
References:
Briggs C.J., P. Capdegelle and P. Garner. 2001. “Strategies for integrating primary health services in
middle and low income countries: Effects on performance, costs and patient outcomes,” Cochrane
Database of Systematic Reviews 4: CD003318.
Hotchkiss, D.R., R.J. Magnani, , J.J. Rous, M. Azelmat, , T.A. Morz, and J. Heikel. 1999. “The effects of
maternal-child health services utilization on subsequent contraceptive use in Morocco,” Journal of
Biosocial Sciences 31(2): 145-165.
Huntington D. and A. Aplogan. 1994. “The integration of family planning and childhood immunization
services in Togo,” Studies in Family Planning 25(3): 176-183.
Hutchinson P. and Jennifer W. 2006. "Advanced methods for evaluating the impact of family planning
communication programs: evidence from Tanzania and Nepal, Studies in Family Planning, Vol.
37. No. 3, pp. 169-186.
Levitt C, E. Shaw, S. Wong, J. Kaczorowski, R. Springate, J. Sellors and M. Enkin. 2004. “Systematic
review of the literature on postpartum care: selected contraception methods, postpartum
Papanicolaou test, and rubella immunization,” Birth 31(3):203-212.
Rosenbaum, Paul R. and Donald B. Rubin. 1983. "The Central role of the propensity score in
observational studies for causal effects." Biometrika 70(1): 41-55.
Seiber, E.E., D.R. Hotchkiss, J.J. Rous, and A.A. Berruti. 2005. “Maternal and child health and family
planning service utilization in Guatemala: Implications for service integration,” Social Science &
Medicine 61: 279-291.
Taylor, C.E., R.S.S. Sharma, R.L. Parker, W.A. Reinke and R. Faruqee. 1983. Child and Maternal Health
Services in Rural India, the Narangwal Experiment: Integrated Family Planning and Health
Care. Vol.2. The Johns Hopkins University Press, Baltimore.
World Health Organization (WHO). 2004. Reproductive health strategy to accelerate progress towards
the attainment of international development goals and targets. Geneva: WHO.
Zerai A. and A.O. Tusi. 2001. “The relationship between prenatal care and subsequent modern
contraceptive use in Bolivia, Egypt and Thailand,” African Journal of Reproductive Health
5(2):68-82.

14
Figure 1 Diagrammatic presentation of currently married women aged 15-44 years who received ANC, institutional delivery, post natal
care and contraceptive use, rural Uttar Pradesh, 2007-08.
CPR Modern-Contraceptive prevalence rate (modern methods), CPR Any-Contraceptive prevalence rate (any methods).

15
Figure 2 Reasons for not receiving any antenatal care service in rural Uttar Pradesh, 2007-08.
no
1%
Not necessary
37%
not coustomary
7%
cost too much
10% no transport
8%
poor quality service
2%
family did not allow
6%
lack of knowledge
21%
no time to go
6%
others
2%
16
Table 1 Proportion of women using any family method by status of those who received at least
one maternal health services or not by selected background characteristics, rural Uttar Pradesh,
2007-08.
Background At least one (ANC/Inst
delivery/PNC)
CPR Any
Method
None of
ANC/Inst
delivery/PNC
CPR Any
Method
Characteristics % % % %
Age group
Below 20 years 76.8 23.5 23.2 16.9
20-34 years 71.7 36.7 28.3 31.0
35 years and above 61.2 35.5 38.8 31.3
Children surviving
<=1 81.5 19.7 18.5 12.0
2 77.0 30.4 23.0 20.2
3 72.8 37.6 27.2 28.3
4+ 63.5 36.9 36.5 32.8
At least one Son
Yes 78.3 34.3 28.9 29.1
No 71.1 18.9 21.7 11.0
Women's education
Non-literate 66.6 27.3 33.4 24.3
<5 years 77.7 32.1 22.3 31.6
6-9 years 83.4 35.3 16.4 34.6
10+ years 92.9 44.1 7.1 39.6
Religion
Hindu 73.0 32.4 27.0 28.3
Non-Hindu 70.0 23.1 30.0 16.5
Caste/Tribe
SC/ST 67.9 29.7 32.1 27.9
OBC 72.4 30.0 27.6 25.4
Others 79.5 35.5 20.5 26.7
Wealth quintile
Lowest 61.5 24.7 38.5 21.6
Second 67.8 26.7 32.2 26.0
Middle 73.9 30.9 26.1 29.2
Fourth 83.1 34.1 16.9 33.5
Highest 91.9 44.9 8.1 41.4
Village connected by all weather road
Yes 73.5 31.5 26.5 27.3
No 64.0 26.1 36.0 19.7
Availability of health facility in village
Yes 71.4 31.2 28.6 26.3
No 72.7 29.1 27.3 25.8
Availability of Govt health provider in village
Yes 73.1 31.2 26.9 26.9
No 65.0 27.2 35.0 19.3
Total 72.5 31.0 27.5 26.3
17
Table 2: Likelihood of using a family planning method in rural Uttar Pradesh, 2007-08.
(***p<0.001; ** p<0.01; *p<0.05)
Background Characteristics
At least one
(ANC/Inst
delivery/PNC)
Use of any FP method
(Probit)
Use of any FP method
(Biprobit)
Coeff. Z Coeff. Z Coeff. Z
At least one (ANC/Inst del/PNC) -- -- 0.0949 5.27*** 0.8840 8.05***
Age group
Below 20 years
20-34 years -0.0702 -3.30** 0.1656 8.16*** 0.1379 6.71***
35 years and above -0.0299 -0.96 0.1462 4.76*** 0.1486 4.95***
Children surviving
<=1
2 -0.1591 -6.32*** 0.2256 8.88*** 0.2483 10.13***
3 -0.2354 -8.55*** 0.4380 15.6*** 0.4653 17.24***
4+ -0.9328 -13.80*** 0.5227 17.6*** 0.5884 20.41***
At least one Son
Yes -- -- 0.3375 14.79*** 0.3175 14.26***
No -- --
Women's education
Non-literate
<5 years 0.1773 7.00*** 0.1679 6.85*** 0.1051 3.95***
6-9 years 0.2651 9.73*** 0.2307 9.20*** 0.1471 5.02***
10+ years 0.5680 13.79*** 0.4159 12.38*** 0.2881 7.38***
Religion
Hindu 0.0512 2.28*** 0.3455 14.59*** 0.3120 12.68***
Non-Hindu
Caste/Tribe
SC/ST
OBC 0.0297 3.16** -0.0279 0.14 -0.0442 -2.41*
Others 0.0342 3.81*** -0.0086 0.74 -0.0314 -1.30
Wealth quintile
Lowest
Second 0.1151 5.52*** 0.0965 4.31*** 0.0554 2.39*
Middle 0.2390 10.72*** 0.2159 9.32*** 0.1299 4.61***
Fourth 0.4592 17.67*** 0.3198 12.57*** 0.1761 4.76***
Highest 0.7227 17.93*** 0.5367 16.33*** 0.3522 7.32***
All weather road connectivity
Yes 0.1617 6.44*** 0.1198 4.45*** -- --
No -- --
Govt. health facility available
Yes -0.0474 -1.81 0.0013 0.05 -- --
No -- --
Govt. health provider available
Yes 0.1641 5.13*** 0.1062 3.18** -- --
No -- --
Constant 0.1529 3.05** -2.0827 -36.41*** 0.1244 2.56*
Rho(ath) -0.5301 5.37***
18
Table 3 Multilevel logistic regression results of the likelihood of using modern contraceptive methods, rural Uttar Pradesh,
2007-08.
Contraceptive prevalence - modern methods
Background characteristics Random intercept
model: ANC
Random slope
model: MCH intensity middle
Random slope
model: MCH intensity high
Fixed part of the model β SE β SE Β SE
Constant -4.738 0.201 -4.766 0.203 -4.750 0.202
Women development prog 0.038 0.025 0.037 0.025 0.037 0.025
Rural development prog (partial heal.) 0.000 0.018 0.001 0.018 0.001 0.018
Rural development prog -0.007 0.010 -0.007 0.011 -0.007 0.011
MCH intensity middle 0.198 0.038 0.226 0.039 0.197 0.038
MCH intensity high 0.449 0.055 0.453 0.056 0.464 0.056
Random part of the model
Community level variance: Total 0.393 0.030
For No Middle/High MCH intensity:
community level variance
0.495 0.050 0.426 0.034
Covariance between intercept and slope
-0.159 0.055 -0.138 0.057
Variance in the slope
0.211 0.084 0.243 0.127
For Yes Middle/High MCH intensity:
Community level variance
0.388
0.393
Variance partition coefficient 0.107
0.131
0.115
Significant (5% level) results are in bold; individual, household and community level variables are controlled; ANC-Any ante natal care;
A&E-Adolescent and education related programme.
*****