Abstract - iussp.org
12
Abstract The Effects of Meteorological Factors on Mortality: Evidence from Two Health and Demographic Surveillance Sites in Bangladesh, 1983-2009 Nurul Alam 1 , Wietze Lindeboom 1,2 , Dilruba Begum 1 , and Peter Kim Streatfield 1\ 1 Centre for Population, Urbanization and Climate Change, icddr,b, Dhaka, Bangladesh; 2 Cardialysis, Rotterdam, the Netherlands Corresponding author: Nurul Alam, Email:[email protected], +8880-2-8810719 Context: Bangladesh is divided into seven distinct climatic zones. The effect of climate on mortality can be different in different zones. This study aims to assess the weather-mortality relationships in two climatic zones. Methods: Health and demographic surveillance sites (HDSS) maintained by icddr,b in Matlab and Abhoynagar in two climatic zones provided data on daily counts of death and population at risk for the period 1983 to 2009. Weather data on daily temperature and rainfall and cyclones for the same period were obtained from nearby weather stations of the Bangladesh Metrological Department. Time series Poisson regression with cubic spline functions, was used allowing for over dispersion and lagged effects of weather and extreme weather events on mortality, controlling for time trends and seasonal patterns. Analysis was carried out using R statistical software. Findings and conclusions: Both temperature and rainfall showed strong seasonal patterns, explaining a significant part of mortality in both sites. Abhoynagar with more extreme in temperature exhibited stronger cold temperature-mortality relationship than Matlab. Abhoynagar with less rainfall exhibited the rainfall-mortality association, which was not the case with Matlab. The weather-mortality relationships by age, sex and broad cause were also examined to identify vulnerable groups and areas.
Transcript of Abstract - iussp.org

Abstract
The Effects of Meteorological Factors on Mortality: Evidence from Two Health and Demographic
Surveillance Sites in Bangladesh, 1983-2009
Nurul Alam1, Wietze Lindeboom
1,2, Dilruba Begum
1, and Peter Kim Streatfield
1\
1Centre for Population, Urbanization and Climate Change, icddr,b, Dhaka, Bangladesh;
2Cardialysis, Rotterdam, the Netherlands
Corresponding author: Nurul Alam, Email:[email protected], +8880-2-8810719
Context: Bangladesh is divided into seven distinct climatic zones. The effect of climate on
mortality can be different in different zones. This study aims to assess the weather-mortality
relationships in two climatic zones.
Methods: Health and demographic surveillance sites (HDSS) maintained by icddr,b in Matlab
and Abhoynagar in two climatic zones provided data on daily counts of death and population at
risk for the period 1983 to 2009. Weather data on daily temperature and rainfall and cyclones for
the same period were obtained from nearby weather stations of the Bangladesh Metrological
Department. Time series Poisson regression with cubic spline functions, was used allowing for
over dispersion and lagged effects of weather and extreme weather events on mortality,
controlling for time trends and seasonal patterns. Analysis was carried out using R statistical
software.
Findings and conclusions: Both temperature and rainfall showed strong seasonal patterns,
explaining a significant part of mortality in both sites. Abhoynagar with more extreme in
temperature exhibited stronger cold temperature-mortality relationship than Matlab. Abhoynagar
with less rainfall exhibited the rainfall-mortality association, which was not the case with Matlab.
The weather-mortality relationships by age, sex and broad cause were also examined to identify
vulnerable groups and areas.
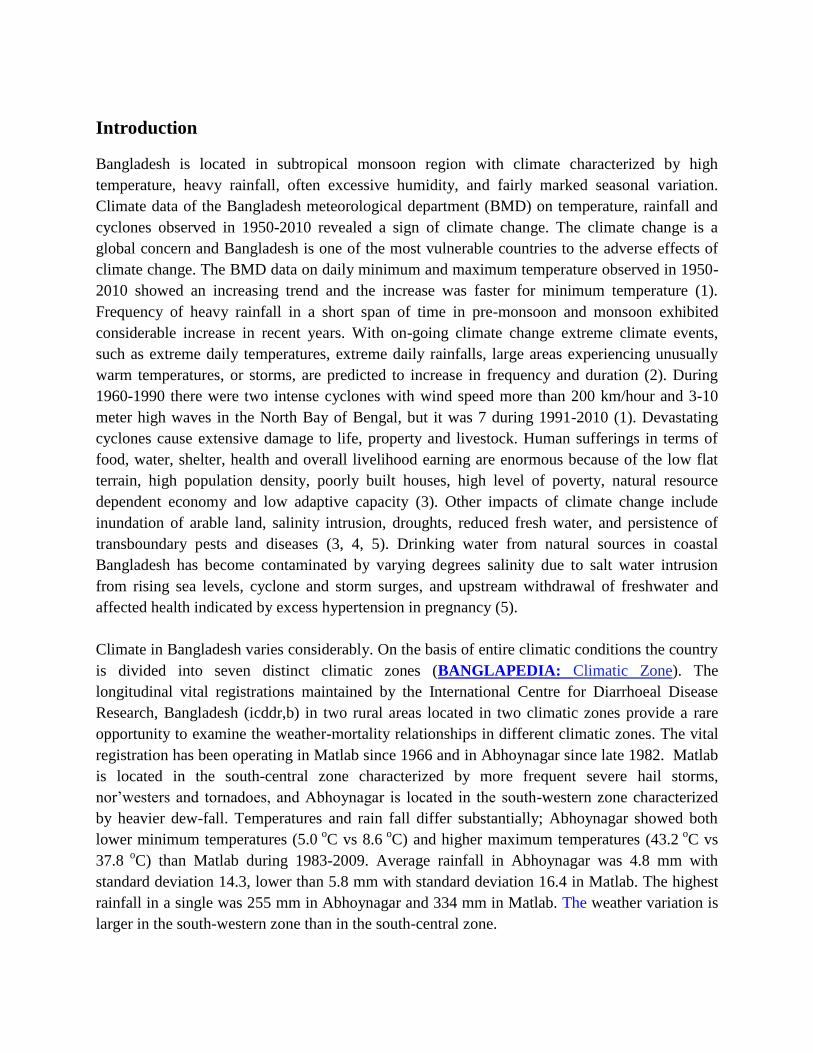
Introduction
Bangladesh is located in subtropical monsoon region with climate characterized by high
temperature, heavy rainfall, often excessive humidity, and fairly marked seasonal variation.
Climate data of the Bangladesh meteorological department (BMD) on temperature, rainfall and
cyclones observed in 1950-2010 revealed a sign of climate change. The climate change is a
global concern and Bangladesh is one of the most vulnerable countries to the adverse effects of
climate change. The BMD data on daily minimum and maximum temperature observed in 1950-
2010 showed an increasing trend and the increase was faster for minimum temperature (1).
Frequency of heavy rainfall in a short span of time in pre-monsoon and monsoon exhibited
considerable increase in recent years. With on-going climate change extreme climate events,
such as extreme daily temperatures, extreme daily rainfalls, large areas experiencing unusually
warm temperatures, or storms, are predicted to increase in frequency and duration (2). During
1960-1990 there were two intense cyclones with wind speed more than 200 km/hour and 3-10
meter high waves in the North Bay of Bengal, but it was 7 during 1991-2010 (1). Devastating
cyclones cause extensive damage to life, property and livestock. Human sufferings in terms of
food, water, shelter, health and overall livelihood earning are enormous because of the low flat
terrain, high population density, poorly built houses, high level of poverty, natural resource
dependent economy and low adaptive capacity (3). Other impacts of climate change include
inundation of arable land, salinity intrusion, droughts, reduced fresh water, and persistence of
transboundary pests and diseases (3, 4, 5). Drinking water from natural sources in coastal
Bangladesh has become contaminated by varying degrees salinity due to salt water intrusion
from rising sea levels, cyclone and storm surges, and upstream withdrawal of freshwater and
affected health indicated by excess hypertension in pregnancy (5).
Climate in Bangladesh varies considerably. On the basis of entire climatic conditions the country
is divided into seven distinct climatic zones (BANGLAPEDIA: Climatic Zone). The
longitudinal vital registrations maintained by the International Centre for Diarrhoeal Disease
Research, Bangladesh (icddr,b) in two rural areas located in two climatic zones provide a rare
opportunity to examine the weather-mortality relationships in different climatic zones. The vital
registration has been operating in Matlab since 1966 and in Abhoynagar since late 1982. Matlab
is located in the south-central zone characterized by more frequent severe hail storms,
nor’westers and tornadoes, and Abhoynagar is located in the south-western zone characterized
by heavier dew-fall. Temperatures and rain fall differ substantially; Abhoynagar showed both
lower minimum temperatures (5.0 o
C vs 8.6 o
C) and higher maximum temperatures (43.2 o
C vs
37.8 o
C) than Matlab during 1983-2009. Average rainfall in Abhoynagar was 4.8 mm with
standard deviation 14.3, lower than 5.8 mm with standard deviation 16.4 in Matlab. The highest
rainfall in a single was 255 mm in Abhoynagar and 334 mm in Matlab. The weather variation is
larger in the south-western zone than in the south-central zone.

With respect to temperature, Abhoynagar is more extreme than Matlab. The extent of variation in
weather conditions may influence the strength of the weather-mortality association. The studies
in Europe showed the more the temperature variation the lower was the temperature-mortality
relationship. In a multi-country ecological comparison higher excess mortality rates were found
in less severe, milder winter climates where, all else equal, there should be less potential for cold
strain and cold related mortality (6, 7). The ecological study design cannot prove causality. The
present study overcomes this limitation by linking individual’s survival to weather condition.
One study examined seasonal patterns of deaths in Matlab, Bangladesh and another study
reported that daily mortality increased with low temperatures in the preceding weeks and no
association between high temperature and daily mortality during 1994-2002 (8, 9). These studies
were limited to the association between temperature and mortality, excluding rainfall in the
south-central zone. The present study will examine the temperature- and rainfall-mortality
relationships in Matlab and Abhoynagar to exhibit differences in the relationships.
Objectives: The objectives of this study are to investigate the effects of temperature and rainfall
on mortality in different age and sex and cause groups in Matlab and Abhoynagar and to
compare the effects between the two areas in two distinct climatic zones.
Methods and Data
This study used counts of death and population at risk in Matlab and Abhoynagar sub-districts
and weather data from nearby weather stations of the Bangladesh Metrological Department. Both
the areas are predominantly rural, located in Chittagong and Khulna divisions in the south central
and southwest of Bangladesh (10). The health and demographic surveillance system (HDSS)
maintained by the International Centre for Diarrhoeal Disease Research, Bangladesh (icddr,b) in
Matlab, recorded vital events; births, deaths and migrations since 1966 and marriage and marital
disruptions from 1975 visiting households monthly till 2000 and bimonthly thereafter. A sample
vital registration system (SVRS) was set up by icddr,b there in late 1982 for conducting
operations research in family planning and child heath. SVRS covered 122 villages in 7 out of 17
unions selected randomly since late 1982 and another 32 villages in 2 unions since early 1984. A
household listing operation was carried out in selected villages to prepare the sampling frame.
The systematic random sampling was used to select every sixth household in sampled villages
for preparing a socio-demographic profile of the households for surveillance. Trained Field
Research Assistants visited sampled households in three monthly rounds to record vital events;
births, deaths, migrations and marriages and marital disruptions. Two Field Research Supervisors
supervised their data collection activities in the field on a regular basis. Collected vital events
were edited for consistencies and added to the longitudinal relational database.
Bangladesh Meteorological Department (BMD) is responsible for observation, recording and
archiving of climate data for various stations in the country. BMD continuously uses weather
data for monitoring time trends. We retrieved daily maximum and minimum temperature and

rainfall from Chandpur weather station, located 10 km from Matlab town; and Jessore weather
station, located 30 km from Abhoynagar town for 1983-2009. Daily temperature or rainfall, if
missing, was replaced by the estimate derived from the linear interpolation. Mean temperature
was calculated as the average of minimum and maximum temperature of the day.
Statistical Analysis: The association between daily temperature (minimum, maximum and
mean), rainfall and mortality in Matlab was examined using graphs followed by generalized
additive Poisson regression models with cubic spline functions, allowing for over dispersion,
using the following general formula:
Y = b0+s(season/trend,df=162)+s(temperature,df=10)+s(rainfall,df=10)
During 1983-2009 the Abhoynagar SVRS recorded 4850. Week rather than day was chosen as
unit of analysis to minimize fluctuations due to small number. The associations of the average
weekly temperature (minimum, maximum and mean) and average weekly rainfall with weekly
count of death were examined using graphics followed by generalized additive Possion
regression models with cubic spline functions, allowing for over dispersion, and using the
following general formula:
Y = b0+s(season/trend,df=108)+s(temperature,df=10)+s(rainfall,df=10)
Models were fitted to the average of weekly mean temperature, weekly mean rainfall and count
of deaths of the week and to mean temperature up to three weeks (lag 0-3) and rainfall up to four
weeks prior to the week of death (lag 0-4) to assess the effects of low or high temperature or low
or high rainfall over longer periods. Combined time trend and seasonal pattern were included
with 4 un-penalized degrees of freedom for seasonal pattern and 1 un-penalized degree of
freedom, for trend, per year. The exposure-response to meteorological factors was penalized
allowing a maximum of 10 degrees of freedom.
Results
During the 9,862 days of observation, equivalent to 27 years, 48,238 deaths were registered in
Matlab HDSS area, which was on average 4.9 deaths per day, with a peak of 59 deaths registered
on the 19th
of February 2005, due to a launch (large commuter boat to carry passengers) accident.
Infants (23.3 percent) and elderly (42.3 percent), defined as age 60 and above, account for over
65 percent of all deaths. During the observation period the population increased from 190,183 on
the first day 1983 to 225,002 on the last day, i.e. December 31st, 2009. Between January 1st 1983
and December 31st 2009 the lowest minimum temperature observed was 8.6 oC and the highest
maximum was 37.8oC, with mean temperatures ranging from 13.1
oC to 32.6
oC. Average daily
rainfall was 5.8 mm with a peak rainfall of 334 mm. in a single day. In Matlab, and Bangladesh
in general, 3 seasons can be distinguished; a calendar starts and ends with a winter season
(November to February), with a mean temperature ± standard deviation of 21.6 o
C ± 2.8, and
0.6mm ± 5.4 daily rainfall. The hot and dry season runs from March to May, with a mean
temperature of 27.9 o
C ± 2.1 and an average daily rainfall 5.2 mm. ± 15.1. The middle of a

calendar year is characterized by hot and humid weather, temperatures range from 22.9 o
C to
32.6 o
C, with a mean of 28.9 o
C ± 1.3 and an average daily rainfall of 11.6 mm. ± 22.0. Between
1983 and 2009 Bangladesh was 14 times hit by major cyclones; the centre of the last two major
cyclones, reported in 2007 and 2009, did not pass through the Matlab research area.
During the observation period of 27 years (or 1409 weeks) the population of the Abhoynagar
surveillance site increased from 21,547 during the first week of 1983 to 34,774 during the last
week of 2009. During this period SVRS registered an average of 3.4 deaths per week. Infants
accounted for 26 percent of all deaths and elderly (aged 60 years and above) for 44 percent,
totaling 70 percent. During this period the lowest weekly minimum temperature observed was
14.3 oC and the highest weekly maximum temperature was 34.3
oC. Average daily rainfall was
4.8 mm with a peak of 255 mm.
Weekly temperature showed a seasonal pattern, with peak in April-May and the lowest at the
beginning and the end of the calendar year (Figure 1 panel a). Overall, temperature and rainfall
are positively correlated (r=0.09, p-value <0.01), however during the rainy season (June-
September) rainfall has a moderating effect on temperature (r=-0.49, p-value <0.001).
Figure 1a: Annual patterns of temperature in Abhoynagar, 1983-2009
(a) Weekly temperature and rainfall
1520
2530
3515
2025
3035
Tem
pera
ture
(in
Deg
rees
Cel
sius
)
020
4060
8010
0
Rai
nfal
l (in
mm
.)
0 50
Year in Weeks
Mortality showed a U-shape pattern, with larger number of deaths at the beginning and the end
of the year (Figure 1 panel b). Seasonal pattern was less marked in Matlab than in Abhoynagar,
where temperature variation was larger and average rainfall was less during 1983-2009.
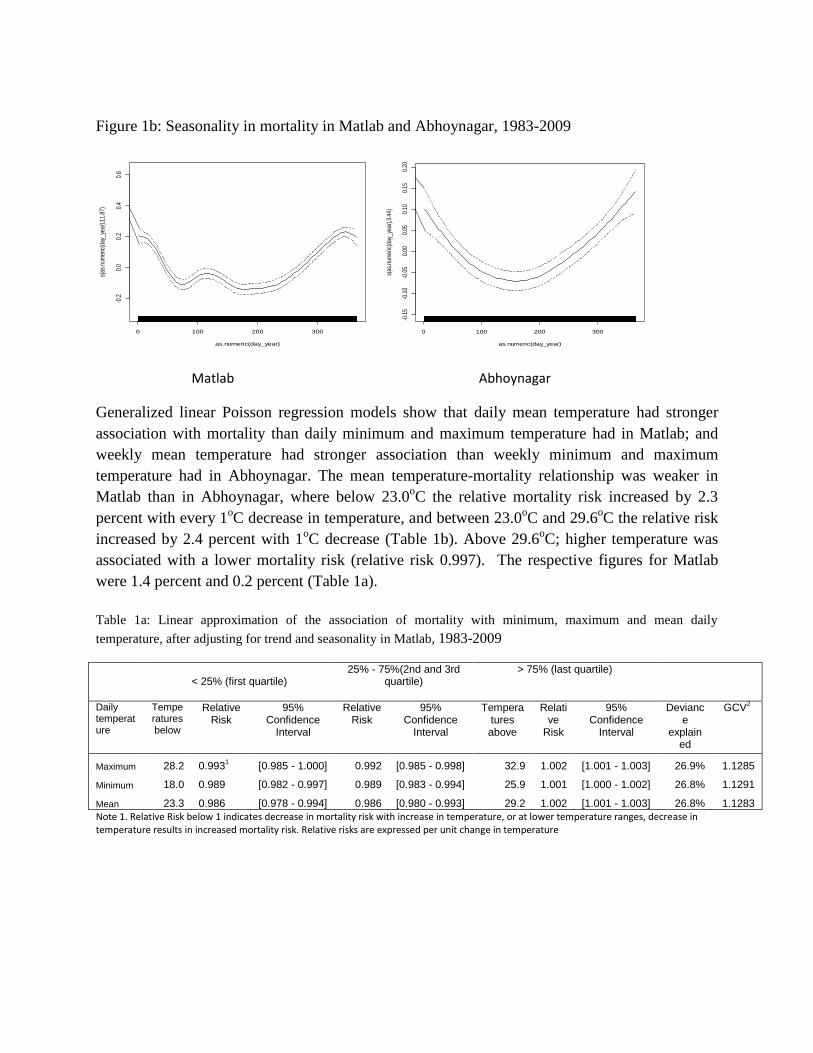
Figure 1b: Seasonality in mortality in Matlab and Abhoynagar, 1983-2009
0 100 200 300
-0.2
0.0
0.2
0.4
0.6
as.numeric(day_year)
s(as
.num
eric
(day
_yea
r),11
.87)
0 100 200 300
-0.1
5-0
.10
-0.0
50.
000.
050.
100.
150.
20
as.numeric(day_year)
s(as
.num
eric
(day
_yea
r),3
.44)
Matlab Abhoynagar
Generalized linear Poisson regression models show that daily mean temperature had stronger
association with mortality than daily minimum and maximum temperature had in Matlab; and
weekly mean temperature had stronger association than weekly minimum and maximum
temperature had in Abhoynagar. The mean temperature-mortality relationship was weaker in
Matlab than in Abhoynagar, where below 23.0oC the relative mortality risk increased by 2.3
percent with every 1oC decrease in temperature, and between 23.0
oC and 29.6
oC the relative risk
increased by 2.4 percent with 1oC decrease (Table 1b). Above 29.6
oC; higher temperature was
associated with a lower mortality risk (relative risk 0.997). The respective figures for Matlab
were 1.4 percent and 0.2 percent (Table 1a).
Table 1a: Linear approximation of the association of mortality with minimum, maximum and mean daily
temperature, after adjusting for trend and seasonality in Matlab, 1983-2009
< 25% (first quartile) 25% - 75%(2nd and 3rd
quartile) > 75% (last quartile)
Daily temperature
Temperatures below
Relative Risk
95% Confidence
Interval
Relative Risk
95% Confidence
Interval
Temperatures above
Relative
Risk
95% Confidence
Interval
Deviance
explained
GCV2
Maximum 28.2 0.9931
[0.985 - 1.000] 0.992 [0.985 - 0.998] 32.9 1.002 [1.001 - 1.003] 26.9% 1.1285
Minimum 18.0 0.989 [0.982 - 0.997] 0.989 [0.983 - 0.994] 25.9 1.001 [1.000 - 1.002] 26.8% 1.1291
Mean 23.3 0.986 [0.978 - 0.994] 0.986 [0.980 - 0.993] 29.2 1.002 [1.001 - 1.003] 26.8% 1.1283
Note 1. Relative Risk below 1 indicates decrease in mortality risk with increase in temperature, or at lower temperature ranges, decrease in temperature results in increased mortality risk. Relative risks are expressed per unit change in temperature

Table 1b: Linear approximation of the association of mortality with minimum, maximum and mean
weekly temperature, after adjusting for trend and seasonality in Abhoynagar, 1983-2009
Temperat
ure in o C
< 25% (first quartile) 25% - 75%
(2nd and 3rd quartile) > 75% (last quartile)
Tem1 < RR2 95% CI 3 RR 95% CI Tem> RR 95% CI % DE 4 GCV5
Maximum 29.6 0.982 [0.959 - 1.005] 0.978 [0.959 - 0.997] 34.0 1.001 [0.998 - 1.004] 13.70% 1.1838
Minimum 16.1 0.978* [0.959 - 0.997] 0.978*** [0.968 - 0.989] 25.7 1.003 [0.999 - 1.006] 13.30% 1.1892
Mean 23.0 0.977* [0.956 - 0.999] 0.976** [0.961 - 0.991] 29.6 0.977* [0.974 - 0.980] 13.60% 1.1858
1Temperature, 2Relative risk, 3Confidence interval, 4Deviance explained, 5Geometric coefficient of variation. *P<0.05, **P<0.01, ***P< 0.001
To capture the short term temperature effect at higher temperatures and the longer term effect of
increased mortality at lower temperatures simultaneously, Lag 0 and Lag 1-5 mean temperatures
were used to assess the association between temperature and mortality in different sex and age
categories in Matlab (Table 2a). In general, the stratified models showed a positive association
between mortality and temperature, whereas the lag1-5 models demonstrate a negative
association between temperature increase and mortality.
Weekly mean temperature was included in the models to assess the temperature-mortality
associations over different time lags in Abhoynagar (Table 2b).. The average temperature over a
two-week period (temperature in the week of occurrence of death and during the preceding
week) has the strongest association with weekly mortality. Lag 0-1 temperature was used to
assess the temperature-mortality associations by sex and age groups. Linear approximations of
the associations of lag 0-1 mean temperature with mortality were statistically significant across
temperatures; below 25th
percentile and between 25th
and 75th
percentiles in both areas.
Disaggregation of the temperature-mortality association by sex and age reveals sex and age
differences in the temperature effect between these areas (Table 2a & b). A detailed study would
be needed for understanding the difference in the temperature-mortality relationship.
Table 2a. Linear approximation of the association of mortality with combined lag0 and lag1-5 day mean temperature for different strata, after
adjusting for trend and seasonality in Matlab, 1983-2009
25 percentile 25-75 percentile 75 percentile
Sub groups Relative Risk 95% CI Relative Risk 95% CI Relative Risk 95% CI
Male 0.968 [0.949 - 0.987] 0.971 [0.954 - 0.988] 1.002 [1.000 - 1.004]
Female 0.978 [0.957 - 0.998] 0.977 [0.959 - 0.995] 1.002 [0.999 - 1.004]
Age groups

Infants 0.976 [0.948 - 1.005] 0.977 [0.952 - 1.003] 1.002 [0.998 - 1.005]
1-4 1.029 [0.989 - 1.070] 1.029 [0.995 - 1.066] 1.004 [1.000 - 1.009]
5-19 1.036 [0.982 - 1.092] 1.037 [0.989 - 1.087] 0.998 [0.992 - 1.004]
20-59 0.984 [0.952 - 1.016] 0.983 [0.956 - 1.012] 1.000 [0.996 - 1.004]
60 + 0.946 [0.926 - 0.965] 0.947 [0.930 - 0.964] 1.002 [0.999 - 1.004]
Table 2b: Associations of lag 0-1 week mean temperature and mortality for different sex and age groups,
after adjusting for trend and seasonality in Abhoynagar, 1983-2009
Sex and
age group < 25% (first quartile)
25% - 75%
(2nd and 3rd quartile) > 75% (last quartile)
RR1 95% CI 2 RR 95% CI RR 95% CI % DE 3 GCV5
Overall 0.975* [0.954 - 0.997] 0.976** [0.960 - 0.992] 0.999 [0.996 - 1.002] 13.60% 0.1694
Male 0.995 [0.964 - 1.026] 0.990 [0.968 - 1.012] 0.997 [0.993 - 1.002] 6.02% 1.1757
Female 0.957** [0.927 - 0.988] 0.962** [0.941 - 0.985] 1.000 [0.995 - 1.004] 9.27% 1.2252
Age group
Infant 0.965 [0.893 - 1.042] 0.991 [0.938 - 1.047] 1.001 [0.992 - 1.011] 10.40% 0.6085
1-4 0.965 [0.893 - 1.042] 0.991 [0.938 - 1.047] 1.001 [0.992 - 1.011] 10.40% 0.6085
5-19 1.090* [1.007 - 1.181] 1.076* [1.016 - 1.139] 0.998 [0.989 - 1.007] 13.60% 1.1858
20-59 0.937** [0.894 - 0.983] 0.952** [0.920 - 0.985] 1.002 [0.996 - 1.009] 3.61% 1.1054
60+ 0.990 [0.957 - 1.023] 0.980 [0.957 - 1.004] 0.997 [0.992 - 1.002] 4.85% 1.2109 1Temperature, 2Relative risk, 3Confidence interval, 4Deviance explained, 5Geometric coefficient of variation. *P<0.05, **P<0.01, ***P< 0.001
In addition to the temperature, rainfall amount and the rainfall-mortality association showed
spatial variations. Rainfall was more in Matlab (with daily mean of 5.8 mm and standard
deviation 16.4) than in Abhoynagar (with daily mean of 4.8 mm and standard deviation 14.3).
Abhoynagar with less variation in rainfall showed the stronger rainfall-mortality relationship
than Matlab with more rainfall variation. The spatial differences in the effects of temperature and
rainfall on all-cause mortality suggest that variations in temperature and rainfall rather than their
levels determine the temperature and rainfall-mortality relationships (Table 3a and b).
Gender disaggregated models showed a reduction in female mortality risks below 14 mm of
average rainfall with every 1 mm increase in rainfall and increased mortality risks of both males
and females (p<0.05) at rainfall levels over 14 mm (Figure 6 and Table 3). The rainfall-mortality
associations also depend on age of the individuals. The association for the age group 5-19 years
was opposite the associations for the age groups 20-59 and 60+ years. Mortality risks of the
adults (aged 20-59 years) and elderly decreased with every 1 mm increase in rainfall below 14
mm, and increased above 14 mm rainfall.

Table 3a. Linear approximation of the association of mortality with rainfall for different strata, after adjusting for
time trend and seasonality in Matlab, 1983-2009
Rainfall below 3 mm. Rainfall between 3 and 100 mm. Rainfall above 100 mm.
Sub groups Relative Risk 95% CI Relative Risk 95% CI Relative
Risk 95% CI
Male 0.987 [0.948 - 1.027] 0.999 [0.997 - 1.000] 1.002 [1.000 - 1.003]
Female 1.000 [1.000 - 1.000] 1.000 [1.000 - 1.001] 1.000 [1.000 - 1.001]
Age groups
Infants 0.987 [0.929 - 1.049] 0.999 [0.997 - 1.000] 1.002 [0.999 - 1.004]
1-4 1.017 [0.944 - 1.095] 0.998 [0.996 - 1.000] 1.001 [0.999 - 1.004]
5-19 0.944 [0.850 - 1.050] 0.997 [0.994 - 1.000] 1.006 [1.002 - 1.009]
20-59 0.967 [0.906 - 1.033] 0.998 [0.996 - 1.000] 1.002 [0.999 - 1.005]
60 + 1.001 [0.999 - 1.002] 1.000 [0.999 - 1.001] 1.002 [0.998 - 1.005]
Table 3b: Associations of mortality with lag 0-4 rainfall for sex and age groups, after adjusting for trend
and seasonality in Abhoynagar, 1983-2009
Rainfall < 3 mm Rainfall 3 – 14 mm Rainfall > 14 mm
Sub group RR1 95% CI 2 RR 95% CI RR 95% CI % DE 3 GCV4
Overall
Male
0.930***
0.982
[0.883 - 0.979]
[0.918 - 1.051]
0.983***
0.991
[0.973 – 0.993]
[0.979 - 1.002]
1.012*
1.012•
[1.001 - 1.022]
[0.998 - 1.025]
17.20%
5.04%
1.2075
1.1925
Female 0.860*** [0.799 - 0.926] 0.972*** [0.961 - 0.984] 1.014• [0.999 - 1.029] 8.19% 1.2288
Age group
Infant 0.957 [0.866 - 1.057] 0.986 [0.969 - 1.004] 1.010 [0.990 - 1.030] 16.0% 1.2438
1-4 1.038 [0.882 - 1.221] 1.022 [0.995 - 1.050] 1.038 [1.007 - 1.069] 13.0% 0.61279
5-19 1.157• [0.996 - 1.343] 1.040** [1.013 - 1.068] 0.977 [0.948 - 1.006] 8.65% 0.68735
20-59 0.895* [0.804 - 0.997] 0.978* [0.960 - 0.996] 1.020• [0.999 - 1.041] 1.75% 1.1068
60+ 0.880** [0.815 - 0.950] 0.970*** [0.958 - 0.983] 1.017* [1.002 - 1.033] 4.14% 1.2463
1Relative risk, 2Confidence interval, 3Deviance explained, 4Geometric coefficient of variation. •P<0.1, *P<0.05, **P<0.01, ***P< 0.001
Discussion
This study showed a significant increase in overall mortality at lower temperature in both areas
and the increase in mortality was less marked in Matlab than Abhoynagar (11). As these two
areas are located in different climatic zones the difference in the temperature-mortality
relationships between areas may be due to difference in climate than other health related factors.
The stronger effect of cold temperature in Abhoynagar could be due to more frequent extreme

temperature despite weather acclimatization or adaptation to cool weather. Common adaptive
measures against more temperature variation at micro-level are housing and clothing. Available
data on the quality of housing revealed that more houses in Abhoynagar have wall and roof with
cement/concrete than in Matlab. In 2008 in Abhoynagar, 30% of the houses are roofed and 41%
are walled with cement/concrete compared to 2% houses are roofed and 4% are walled with
cement/concrete in Matlab in 2005 (10, 12). In winter, the indoor temperature in houses roofed
and walled with tin or straw is as cool as the outdoor temperature. Cold temperature
accompanied by chill and fogs makes people sick as many do not have cold-protective measures
during the night. However, data on winter clothes at household level are not available in either
area.
Abhoynagar is more extreme in temperature variation than Matlab, where mortality was less
responsive to lower temperature, suggesting that the more the temperature variation the higher is
the temperature-mortality risk at lower temperature. The finding is opposite to the finding of the
studies in Europe that countries with the mildest winter climates exhibited the highest excess
winter mortality (6, 7). Available data on cross country thermal efficiency standards in housing
indicate that those countries with poorest housing demonstrated the highest excess winter
mortality; and poorest housing was more common in countries with mildest winter climate.
While the low temperature-mortality relationship was evident for males and females in Matlab, it
was evident for females only in Abhoynagar. Why males in Abhoynagar were not affected by
low temperature is unknown. Rainfall in Matlab area showed an overall weak association with
mortality, but in Abhoynagar, every 1 mm increase in rainfall up to 14 mm showed a reduction
in mortality risk, and every 1 mm increase in rainfall above 14 mm increased mortality. Such
differences in the effects of the temperature and rainfall on mortality in different sex and age
groups between the two areas are of surprise. Some of the differences may owe to the small
sample in Abhoynagar. Data on daily weather and count of death were turned into weekly
weather and count of deaths to fit the statistical model. Another limitation is the distance from
the study area to the nearest weather station, at 30 km away from Abhoynagar and 10 km from
Matlab. Despite the limitations, the spatial difference in the effects of temperature and rainfall
reveal the importance of studying local adaptation and acclimatization process for better
understanding the community responses to weather variation and the weather-mortality
relationship.
Acknowledgement
This study used daily weather data from a nearby weather station of the metrological department
of the government of Bangladesh and the mortality data of the Abhoynagar health and
demographic surveillance system of icddr,b, which is supported by core donors for its operation
and research. Abhoynagar HDSS was supported by the USAID under the Cooperative

Agreement No. 388 A 00 97 00032 00 with the icddr,b. Current donors providing unrestricted
support to icddr,b include: Australian International Development Agency (AusAID),
Government of the People’s Republic of Bangladesh, Canadian International Development
Agency (CIDA), Swedish International Development Cooperation Agency (Sida), and the
Department for International Development, UK (DFID). We gratefully acknowledge these
donors for their support and commitment to the icddr,b’s research efforts.
We acknowledge the dedicated work of field staff in Abhoynagar and supporting staff in Dhaka,
icddr,b. This research was supported by the INDEPTH Network. We thank Joacim Rocklov,
Yazoume Ye, Rainer Sauerborn, Sari Kovats, David Hondula and Martin Bangha who facilitated
at INDEPTH workshops in Nouna, Burkina Faso and Accra, Ghana.
References
1. Habib Anjumand. Climate Change: Bangladesh Perspective. Bangladesh Meteorological
Department, Dhaka, Bangladesh. Available in www.dccc.iisc.ernet.in/22July2011-
Policy/Arjumand-Habib.doc, accessed on 6 June 2012.
2. IPCC, 2007: Climate Change 2007: The Physical Science Basis. Contribution of Working
Group I to the Fourth Assessment Report of the Intergovernmental Panel on Climate Change
[Solomon S, D Qin, M Manning, Z Chen, M Marquis, K B Averyt, M Tignor and H L Miller
(eds.)]. Cambridge University Press, Cambridge, United Kingdom and New York, NY, USA.
3. Policy Study on the Probable Impacts of Climate Change on Poverty and Economic Growth
and the Options of Coping with Adverse Effect of Climate Change in Bangladesh. Support to
Monitoring PRS and MDGs in Bangladesh, General Economics Division, Planning Commission,
Government of the People’s Republic of Bangladesh & UNDP Bangladesh 2009.
4. McMichael, A.J., D.H. Campbell-Lendrum, C.F. Corvalan, K.L. Ebi, A.K. Githeko, J.D.
Scherage & A. Woodward (Eds.), Climate Change and Human Health, WHO, Geneva, 2003, 322
pp.
5. Khan A E, Ireson A, Kovats S, Mojumder S K, Khusru A, Rahman A, Vineis P. Drinking
Water Salinity and Maternal Health in Coastal Bangladesh: Implications of Climate Change.
Environ Health Perspect 2011; 119(9): doi:10.1289/ehp.1002804.
6. Healy J D. Excess winter mortality in Europe: a cross country analysis identifying key risk
factors. Journal of Epidemiology and Community Health 2003; 57:784-78.

7. The Eurowinter Group. Cold exposure and winter mortality from ischaemic heart disease,
cerebrovascular disease, respiratory disease, and all causes in warm and cold regions of Europe.
Lancet 1997; 349: 1341–46.
8. Becker S, Weng S. Seasonal patterns of deaths in Matlab, Bangladesh. International Journal of
Epidemiology1998; 27:814-823.
9. Hashizume M, Wagatsuma Y, Hayashi T, Saha S K, Streatfield P K. The effect of
temperature on mortality in rural Bangladesh – a population-based time-series study.
International Journal of Epidemiology 2009, 38:1689-1697.
10. Lindeboom W, Das S C, Ashraf A. Health and Demographic Surveillance Report 2009-
Abhoynagar and Mirsarai. Scientific Report No.115, ICDDR,B, Dhaka, Bangladesh 2011.
11. Lindeboom W, Alam N, Begum D, Streatfield P K. Effects of meteorological factors on
mortality in rural Bangladesh, 1983-2009 (published manuscript submitted to Global Health
Action).
12. ICDDR,B 2007. Health and Demographic Surveillance System-Matlab, v.38. 2005 Socio-
Economic Census. Dhaka, Bangladesh.
13. Borse N N, Hyder A A, Streatfield P K, Arifeen S E and Bishai D. Childhood drowning and
traditional rescue measures: case study from Matlab, Bangladesh. Downloaded from
adc.bmj.com on July 3, 2012 - Published by group.bmj.com
14. Arifeen S E, Tasnima A, Chowdhury H R, Rahman K M, Chowdhury E K, Alam N, Haque D M E Baqui A H (2004). Cause of death in children under-five years of age. In: Chapter 9, Bangladesh Demographic and Health Survey 2004. National Institute of Population Research and Training (NIPORT) and Mitra and Associates, Dhaka, Bangladesh and Macro International, Calverton, Maryland, USA.