Impact Evaluation Concept Note - gafspfund.org IE... · Impact Evaluation Concept Note ... IE...
29
1 Haiti Project for Technology Transfer to Farmers (PTTA) Impact Evaluation Concept Note Development Impact Evaluation (DIME) Development Economics Research Group (DECRG) The World Bank Developed in Conjunction with The Paris School of Economics, The Inter-American Development Bank, and The Haitian Ministry of Agriculture (MARNDR) 1 1 This concept note was prepared primarily by Daniel Stein (DIME, World Bank), Karen Macours (Paris School of Economics), Jeremie Gignoux (PSE), and Sebastien Gachot (PSE). It benefitted from extensive comments and discussion with Florence Kondylis (DIME), Bruno Jacquet (IDB), Lina Salazar (IDB), and the staff at MARNDR.
Transcript of Impact Evaluation Concept Note - gafspfund.org IE... · Impact Evaluation Concept Note ... IE...
1
Haiti Project for Technology Transfer to Farmers
(PTTA)
Impact Evaluation Concept Note
Development Impact Evaluation (DIME)
Development Economics Research Group (DECRG)
The World Bank
Developed in Conjunction with The Paris School of Economics, The Inter-American Development Bank, and The
Haitian Ministry of Agriculture (MARNDR)1
1 This concept note was prepared primarily by Daniel Stein (DIME, World Bank), Karen Macours (Paris School of
Economics), Jeremie Gignoux (PSE), and Sebastien Gachot (PSE). It benefitted from extensive comments and discussion with Florence Kondylis (DIME), Bruno Jacquet (IDB), Lina Salazar (IDB), and the staff at MARNDR.
2
Contents
List of Acronyms ............................................................................................................................................ 3
Introduction .................................................................................................................................................. 4
Overview ............................................................................................................................................... 4
Strategic Context ................................................................................................................................... 4
Implementation arrangements and capacity building .......................................................................... 5
Audience and Research Impact............................................................................................................. 5
Project Description........................................................................................................................................ 6
IE Motivation and Research Questions ......................................................................................................... 8
Theoretical background ............................................................................................................................ 8
Evaluation Questions .............................................................................................................................. 10
Evaluation Design ........................................................................................................................................ 11
Haitian Administrative structure ............................................................................................................. 11
IE Design .................................................................................................................................................. 11
Data ............................................................................................................................................................. 17
Power Calculations and Sampling ............................................................................................................... 19
Power calculations .................................................................................................................................. 19
Individual Sampling ................................................................................................................................. 22
Threats to Internal and External Validity .................................................................................................... 23
Budget ......................................................................................................................................................... 24
Data collection quantitative household surveys ..................................................................................... 24
Costs for complementary qualitative survey, field coordinator, and travel ........................................... 24
Timeline....................................................................................................................................................... 26
APPENDIX: Descriptions of Subsidies .......................................................................................................... 27
3
List of Acronyms
AFD – Agence Francais de Developpement
DECRG – Development Economics Research Group of the World Bank
DIME – Development Impact Evaluation
GAFSP – The Global Agricultural and Food Security Program
ICC – Intra-cluster Correlation
IDB -- Inter-American Development Bank
IE – Impact Evaluation
MARNDR – Ministry of Agriculture and Rural Development (Ministère de l'Agriculture des Ressources Naturelles et du Développement Rural)
MDES – minimum detectable effect size
NGO – Non-governmental Organization
OPS - Operateurs de Service (Service Operators)
PIU – Project Implementation Unit
PSE – Paris School of Economics
PTTA – Project for Technology Transfer to Farmers (Project de Transfert de Technologie aux Petits Agriculteurs)
RESEPAG - Relaunching Agriculture: Strengthening of Agricultural Public Services Project
SC – Section Communale
4
Introduction
This Concept Note presents the impact evaluation (IE) work lead by the Development Impact Evaluation
(DIME) team of the World Bank on the Project for Technology Transfer to Small Farmers (PTTA) project
in Haiti under its collaboration with the Global Agriculture and Food Security Program (GAFSP). The PTTA
project receives funding from the Global Agricultural and Food Security Program (GAFSP) and the Inter-
American Development Bank (IDB) and is supervised by the IDB. This evaluation has been developed
jointly by DIME, the Paris School of Economics (PSE), IDB, and the Haitian Ministry of Agriculture
(MARNDR).
Overview
The PTTA project uses an innovative system of “smart subsidies” (for fertilizer, seeds, labor, etc.) to
assist farmers in adopting new agricultural technologies. Under this scheme, a farmer is eligible to
receive subsidies for only a single season; the theory is that a single infusion of all necessary inputs for a
technology will result in sustainable improved yields through continued usage of technology. The
sustainability should from increased supply of inputs, improved knowledge about their benefits, and the
income effects from the first harvest. The impact evaluation will test this “big push” theory for
agricultural inputs by carefully measuring the effects of the subsidies both in the short and medium
term. The evaluation will separate the short-term effects of the extensive assets provided by the project
from the medium term effects caused by learning, improved supply of agricultural inputs, and capital
accumulation.
The focus of the IE will be to measure how the project affects the key project and GAFSP outcomes:
agricultural productivity, food security, and income. The causal effects of the program will be identified
using a randomized phase-in of beneficiaries; farmers who are eligible for the program but not selected
for inclusion the first year will serve as a control group for those who receive project benefits initially.
The IE will gather data after each growing season to understand both the short and medium term effects
of the project, and will provide timely, actionable evidence to donors and the government of Haiti on
the value of PTTA’s smart subsidies approach.
Strategic Context
Haiti is the poorest country in Latin America, and 3/4 of low-income households work in the agricultural
sector. According to the Haitian National Strategy for Economic Growth and Poverty Reduction,
Agriculture is the country’s main pillar of economic growth. But currently, most Haitian farms operate at
5
low productivity, with little to no use of improved inputs or cultivation techniques. Low-productivity
agriculture is closely tied to food security challenges: 30% of Haitian children suffer from chronic
malnutrition, and 50% of women are anemic. The Global Agriculture and Food Security Program (GAFSP)
is supporting two projects in Haiti designed by Haïti’s Ministry of Agriculture (Ministère de l'Agriculture
des Ressources Naturelles et du Développement Rural, MARNDR). Both projects promote new
agricultural technology to farmers, with the goal of increasing yields and improving food security. This
impact evaluation (IE) will focus on the Project for Technology Transfer to Farmers (PTTA), which is
designed to increase farmers’ income by increasing access to improved agricultural technologies.2
Implementation arrangements and capacity building
This impact evaluation has been designed through close collaboration of a number of partners: The
World Bank (DIME), the Paris School of Economics (PSE), the IDB, and MARDNR.
The core research team (composed of members of DIME and PSE) has been working in partnership with
operational and program management staff from both MARNDR and the IDB from the inception of this
IE. The team attended a first capacity building workshop in Dakar, Senegal (April 2011) where it received
training on IE methods and was matched with a research team. The design of the IE was then
consolidated during follow-up missions (December 2011) and during DIME’s capacity building workshop
in Naivasha, Kenya (April 2012). Team members then traveled to Haiti and adapted the design to the
capacity and needs on the ground.
In order to retain continuity between the research and operational teams, the MARNDR and IDB teams
have been supported by a full-time DIME/PSE field coordinator based in Port-au-Prince.3 The role of the
field coordinator is to oversee day-to-day IE activities and ensure full communication across the various
entities (research, operations and management).
Future IE missions will be organized around main dissemination dates and ahead of season planning to
ensure the absorption of the analytical findings into the operational schedule.
Audience and Research Impact
The direct audience for this IE and its outputs consists of the MARNDR implementation unit and the IDB
operations team. Each of these actors will be involved in the implementation and supervision of the IE.
The objective is that, as the project is implemented, each partner becomes an informed consumer of IE.
2 The complementary project (RESEPAG II) is also under consideration for an impact evaluation.
3 A field coordinator worked in Port-au-Prince from April-June 2012, and from Feb 2013-present.
6
MARNR and the IDB have expressed interest in scaling up “smart subsidies” should they prove to be
effective. The present impact evaluation will provide rigorous evidence as to whether and how this
approach should be expanded. It will also more generally be used by the IDB and other development
partners (World Bank, AFD, etc) to inform the policy dialogue regarding agricultural subsidy
mechanisms.
In addition to delivering evidence on key operational questions, this IE contributes to a large, global
research agenda on aid effectiveness in agriculture (DIME-aadapt), which counts over 30 participating
projects in more than 20 countries. The Haiti IE team will produce high-quality research papers for
presentation at research BBLs (e.g. DECRG/ DIME and PSE seminar series), workshops, and international
development conferences. The findings will be published in the DIME working paper series and
submitted to peer-reviewed economics and field journals, thus reaching a wide audience of researchers
and graduate students worldwide. All data will be made available online on the databank for IE,
following the Bank’s open data policy.
Representatives from MARNDR and the Bank operations team have taken part in two capacity building
and dissemination events of the aadapt community so far (Dakar, 2011; Naivasha, 2012), and will
continue to share the results and experience from the ongoing IE work in future events, thus reaching a
wide audience of policymakers worldwide.
Project Description
The PTTA project hopes to move 30,000 households from subsistence farming to more intensive
agriculture though the provision of targeted subsidies for specific agricultural technologies. Each
participant in the program will gain access to a “Technological Package”, consisting of set of inputs and
services for a specific value chain. The packages vary by value chain, but include items such as improved
seeds, fertilizer, labor, agrochemicals, training and extension services. Participants will receive physical
vouchers for the components of the technological package, which can be redeemed at local vendors.
The percentage of total technology adoption costs that will be covered by the subsidies averages around
75%. More details of the subsidy packages are given in the Appendix.
In its initial phases, PTTA will start working in 10 communes (second-largest administrative unit), and will
offer subsidies for five value chains: coffee, cocoa, rice, sweet potato, and yam. It will also have a
separate package based around distribution of “motopumps,” a small-scale irrigation technology. Due
7
to constraints to be explained later, the IE of PTTA will concentrate on the subsidies for the value chains
of sweet potato and rice.
PTTA is managed by MARDNR, and project activities will be implemented on the ground by consultancy
firms called “Operateurs de Service” (henceforth referred to as the “Operators”). The Operators will
identify the farmers who will receive the subsidies through the following process:
Operating an outreach campaign: This campaign will spread the word about the upcoming
registry and government project.
Creating a farmer registry: Farmers will be asked on a voluntary basis to sign up for the registry,
which should eventually cover nearly all farmers in the project areas. The registry will contain
basic information about what land people have and what crops they grow. High levels of
registration are expected due to the high value of the subsidies.4
Creating a registry of agricultural inputs and services providers
Determining program eligibility: From the registry, MARDNR will determine who is eligible for
the subsidies based on eligibility criteria set by the project. These eligibility criteria indicate that
in order to benefit from PTTA, a farmer must:
o Operate in the area selected for the project;
o Own a plot of at least 0.25 ha in which the project will be implemented;
o Be physically capable of performing all the necessary agricultural work;
o Be already producing the crop associated with the technologies he/she wants to benefit
from;
o Submit a formal request for the subsidies;
o Not have already benefited from any other technology transfer program implemented
by the MARNDR in the same area;
o Be ready to follow and comply with the technical operations specified for each subsidy;
4 In the similar RESEPAG I project, comparison to census data showed that the farmer registry reached nearly all
farmers in the region.
8
o Participate in training sessions and demonstrations on how to implement/use the
technologies correctly.
Enrolling eligible farmers: The operator will contact eligible farmers (through group meetings
and home visits) to sign them up for subsidies based on their eligibility.
Visits to verify eligibility: Operators will make a visit to the farm of each farmer who has signed
up for the project to ensure that they actually meet the criteria and take information about their
land holding and quality. Those who are determined to not be eligible will not receive the
subsidies.
Delivery of subsidy package. The subsidies take the form of vouchers (physical coupons) that
can be exchanged for goods and services from local service providers. If there are multiple
service providers in an area, farmers will choose which provider they want when the vouchers
are delivered.
The value of subsidies is not trivial: each package is worth roughly $1,130 USD; equal to about 150% of
Haiti’s GDP per capita. However, the project provides these inputs only once- in future seasons it
provides no services. This is communicated clearly to all farmers that participate.
IE Motivation and Research Questions
Theoretical background
In PTTA, a key element of the project design is that it provides service to farmers only for one season.
Rather than provide farmers with continued services over many years, the theory is that these subsidies
will provide such a large boost in knowledge and income that farmers will be able to continue cultivating
with these advanced methods for years to come. For the subsidy packages on which this evaluation will
focus, the project does not provide any durable goods. Instead, the hope is that farmers will use their
earnings from their first harvest to continue investing in intensive production.
This line of thinking has a long intellectual history in theories of “poverty traps” and the “big push”.5 This
theory states that poor people are stuck in poverty (a low level equilibrium) due to an amalgam of
5 Rostow, W. W. 1959. "The stages of economic growth." Economic Historic Review 12.
9
factors: low human capital, no access to credit, lack of productive assets, disease, climate stress etc.
Since all available income is used for consumption, people do not have the capacity to save and invest,
and are therefore stuck in a poverty trap, barred from higher income levels. 6 In theory, the only way to
remove people from this poverty trap is to subject them to a “big push” of inputs.7,8 This constitutes a
range of interventions all implemented at once, with the hope of simultaneously removing all the
mutually reinforcing constraints to growth and allowing income to increase. Although a “big push” is
generally used to mean interventions in many sectors at once, the concept can also be applied to a
comprehensive intervention in agriculture, as proposed by PTTA. By providing farmers with a set of
subsidies for different services, the PTTA program is designed to simultaneously remove the main
constraints to technology adoption (i.e. lack of access to credit, incomplete information and risk
aversion).
Importantly, this intellectual framework predicts that once this big push is applied, the beneficiary will
be put on a path of sustained growth, and continued interventions are unnecessary. In other words, one
big push is all that is necessary to get them out of the poverty trap. The PTTA design assumes that the
increased harvest from the first season, along with knowledge of the new production techniques, will be
enough to sustain continued usage of advanced production practices.
For PTTA to work as planned, two assumptions must be true. First, provision of the subsidies must
increase incomes in the season in which they are given. Next, these initial gains must result in increased
input usages (and therefore higher incomes) in following seasons.
There is relatively strong support in the literature for the first point: input subsidies correlate positively
with increased input usage and yields. For instance, the government of Malawi launched a program in
2006 that distributed vouchers for heavily subsidized fertilizer and seeds. The following 2006/2007
season saw increased input usage and yields nearly double the average of the previous five years, but it
is difficult to identify causal effects of the program due to the lack of a comparison group. 9 Bardhan and
6 Azariadis, Costas & Stachurski, John, 2005. "Poverty Traps," Handbook of Economic Growth, in: Philippe Aghion &
Steven Durlauf (ed.), Handbook of Economic Growth, edition 1, volume 1, chapter 5 Elsevier. 7 Rosenstein-Rodan, P. (1943): “The problem of industrialization of eastern and south-eastern Europe,” Economic
Journal, 53, 202–211 8 Kevin M. Murphy & Andrei Shleifer & Robert W. Vishny, 1988. "Industrialization and the Big Push," NBER
Working Papers 2708, National Bureau of Economic Research, Inc. 9 Denning G, Kabambe P, Sanchez P, Malik A, Flor R, et al. (2009) Input Subsidies to Improve Smallholder Maize
Productivity in Malawi: Toward an African Green Revolution. PLoS Biol 7(1): e1000023. doi:10.1371/journal.pbio.1000023
10
Mookherjee find large productivity effects of subsidized “minikits” (containing seeds, fertilizer, and
pesticides) in West Bengal, but their specification does not allow separation of short versus long-term
effects. 10
There is very little evidence on whether a short-term subsidy can provide lasting gains. One notable
exception is an evaluation of the Bangladeshi NGO BRAC’s Targeted Ultra-Poor program (TUP), which
provides rural poor women with capital (livestock) and training on livestock rearing. Bandiera et al show
that the program results in a large increase in earnings, and that this gain is sustained two years after
the program completes.11 However, the authors show that this is driven by changes in occupational
choice, making the causal mechanisms very different from what is expected from PTTA.
We do not know of any studies that attempt to measure the long or medium term effects of one-shot
subsidies in agriculture.
Evaluation Questions
This impact evaluation seeks to address this knowledge gap, which should provide insight on how to
efficiently design future agricultural projects in Haiti and other countries. Specifically, it will provide
answers to the following questions:
1. What is the effect of the smart subsidies provided by PTTA on yield, income, and food security in
the season that the packages are delivered?
2. To what extent does this big push result in lasting impact on income and productivity in
following seasons? Through what mechanisms does the short-term intervention provide
sustainable changes?
The first question tests the effectiveness of the subsidies in the short term, and measures the success of
the technology itself as well as the program’s ability to get farmers to adopt and use them correctly. The
second question tests whether these changes are sustainable. In other words, it tests the theory that
the “big push” of the technology packages is enough permanently move the farmers to a higher level of
agricultural production.
10
Bardhan, Pranab, and Dilip Mookherjee. 2011. "Subsidized Farm Input Programs and Agricultural Performance: A Farm-Level Analysis of West Bengal's Green Revolution, 1982-1995." American Economic Journal: Applied Economics, 3(4): 186-214. 11
Bandiera, O., Burgess, R., Das, N., Gulesci, S., Rasul, I., & Sulaiman, M. (2013). can basic entrepreneurship transform the economic lives of the poor? (No. 43). Suntory and Toyota International Centres for Economics and Related Disciplines, LSE.
11
Evaluation Design
Haitian Administrative structure
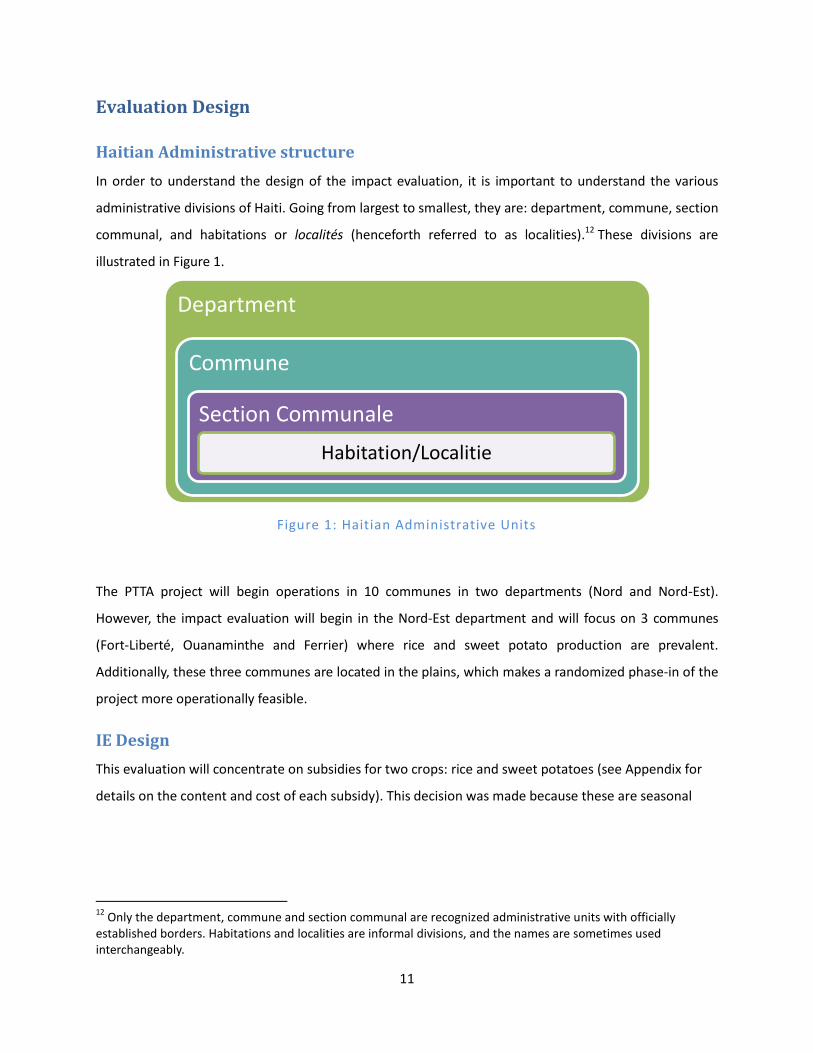
In order to understand the design of the impact evaluation, it is important to understand the various
administrative divisions of Haiti. Going from largest to smallest, they are: department, commune, section
communal, and habitations or localités (henceforth referred to as localities).12 These divisions are
illustrated in Figure 1.
Figure 1: Haitian Administrative Units
The PTTA project will begin operations in 10 communes in two departments (Nord and Nord-Est).
However, the impact evaluation will begin in the Nord-Est department and will focus on 3 communes
(Fort-Liberté, Ouanaminthe and Ferrier) where rice and sweet potato production are prevalent.
Additionally, these three communes are located in the plains, which makes a randomized phase-in of the
project more operationally feasible.
IE Design
This evaluation will concentrate on subsidies for two crops: rice and sweet potatoes (see Appendix for
details on the content and cost of each subsidy). This decision was made because these are seasonal
12
Only the department, commune and section communal are recognized administrative units with officially established borders. Habitations and localities are informal divisions, and the names are sometimes used interchangeably.
Department
Commune
Section Communale
Habitation/Localitie
12
crops where the effects of the packages will be immediately observable, allowing for accurate
measurement of short-term effects.13
The proposed design relies on the following key insights from discussions with the project team:
The program is fundamentally demand-driven. The Operators will work in project communities
to collect demand for the program and determine eligibility.
Given that the program is demand-driven, it will not be known which farmers are potential
beneficiaries until they sign up for the farmer registry. As applicants are likely to differ
systematically from those farmers that choose not to register a suitable comparison group must
be constructed within the set of farmers who register.
Both the short and medium-term effects of the program are of interest. Therefore, it is
important to have as long a time as possible between when the treatment and control groups
receive the subsidies.
Farmers may be dissatisfied if they have to wait to receive their subsidies while their friends and
neighbors registered at the same time are already receiving theirs. This could be a more severe
constraint for those who already submitted their demands for specific packages.
The impact evaluation is designed to measure both short and medium term effects of the project, while
respecting the fact that it is not acceptable for farmers who apply for subsidies to wait a long time to
receive them.
Based on these constraints, we propose using a randomized phase-in of voucher distribution at the
locality level. Within the evaluation area, a number of localities will be randomly phased in to the project
each season. Localities that have not yet phased in will serve as controls for those who have already
received subsidies. Data will be gathered each season to lower recall bias and increase power, thus
allowing for precise measurement of the overall short-term effect as well as documenting the trajectory
of the program effects over time.
The evaluation will proceed as follows:
1. Within the selected communes, the PTTA team chooses 3 sections communales in which to
13
Coffee and cocoa are perennial crops where effects of the packages will likely not been seen for years. Yams are grown in mountainous regions and have little geographical overlap with rice and sweet potato, so they were also excluded for logistical reasons.
13
begin project operations in the first season. (The choice will ideally be made such that roughly
4000 eligible farmers live in the selected sections communales. We will refer to these as the
“evaluation sections communales”.)
2. The OPS begins the registry in the evaluation sections communales.
3. Survey firm begins the baseline survey in all evaluation sections communales.
4. The OPS completes the registry in evaluation sections communales.
5. The OPS gives an estimate of the amount of demands it can fulfill before the next planting
season (this is the distribution target). It is expected to be between 500-1000 farmers.14
6. Baseline survey completes.
7. The project team organizes the registered farmers by the locality of residence reported in the
registry, then randomly selects localities until the amount of eligible farmers in the selected
localities sums up to the distribution target. The random selection will be done by MARNDR
staff, with the help of a computer program for the randomization provided by PSE/DIME team.15
8. In these randomly selected localities, the OPS will collect demands with the objective of
distributing subsidies before the first growing season.
9. In the randomly selected localities, the OPS distribute the physical vouchers and the first season
of subsidies is implemented.
10. The OPS gives an estimate of the amount of demands it can fulfill before the second planting
season (for both rice and sweet potato).
11. The project team randomly selects localities from the remaining list of localities until the amount
of eligible farmers in the randomly selected localities sums up to the distribution target following
a process similar to step 7.
12. First follow-up survey is conducted after the first growing season.
13. In the randomly selected localities, the OPS distribute the physical vouchers and the second
season of subsidies is implemented.
14. This process continues until all farmers are covered by the project.
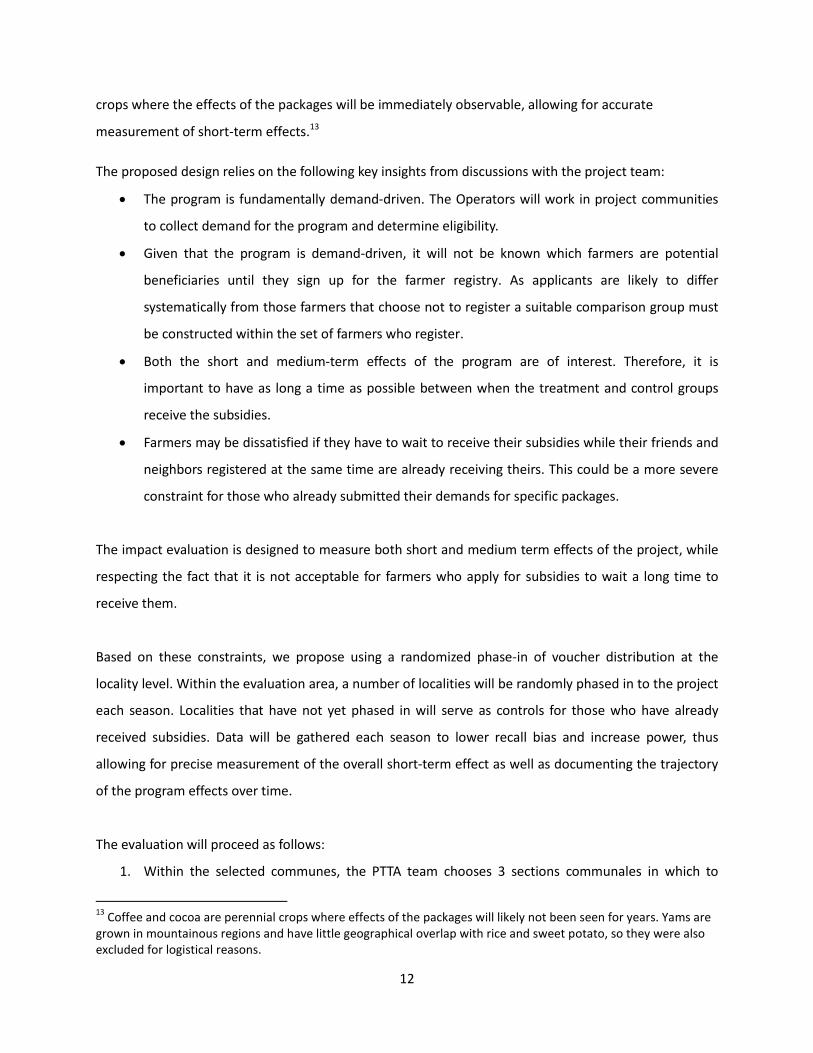
The basic evaluation design is given in Figure 2:
14
This estimate will not represent a restriction in the amount of people that can be served by the Operators. If they end up having more capacity than initially estimates and want to distribute more subsidies before the start of the growing season, additional localities will be randomly selected for inclusion in the first season. 15
The randomization will be stratified on SC, access to irrigation, and other relevant variables to be determined.
14
Figure 2: PTTA Evaluation Design
A survey will be conducted on all sampled farmers after each season of rice farming (there are two rice
seasons per year). This allows a measurement of how the program’s effects change in each season after
the intervention. Additionally, it results in higher power for the measurement of short-term effects. Due
to budgetary constraints, the number of survey rounds may be limited to four. In this case, surveys
would be undertaken prior to voucher distribution (the baseline) and, after the first two seasons of
voucher distribution, and again before the final season of voucher distribution.
Measurement of short-term (first season) effects
The identification of the short-term effects of the program will come from comparing the outcomes from
farmers who have just received the subsidies to those who have not yet received it. This measurement is
made directly after the harvest in which the inputs provided by the subsidies were used. For instance, in
the first season the measurement of short-term effects will come from comparing the Season 1
Treatment Group with the Season 1 Control Group. In the second season, it will come from comparing
the Season 2 Treatment Groups with the Season 2 control group. The short-term effects from each year
3 Sections communales Selected
for IE Participation
Localities receive subsidies in season 1 (Season 1 Treatment)
Localities don't receive subsidies in season 1
(Season 1 Control)
Localities Receive subsidies in season 2 (Season 2 Treatment)
Localities don't receive subsidies in season 2
(Season 2 Control)
Localities Receive subsidies in season 3 (Season 3 Treatment)
Localities don't receive subsidies in season 3
(Season 3 Control)
Continues until all
localities are served
15
will be pooled together in the analysis to increase power. As we have baseline data, use of a difference-
in-difference estimator will improve power over a simple difference.
Measurement of Medium-term effects
The identification of medium-term effects will come from comparing farmers who received the subsidies
in earlier seasons to those who have not received subsidies yet. For instance, the 2-season effects of the
program will come from comparing the Season 1 Treatment group with the Season 2 Control group. The
3-season effect will come from comparing the Season 1 Treatment group with the Season 3 control
group. The maximum length of effect that we will measure will depend on how many seasons it takes to
cover all the farmers in the evaluation sections communales. This is estimated to be 3-5 seasons.
Discussions of Rice versus Sweet Potato
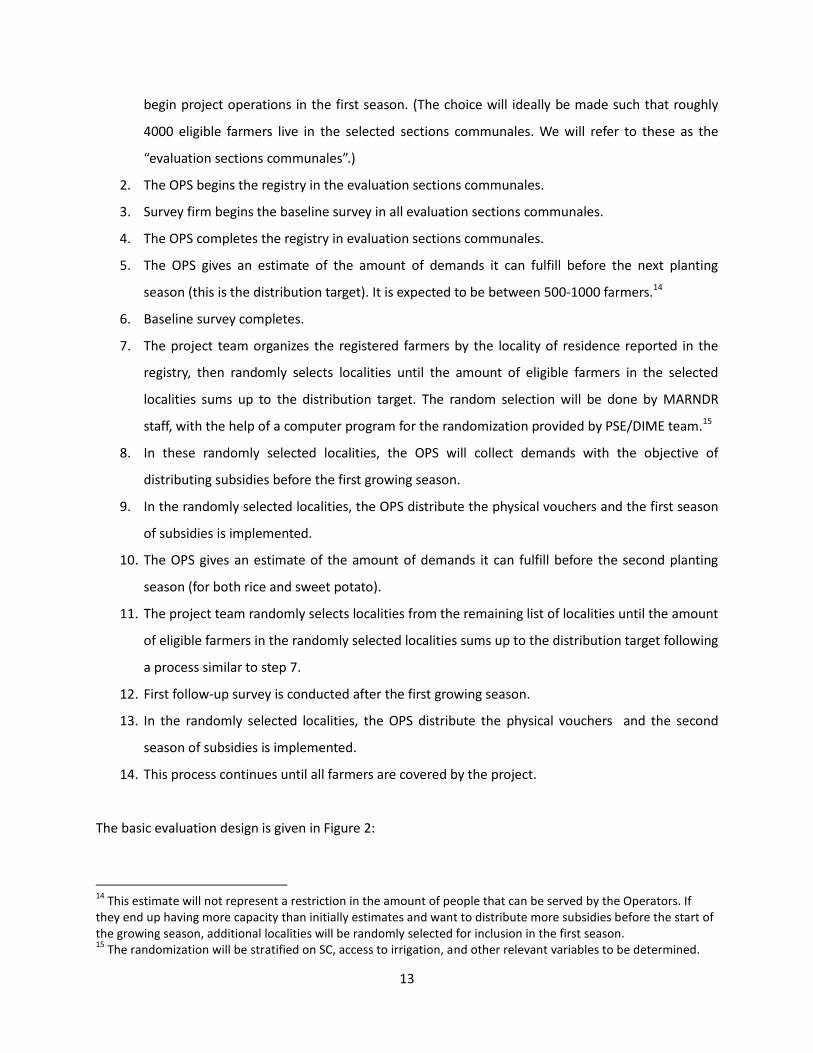
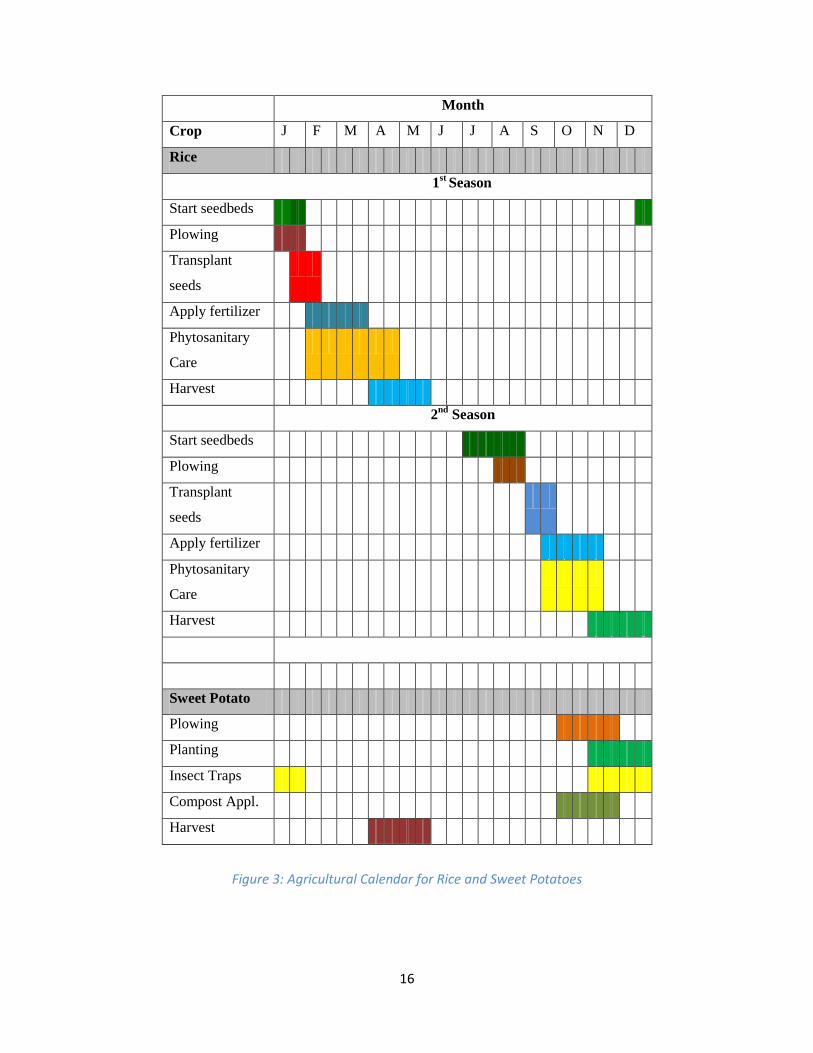
The evaluation is designed to closely measure the effects on rice yield, where there are two harvests per
year. In the case of sweet potato, there is only one harvest per year. The sweet potato harvest happens
at the same time as the first rice harvest of the year (April/May), meaning that surveys in the summer
will be able to detect effects of both crops. The survey round which will take place after the second
round of rice cultivation will be informative primarily about the rice farmers.
16
Month
Crop J F M A M J J A S O N D
Rice
1st
Season
Start seedbeds
Plowing
Transplant
seeds
Apply fertilizer
Phytosanitary
Care
Harvest
2nd
Season
Start seedbeds
Plowing
Transplant
seeds
Apply fertilizer
Phytosanitary
Care
Harvest
Sweet Potato
Plowing
Planting
Insect Traps
Compost Appl.
Harvest
Figure 3: Agricultural Calendar for Rice and Sweet Potatoes
17
Other Approaches Considered
The current design is has evolved over a series of discussions between the research and operations
teams, and attempts to strike a balance between addressing the most relevant questions, adapting to
the difficult operational realities in Haiti, and maintaining a high level of statistical rigor. A number of
alternative approaches were considered, with the primary ones described below.
Analysis of more value chains: The effects of the intervention in other value chains besides rice
and sweet potato are also of interest, but their omission from the impact evaluation was driven
by practical concerns. The operational team preferred that the randomized phase-in take place
in a restricted geographical area in order to minimize potential complications. Rice and sweet
potato are both grown in the plains, and are also much more likely to show short-term effects
than coffee and cocoa (which are grown in the mountains). Therefore the decision was made to
concentrate on just these two value chains.
Phase-in at individual or SC level (as opposed to habitation): Randomizing the phase-in of
subsidies at the individual level would have allowed for greater statistical power, and would
also avoid the problem of some localities being ill-defined. However, this approach was rejected
due to worries about intra-locality spillovers and tensions between neighbors. Randomizing at
the SC level would ease some operational challenges and also allow for analysis of longer-term
effects. But the overall number of SCs slated for beginning operations right away did not
provide sufficient statistical power.
Using famers outside of project area as a control group: The original PTTA project documents
proposed an impact evaluation plan that created a control group using individual matching of
farmers outside of the project area. This approach has the advantage that project operations
would not need to adapt the design of the impact evaluation. However, it has a couple of major
drawbacks. Even with adequate data, individual matching can create biased estimates due to
unobservable characteristics (e.g. other interventions, different trends in market or weather
conditions) which may affect project outcomes. In addition, in Haiti, there is no individual-level
data whatsoever that is available with which to create effective matches. (The suggested
agricultural census data cannot be released with individual identifiers.) Therefore, a census
would have to be undertaken for the purpose of matching, which would be prohibitively costly.
Data
The main source of data for this evaluation will be household surveys. The current plan calls for four
rounds of household surveys; though the exact amount will depend on the amount of time it takes the
project to distribute subsidies to all farmers in the evaluation sections communales.
1. Baseline Survey – After the registry is completed in the evaluation sections communales, but
before the first subsidies are distributed. This is expected to be August/September 2013.
2. First follow-up survey – After the first season of rice and sweet potato harvest, June 2014.
18
3. Second follow-up survey—After the second season of rice harvest, January 2015
4. Final survey—Conducted after the harvest before the final round of subsidies are distributed in
the selected SC (likely June 2015).
The survey will gather data on a number of key indicators. It will gather data on agricultural production
and input usage in order to calculate gross agricultural margins16, identified as the outcome indicator in
for Component 1 of the PTTA project in the IDB’s Grant Proposal. It will also measure other measures of
welfare, which may be affected by the PTTA project:
Income
Consumption
Labor supply
School enrollment
Access to extension services
Food consumption and security (using the Household Hunger Scale and Dietary Diversity Scale)
Housing quality
Ownership of livestock
Access to finance (credit and savings)
In order to minimize attrition rates, the follow-up questionnaire will be smaller than the one used for
the baseline and will focus on indicators/information that are expected to change across time as a
consequence of the project, such as gross agricultural margins.
It will also investigate the mechanisms underlying these impacts by measuring intermediate impacts,
such as increased and differential investments in agriculture, adoption of new cultivation and the post-
harvest technologies, farmer’s knowledge and ability.
The surveys will be conducted by a specialized survey firm, to be selected on a competitive basis.
16
Gross margin = gross income – input costs
19
Power Calculations and Sampling
Power calculations
As the exact roll-out schedule and number of localities in the evaluation frame is currently unknown, we
make some assumptions on the size of the evaluation frame and the speed of project roll-out to provide
indications of the power of the study. Our best current estimation (referred to as the “Scenario B”)
assumes that the project can start with a total of 200 localities, and about 4000 farmers eligible to
receive the subsidies. We also assume that they will phase in one quarter of localities each season,
meaning all eligible farmers will be served in 4 seasons (2 years). Given the uncertainty on the number
of localities covered and on the possibility to conduct the impact evaluation in a broader geographic
area, we also discuss two alternative scenarios with greater and fewer localities. The three scenarios
are:
Scenario A: The impact evaluation is conducted in only 100 localities.
Scenario B: The impact evaluation is conducted in 200 localities. (This scenario is considered as
the most likely given available information.)
Scenario C: The impact evaluation is conducted in a broader area comprising 400 localities.
Statistical power calculations were performed to establish the number of households needed in each
group and each survey round. The power calculations are based on the expected increases in rural
household income, both due to data availability and because it captures a primary final outcome.17 The
calculations assume an expected increase in rural household income of 30% in both the short and long
term (as predicted by project documentation), and were done with power of 0.80 and for 5%
significance level.18 An increase in household income of 30% corresponds to a standardized effect size of
.21.
Estimates of the mean (2792 Gd), standard deviation (4017 Gd), and intra-cluster correlation (ICC, 0.139)
of income in the 2 departments covered by the PTTA were obtained from the most recent household
17
The available data on agricultural productivity is of notably lower quality. 18
The project document indicates an expected increase of profits for the selected crops of 30%. Given that farmers are likely to have other crops however, we might expect overall increase of agricultural income to be lower than 30%. That said, it is important to note that the standard deviations used in the calculations was large, driving up the sample size. This may not be the case for our more targeted sample. However, the sample size calculated is also sufficient to find an impact of less than .2 sd of estimated income in the Haiti LSMS. A change of .2 standard deviations is often used as a useful benchmark impact size to find relatively small impacts.
20
survey with data available (the Haiti LSMS 2001).19 Given that no panel data is available, the expected
correlation between baseline and follow-up (.45) was estimated based on a recent panel survey in a
poor agricultural region of Nicaragua.20
In addition, given the relatively high mobility in Haiti, it is important to plan for the fact that a number of
households interviewed at baseline might not be found back to re-interview at follow-up. The concern is
somewhat mitigated by the fact that these farmers are already selected to receive the subsidies within
the next 2 years or so, which given the substantial resources involved might reduce migration. Moreover
detailed contact information will be collected during the baseline survey and careful tracking procedures
will be put in place for the follow-up survey. Given these considerations and that the data collection will
be designed with careful attention to tracking, the power calculation assumes a 10% attrition rate
between baseline and each of the follow-up surveys.
We further assume that the subsidies will be demanded (and received) by 90% of the farmers eligible
according to the registry. Although this take-up rate may seem high, this is motivated by the high value
of the subsidies which should help guarantee compliance.
Based on the rather high predicted ICC, in Scenario B we elect to sample and survey 13 farmers per
locality at baseline and in the third (last) follow-up and survey only 7 of them at first and second follow-
ups. Over-sampling at baseline and last follow-up allows maximizing power for the longer-term effects
while keeping survey costs constant. In Scenario A, we sample 20 farmers per locality, and in Scenario C,
we sample 7 farmers per locality at baseline and third follow-up and 3 at first and second follow-ups.
The total sample would thus remain the same in the three scenarios with 8,000 surveys over the 4
rounds.
As the project will be phased in over four seasons, we will be able to estimate the effect of the project
after one, two, and three seasons. Additionally, this design allows us to gain additional power by
repeating the short-term estimates multiple times. For instance, the first follow-up survey will allow an
estimate of the 1-season effect by comparing the Season 1 Treatment farmers to the Season 1 Control
19
ICC is calculated using census tracks as opposed to localities, as this is the closest geographical unit available in the data. The ICC was highly sensitive to different assumptions about geography and was also different for different potential outcome indicators. The value of .139 was near the top of the range. 20
Given that Nicaragua is the second poorest country in Latin America after Haiti, this seems to be a plausible,
relevant and available correlation to consider.
21
farmers. However, the 1-season effect will be measured again by comparing the Season 2 Treatment to
the Season 2 Control. For each estimation we provide MDES (Minimum Detectable Effect Size) estimates
for the first time the effect can be measured, and also for pooling the estimations from all applicable
survey rounds.
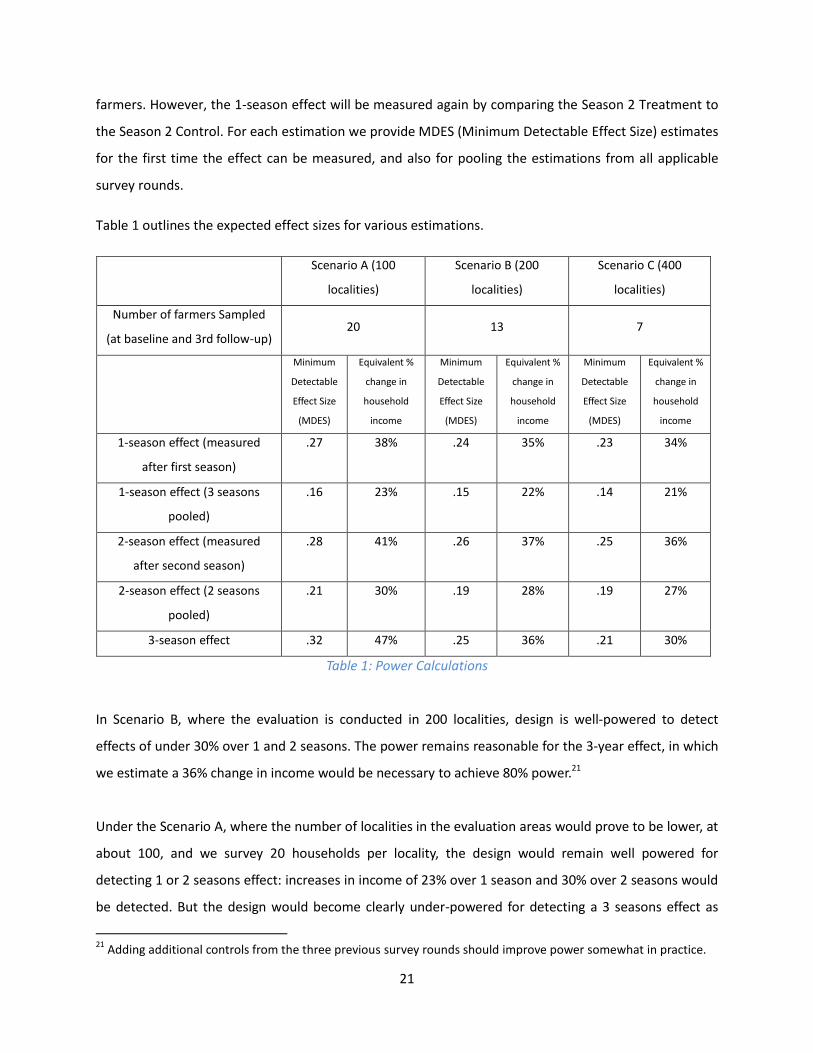
Table 1 outlines the expected effect sizes for various estimations.
Scenario A (100
localities)
Scenario B (200
localities)
Scenario C (400
localities)
Number of farmers Sampled
(at baseline and 3rd follow-up) 20 13 7
Minimum
Detectable
Effect Size
(MDES)
Equivalent %
change in
household
income
Minimum
Detectable
Effect Size
(MDES)
Equivalent %
change in
household
income
Minimum
Detectable
Effect Size
(MDES)
Equivalent %
change in
household
income
1-season effect (measured
after first season)
.27 38% .24 35% .23 34%
1-season effect (3 seasons
pooled)
.16 23% .15 22% .14 21%
2-season effect (measured
after second season)
.28 41% .26 37% .25 36%
2-season effect (2 seasons
pooled)
.21 30% .19 28% .19 27%
3-season effect .32 47% .25 36% .21 30%
Table 1: Power Calculations
In Scenario B, where the evaluation is conducted in 200 localities, design is well-powered to detect
effects of under 30% over 1 and 2 seasons. The power remains reasonable for the 3-year effect, in which
we estimate a 36% change in income would be necessary to achieve 80% power.21
Under the Scenario A, where the number of localities in the evaluation areas would prove to be lower, at
about 100, and we survey 20 households per locality, the design would remain well powered for
detecting 1 or 2 seasons effect: increases in income of 23% over 1 season and 30% over 2 seasons would
be detected. But the design would become clearly under-powered for detecting a 3 seasons effect as
21
Adding additional controls from the three previous survey rounds should improve power somewhat in practice.
22
only increase in income of 47% could be detected at this term.
It is only under the Scenario C (in which the evaluation can be conducted in a broader area comprising
400 localities, with 2800 people surveyed at baseline and follow-up) that the design would allow
sufficient power to detect a 30% increase in farmers' income after 3 seasons: in this case increases in
income of 21%, 27% and 30% respectively over 1, 2 and 3 seasons would be detected. The power for the
effects over 3 seasons is constrained primarily by the roll-out schedule, which restricts the amount of
clusters in the relevant treatment and control group, and conducting the impact evaluation in a bigger
beneficiary area is the only way to increase power for those longer-term effects and decrease the costs
of the evaluation.22 To reach 400 localities, additional evaluation SCs could be added once the
randomized selection in the first evaluation SCs has proven feasible.
As the above power calculations make clear, the statistical power of the impact evaluation will be greater
if there are a large number of localities that are part of the impact evaluation from the beginning. The
operations team, however, would like to start in a smaller geographical area in order to ease the
logistical roll-out of the project. These two concerns will be weighed against each other in the final
choice of SCs for the impact evaluation.
Individual Sampling
In order to achieve sufficient power, the evaluation will work in all localities in the relevant sections
communales. The sampling will be done from the farmer registry, which will be a complete listing of all
farmers in the sections communales. The registry will contain information about what crops farmers
grow, and what package they would be interested in receiving.
Based on this registry, we will determine which farmers are eligible to receive the PTTA packages for rice
and sweet potato and are also likely to demand them. From this list of “likely recipients”, we will
randomly sample 13 people per locality to be surveyed for the impact evaluation. (Only 7 of them will be
surveyed at the first and second follow-ups. This assumes the reference scenario with 200 localities.) The
sampling will be stratified such that we end up with a representative number of both rice and sweet
potato farmers.
22
Similar power as in the reference could be achieved for a 40 percent lower survey budget if 400 localities were covered by the impact evaluation – with 4 farmers per locality at baseline and last follow-up and 2 at first and second follow-ups.
23
Threats to Internal and External Validity
There are a number of factors which could threaten the validity of this design. First, it requires close
cooperation with the government and OPS to ensure that the timing of voucher delivery is consistent
with the impact evaluation plans. MARNDR has expressed worry about the feasibility of using
randomization to plan the phase-in of the localities. All parties have agreed that if major unforeseen
events (force majeure, such as heavy protests or natural disaster) create a situation where
randomization would endanger the effectiveness of the project, alternative phase-in strategies will be
discussed. Additionally, the OPS might have an incentive to alter the rollout schedule due to political
pressure or logistical challenges. This risk will be mitigated through working closely with the government,
OPS, and other stakeholders to ensure that there is understanding and buy-in for the phase-in process.
There is also uncertainty about the amount of time it will take the OPS to provide subsidies for the
selected sections communales. If the phase-in is quicker than expected, the evaluation will not be able
to measure medium term effects. If they are slower, this would allow longer-term effects but the
schedule of surveys would have to be adjusted to remain within the budget.
As there are many donors in Haiti, it is possible that farmers within our evaluation will receive support
from other similar projects. This is taken as a given, and we realize that even localities in our late-
starting group will not be “pure” controls. However, this will not be a significant problem for the
evaluation strategy as long as the late-start localities are not systematically selected for inclusion in
other projects. This situation will be monitored closely.
In addition, the government is concerned that using the locality as a unit of randomization may be
difficult in practice, as locality boundaries are not always well-defined. This will be mitigated by using
the locality names as listed on the farmer registry, so that these self-described localities can be used
even in locations where there are not strict boundaries.
The main risk to external validity is that the selection of departments and communes selected for the
PTTA project are those with high agricultural productivity, and thus not representative of Haiti as a
whole. Although this fact must be taken into account when drawing conclusions from this study, it
should still provide a reliable indicator for the success of similar projects.
24
Budget
Data collection quantitative household surveys
The budget was calculated based on the above power calculations and the best available information
regarding survey costs in Haiti. Survey costs in Haiti are extremely high.
The estimated budget for the data collection is based on the initial bids of survey firms competing
through competitive selection for the contract to conduct the baseline survey. Although procurement is
still underway, the likely winner of the contract charges $120 per survey, which we will use as our
estimate for the per/survey cost going forward.
The estimated total budget for the household surveys adds up to US$ 960,000 for the PTTA (for 4 rounds
of data collection, a total of 8000 surveys conducted). If the project team determines that this IE
methodology applied to the 200 localities scenario works well during its initial phases, it could be
MARNDR and the IDB may decide to incorporate more localities in the randomization process. If the
total number of localities becomes 400, for instance, then we would get the same statistical power as in
the 200 localities scenario but with a total sample size of only 4,800 individuals. In that context, the total
budget for the household surveys would add up to US$ 576,000.
Costs for complementary qualitative survey, field coordinator, and travel
To guarantee high quality data collection, and to assist with data preparation and analysis, a total 24
months of field coordinator time is estimated. The field coordinator has been hired through PSE, and at
the established rates for field coordinators at PSE this will cost a total of US$ 102,000.
Travel by the principal investigators and the research assistant over the 5 year period is estimated at
US$ 50,000 (half by PSE researchers and half by DIME staff). The principal investigators from PSE will be
contributing their time free of charge. PSE’s overhead rate of 13% will apply to funds spent by PSE and is
estimated at US$ 16,500.
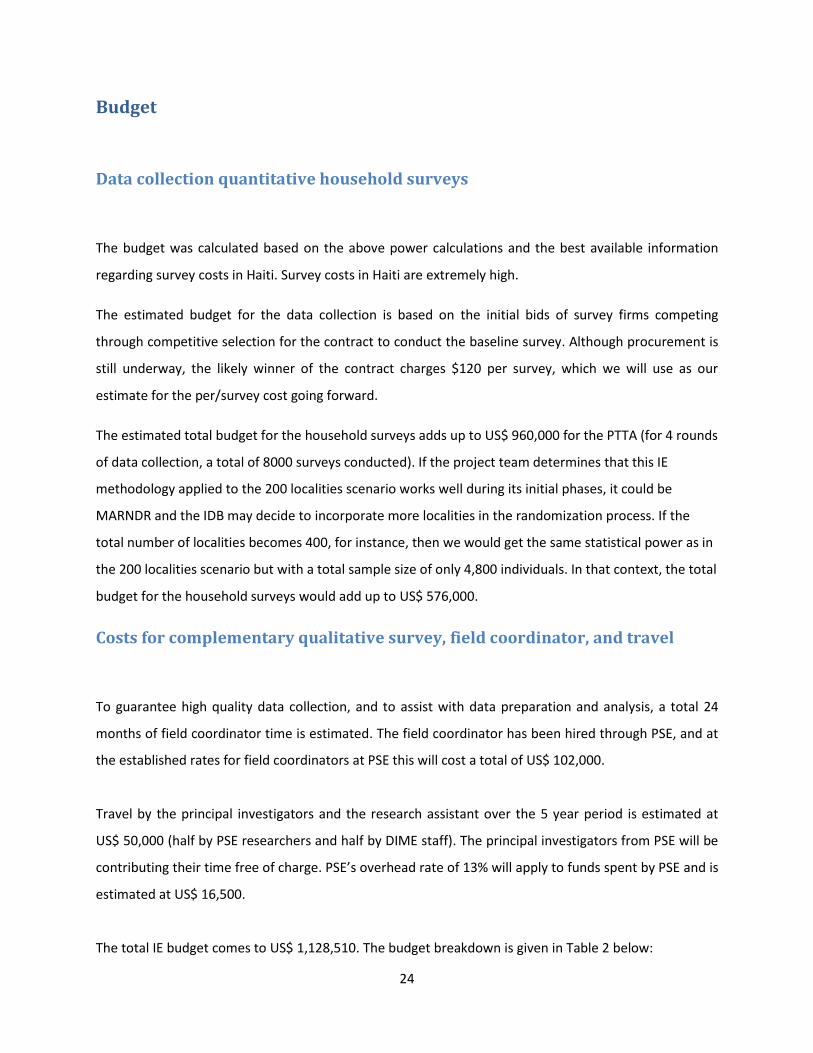
The total IE budget comes to US$ 1,128,510. The budget breakdown is given in Table 2 below:
25
Unit Cost/Unit Number Total
Data Collection Rounds $240,000 4 $960,000
Travel for DIME Staff Weeks $5,000 5 $25,000
Travel for PSE Researchers Weeks $5,000 5 $25,000
Field Coordination (from PSE) Months $4,250 24 $102,000
PSE Admin Costs (13%) Total $16,510 1 $16,510
Total $1,128,510
Table 2: Estimated IE Budget
26
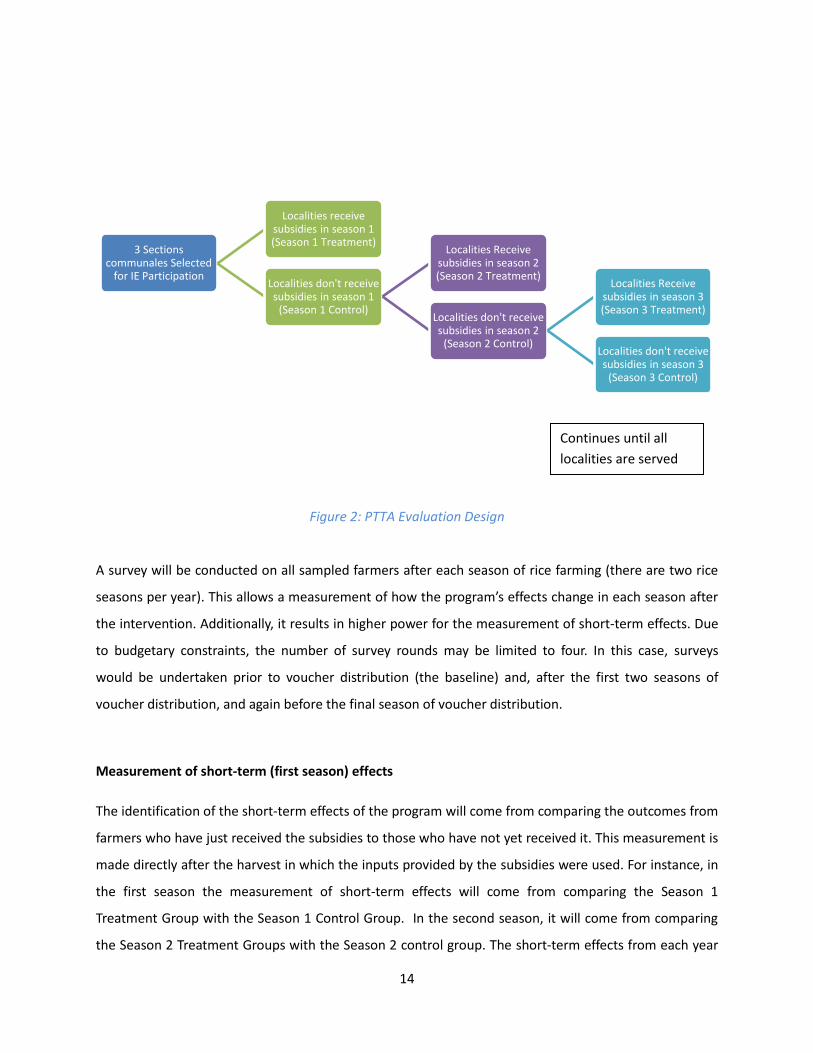
Timeline
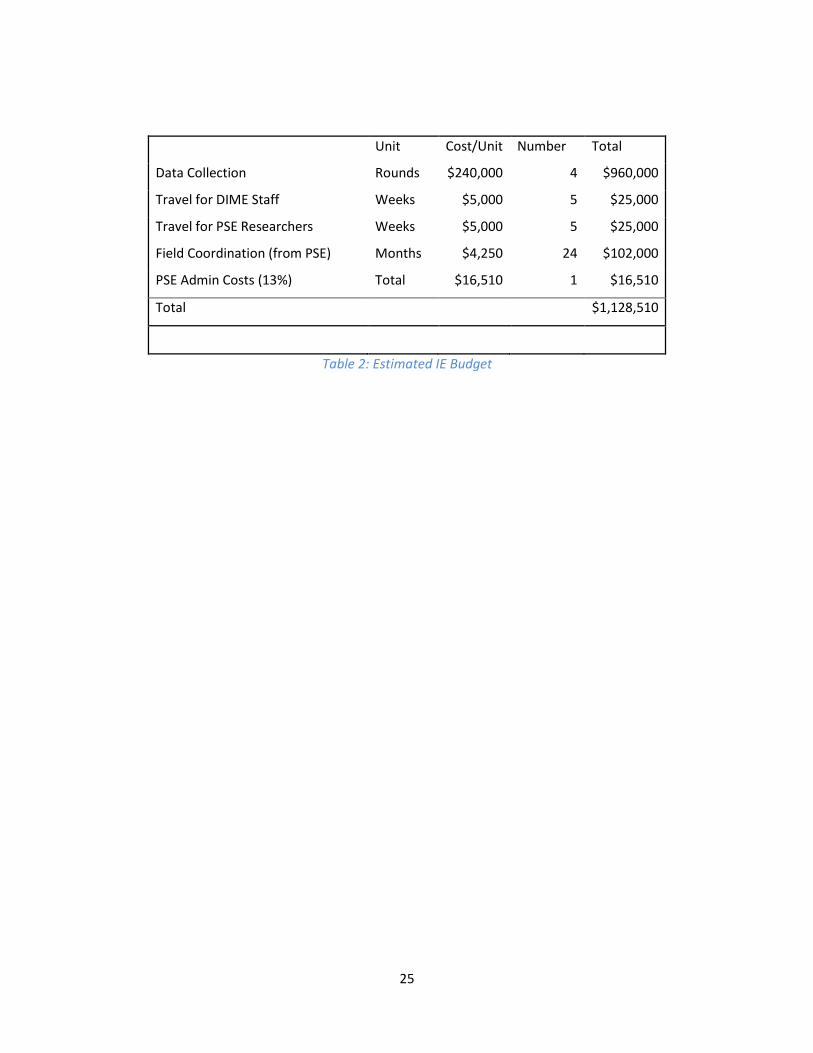
Figure 4 gives an indicative timeline for the progression of the impact evaluation work.
Figure 4: Timeline23
23
The World Bank’s Fiscal Year 2014 starts July 1, 2013
Task
Farmer Registry Completed
Farmer Demands Gathered
Baseline Survey
Vouchers for first season Distributed
Baseline Report Completed
Second Round of Survey
Season 2 Vouchers Received
Initial IE Report
Third Round of Survey
Season 3 Vouchers Received
Updated IE Report
Fourth Round of Survey
Season 4 Vouchers Received
Final IE Report
FY 2016
Q1 Q2Q4
FY 2014 FY 2015
Q1 Q2 Q2 Q4 Q1 Q2 Q3
27
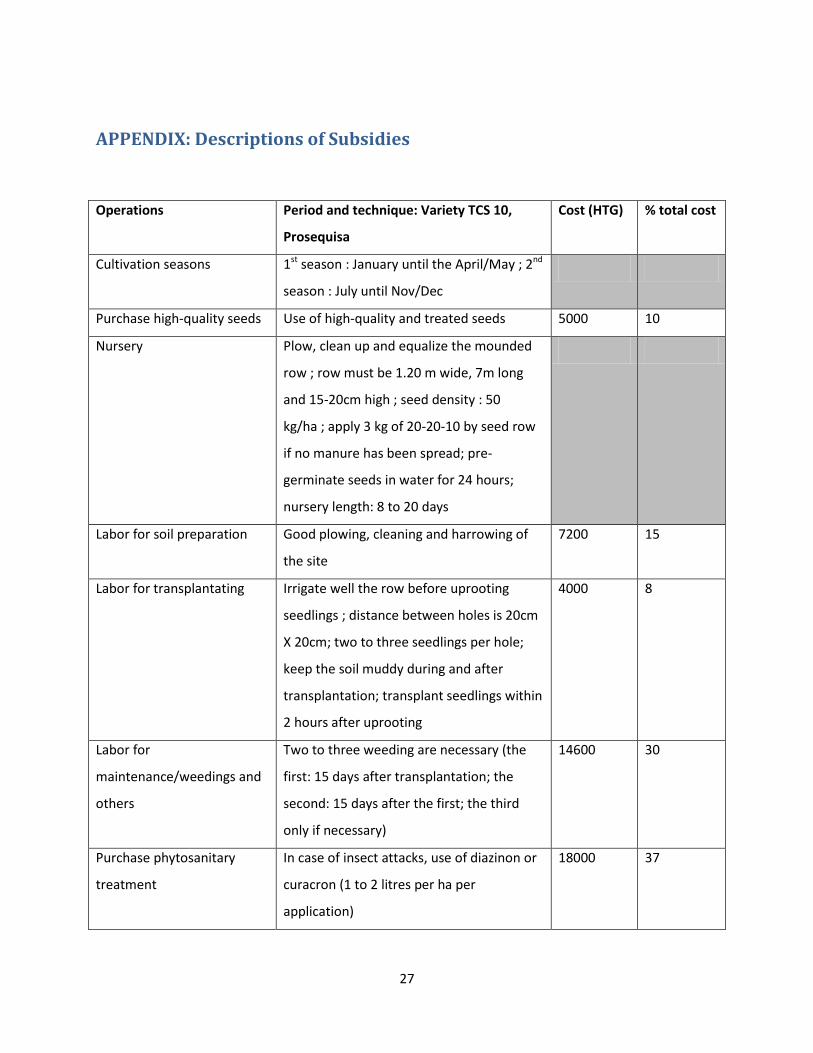
APPENDIX: Descriptions of Subsidies
Operations Period and technique: Variety TCS 10,
Prosequisa
Cost (HTG) % total cost
Cultivation seasons 1st season : January until the April/May ; 2nd
season : July until Nov/Dec
Purchase high-quality seeds Use of high-quality and treated seeds 5000 10
Nursery Plow, clean up and equalize the mounded
row ; row must be 1.20 m wide, 7m long
and 15-20cm high ; seed density : 50
kg/ha ; apply 3 kg of 20-20-10 by seed row
if no manure has been spread; pre-
germinate seeds in water for 24 hours;
nursery length: 8 to 20 days
Labor for soil preparation Good plowing, cleaning and harrowing of
the site
7200 15
Labor for transplantating Irrigate well the row before uprooting
seedlings ; distance between holes is 20cm
X 20cm; two to three seedlings per hole;
keep the soil muddy during and after
transplantation; transplant seedlings within
2 hours after uprooting
4000 8
Labor for
maintenance/weedings and
others
Two to three weeding are necessary (the
first: 15 days after transplantation; the
second: 15 days after the first; the third
only if necessary)
14600 30
Purchase phytosanitary
treatment
In case of insect attacks, use of diazinon or
curacron (1 to 2 litres per ha per
application)
18000 37
28
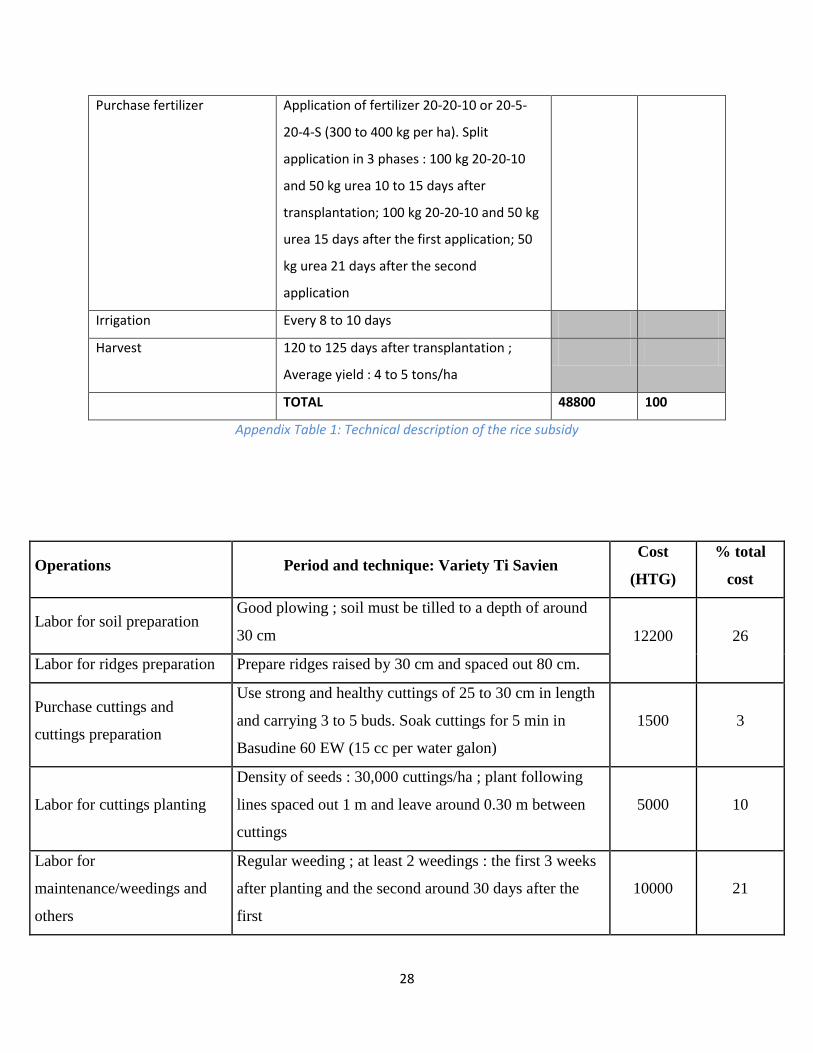
Purchase fertilizer Application of fertilizer 20-20-10 or 20-5-
20-4-S (300 to 400 kg per ha). Split
application in 3 phases : 100 kg 20-20-10
and 50 kg urea 10 to 15 days after
transplantation; 100 kg 20-20-10 and 50 kg
urea 15 days after the first application; 50
kg urea 21 days after the second
application
Irrigation Every 8 to 10 days
Harvest 120 to 125 days after transplantation ;
Average yield : 4 to 5 tons/ha
TOTAL 48800 100
Appendix Table 1: Technical description of the rice subsidy
Operations Period and technique: Variety Ti Savien Cost
(HTG)
% total
cost
Labor for soil preparation Good plowing ; soil must be tilled to a depth of around
30 cm 12200 26
Labor for ridges preparation Prepare ridges raised by 30 cm and spaced out 80 cm.
Purchase cuttings and
cuttings preparation
Use strong and healthy cuttings of 25 to 30 cm in length
and carrying 3 to 5 buds. Soak cuttings for 5 min in
Basudine 60 EW (15 cc per water galon)
1500 3
Labor for cuttings planting
Density of seeds : 30,000 cuttings/ha ; plant following
lines spaced out 1 m and leave around 0.30 m between
cuttings
5000 10
Labor for
maintenance/weedings and
others
Regular weeding ; at least 2 weedings : the first 3 weeks
after planting and the second around 30 days after the
first
10000 21
29
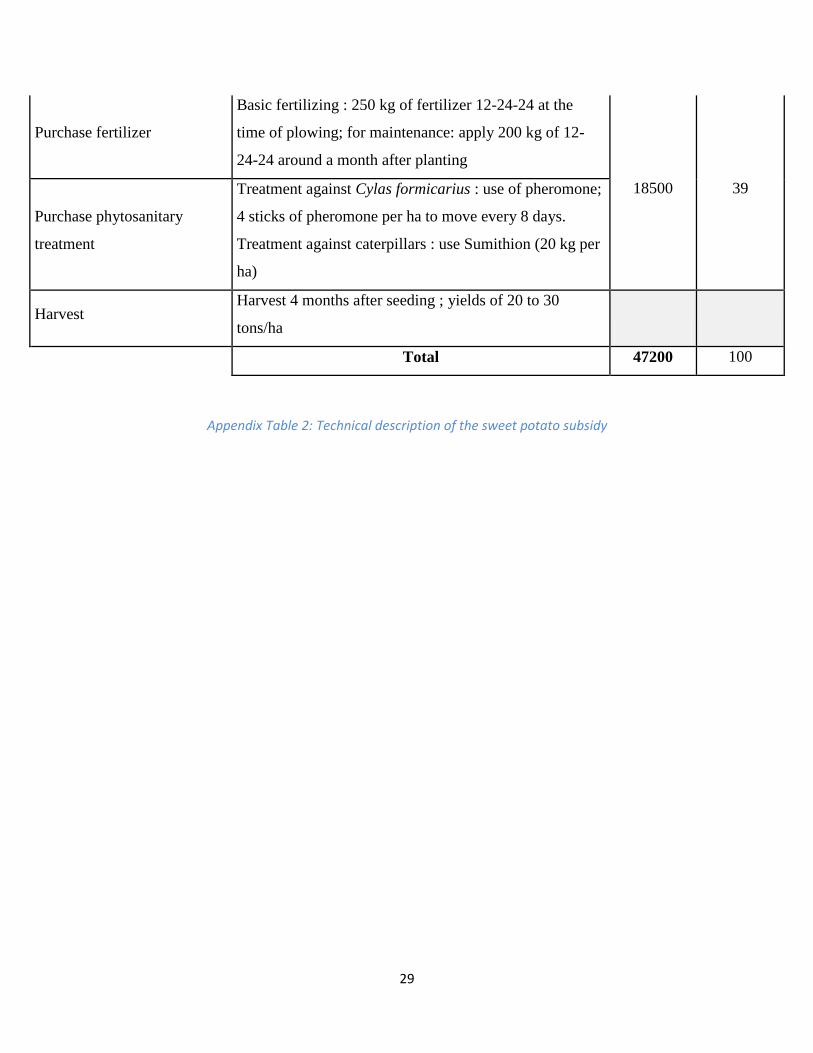
Purchase fertilizer
Basic fertilizing : 250 kg of fertilizer 12-24-24 at the
time of plowing; for maintenance: apply 200 kg of 12-
24-24 around a month after planting
18500 39
Purchase phytosanitary
treatment
Treatment against Cylas formicarius : use of pheromone;
4 sticks of pheromone per ha to move every 8 days.
Treatment against caterpillars : use Sumithion (20 kg per
ha)
Harvest Harvest 4 months after seeding ; yields of 20 to 30
tons/ha
Total 47200 100
Appendix Table 2: Technical description of the sweet potato subsidy