IMF Country Report No. 16/183 REPUBLIC OF TIMOR-LESTE · 2016-06-24 · IMF Country Report No....
72
© 2016 International Monetary Fund IMF Country Report No. 16/183 REPUBLIC OF TIMOR-LESTE 2016 ARTICLE IV CONSULTATION—PRESS RELEASE; STAFF REPORT; AND STATEMENT BY THE EXECUTIVE DIRECTOR FOR TIMOR-LESTE Under Article IV of the IMF’s Articles of Agreement, the IMF holds bilateral discussions with members, usually every year. In the context of the 2016 Article IV consultation with Timor-Leste, the following documents have been released and are included in this package: A Press Release summarizing the views of the Executive Board as expressed during its May 11, 2016 consideration of the staff report that concluded the Article IV consultation with Timor-Leste. The Staff Report prepared by a staff team of the IMF for the Executive Board’s consideration on May 11, 2016, following discussions that ended on February 12, 2016, with the officials of Timor-Leste on economic developments and policies. Based on information available at the time of these discussions, the staff report was completed on April 7, 2016. An Informational Annex prepared by the IMF staff. A Debt Sustainability Analysis prepared by the staffs of the IMF and the International Development Association (IDA). A Statement by the Executive Director for Timor-Leste. The IMF’s transparency policy allows for the deletion of market-sensitive information and premature disclosure of the authorities’ policy intentions in published staff reports and other documents. Copies of this report are available to the public from International Monetary Fund Publication Services PO Box 92780 Washington, D.C. 20090 Telephone: (202) 623-7430 Fax: (202) 623-7201 E-mail: [email protected] Web: http://www.imf.org Price: $18.00 per printed copy International Monetary Fund Washington, D.C. June 2016
Transcript of IMF Country Report No. 16/183 REPUBLIC OF TIMOR-LESTE · 2016-06-24 · IMF Country Report No....
© 2016 International Monetary Fund
IMF Country Report No. 16/183
REPUBLIC OF TIMOR-LESTE 2016 ARTICLE IV CONSULTATION—PRESS RELEASE; STAFF REPORT; AND STATEMENT BY THE EXECUTIVE DIRECTOR FOR TIMOR-LESTE
Under Article IV of the IMF’s Articles of Agreement, the IMF holds bilateral discussions
with members, usually every year. In the context of the 2016 Article IV consultation with
Timor-Leste, the following documents have been released and are included in this
package:
A Press Release summarizing the views of the Executive Board as expressed during its
May 11, 2016 consideration of the staff report that concluded the Article IV
consultation with Timor-Leste.
The Staff Report prepared by a staff team of the IMF for the Executive Board’s
consideration on May 11, 2016, following discussions that ended on February 12, 2016,
with the officials of Timor-Leste on economic developments and policies. Based on
information available at the time of these discussions, the staff report was completed
on April 7, 2016.
An Informational Annex prepared by the IMF staff.
A Debt Sustainability Analysis prepared by the staffs of the IMF and the
International Development Association (IDA).
A Statement by the Executive Director for Timor-Leste.
The IMF’s transparency policy allows for the deletion of market-sensitive information and
premature disclosure of the authorities’ policy intentions in published staff reports and
other documents.
Copies of this report are available to the public from
International Monetary Fund Publication Services
PO Box 92780 Washington, D.C. 20090
Telephone: (202) 623-7430 Fax: (202) 623-7201
E-mail: [email protected] Web: http://www.imf.org
Price: $18.00 per printed copy
International Monetary Fund
Washington, D.C.
June 2016

Press Release No. 16/243
FOR IMMEDIATE RELEASE
May 25, 2016
IMF Executive Board Concludes 2016 Article IV Consultation with Timor-Leste
On May 11, 2016, the Executive Board of the International Monetary Fund (IMF) concluded the
2016 Article IV Consultation with Timor-Leste.1
Non-oil real GDP growth is estimated to have declined to 4.3 percent in 2015 from 5.5 percent in
2014, due to weaker government spending. Both headline and core inflation eased to below
1 percent in 2014 and 2015, reflecting lower commodity prices, a stronger U.S. dollar against
Timor-Leste’s trading partners’ currencies, and some improvement in supply bottlenecks.
The fiscal position weakened in 2015 due largely to lower petroleum revenue. Petroleum revenue
fell by 40 percent in 2015 mainly on account of the slump in global oil prices. Staff’s estimate
points to an overall fiscal surplus of 4.2 percent of GDP in 2015, a considerable reduction from
the large surpluses in previous years. Prudent saving of its oil wealth in the Petroleum Fund (PF),
Timor-Leste’s sovereign wealth fund, has provided a financial cushion to help offset revenue
losses. Withdrawals from the PF remained above the level consistent with the estimated
sustainable income, in part to finance front-loaded capital investments. This, coupled with lower
oil receipts and negative net investment returns due largely to foreign exchange valuation losses,
saw the balance of the PF decline for the first time, to $16.2 billion as of end-2015.
The external current account surplus was halved to 25 percent of GDP in 2014 and is estimated
to have shrunk further to 17 percent of GDP in 2015. This is largely due to lower income from
declining oil and gas receipts and weak investment returns on the PF portfolio against weak
global equity market performance in 2015. The banking system is highly liquid and well
capitalized. Growth of private sector credit picked up to 10.5 percent (y/y) in December 2015
from 5.5 percent in December 2014. Excess liquidity in the banking system and banks’ overseas
placements of deposits have remained high.
1 Under Article IV of the IMF's Articles of Agreement, the IMF holds bilateral discussions with members, usually
every year. A staff team visits the country, collects economic and financial information, and discusses with officials
the country's economic developments and policies. On return to headquarters, the staff prepares a report, which
forms the basis for discussion by the Executive Board.
International Monetary Fund
700 19th Street, NW
Washington, D. C. 20431 USA
2
The medium-term growth outlook depends critically on economic diversification and ensuring a
sustainable fiscal position. Average non-oil real GDP growth in the medium-term is projected at
5.5 percent, supported by increasing public spending and foreign direct investment. This hinges
on successful prioritization of government expenditures to facilitate high-return infrastructure
investments in tandem with structural reforms that catalyze non-oil private sector growth.
The main sources of risk over the medium- to long-term are higher fiscal spending, public
investments not yielding adequate returns and enhanced growth, and inadequate mobilization of
domestic revenues.
Executive Board Assessment2
Executive Directors commended the authorities for the progress made in nation building and
economic and social development. However, Directors noted that Timor-Leste faces difficult
policy challenges from the fall in oil revenue and the country’s large development needs. Going
forward, they emphasized the importance of achieving fiscal sustainability and economic
diversification.
Directors saw a need for continued fiscal consolidation. They encouraged the authorities to
strengthen non-oil revenue, rationalize current spending, and adhere to a medium-term
adjustment plan. Recognizing the need for capital spending, Directors encouraged the
authorities to prioritize public investment plans, focusing on high-return infrastructure projects
through rigorous investment appraisal, so that such spending is in line with implementation
capacity and debt sustainability. Directors stressed that optimizing the composition and quality
of spending to help close Timor-Leste’s infrastructure gap will be key to long-term fiscal
sustainability and inclusive growth.
Directors welcomed the authorities’ commitment to preserving the assets of the Petroleum Fund.
In this context, they supported higher use of concessional financing for large infrastructure
projects, which would reduce reliance on withdrawals from the Petroleum Fund and support
greater discipline in investment spending. Directors also welcomed plans to introduce a value-
added tax, which will help achieve the government’s target of raising non-oil revenues.
Directors supported the efforts to improve financial inclusion, underscoring the importance of
striking the right balance with safeguarding financial stability. They saw a need for continued
efforts in strengthening regulatory and supervisory capacity and improving central bank
functions. Directors called for a strategy to fully resolve legacy non-performing loans.
2 At the conclusion of the discussion, the Managing Director, as Chairman of the Board, summarizes the views of
Executive Directors, and this summary is transmitted to the country's authorities. An explanation of any qualifiers
used in summings up can be found here: http://www.imf.org/external/np/sec/misc/qualifiers.htm.
3
Directors concurred that the use of the U.S. dollar as legal tender has served Timor-Leste well.
They supported the authorities’ plan to pursue further financial sector and institutional
development to pave the way for any potential change in the monetary and exchange rate regime.
Directors emphasized that medium-term growth will depend critically on economic
diversification. In this context, they agreed that priority should be given to boosting the private
sector by building infrastructure, improving the business climate and enhancing competitiveness.
Improvement in social conditions and investment in human capital will also be necessary.
Directors called for continued efforts to improve statistical capacity as well as the quality and
timeliness of data, which are crucial for policy formulation. They encouraged the authorities to
further leverage technical assistance from the Fund and other development partners.

4
Table 1. Timor-Leste: Selected Economic and Financial Indicators, 2012–21
2012 2013 2014 2015 2016 2017 2018 2019 2020 2021
Est. Prel. Proj.
(Annual percent change)
Real sector
Real total GDP 5.3 -13.9 -15.8 -0.6 -8.8 -12.9 -3.9 -9.4 -9.2 -8.8
Real non-oil GDP 6.4 2.8 5.5 4.3 5.0 5.5 6.0 6.5 5.5 5.5
CPI (annual average) 10.9 9.6 0.8 0.6 1.5 3.8 4.0 4.0 4.0 4.0
CPI (end-period) 10.9 4.0 0.3 -0.6 3.6 4.0 4.0 4.0 4.0 4.0
(In percent of GDP, unless otherwise indicated)
Central government operations
Revenue 61.1 66.1 63.2 61.5 63.1 52.6 49.0 46.0 42.7 40.0
Domestic revenue 2.0 2.7 3.9 6.5 8.0 7.6 7.3 7.2 7.1 7.3
Petroleum revenue (incl. PF interest) 55.5 58.7 53.2 48.9 48.3 41.1 37.7 34.8 31.5 28.7
Grants 3.7 4.7 6.2 6.1 6.8 4.0 4.0 4.0 4.0 4.0
Expenditure 22.0 24.0 37.4 57.3 73.5 73.1 69.1 67.2 65.0 58.5
Recurrent expenditure 10.4 13.1 20.9 39.1 49.3 45.8 43.8 43.1 42.2 40.9
Capital expenditure 7.9 6.3 10.2 11.7 17.4 23.3 21.3 20.1 18.8 13.6
Donor project 3.7 4.7 6.2 6.1 6.8 4.0 4.0 4.0 4.0 4.0
Overall balance 39.1 42.1 25.9 4.2 -10.4 -20.5 -20.1 -21.2 -22.4 -18.5
Non-oil overall balance (in percent of non-
oil GDP)
-86.0 -70.5 -86.9 -82.8 -83.3 -81.8 -73.5 -66.1 -59.7 -49.5
(Annual percent change, unless otherwise indicated)
Money and credit
Deposits 26.5 22.4 19.6 22.8 21.6 21.3 21.9 21.6 21.6 21.7
Credit to the private sector 20.5 13.6 5.5 10.5 13.3 13.7 12.5 13.2 13.1 12.9
Lending interest rate (percent, end-period) 12.2 12.4 12.9 13.5 … … … … … …
(In millions of U.S. dollars, unless otherwise indicated)
Balance of payments
Current account balance 1/ 2,736 2,391 1,096 431 41 -281 -315 -334 -359 -241
(In percent of GDP) 40.2 42.7 25.1 16.5 2.0 -11.9 -12.2 -12.2 -12.2 -7.8
Trade balance -638 -679 -749 -684 -710 -844 -892 -901 -917 -892
Exports 2/ 33 18 15 9 17 20 21 24 26 28
Imports 672 696 764 692 728 864 914 925 943 920
Services (net) -920 -437 -388 -414 -486 -648 -647 -646 -637 -524
Petroleum revenue 3,775 3,286 2,319 1,281 1,014 972 976 955 925 889
Overall balance 422 -197 -376 127 8 6 3 1 1 1
Public foreign assets (end-period) 3/ 12,659 15,639 16,849 16,655 16,552 16,247 15,944 15,600 15,226 14,816
(In months of imports) 91 156 165 169 153 122 115 110 106 110
Exchange rates
NEER (2010=100, period average) 96.7 101.9 106.8 120.2 … … … … … …
REER (2010=100, period average) 115.5 131.6 134.9 150.1 … … … … … …
Memorandum items:
GDP at current prices: 6,807 5,595 4,361 2,620 2,100 2,368 2,589 2,746 2,933 3,094
Non-oil GDP 1,295 1,319 1,371 1,412 1,480 1,782 2,037 2,323 2,647 2,948
Oil GDP 5,512 4,276 2,990 1,207 620 587 552 423 286 147
GDP per capita 5,673 4,974 3,807 2,244 1,769 1,959 2,104 2,192 2,300 2,384
Crude oil prices (U.S. dollars per barrel,
WEO)4/
105 104 96 51 35 41 45 48 49 51
Petroleum Fund balance (in millions of U.S.
dollars) 5/
11,775 14,952 16,539 16,218 16,106 15,795 15,489 15,144 14,769 14,359
Petroleum Fund balance (in percent of
non-oil GDP)
909 1,134 1,206 1,148 1,088 887 760 652 558 487
Public debt (in millions of U.S. dollars) 0 6 22 46 153 326 541 777 1,059 1,219
Sources: Timor-Leste authorities; and IMF staff estimates and projections.
1/ Excludes trade in goods and services of entities located in the Joint Petroleum Development Area, which are considered non-resident.
2/ Excludes petroleum exports, the income of which is recorded under the income account.
3/ Includes Petroleum Fund balance and the central bank's official reserves.
4/ Simple average of UK Brent, Dubai, and WTI crude oil prices based on April 2016 WEO assumptions.
5/ Closing balance.
DEMOCRATIC REPUBLIC OF TIMOR-LESTE STAFF REPORT FOR THE 2016 ARTICLE IV CONSULTATION
KEY ISSUES Context: Timor-Leste has been making steady progress in nation building and economic development. However, adjusting from high oil dependency, large social and infrastructure development needs, and weak institutional capacity poses considerable challenges. While prudent saving of its oil wealth in the Petroleum Fund (PF) has provided Timor-Leste with a financial cushion to help offset revenue losses related to the recent fall in global oil prices, fiscal trends under existing capital expenditure plans are unsustainable as the PF will be depleted in the long term at the current rate of withdrawals. The debt sustainability assessment has deteriorated and points to a moderate risk of debt distress reflecting the government’s plan to tap concessional borrowing to finance front-loaded public investments. Restoring fiscal sustainability hinges on fiscal consolidation and successful prioritization of government expenditures to facilitate high-return infrastructure projects and catalyze non-oil private sector growth to achieve economic diversification.
Policy challenges center on achieving fiscal sustainability and economic diversification. Policy imperatives include:
Fiscal policy. Achieving fiscal sustainability requires scaling back plans to front-load public investment, rationalizing recurrent spending, mobilizing non-oil revenues, and adhering to a medium-term fiscal consolidation plan.
Debt sustainability. Staff supports the authorities plan to tap concessional borrowing to finance higher frontloaded capital expenditures, which would help preserve the assets of the Petroleum Fund as an endowment fund, while stressing the need to strengthen debt management capacity. Bold fiscal consolidation measures are also needed to safeguard long-term fiscal and debt sustainability.
Financial policy. Efforts to promote financial inclusion need to strike a balance with safeguarding financial stability by strengthening regulatory and supervisory capacity.
Structural reforms. Continuing effort to develop human capital, boost competitiveness, and create an enabling business environment is key to economic diversification and private sector growth.
April 7, 2016
DEMOCRATIC REPUBLIC OF TIMOR-LESTE
2 INTERNATIONAL MONETARY FUND
Approved By Hoe Ee Khor (APD) and Andrea Richter Hume (SPR)
Discussions were held in Dili during February 1–12, 2016. The staff team comprised Ms. Wong (head), Messrs. Washimi and Jamaludin, and Ms. Liu (all APD). Mr. Knight (World Bank Group) participated in the meetings. Mr. Canuto (ED) joined at the end of the mission.
CONTENTS
CONTEXT _________________________________________________________________________________________ 4
RECENT DEVELOPMENTS AND OUTLOOK ______________________________________________________ 5
A. Recent Developments ___________________________________________________________________________5
B. Outlook and Risks _______________________________________________________________________________6
POLICY DISCUSSIONS: FACILITATING SUSTAINABLE GROWTH ______________________________ 7
A. Fiscal Policy ______________________________________________________________________________________7
B. Financial Policy: Safeguarding Stability and Inclusion _________________________________________ 14
C. Structural Reforms: Enabling Private Sector Diversification ____________________________________ 16
D. Statistics and Technical Assistance ____________________________________________________________ 17
STAFF APPRAISAL ______________________________________________________________________________ 19 BOXES 1. Macroeconomic Impact under Different Fiscal Policy Scenarios _______________________________ 10 2. External Competitiveness ______________________________________________________________________ 18 FIGURES 1. Real Sector Developments _____________________________________________________________________ 21 2. Developments in the Petroleum Fund _________________________________________________________ 22 3. Fiscal Developments ___________________________________________________________________________ 23 4. Financial Developments _______________________________________________________________________ 24 5. Business Environment and Governance ________________________________________________________ 25 6. Social Economic Development _________________________________________________________________ 26 TABLES 1. Selected Economic and Financial Indicators, 2012-21 _________________________________________ 27 2. Summary Operations of the Central Government, 2013-21 ___________________________________ 28 3. Monetary Developments, 2012-2017 __________________________________________________________ 29 4. Balance of Payments, 2012-2021 ______________________________________________________________ 30 5. Medium-Term Scenario, 2012-21 ______________________________________________________________ 31 6. Risk Assessment Matrix ________________________________________________________________________ 32
DEMOCRATIC REPUBLIC OF TIMOR-LESTE
INTERNATIONAL MONETARY FUND 3
APPENDICES I. Petroleum Fund: Cornerstone of Fiscal Sustainability _________________________________________ 33 II. Key Policy Recommendations from Previous Article IV Consultation _________________________ 34 III. Advancing Financial Inclusion and Safeguarding Stability ____________________________________ 35 IV. Transition to Sustainable Development Goals ________________________________________________ 36 V. Remittances and Labor Flow Dynamics _______________________________________________________ 37
DEMOCRATIC REPUBLIC OF TIMOR-LESTE
4 INTERNATIONAL MONETARY FUND
0
20
40
60
80
100
120
2013 2014 2015 2016 2017 2018 2019 2020 2021
2014 SR oil prices 2016 SR oil prices
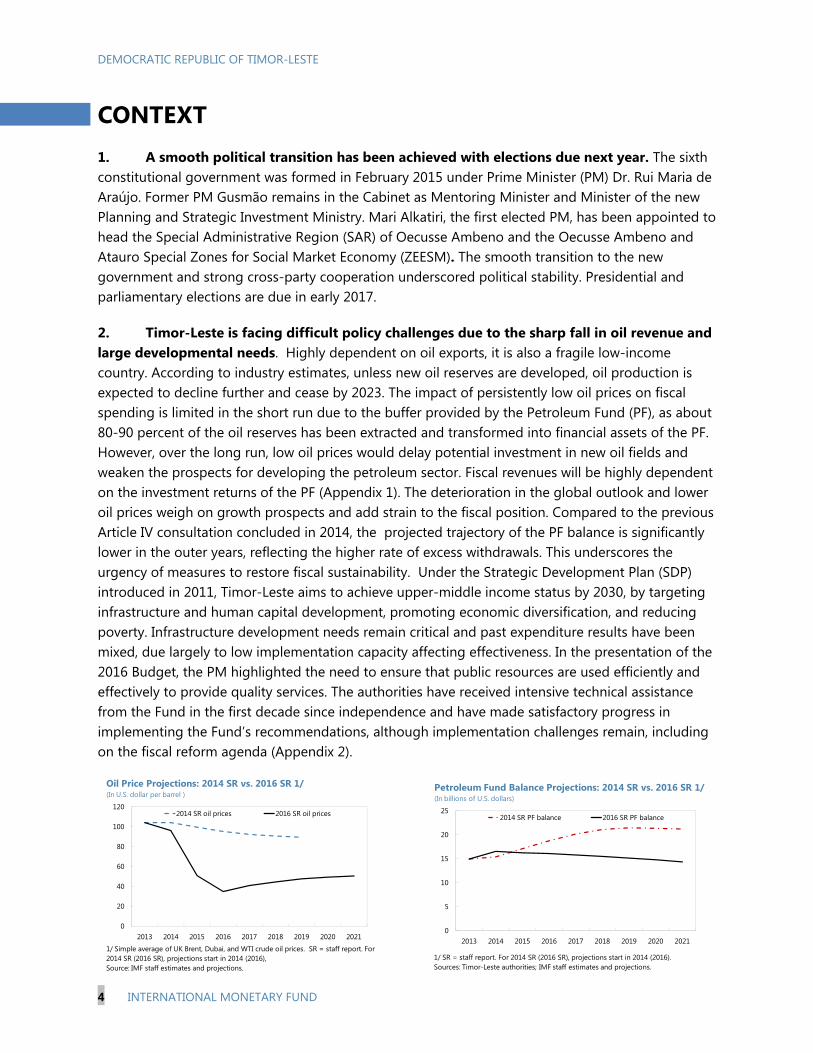
Oil Price Projections: 2014 SR vs. 2016 SR 1/ (In U.S. dollar per barrel )
1/ Simple average of UK Brent, Dubai, and WTI crude oil prices. SR = staff report. For 2014 SR (2016 SR), projections start in 2014 (2016), Source: IMF staff estimates and projections.
0
5
10
15
20
25
2013 2014 2015 2016 2017 2018 2019 2020 2021
2014 SR PF balance 2016 SR PF balance
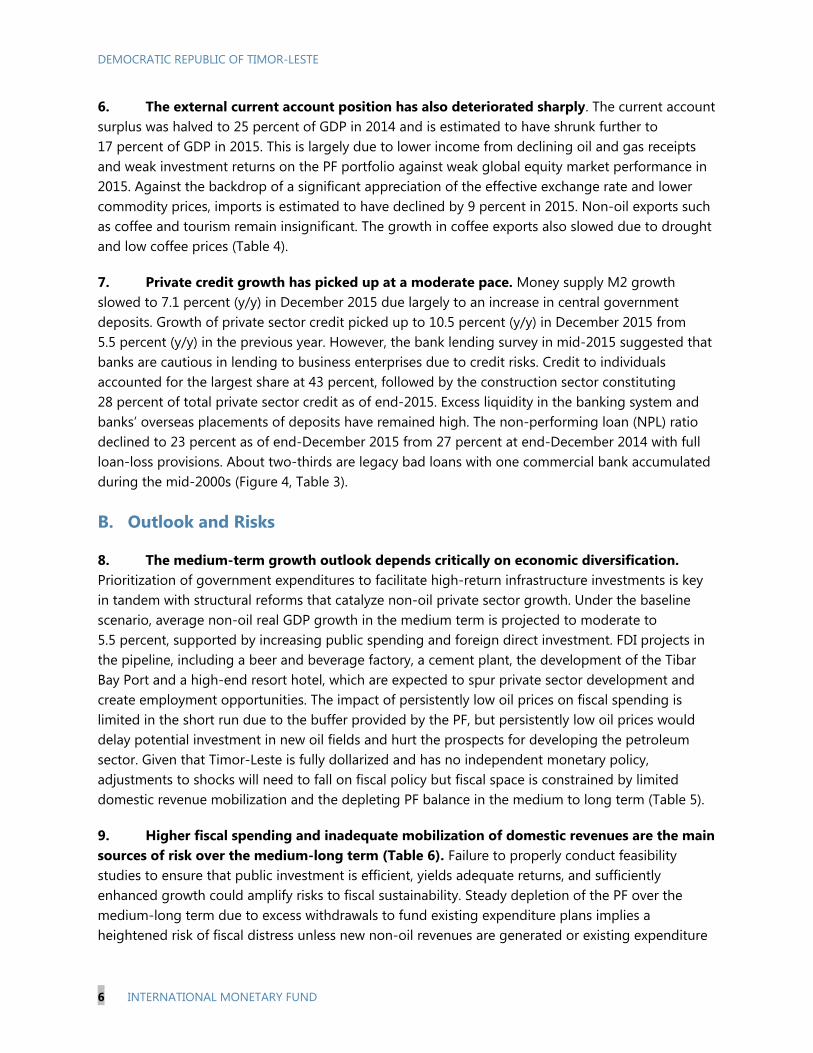
Petroleum Fund Balance Projections: 2014 SR vs. 2016 SR 1/(In billions of U.S. dollars)
1/ SR = staff report. For 2014 SR (2016 SR), projections start in 2014 (2016).Sources: Timor-Leste authorities; IMF staff estimates and projections.
CONTEXT 1. A smooth political transition has been achieved with elections due next year. The sixth constitutional government was formed in February 2015 under Prime Minister (PM) Dr. Rui Maria de Araújo. Former PM Gusmão remains in the Cabinet as Mentoring Minister and Minister of the new Planning and Strategic Investment Ministry. Mari Alkatiri, the first elected PM, has been appointed to head the Special Administrative Region (SAR) of Oecusse Ambeno and the Oecusse Ambeno and Atauro Special Zones for Social Market Economy (ZEESM). The smooth transition to the new government and strong cross-party cooperation underscored political stability. Presidential and parliamentary elections are due in early 2017.
2. Timor-Leste is facing difficult policy challenges due to the sharp fall in oil revenue and large developmental needs. Highly dependent on oil exports, it is also a fragile low-income country. According to industry estimates, unless new oil reserves are developed, oil production is expected to decline further and cease by 2023. The impact of persistently low oil prices on fiscal spending is limited in the short run due to the buffer provided by the Petroleum Fund (PF), as about 80-90 percent of the oil reserves has been extracted and transformed into financial assets of the PF. However, over the long run, low oil prices would delay potential investment in new oil fields and weaken the prospects for developing the petroleum sector. Fiscal revenues will be highly dependent on the investment returns of the PF (Appendix 1). The deterioration in the global outlook and lower oil prices weigh on growth prospects and add strain to the fiscal position. Compared to the previous Article IV consultation concluded in 2014, the projected trajectory of the PF balance is significantly lower in the outer years, reflecting the higher rate of excess withdrawals. This underscores the urgency of measures to restore fiscal sustainability. Under the Strategic Development Plan (SDP) introduced in 2011, Timor-Leste aims to achieve upper-middle income status by 2030, by targeting infrastructure and human capital development, promoting economic diversification, and reducing poverty. Infrastructure development needs remain critical and past expenditure results have been mixed, due largely to low implementation capacity affecting effectiveness. In the presentation of the 2016 Budget, the PM highlighted the need to ensure that public resources are used efficiently and effectively to provide quality services. The authorities have received intensive technical assistance from the Fund in the first decade since independence and have made satisfactory progress in implementing the Fund’s recommendations, although implementation challenges remain, including on the fiscal reform agenda (Appendix 2).

DEMOCRATIC REPUBLIC OF TIMOR-LESTE
INTERNATIONAL MONETARY FUND 5
0
20
40
60
80
100
120
140
-200
-100
0
100
200
300
400
500
600
2006 2007 2008 2009 2010 2011 2012 2013 2014 2015
Recurrent spending (right) Capital spending (right)Overall balance (left) Non-oil balance (left)Petroleum revenues (left) Domestic revenues (left)
Fiscal Balances (In percent of non-oil GDP)
Sources: Ministry of Finance of Timor-Leste; IMF staff calculations
RECENT DEVELOPMENTS AND OUTLOOK
A. Recent Developments
3. Growth has moderated while inflation has fallen sharply. Non-oil real GDP growth is estimated to have declined to 4¼ percent in 2015 from 5½ percent in 2014, due to reduced government spending. Total real GDP is estimated to have contracted by 0.6 percent in 2015 due to declining oil production. Both headline and core inflation eased to below 1 percent in 2014 and 2015 from double-digit levels in previous years, reflecting lower commodity prices, a stronger U.S. dollar against Timor-Leste’s trading partners’ currencies, and some improvement in supply bottlenecks (Figure 1, Table 1).
4. The fiscal position weakened in 2015 due largely to lower petroleum revenue. Petroleum revenue fell by 40 percent in 2015 mainly on account of the slump in global oil prices. Despite lower revenues at $1.45 billion (excluding grants), in light of the smaller expenditure outturn at $1.34 billion (compared with $1.57 billion in the 2015 rectification budget1), staff estimates an overall surplus of 4.2 percent of GDP in 2015, a considerable reduction from the large surpluses in previous years. The shortfall in revenue was largely met by a substantial drawdown of the PF. Excess withdrawal (defined as withdrawal in excess of the estimated sustainable income (ESI) calculated as 3 percent of petroleum wealth—net present value of expected future petroleum revenue plus the estimated value of the PF) in 2015 was more than six times the level in the previous year. This, coupled with lower oil receipts and negative net investment return due largely to foreign exchange valuation losses, saw the balance of the PF decline for the first time, to $16.2 billion as of end-2015. Financing by external borrowing remained low at under 1 percent of GDP (Figures 2 and 3, Table 2).
5. The approved expenditure in the 2016 budget is marginally smaller than the 2015 rectification budget. However, if fully executed, the 2016 budget of $1,562.2 million (excluding donor projects) would represent an expenditure increase of 17 percent (11 percent of 2016 GDP) compared to the estimated outturn for 2015. Capital expenditures is about 49 percent higher than the 2015 estimated outturn. Current transfers would increase by 11 percent, half of which is allocated to the Oecussi SAR and ZEESM.
1 The 2015 rectification budget was presented to the parliament on April 1, 2015 to reflect the new structure of the 6th constitutional government led by PM Araújo. It superseded the 2015 budget approved in December 2014.
-60
-40
-20
0
20
40
60
80
2006 2007 2008 2009 2010 2011 2012 2013 2014 2015 est.
Petroleum revenue (oil/gas receipts and interest) Current account balanceTrade balance 1/
Current Account Balance
1/ Oil and gas receipts are recorded as income.Sources: Country authorities; and IMF staff calculation.
(In percent of GDP)
DEMOCRATIC REPUBLIC OF TIMOR-LESTE
6 INTERNATIONAL MONETARY FUND
6. The external current account position has also deteriorated sharply. The current account surplus was halved to 25 percent of GDP in 2014 and is estimated to have shrunk further to 17 percent of GDP in 2015. This is largely due to lower income from declining oil and gas receipts and weak investment returns on the PF portfolio against weak global equity market performance in 2015. Against the backdrop of a significant appreciation of the effective exchange rate and lower commodity prices, imports is estimated to have declined by 9 percent in 2015. Non-oil exports such as coffee and tourism remain insignificant. The growth in coffee exports also slowed due to drought and low coffee prices (Table 4).
7. Private credit growth has picked up at a moderate pace. Money supply M2 growth slowed to 7.1 percent (y/y) in December 2015 due largely to an increase in central government deposits. Growth of private sector credit picked up to 10.5 percent (y/y) in December 2015 from 5.5 percent (y/y) in the previous year. However, the bank lending survey in mid-2015 suggested that banks are cautious in lending to business enterprises due to credit risks. Credit to individuals accounted for the largest share at 43 percent, followed by the construction sector constituting 28 percent of total private sector credit as of end-2015. Excess liquidity in the banking system and banks’ overseas placements of deposits have remained high. The non-performing loan (NPL) ratio declined to 23 percent as of end-December 2015 from 27 percent at end-December 2014 with full loan-loss provisions. About two-thirds are legacy bad loans with one commercial bank accumulated during the mid-2000s (Figure 4, Table 3).
B. Outlook and Risks
8. The medium-term growth outlook depends critically on economic diversification. Prioritization of government expenditures to facilitate high-return infrastructure investments is key in tandem with structural reforms that catalyze non-oil private sector growth. Under the baseline scenario, average non-oil real GDP growth in the medium term is projected to moderate to 5.5 percent, supported by increasing public spending and foreign direct investment. FDI projects in the pipeline, including a beer and beverage factory, a cement plant, the development of the Tibar Bay Port and a high-end resort hotel, which are expected to spur private sector development and create employment opportunities. The impact of persistently low oil prices on fiscal spending is limited in the short run due to the buffer provided by the PF, but persistently low oil prices would delay potential investment in new oil fields and hurt the prospects for developing the petroleum sector. Given that Timor-Leste is fully dollarized and has no independent monetary policy, adjustments to shocks will need to fall on fiscal policy but fiscal space is constrained by limited domestic revenue mobilization and the depleting PF balance in the medium to long term (Table 5).
9. Higher fiscal spending and inadequate mobilization of domestic revenues are the main sources of risk over the medium-long term (Table 6). Failure to properly conduct feasibility studies to ensure that public investment is efficient, yields adequate returns, and sufficiently enhanced growth could amplify risks to fiscal sustainability. Steady depletion of the PF over the medium-long term due to excess withdrawals to fund existing expenditure plans implies a heightened risk of fiscal distress unless new non-oil revenues are generated or existing expenditure

DEMOCRATIC REPUBLIC OF TIMOR-LESTE
INTERNATIONAL MONETARY FUND 7
plans are revised downwards. Moreover, given the increased share of global equities in the PF’s portfolio, its investment returns are exposed to the volatility of global financial markets.
Authorities’ Views
10. The authorities broadly agree with the staff’s outlook and risk assessment. However, they stressed that frontloaded infrastructure spending is expected to diversify the economy, boost potential growth, and alleviate capacity constraints. They were also of the view that the current low inflationary environment provides more space for increasing government spending with little risk of overheating.
POLICY DISCUSSIONS: FACILITATING SUSTAINABLE GROWTH
A. Fiscal Policy2
11. The 2016 Budget outlined a significant scaling up of public investment in 2017-19, which will strain fiscal sustainability. The multi-year budget plan proposed large front-loaded infrastructure investment in roads, bridges, ports, and airports, deemed essential to lay the foundation for private sector-led development and achieving the 2011-30 SDP goals. This includes the multi-year development of the Tasi Mane3 project on the south coast requiring government investment of $0.8 billion, close to a quarter of total capital spending in 2017–20. While frontloading of this investment may be desirable from the point of view of development needs, the total capital budget amounts to US$3.4 billion (130 percent of GDP) and would entail an overall fiscal 2 For the three scenarios presented in this section, the Budget scenario is based on the authorities ‘ oil prices assumption which on average is 60 percent higher than the WEO assumption on oil prices used for the baseline and adjustment scenarios for 2016-21. Assumptions on economic growth, inflation and current account under these scenarios are shown in Box 1. 3 The Tasi Mane project on the southern coast, consisting of the Suai Supply Base, Betano Refinery and Petrochemical Complex and Beaco LNG complex, is designed to form the backbone of the country’s petroleum industry.
DEMOCRATIC REPUBLIC OF TIMOR-LESTE
8 INTERNATIONAL MONETARY FUND
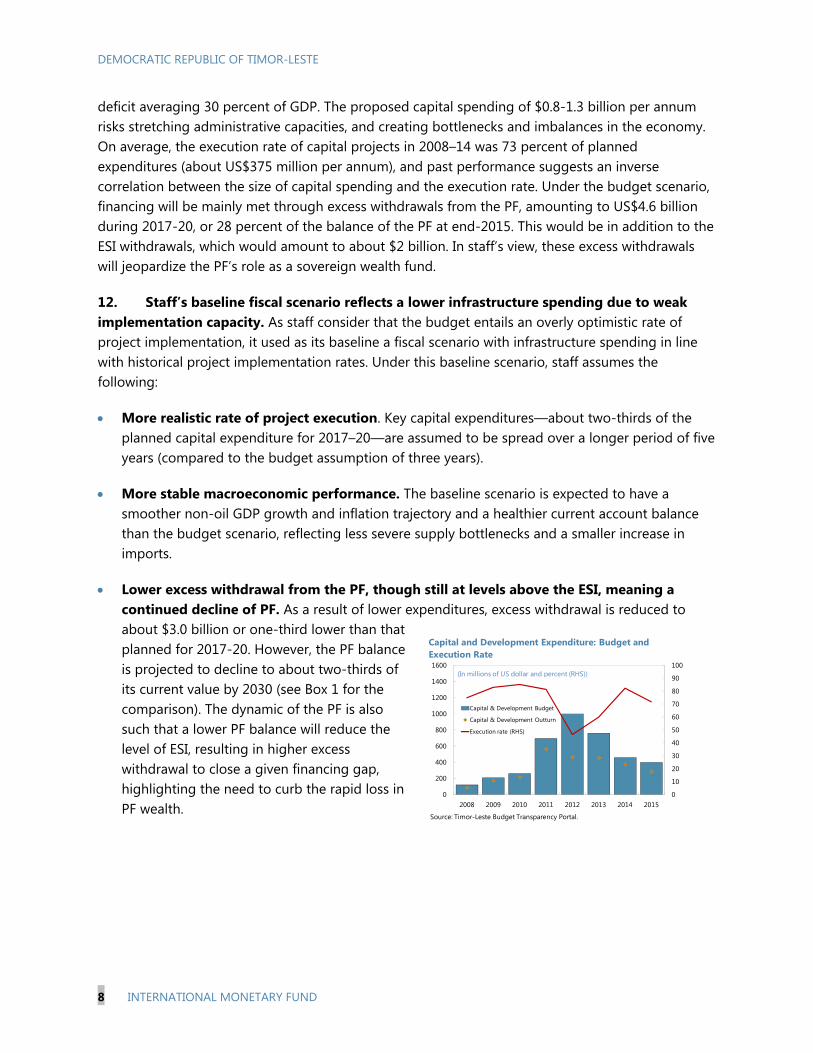
deficit averaging 30 percent of GDP. The proposed capital spending of $0.8-1.3 billion per annum risks stretching administrative capacities, and creating bottlenecks and imbalances in the economy. On average, the execution rate of capital projects in 2008–14 was 73 percent of planned expenditures (about US$375 million per annum), and past performance suggests an inverse correlation between the size of capital spending and the execution rate. Under the budget scenario, financing will be mainly met through excess withdrawals from the PF, amounting to US$4.6 billion during 2017-20, or 28 percent of the balance of the PF at end-2015. This would be in addition to the ESI withdrawals, which would amount to about $2 billion. In staff’s view, these excess withdrawals will jeopardize the PF’s role as a sovereign wealth fund.
12. Staff’s baseline fiscal scenario reflects a lower infrastructure spending due to weak implementation capacity. As staff consider that the budget entails an overly optimistic rate of project implementation, it used as its baseline a fiscal scenario with infrastructure spending in line with historical project implementation rates. Under this baseline scenario, staff assumes the following:
More realistic rate of project execution. Key capital expenditures—about two-thirds of the planned capital expenditure for 2017–20—are assumed to be spread over a longer period of five years (compared to the budget assumption of three years).
More stable macroeconomic performance. The baseline scenario is expected to have a smoother non-oil GDP growth and inflation trajectory and a healthier current account balance than the budget scenario, reflecting less severe supply bottlenecks and a smaller increase in imports.
Lower excess withdrawal from the PF, though still at levels above the ESI, meaning a continued decline of PF. As a result of lower expenditures, excess withdrawal is reduced to about $3.0 billion or one-third lower than that planned for 2017-20. However, the PF balance is projected to decline to about two-thirds of its current value by 2030 (see Box 1 for the comparison). The dynamic of the PF is also such that a lower PF balance will reduce the level of ESI, resulting in higher excess withdrawal to close a given financing gap, highlighting the need to curb the rapid loss in PF wealth.
0
10
20
30
40
50
60
70
80
90
100
0
200
400
600
800
1000
1200
1400
1600
2008 2009 2010 2011 2012 2013 2014 2015
Capital & Development Budget
Capital & Development Outturn
Execution rate (RHS)
Capital and Development Expenditure: Budget and Execution Rate
Source: Timor-Leste Budget Transparency Portal.
(In millions of US dollar and percent (RHS))
DEMOCRATIC REPUBLIC OF TIMOR-LESTE
INTERNATIONAL MONETARY FUND 9
0
1,000
2,000
3,000
4,000
5,000
6,000
7,000
2010
2012
2014
2016
2018
2020
2022
2024
2026
2028
2030
Baseline2016 BudgetAdjustmentNon-oil GNI per capita (baseline)
Non-oil GDP per capita(In US dollar)
Threshold for upper-middle income status
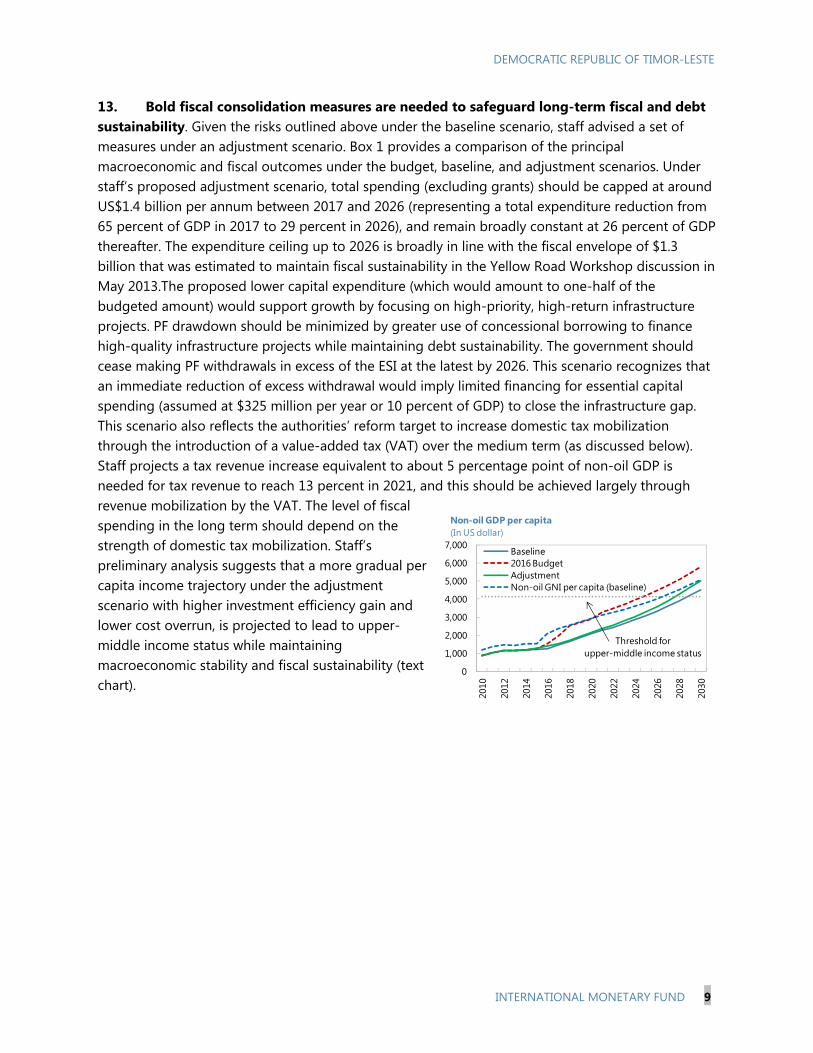
13. Bold fiscal consolidation measures are needed to safeguard long-term fiscal and debt sustainability. Given the risks outlined above under the baseline scenario, staff advised a set of measures under an adjustment scenario. Box 1 provides a comparison of the principal macroeconomic and fiscal outcomes under the budget, baseline, and adjustment scenarios. Under staff’s proposed adjustment scenario, total spending (excluding grants) should be capped at around US$1.4 billion per annum between 2017 and 2026 (representing a total expenditure reduction from 65 percent of GDP in 2017 to 29 percent in 2026), and remain broadly constant at 26 percent of GDP thereafter. The expenditure ceiling up to 2026 is broadly in line with the fiscal envelope of $1.3 billion that was estimated to maintain fiscal sustainability in the Yellow Road Workshop discussion in May 2013.The proposed lower capital expenditure (which would amount to one-half of the budgeted amount) would support growth by focusing on high-priority, high-return infrastructure projects. PF drawdown should be minimized by greater use of concessional borrowing to finance high-quality infrastructure projects while maintaining debt sustainability. The government should cease making PF withdrawals in excess of the ESI at the latest by 2026. This scenario recognizes that an immediate reduction of excess withdrawal would imply limited financing for essential capital spending (assumed at $325 million per year or 10 percent of GDP) to close the infrastructure gap. This scenario also reflects the authorities’ reform target to increase domestic tax mobilization through the introduction of a value-added tax (VAT) over the medium term (as discussed below). Staff projects a tax revenue increase equivalent to about 5 percentage point of non-oil GDP is needed for tax revenue to reach 13 percent in 2021, and this should be achieved largely through revenue mobilization by the VAT. The level of fiscal spending in the long term should depend on the strength of domestic tax mobilization. Staff’s preliminary analysis suggests that a more gradual per capita income trajectory under the adjustment scenario with higher investment efficiency gain and lower cost overrun, is projected to lead to upper-middle income status while maintaining macroeconomic stability and fiscal sustainability (text chart).
DEMOCRATIC REPUBLIC OF TIMOR-LESTE
10 INTERNATIONAL MONETARY FUND
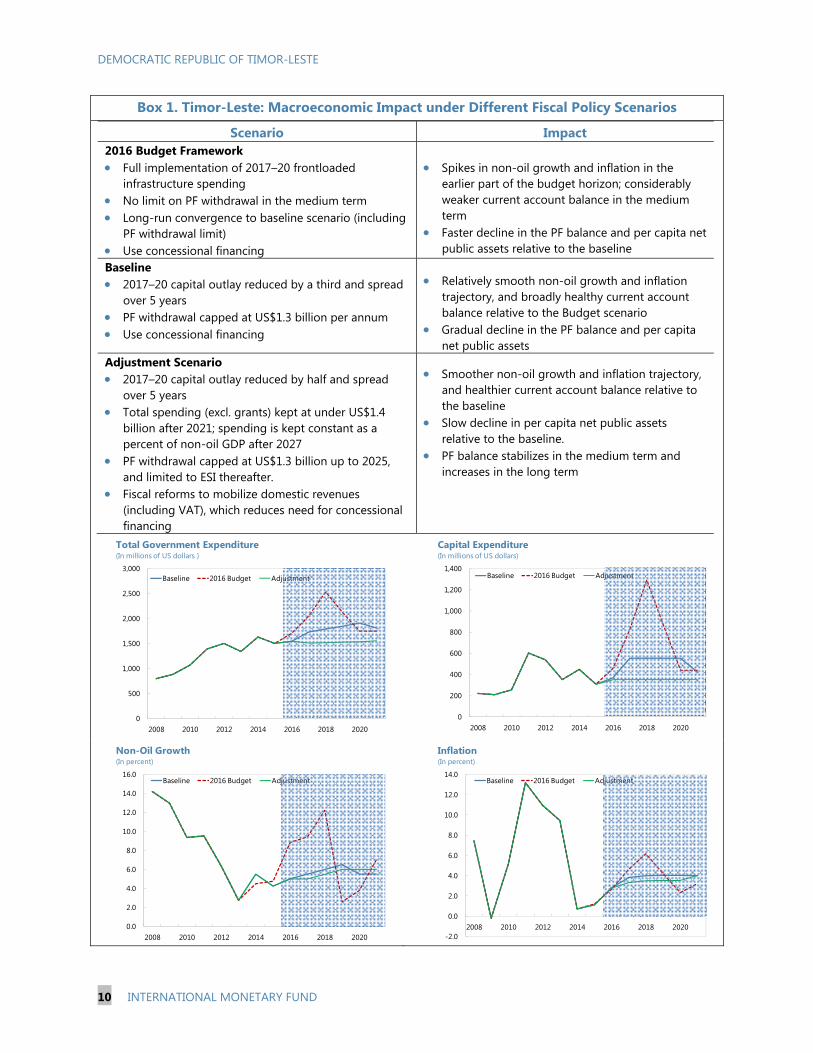
Box 1. Timor-Leste: Macroeconomic Impact under Different Fiscal Policy Scenarios
Scenario Impact 2016 Budget Framework Full implementation of 2017–20 frontloaded
infrastructure spending No limit on PF withdrawal in the medium term Long-run convergence to baseline scenario (including
PF withdrawal limit) Use concessional financing
Spikes in non-oil growth and inflation in the
earlier part of the budget horizon; considerably weaker current account balance in the medium term
Faster decline in the PF balance and per capita net public assets relative to the baseline
Baseline 2017–20 capital outlay reduced by a third and spread
over 5 years PF withdrawal capped at US$1.3 billion per annum Use concessional financing
Relatively smooth non-oil growth and inflation trajectory, and broadly healthy current account balance relative to the Budget scenario
Gradual decline in the PF balance and per capita net public assets
Adjustment Scenario 2017–20 capital outlay reduced by half and spread
over 5 years Total spending (excl. grants) kept at under US$1.4
billion after 2021; spending is kept constant as a percent of non-oil GDP after 2027
PF withdrawal capped at US$1.3 billion up to 2025, and limited to ESI thereafter.
Fiscal reforms to mobilize domestic revenues (including VAT), which reduces need for concessional financing
Smoother non-oil growth and inflation trajectory, and healthier current account balance relative to the baseline
Slow decline in per capita net public assets relative to the baseline.
PF balance stabilizes in the medium term and increases in the long term
0
500
1,000
1,500
2,000
2,500
3,000
2008 2010 2012 2014 2016 2018 2020
Baseline 2016 Budget Adjustment
Total Government Expenditure(In millions of US dollars )
0
200
400
600
800
1,000
1,200
1,400
2008 2010 2012 2014 2016 2018 2020
Baseline 2016 Budget Adjustment
Capital Expenditure(In millions of US dollars)
0.0
2.0
4.0
6.0
8.0
10.0
12.0
14.0
16.0
2008 2010 2012 2014 2016 2018 2020
Baseline 2016 Budget Adjustment
Non-Oil Growth(In percent)
-2.0
0.0
2.0
4.0
6.0
8.0
10.0
12.0
14.0
2008 2010 2012 2014 2016 2018 2020
Baseline 2016 Budget Adjustment
Inflation(In percent)

DEMOCRATIC REPUBLIC OF TIMOR-LESTE
INTERNATIONAL MONETARY FUND 11
Box 1. Timor-Leste: Macroeconomic Impact under Different Fiscal Policy Scenarios (concluded)
0
2,000
4,000
6,000
8,000
10,000
12,000
14,000
16,000
2008 2010 2012 2014 2016 2018 2020
Baseline 2016 Budget Adjustment
Net Public Sector Assets Per Capita (In US dollars)
-3,000
-2,000
-1,000
0
1,000
2,000
3,000
4,000
5,000
2006 2008 2010 2012 2014 2016 2018 2020 2022 2024 2026 2028 2030
Revenues Investment return ESIExcess withdrawal External financing Net inflows
PF Dynamics: 2016 Budget Scenario (flow) 1/(In millions of US dollars)
1/ Staff extrapolation from 2021.
-8,000-6,000-4,000-2,000
02,0004,0006,0008,000
10,00012,00014,00016,00018,00020,00022,000
2008
2009
2010
2011
2012
2013
2014
2015
2016
2017
2018
2019
2020
2021
2022
2023
2024
2025
2026
2027
2028
2029
2030
PF Balance Debt Net balance
PF Dynamics: 2016 Budget Scenario(stock) 1/(In millions of US dollars)
1/ Staff extrapolation from 2021.
-3,000
-2,000
-1,000
0
1,000
2,000
3,000
4,000
5,000
2006 2008 2010 2012 2014 2016 2018 2020 2022 2024 2026 2028 2030
Revenues Investment return ESIExcess withdrawal External Financing Net inflows
PF Dynamics: Baseline Scenario (flow)(In millions of US dollars)
Source: IMF staff calculations
-8,000-6,000-4,000-2,000
02,0004,0006,0008,000
10,00012,00014,00016,00018,00020,00022,000
2008
2009
2010
2011
2012
2013
2014
2015
2016
2017
2018
2019
2020
2021
2022
2023
2024
2025
2026
2027
2028
2029
2030
PF Balance Debt Net balance
PF Dynamics: Baseline Scenario (stock)(In millions of US dollars)
-3,000
-2,000
-1,000
0
1,000
2,000
3,000
4,000
5,000
2006 2008 2010 2012 2014 2016 2018 2020 2022 2024 2026 2028 2030
Revenues Investment return ESIExcess withdrawal External Financing Net inflows
PF Dynamics: Adjustment Scenario (flow)(In millions of US dollars)
Source: IMF staff calculations
-8,000-6,000-4,000-2,000
02,0004,0006,0008,000
10,00012,00014,00016,00018,00020,00022,000
2008
2009
2010
2011
2012
2013
2014
2015
2016
2017
2018
2019
2020
2021
2022
2023
2024
2025
2026
2027
2028
2029
2030
PF Balance Debt Net balance
PF Dynamics: Adjustment Scenario (stock)(In millions of US dollars)
-30
-20
-10
0
10
20
30
40
50
2008 2010 2012 2014 2016 2018 2020
Baseline 2016 Budget Adjustment
Current Account Balance(In percent of GDP)
DEMOCRATIC REPUBLIC OF TIMOR-LESTE
12 INTERNATIONAL MONETARY FUND
14. More could be done to improve spending efficiency. Although the overall allocation to health and education expenditures has been increasing up to 2015, health expenditure appears low in comparison to peers, and there is a need to increase the returns on higher education spending.4 More detailed analysis at the sector level on these social spending components and outcomes would contribute to better resource allocation. The government should also take the lead in exercising strong wage restraint to avoid losing cost competitiveness. Further, the extension of fiscal autonomy to Oecusse ZEESM needs to be carefully managed to minimize risks of off-budget expenditures and the accumulation of contingent liabilities.
15. Domestic non-oil revenues need to be mobilized urgently. Ongoing work by the Fiscal Reform Commission to introduce a value-added tax (VAT) regime together with the review of income tax and other taxes is a step in the right direction to achieve the government’s goal of raising domestic non-oil revenues from an average of 11 percent of non-oil GDP in 2011–15 to 15 percent of non-oil GDP by 2020. In the near term, focus needs to be given to broadening the tax base and enhancing tax compliance. While more details in the design and implementation of the VAT and other taxes still need to be fleshed out, staff recommended the following:
VAT. A single-rate VAT, with exemptions restricted to a minimum and a sufficiently high registration threshold at the start to exclude most small businesses in consideration of the limited tax administration capacity, should be implemented as soon as feasible. The choice of the tax rate should be primarily driven by revenue mobilization needs, and go beyond replacing current service tax, sales tax, and customs duties.
Other taxes. Staff also recommended raising other taxes to bolster revenue. IMF technical assistance has recommended that higher excise duties on tobacco and petroleum products and raising the income tax rate from 10 to 15 percent could yield additional tax revenue of close to 2 percent of GDP. Staff also welcomed the authorities’ plans to review and streamline existing tax holidays on investment.
16. The PF is a source of confidence for the economy and should be preserved as an endowment fund. The authorities remain committed to a transparent and accountable fiscal framework that has allowed oil revenues to be saved through the PF—an internationally well-regarded institution. The ESI, which functions as a fiscal rule, was intended by the Timor-Leste government to act as an annual withdrawal limit from the PF, so that the PF assets could be preserved in real terms and generate a permanent level of investment income to support government expenditures. While some drawdown of the assets of the PF is justified for infrastructure investment in order to diversify the economy and boost growth potential, the assets also need to be preserved at a level that is sufficient to provide adequate investment income for future generations. The experience of other well-managed natural resource funds suggests that strong fiscal discipline and binding fiscal rules are needed. In this context, the adoption of the policies under the 4 See World Bank Group (2013), FY2013 – 2017 Country Partnership Strategy: The Democratic Republic of Timor-Leste” February 19, 2013.
DEMOCRATIC REPUBLIC OF TIMOR-LESTE
INTERNATIONAL MONETARY FUND 13
adjustment scenario will facilitate a return to strict compliance of the fiscal rule under the ESI within a feasible timeframe. At the same time, consideration could be given to revising certain aspects of the PF legal framework to strengthen the withdrawal rule and reduce room for discretion.
17. Greater use of concessional loans could help preserve the PF. Staff welcomes the government’s plans to tap more concessional borrowing to finance large infrastructure projects instead of just drawing down the PF. The financing gap could be met by external loans, if the borrowing cost is lower than the opportunity cost of tapping into the PF as measured by the PF’s expected investment return, and guided by the Debt Sustainability Analysis (DSA). The discipline of debt sustainability monitoring by creditors may also come with the transfer of knowledge by these multilateral or bilateral institutions. So far, the government has been very conservative in its borrowing.
18. The debt sustainability assessment has deteriorated, and the risk of external debt distress has increased to moderate. Even though the baseline fiscal scenario does not entail breaches of any DSA threshold, stress tests resulted in breaches for all but one indicator. The increased risk of debt distress reflects the authorities’ plan to increase concessional borrowing to finance higher frontloaded capital expenditures, compared to their plans when the last DSA was undertaken in 2014. Higher concessional borrowing would however help preserve the assets of the PF by reducing the need for excess withdrawals. In this context, maintaining a sustainable fiscal framework (as outlined under staff’s adjustment scenario) is crucial to long-term debt sustainability.
19. Further strengthening of public financial management (PFM) capacity is needed to cement progress. The economic and social impact of public investment depends critically on its efficiency. Recent analytical work by the IMF5 shows that economic dividends from closing the efficiency gap can be substantial. Improvements in public investment management (related to planning, allocation and implementation) could increase the efficiency and productivity of capital spending. The Public Investment Management Assessment (PIMA) tool developed by the IMF would help identify reform priorities and develop capacity building strategies. The recently adopted PPP policy for the Tibar Port could provide a strong template for future PPPs.
Authorities’ Views
20. The authorities consider total annual expenditure of US$1.4 billion in the medium term to be insufficient, given the urgency to develop infrastructure. The government remains committed to its medium-term infrastructure spending plans as outlined in the SDP as they consider the infrastructure investments to be essential to economic diversification and raising the potential growth of the economy. Lower spending would constrain the authorities’ ability to pursue any new opportunities to boost potential growth. They highlighted the need to improve infrastructure to attract FDI for achieving economic diversification.
5 IMF(2015), Making Public Investment More Efficient, June 11, 2015.
DEMOCRATIC REPUBLIC OF TIMOR-LESTE
14 INTERNATIONAL MONETARY FUND
21. The authorities concur on the need to ensure the quality of investment spending through robust feasibility assessments and appraisal of public investment projects. They seek the Fund’s support to determine the desirable level of infrastructure investment. The authorities also pointed out that while the Tasi Mane project focuses on facilitating the development of oil and gas industries, it will also boost general development along the south coast. Further, a significant share of the government’s total capital spending is channeled towards improving overall infrastructure in the south coast. They recognized the risk of moving the Tasi Mane project ahead and broadly shared the staff’s recommendation (see paragraph 31) to remain flexible in the timing and scope of the project’s implementation, to better manage risks by taking into account changing economic conditions and opportunities.
22. The authorities shared staff’s view on the need for timely efforts to mobilize domestic revenue. Fiscal reform plans in the pipeline include the introduction of the VAT, which will boost domestic revenues and further bolster fiscal sustainability.
23. The authorities consider the risk of debt distress to be contained despite higher borrowing, but see value in further strengthening debt management capacity. The authorities reiterated their commitment to preserve the assets of the PF and the government’s plan to utilize more concessional financing for large infrastructure projects. Although the projected external borrowing to finance the government’s infrastructure spending over the next few years is considerable, the authorities view the borrowing projections under the baseline scenario as close to the upper limit of the financing needed. Actual borrowing will be determined by the pace of project implementation. The accumulated savings in the PF also provide ample buffer against debt distress. Furthermore, higher growth resulting from infrastructure development is expected to contribute towards ensuring debt sustainability. The authorities have also expressed interest in Fund TA to strengthen capacity in debt management.
B. Financial Policy: Safeguarding Stability and Inclusion
24. Limited progress in financial intermediation is a key constraint on inclusive growth. There are four banks, of which three are branches of foreign banks (incorporated in Australia, Indonesia, and Portugal) and one is a locally incorporated, wholly government-owned bank, Banco Nacional de Comércio de Timor-Leste (BNCTL). BNCTL is the smallest bank but has a predominantly Timorese customer base, in part because it was a micro-finance institution from 2001 until it was transformed into a bank in 2011 with an initial capital of $2 million. The banking system is highly liquid and well capitalized with BNCTL reporting a capital adequacy ratio of 45 percent as of September 2015, bolstered by a $10 million capital injection by the government in 2014. However, a very large portion of the economy is cash-based, making payments inefficient and insecure. While the soundness of banks’ lending remains fundamental, the strong deposit growth and continued decline in loans-to-deposits ratio suggest that banks are falling short in their role of financial intermediation. Challenges remain in expanding bank credit to SMEs and rural businesses. Private sector development is also perceived to be constrained by limited access to long-term credit at affordable rates.

DEMOCRATIC REPUBLIC OF TIMOR-LESTE
INTERNATIONAL MONETARY FUND 15
25. The progress in promoting financial inclusion is commendable. Banco Central de Timor-Leste (BCTL)’s Financial Sector Master Plan, launched in August 2014, set out a roadmap for financial sector development to 2025 (Appendix 3). The installation of the Automatic Payment System and passage of the Law on National Payments System are major milestones towards achieving a more efficient and secure interbank payments system. Timor-Leste has also adopted a bank-based model for mobile banking and all four banks are currently in the process of introducing branchless banking facilities. The recent publication of the Financial System Review by the central bank is a further step in reviewing the stability of the financial system and monitoring progress towards the sound development of the financial sector.
26. Enhancing financial inclusion needs to strike a balance with safeguarding financial stability. It is commendable that the BCTL is strengthening its capacity in banking supervision, supported by TA from development partners. A strategy for resolving legacy NPLs (concentrated in one commercial bank) should be put in place as soon as practical. The BCTL’s aim to enhance its role as lender of last resort with clear protocols and an appropriate legal framework is commendable. Although the conceptualization of a development bank is still at an early stage, the authorities should be vigilant to the risk of contingent fiscal liabilities. International experiences also suggest that a development bank should have a clear mandate and strong governance structure. Staff and the BCTL agreed that financial sector entities in the Oecusse ZEESM should remain under the supervision of the central bank.
27. Efforts to strengthen the Anti-Money Laundering/Combating the Financing of Terrorism (AML/CFT) framework should continue. Timor-Leste has completed the national risk assessment and the final report is expected to be released in 2016. The BCTL is in the process of issuing revised instructions for banks and other financial institutions on enhanced due diligence requirements for high-risk customers in line with the FATF standard.
28. The use of the U.S. dollar as legal tender remains appropriate in light of institutional capacity constraints and limited financial development. The current U.S. dollar regime has served Timor-Leste well, given the country’s high dependence on oil exports. A review of the exchange rate regime, to study the merits of adopting its own currency as set out in the SDP, will be conducted by the central bank this year. Staff underscored that financial sector and institutional developments would be needed to pave the way for any potential exchange rate regime change to enhance external competitiveness as the economy diversifies away from oil and gas.
Authorities’ Views
29. The authorities broadly concurred with the staff’s assessment of the financial sector. They noted that banks’ balance sheets are sound, but lending growth has been lagging behind deposit growth. They shared the staff’s recommendation to resolve legacy NPLs as soon as feasible. Following the Financial Sector Master Plan, the central bank is working closely with banks to increase their presence in all the municipalities. The central bank also launched the National Strategic Plan on financial literacy to provide a framework to raise awareness at the national level. The authorities recognized that not all international experiences of development banks have been positive, and that

DEMOCRATIC REPUBLIC OF TIMOR-LESTE
16 INTERNATIONAL MONETARY FUND
a development bank should be run in a way that supports market competition and limits contingent liabilities to the government. They seek the support of development partners in conducting a review of the exchange rate regime as a longer-term policy option.
C. Structural Reforms: Enabling Private Sector Diversification
30. Medium-term growth depends critically on economic diversification. Similar to other small states, the Timorese economy faces impediments to development including low human capital, poor infrastructure and connectivity, a small domestic market, limited financial sector development, and high business cost structure. The diversification imperative has gained added urgency in light of the near depletion of oil production in existing oil fields. The associated reduction of fiscal resources also implies that the public sector would increasingly have less capacity to boost growth through government spending and procurements generated from public investment projects. Continuing efforts to improve health, education, and quality of life, including under the rubric of the Sustainable Development Goals (SDGs), would also help to lift potential growth (Appendix 4).
31. Some degree of government involvement in industrial development is warranted in cases of missing and incomplete markets. However, this should be well-targeted and implemented under appropriate risk-sharing arrangements to minimize contingent liabilities. Efforts aimed at economic diversification present an opportunity to reorient the economy away from the oil sector. There is concern about the economic viability of the state-initiated development of key petroleum projects without an agreed commitment with the oil companies to develop new oil fields. In this context, staff urged the authorities to be flexible in the timing and speed of implementation, taking into account changing economic conditions and opportunities.
32. Catalyzing private sector development will need an enabling business environment and measures to boost competitiveness. Timor-Leste, with its young labor force, is well placed to take advantage of global and regional integration trends and has applied for ASEAN membership. To maximize benefits from these opportunities, the private sector should leverage Timor-Leste’s comparative advantage in labor-intensive sectors such as agriculture and tourism through better branding and marketing, product innovation, and explore niche markets. A recent ADB study6 also emphasizes the need to build agricultural markets and develop tourism which would require improving crop quality, productivity (low relative to peers), and supply consistency, while ensuring price incentives and land tenure arrangements support farm investment and production. Improving tourism data collection, including market perceptions of Timor-Leste as a tourism destination, is also key. In this regard, the priority of the government in creating a business and investment climate to develop a diversified private sector is commendable and the role of the government as a facilitator could be enforced through increased dialogue and partnership with the private sector. At the same
6 ADB (2015), “A Private Sector Assessment for Timor-Leste: Growing the Non-oil Economy.”

DEMOCRATIC REPUBLIC OF TIMOR-LESTE
INTERNATIONAL MONETARY FUND 17
time, efforts to increase cost effectiveness are important in order to restore external competitiveness (Box 2). The mission highlighted the following priority areas. Specifically:
Business climate. Strengthening the enforcement of contracts, resolving insolvency, registering property, and improving the ease of getting credit, would help to bolster the ease of doing business (Figure 5). In particular, accelerating the ongoing work on the reform of land law to clarify land ownership would help to improve the availability of collateral for lending and facilitate investments.
Wage competitiveness. Relatively high wages in Timor-Leste, in part reflecting the public service’s minimum wage level, could discourage FDI in labor-intensive sectors (Box 2). Public sector wages should grow in line with productivity gains. This would also have an important impact on private sector wages, given that the public sector wage has an important role in private sector wage determination.
Labor market. Continued emphasis on quality of spending and outcomes in health and education, including strengthening vocational and technical education, are needed to strengthen human capital formation (Figure 6 and Appendix 5).
Authorities’ Views
33. The authorities reiterated their commitment to further implementing structural reforms, as set out in the SDP. Currently, the government is reviewing the investment law, and land and property law to attract more FDI and promote the commercial use of land as collateral in borrowing/lending. They emphasized that development of essential infrastructure is a priority to lay the ground for economic diversification.
D. Statistics and Technical Assistance
34. The timeliness and quality of data continue to pose challenges to surveillance and staff supports ongoing efforts to improve statistical capacity. With extensive TA from the Fund and other development partners, much progress has been made in improving statistics. Ongoing key issues include:
National Accounts. Improvements have occurred in recent years with TA and from donor-provided experts. Improving timeliness and further development of the methodology are necessary, given source data weaknesses. Continued efforts to close the divergence between expenditure and production based estimates are needed, including to start the compilation of producer prices needed for measuring real national product. Staff welcomed the plan to publish quarterly GDP data and urged closer cooperation and institutional support to the General Directorate of Statistics for timely compilation of quarterly estimates.
DEMOCRATIC REPUBLIC OF TIMOR-LESTE
18 INTERNATIONAL MONETARY FUND
0510152025303540
0
500
1,000
1,500
2,000
2,500
3,000Average annual change for 2013-15 (RHS)
Minimum wage (annualized)
Minimum Wages in Comparator Countries 1/(In US$; annualized) (In percent)
1/ No change in minimum wage for Bangladesh, China, and Timor-Leste between 2013-15.
80
90
100
110
120
130
140
150
160
08 09 10 11 12 13 14 15
REER
NEER
(2010=100)Effective Exchange Rates
↑ appreciation
↓ depreciation
Box 2. Timor-Leste: External Competitiveness
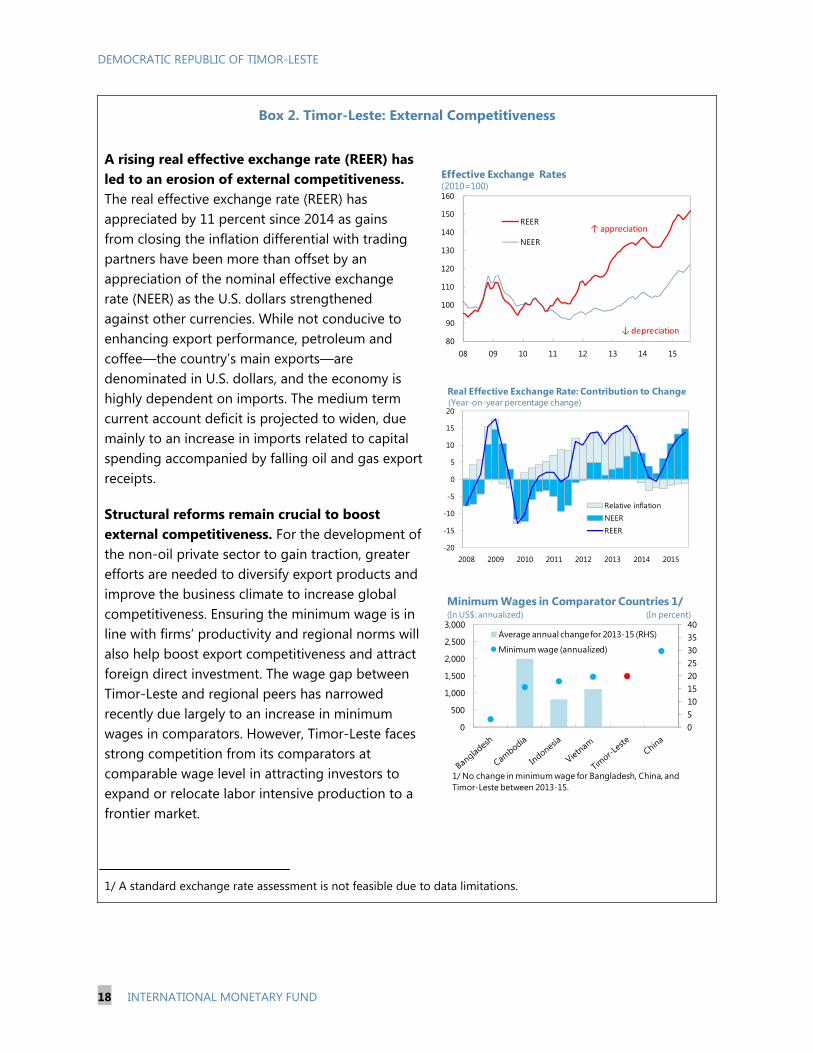
A rising real effective exchange rate (REER) has led to an erosion of external competitiveness. The real effective exchange rate (REER) has appreciated by 11 percent since 2014 as gains from closing the inflation differential with trading partners have been more than offset by an appreciation of the nominal effective exchange rate (NEER) as the U.S. dollars strengthened against other currencies. While not conducive to enhancing export performance, petroleum and coffee—the country’s main exports—are denominated in U.S. dollars, and the economy is highly dependent on imports. The medium term current account deficit is projected to widen, due mainly to an increase in imports related to capital spending accompanied by falling oil and gas export receipts.
Structural reforms remain crucial to boost external competitiveness. For the development of the non-oil private sector to gain traction, greater efforts are needed to diversify export products and improve the business climate to increase global competitiveness. Ensuring the minimum wage is in line with firms’ productivity and regional norms will also help boost export competitiveness and attract foreign direct investment. The wage gap between Timor-Leste and regional peers has narrowed recently due largely to an increase in minimum wages in comparators. However, Timor-Leste faces strong competition from its comparators at comparable wage level in attracting investors to expand or relocate labor intensive production to a frontier market.
1/ A standard exchange rate assessment is not feasible due to data limitations.
-20
-15
-10
-5
0
5
10
15
20
2008 2009 2010 2011 2012 2013 2014 2015
Relative inflationNEER
REER
Real Effective Exchange Rate: Contribution to Change(Year-on-year percentage change)
DEMOCRATIC REPUBLIC OF TIMOR-LESTE
INTERNATIONAL MONETARY FUND 19
Poverty. Regular and timely poverty measurements are needed for poverty analysis and policyreview and formulation. The last official poverty indicators were based on 2007 data. A livingstandards measure survey that is underway with support from the World Bank will provide thebasis to update poverty related data.
35. There is a large need for TA and training to support the government’s reform anddevelopment agenda, and to improve human capital. The IMF is providing TA in areas of its expertise, in close coordination with other development partners. TAs delivered in 2015 include on-site examination of commercial banks, government finance statistics, and external sector statistics. The IMF also organized a regional workshop—with the participation of Timorese mid-level officials—to strengthen fiscal framework and planning capacity. Capacity development initiatives in the pipeline include TA on debt management, support for assessment of public infrastructure investment, and the continuation of TA on strengthening financial institution oversight.
STAFF APPRAISAL 36. Timor-Leste is facing difficult policy challenges due to the sharp fall in oil revenue andlarge developmental needs. Against the backdrop of low oil prices and a weakening external environment, growth has moderated and inflation is subdued. However, low oil revenue and plans to significantly frontload public investment are leading to a significant deterioration in fiscal and external positions. While savings in the PF have provided some cushion to the reduction of oil income, the authorities’ spending plan is unsustainable, as at the current rate of withdrawals, the PF will be depleted in the long term. At the same time, large infrastructure and social development needs require efficient allocation of public investment.
37. Fiscal consolidation is needed to safeguard long-term fiscal sustainability. Achievingfiscal sustainability requires scaling back large front-loaded public investment plans in line with implementation capacity, rationalizing recurrent spending, strengthening non-oil revenues, and adhering to a medium-term fiscal consolidation plan. In addition, there should be better prioritization of public investment plans, focusing on high-return infrastructure projects through rigorous investment appraisal. Optimizing the composition and quality of spending to help close Timor-Leste’s infrastructure gap is key to long-term fiscal sustainability. The assets of the PF need to be preserved to provide adequate investment income for future generations. Higher utilization of concessional financing for large infrastructure projects would reduce reliance on excess withdrawals from the PF and support greater discipline in investment spending. The introduction of the VAT will be instrumental in achieving the government’s target of raising non-oil revenues to 15 percent of non-oil GDP by 2020 and help reduce reliance on the PF.
38. Medium-term growth depends crucially on economic diversification throughcatalyzing private sector development. The diversification imperative has gained added urgency in light of the near depletion of oil production in existing oil fields and the associated reduction of fiscal resources. Catalyzing the development of the nascent non-oil private sector will need an enabling business environment, improvement in social conditions, and investment in human capital
DEMOCRATIC REPUBLIC OF TIMOR-LESTE
20 INTERNATIONAL MONETARY FUND
to improve competitiveness. The private sector should leverage Timor-Leste’s comparative advantage in sectors such as agriculture and tourism through better branding and marketing, product innovation, and exploration of niche markets.
39. Financial inclusion will help enhance economic growth but needs to strike an appropriate balance with safeguarding financial stability. The progress in promoting financial inclusion is promising. The financial sector is developing and is sound but continued effort in strengthening regulatory and supervisory capacity and improving central bank functions is key. A strategy to fully resolve legacy NPLs should be put place as soon as practical.
40. The use of the U.S. dollar as legal tender has served Timor-Leste well. Going forward, financial sector and institutional developments would be needed to pave the way for any potential change in the monetary and exchange rate regime.
41. Continued efforts are required to improve statistical capacity, as limitations in this area continue to pose challenges to surveillance. Further work is needed to increase the quality and timeliness of data, which are crucial to policy formulation. The authorities should further leverage TA from the Fund and other development partners to this end.
42. It is expected that the next Article IV consultation with Timor-Leste will be held on the standard 12-month cycle.
DEMOCRATIC REPUBLIC OF TIMOR-LESTE
INTERNATIONAL MONETARY FUND 21
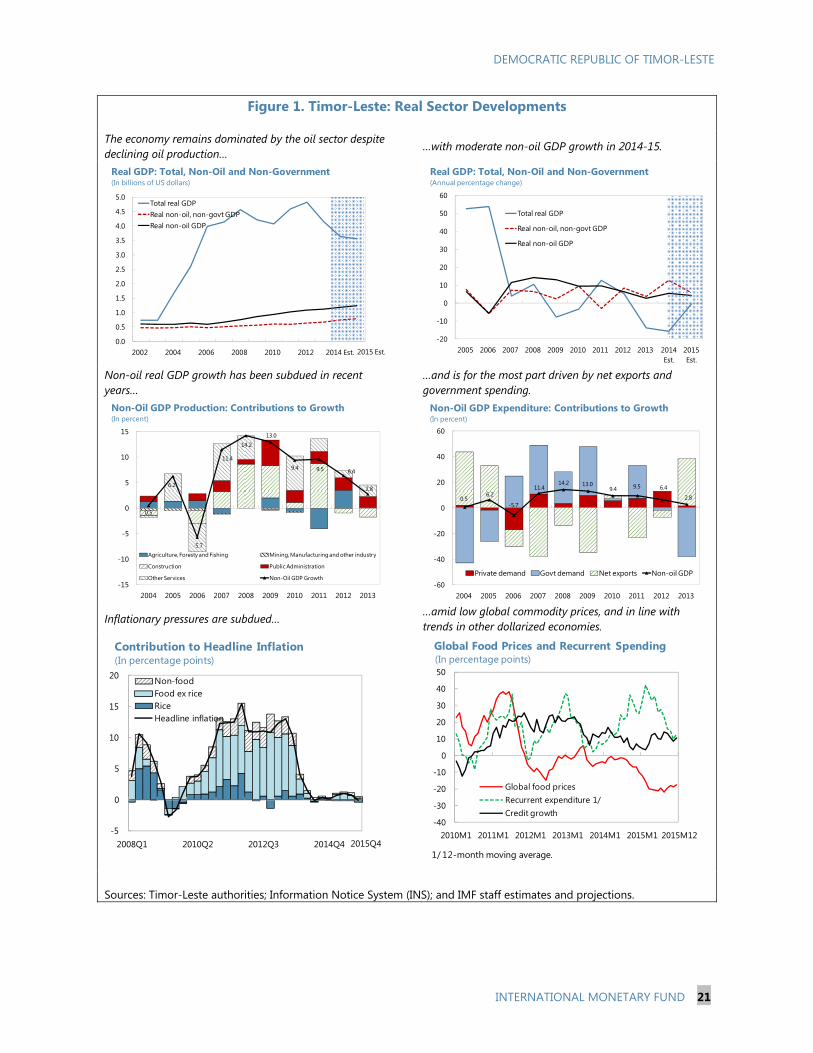
Figure 1. Timor-Leste: Real Sector Developments
The economy remains dominated by the oil sector despite declining oil production…
…with moderate non-oil GDP growth in 2014-15.
Non-oil real GDP growth has been subdued in recent years…
…and is for the most part driven by net exports and government spending.
Inflationary pressures are subdued… …amid low global commodity prices, and in line with trends in other dollarized economies.
Sources: Timor-Leste authorities; Information Notice System (INS); and IMF staff estimates and projections.
0.0
0.5
1.0
1.5
2.0
2.5
3.0
3.5
4.0
4.5
5.0
2002 2004 2006 2008 2010 2012 2014 Est.
Total real GDPReal non-oil, non-govt GDPReal non-oil GDP
Real GDP: Total, Non-Oil and Non-Government(In billions of US dollars)
2015 Est.
-20
-10
0
10
20
30
40
50
60
2005 2006 2007 2008 2009 2010 2011 2012 2013 2014 Est.
2015 Est.
Total real GDP
Real non-oil, non-govt GDP
Real non-oil GDP
Real GDP: Total, Non-Oil and Non-Government(Annual percentage change)
0.5
6.2
-5.7
11.4
14.213.0
9.4 9.5 6.4
2.8
-15
-10
-5
0
5
10
15
2004 2005 2006 2007 2008 2009 2010 2011 2012 2013
Agriculture, Foresty and Fishing Mining, Manufacturing and other industry
Construction Public Administration
Other Services Non-Oil GDP Growth
Non-Oil GDP Production: Contributions to Growth (In percent)
0.56.2
-5.7
11.414.2 13.0
9.4 9.5 6.4
2.8
-60
-40
-20
0
20
40
60
2004 2005 2006 2007 2008 2009 2010 2011 2012 2013
Private demand Govt demand Net exports Non-oil GDP
Non-Oil GDP Expenditure: Contributions to Growth(In percent)
-5
0
5
10
15
20
2008Q1 2010Q2 2012Q3 2014Q4
Non-foodFood ex riceRiceHeadline inflation
(In percentage points)Contribution to Headline Inflation
2015Q4
-40
-30
-20
-10
0
10
20
30
40
50
2010M1 2011M1 2012M1 2013M1 2014M1 2015M1
Global food pricesRecurrent expenditure 1/Credit growth
(In percentage points)Global Food Prices and Recurrent Spending
1/ 12-month moving average.
2015M12
DEMOCRATIC REPUBLIC OF TIMOR-LESTE
22 INTERNATIONAL MONETARY FUND
Figure 2. Timor-Leste: Developments in the Petroleum Fund 1/
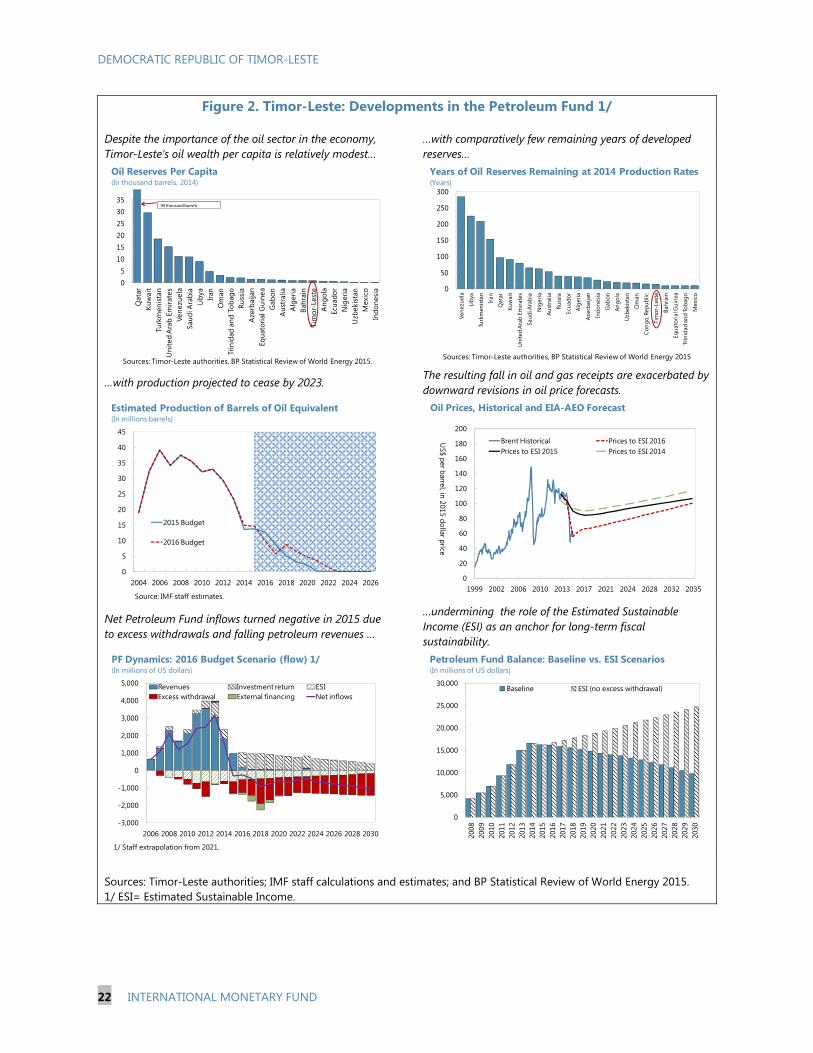
Despite the importance of the oil sector in the economy, Timor-Leste’s oil wealth per capita is relatively modest…
…with comparatively few remaining years of developed reserves…
…with production projected to cease by 2023. The resulting fall in oil and gas receipts are exacerbated by downward revisions in oil price forecasts.
Net Petroleum Fund inflows turned negative in 2015 due to excess withdrawals and falling petroleum revenues …
…undermining the role of the Estimated Sustainable Income (ESI) as an anchor for long-term fiscal sustainability.
Sources: Timor-Leste authorities; IMF staff calculations and estimates; and BP Statistical Review of World Energy 2015. 1/ ESI= Estimated Sustainable Income.
05
101520253035
Qat
arKu
wai
tTu
rkm
enis
tan
Uni
ted
Ara
b Em
irate
sVe
nezu
ela
Saud
i Ara
bia
Liby
aIra
nO
man
Trin
idad
and
Tob
ago
Russ
iaA
zerb
aija
nEq
uato
rial G
uine
aG
abon
Aus
tral
iaA
lger
iaBa
hrai
nTi
mor
-Les
teA
ngol
aEc
uado
rN
iger
iaU
zbek
ista
nM
exic
oIn
done
sia
Oil Reserves Per Capita(In thousand barrels, 2014)
Sources: Timor-Leste authorities, BP Statistical Review of World Energy 2015.
93 thousand barrels
0
50
100
150
200
250
300
Vene
zuel
a
Liby
a
Turk
men
ista
n
Iran
Qat
ar
Kuw
ait
Uni
ted
Arab
Em
irate
s
Saud
i Ara
bia
Nig
eria
Aust
ralia
Russ
ia
Ecua
dor
Alge
ria
Azer
baija
n
Indo
nesi
a
Gab
on
Ango
la
Uzb
ekis
tan
Om
an
Cong
o, R
epub
lic
Tim
or-L
este
Bahr
ain
Equa
toria
l Gui
nea
Trin
idad
and
Toba
go
Mex
ico
Sources: Timor-Leste authorities, BP Statistical Review of World Energy 2015
Years of Oil Reserves Remaining at 2014 Production Rates (Years)
0
5
10
15
20
25
30
35
40
45
2004 2006 2008 2010 2012 2014 2016 2018 2020 2022 2024 2026
2015 Budget
2016 Budget
Estimated Production of Barrels of Oil Equivalent (In millions barrels)
Source: IMF staff estimates.
0
20
40
60
80
100
120
140
160
180
200
1999 2002 2006 2010 2013 2017 2021 2024 2028 2032 2035
Brent Historical Prices to ESI 2016Prices to ESI 2015 Prices to ESI 2014
Oil Prices, Historical and EIA-AEO Forecast
US$ perbarrel, in 2015 dollar price
-3,000
-2,000
-1,000
0
1,000
2,000
3,000
4,000
5,000
2006 2008 2010 2012 2014 2016 2018 2020 2022 2024 2026 2028 2030
Revenues Investment return ESIExcess withdrawal External financing Net inflows
PF Dynamics: 2016 Budget Scenario (flow) 1/(In millions of US dollars)
1/ Staff extrapolation from 2021.
0
5,000
10,000
15,000
20,000
25,000
30,000
2008
2009
2010
2011
2012
2013
2014
2015
2016
2017
2018
2019
2020
2021
2022
2023
2024
2025
2026
2027
2028
2029
2030
Baseline ESI (no excess withdrawal)
Petroleum Fund Balance: Baseline vs. ESI Scenarios (In millions of US dollars)
Sources: IMF staff calculations

DEMOCRATIC REPUBLIC OF TIMOR-LESTE
INTERNATIONAL MONETARY FUND 23
Figure 3. Timor-Leste: Fiscal Developments
Overall fiscal balance is estimated to become a smallersurplus in 2015....
…accompanied by a further deterioration in the non-oil balance.
The importance of recurrent spending in the budget has continued to grow at the expense of capital expenditure…
…reflecting the rising importance of current transfers…
…which have also increased significantly in size relative to GDP.
Budgeted expenditure continues to be under-executed on account of capacity constraints.
-10
0
10
20
30
40
50
60
70
80
90
2004 2006 2008 2010 2012 2014
Total revenue and grants
Expenditure (incl. donor projects)
Overall balance
Overall Balance(In percent of GDP)
2015 Est.
-70
-50
-30
-10
10
30
50
70
90
2004 2006 2008 2010 2012 2014
Domestic revenue and grants
Expenditure (incl. donor projects)
Non-oil balance
Non-Oil Balance(In percent of GDP)
2015 Est.
0
10
20
30
40
50
60
70
80
90
2002 2004 2006 2008 2010 2012 2014
Recurrent Capital
Expenditure Shares(In percent of expenditure, excl. donor projects)
2015 Est.
0
200
400
600
800
1000
1200
2008 2009 2010 2011 2012 2013 2014 2015
Wages and salaries Goods and services Current transfers
Recurrent Spending(In million of US dollars)
Sources: Ministry of Finance of Timor-Leste; IMF staff compilation
0
5
10
15
20
25
30
35
2008 2010 2012 2014
Current transfers
Subsidies 1/
Transfers and Subsidies(In percent of non-oil GDP)
2015 1/ Include rice and electricity subsidies.
50
60
70
80
90
100
2008 2009 2010 2011 2012 2013 2014 2015
Total Average 2008-15
Expenditure Execution Rates: Total Budget(In percent)
Est.

DEMOCRATIC REPUBLIC OF TIMOR-LESTE
24 INTERNATIONAL MONETARY FUND
Figure 4. Timor-Leste: Financial Developments
The banking system remains small relative to the size of the economy.
Private credit growth has lagged behind deposit growth.
Liquidity in the banking system remains high... …and growth in private sector credit recovered in 2015, driven by lending to the construction sector.
High interest rate spreads suggest persistent inefficiencies in the domestic financial system…
...despite steadily increasing competition for market share among financial institutions.
Sources: Central Bank of Timor-Leste; and IMF, Integrated Monetary Database.
0
5
10
15
20
25
30
2006 2007 2008 2009 2010 2011 2012 2013 2014 2015
Private Credit
Private credit minus NPLs
Credit and Credit less Non-Performing Loans(In percent of non-oil GDP)
Sources: Central Bank of Timor-Leste,and IMF, Integrated Monetary Database.
-20
-10
0
10
20
30
40
50
60
2006 2007 2008 2009 2010 2011 2012 2013 2014 2015
Private credit growth
Deposit growth
M2 Money Growth
Credit and Deposit Growth(Year-on-year percentage change)
Sources: Central Bank of Timor-Leste and IMF, Integrated Monetary Database.
10
20
30
40
50
60
70
80
2006 2007 2008 2009 2010 2011 2012 2013 2014 2015
Loans/Deposit rate (In percent)
Overseas Placements (In percent of total assets)
Source: Central Bank of Timor-Leste.
Liquidity Ratios
-30
-20
-10
0
10
20
30
40
2007 2008 2009 2010 2011 2012 2013 2014 2015
Individuals ConstructionTrade and Finance OtherGrowth Rate
Loans to Private Sector: Contributions to Growth (Annual Percentage change)
Sources: Commercial banks; BCTL; and IMF staff calculation.
0
2
4
6
8
10
12
14
16
18
2006 2007 2008 2009 2010 2011 2012 2013 2014 2015
Lending rate
Deposit rate
Lending and Deposit Rates(In percent per annum)
Sources: Central Bank of Timor-Leste and IMF, Integrated Monetary Database.
0
20
40
60
80
100
120
Dec-08 Dec-09 Dec-10 Dec-11 Dec-12 Dec-13 Dec-14 Jun-15
BNCTL Caixa Geral de Depositos ANZ Bank Bank Mandiri
Share of Bank Assets(In percent of total assets)
Source: Central Bank of Timor Leste.

DEMOCRATIC REPUBLIC OF TIMOR-LESTE
INTERNATIONAL MONETARY FUND 25
Figure 5. Timor-Leste: Business Environment and Governance
The governance of the Petroleum Fund is strong by international standards...
…and measures of government effectiveness, regulatory quality and political stability have strengthened…
…although much more needs to be done to make the domestic environment more conducive for business.
Improvements in ease of doing business remain limited...
…requiring greater competitiveness in most areas. Agriculture and services generate most of the employment, despite their small shares in the domestic economy.
Sources: Revenue Watch Institute, 2013; Worldwide Governance Index, 2015 update; the Global Competitiveness Index 2014-2015; and World Bank Development Indicators, latest available data.
0
10
20
30
40
50
60
70
80
90
100
Nor
way US
UK
Aust
ralia
Braz
ilM
exic
oCa
nada
Chile
Colo
mbi
aTr
in. &
Tob.
Peru
Indi
aTi
mor
-Les
teIn
done
sia
Gha
naLi
beria
Zam
bia
Ecua
dor
Kaza
khst
anVe
nezu
ela
Sout
h Af
rica
Russ
iaPh
ilipp
ines
Boliv
iaM
oroc
coM
ongo
liaTa
nzan
iaAz
erba
ijan
Iraq
Bots
wan
aBa
hrai
nG
abon
Gui
nea
Mal
a ysi
aSi
erra
Leo
neCh
ina
Yem
enEg
ypt
PNG
Nig
eria
Ango
laKu
wai
tVi
etna
mCo
n go
(DRC
)Al
geria
Moz
ambi
que
Cam
eroo
nSa
udi A
rabi
aAf
ghan
ista
nSo
uth
Suda
nZi
mba
bwe
Cam
bodi
aIra
nQ
atar
Liby
aEq
uat.
Gui
nea
Turk
men
ista
nM
yanm
ar
Resource Governance Index (Index ranges from 0 - 100, where higher is better' 2013)
0
1
2
3
Voice and Accountability
Political Stability and Absence of
Violence
Government Effectiveness
Regulatory Quality
Rule of Law
Control of Corruption
Timor-Leste
Developing Asia Avg. (excl. TLS)
Governance Indicators(Index rescaled: 0 = worst, 5 = best; 2014)
0
20
40
60
80
100
120
Tim
or-L
este
Mya
nmar
Kirib
ati
Mic
rone
sia,
Fed.
Sts
.Pa
pua
New
Gui
nea
Mar
shal
l Isl
ands
Pala
uLa
o PD
RIn
dia
Mal
dive
sCa
mbo
dia
Solo
mon
Isla
nds
Indo
nesi
a Sr
i Lan
kaPh
ilipp
ines
Nep
alSa
moa
Vanu
atu
Viet
nam Fiji
Chin
a Br
unei
To
nga
Bhut
anM
ongo
liaTh
aila
ndJa
pan
Mal
aysi
aAu
stra
liaTa
iwan
, Chi
naH
ong
Kong
SAR
, Chi
naKo
rea,
Rep
.N
ew Z
eala
ndSi
ngap
ore
Developing Asia, Doing Business Ranking (percentile, higher is better, 2016)
Members of ASEAN
020406080
100120140160180200
2016 2010
Ease of Doing Business Ranking: Timor Leste
Bett
er D
oing
Bus
ines
s
0
1
2
3
4
5
6
Institutions
Infrastructure
Macro environment
Health & primary education
Higher education & training
Goods mkt efficiency
Labor mkt efficiency
Financial mkt development
Technological readiness
Market size
Business sophistication
Innovation
Pillars of Global Competitiveness(Score 1-7, higher is better; 2014-2015)
TLS Developing Asia (average)
0
10
20
30
40
50
60
70
80
90
Employment share
GDP share
Employment and GDP Share(In percent; 2013)
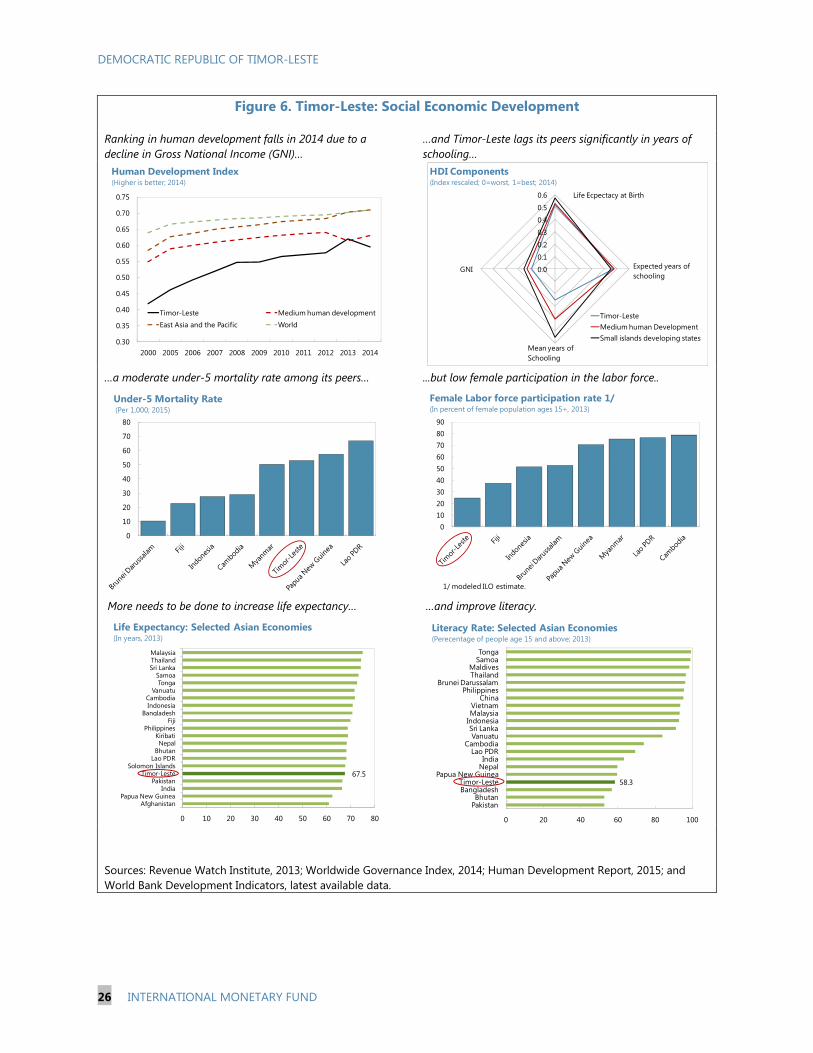
DEMOCRATIC REPUBLIC OF TIMOR-LESTE
26 INTERNATIONAL MONETARY FUND
Figure 6. Timor-Leste: Social Economic Development
Ranking in human development falls in 2014 due to a decline in Gross National Income (GNI)…
…and Timor-Leste lags its peers significantly in years of schooling…
…a moderate under-5 mortality rate among its peers… ...but low female participation in the labor force..
More needs to be done to increase life expectancy… …and improve literacy.
Sources: Revenue Watch Institute, 2013; Worldwide Governance Index, 2014; Human Development Report, 2015; and World Bank Development Indicators, latest available data.
0.30
0.35
0.40
0.45
0.50
0.55
0.60
0.65
0.70
0.75
2000 2005 2006 2007 2008 2009 2010 2011 2012 2013 2014
Timor-Leste Medium human developmentEast Asia and the Pacific World
Human Development Index(Higher is better; 2014)
0.0
0.1
0.2
0.3
0.4
0.5
0.6
Timor-LesteMedium human Development Small islands developing states
HDI Components (Index rescaled; 0=worst, 1=best; 2014)
Life Ecpectacy at Birth
Expected years of schooling
GNI
Mean years of Schooling
0
10
20
30
40
50
60
70
80
Under-5 Mortality Rate (Per 1,000; 2015)
0102030405060708090
Female Labor force participation rate 1/(In percent of female population ages 15+, 2013)
1/ modeled ILO estimate.
67.5
0 10 20 30 40 50 60 70 80
AfghanistanPapua New Guinea
IndiaPakistan
Timor-LesteSolomon Islands
Lao PDRBhutan
NepalKiribati
PhilippinesFiji
BangladeshIndonesiaCambodia
VanuatuTonga
SamoaSri LankaThailandMalaysia
Life Expectancy: Selected Asian Economies (In years, 2013)
0 20 40 60 80 100
PakistanBhutan
BangladeshTimor-Leste
Papua New GuineaNepalIndia
Lao PDRCambodia
VanuatuSri Lanka
IndonesiaMalaysiaVietnam
ChinaPhilippines
Brunei DarussalamThailandMaldives
SamoaTonga
Literacy Rate: Selected Asian Economies(Perecentage of people age 15 and above; 2013)
58.3
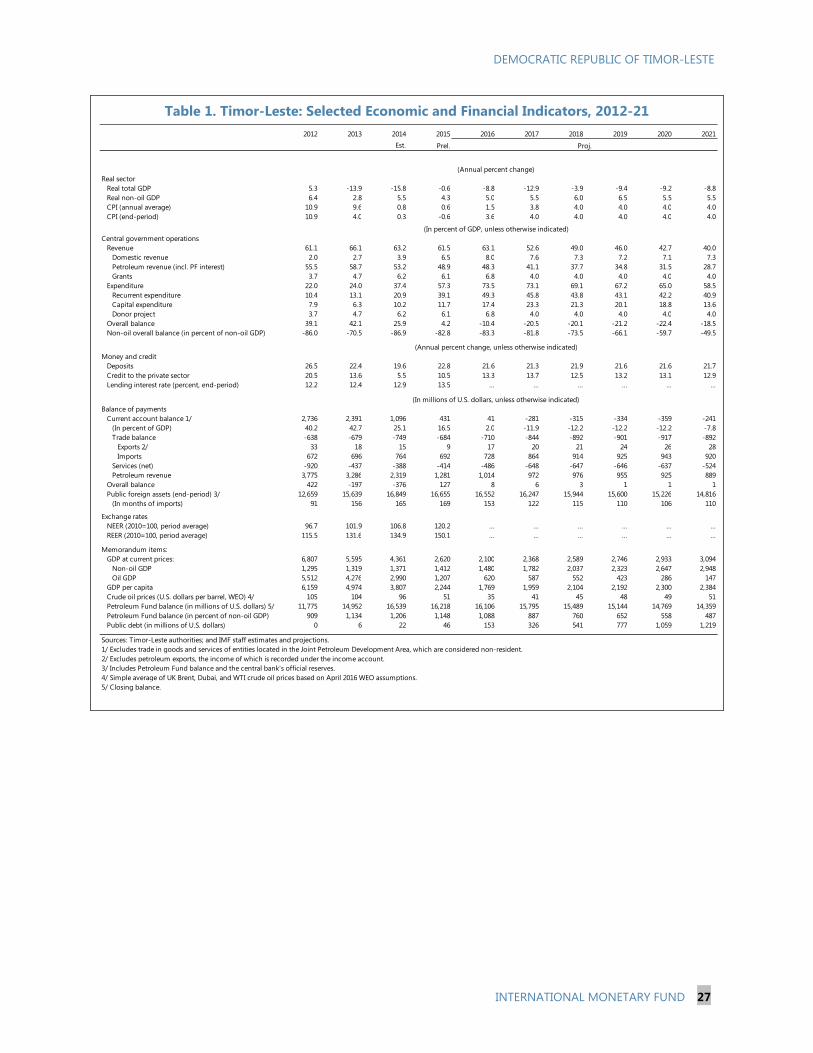
DEMOCRATIC REPUBLIC OF TIMOR-LESTE
INTERNATIONAL MONETARY FUND 27
Table 1. Timor-Leste: Selected Economic and Financial Indicators, 2012-21
2012 2013 2014 2015 2016 2017 2018 2019 2020 2021Est. Prel.
Real sector Real total GDP 5.3 -13.9 -15.8 -0.6 -8.8 -12.9 -3.9 -9.4 -9.2 -8.8Real non-oil GDP 6.4 2.8 5.5 4.3 5.0 5.5 6.0 6.5 5.5 5.5CPI (annual average) 10.9 9.6 0.8 0.6 1.5 3.8 4.0 4.0 4.0 4.0CPI (end-period) 10.9 4.0 0.3 -0.6 3.6 4.0 4.0 4.0 4.0 4.0
Central government operationsRevenue 61.1 66.1 63.2 61.5 63.1 52.6 49.0 46.0 42.7 40.0
Domestic revenue 2.0 2.7 3.9 6.5 8.0 7.6 7.3 7.2 7.1 7.3Petroleum revenue (incl. PF interest) 55.5 58.7 53.2 48.9 48.3 41.1 37.7 34.8 31.5 28.7Grants 3.7 4.7 6.2 6.1 6.8 4.0 4.0 4.0 4.0 4.0
Expenditure 22.0 24.0 37.4 57.3 73.5 73.1 69.1 67.2 65.0 58.5Recurrent expenditure 10.4 13.1 20.9 39.1 49.3 45.8 43.8 43.1 42.2 40.9Capital expenditure 7.9 6.3 10.2 11.7 17.4 23.3 21.3 20.1 18.8 13.6Donor project 3.7 4.7 6.2 6.1 6.8 4.0 4.0 4.0 4.0 4.0
Overall balance 39.1 42.1 25.9 4.2 -10.4 -20.5 -20.1 -21.2 -22.4 -18.5Non-oil overall balance (in percent of non-oil GDP) -86.0 -70.5 -86.9 -82.8 -83.3 -81.8 -73.5 -66.1 -59.7 -49.5
Money and creditDeposits 26.5 22.4 19.6 22.8 21.6 21.3 21.9 21.6 21.6 21.7Credit to the private sector 20.5 13.6 5.5 10.5 13.3 13.7 12.5 13.2 13.1 12.9Lending interest rate (percent, end-period) 12.2 12.4 12.9 13.5 … … … … … …
Balance of payments Current account balance 1/ 2,736 2,391 1,096 431 41 -281 -315 -334 -359 -241
(In percent of GDP) 40.2 42.7 25.1 16.5 2.0 -11.9 -12.2 -12.2 -12.2 -7.8Trade balance -638 -679 -749 -684 -710 -844 -892 -901 -917 -892
Exports 2/ 33 18 15 9 17 20 21 24 26 28Imports 672 696 764 692 728 864 914 925 943 920
Services (net) -920 -437 -388 -414 -486 -648 -647 -646 -637 -524Petroleum revenue 3,775 3,286 2,319 1,281 1,014 972 976 955 925 889
Overall balance 422 -197 -376 127 8 6 3 1 1 1Public foreign assets (end-period) 3/ 12,659 15,639 16,849 16,655 16,552 16,247 15,944 15,600 15,226 14,816
(In months of imports) 91 156 165 169 153 122 115 110 106 110
Exchange ratesNEER (2010=100, period average) 96.7 101.9 106.8 120.2 … … … … … …REER (2010=100, period average) 115.5 131.6 134.9 150.1 … … … … … …
Memorandum items:GDP at current prices: 6,807 5,595 4,361 2,620 2,100 2,368 2,589 2,746 2,933 3,094
Non-oil GDP 1,295 1,319 1,371 1,412 1,480 1,782 2,037 2,323 2,647 2,948Oil GDP 5,512 4,276 2,990 1,207 620 587 552 423 286 147
GDP per capita 6,159 4,974 3,807 2,244 1,769 1,959 2,104 2,192 2,300 2,384Crude oil prices (U.S. dollars per barrel, WEO) 4/ 105 104 96 51 35 41 45 48 49 51Petroleum Fund balance (in millions of U.S. dollars) 5/ 11,775 14,952 16,539 16,218 16,106 15,795 15,489 15,144 14,769 14,359Petroleum Fund balance (in percent of non-oil GDP) 909 1,134 1,206 1,148 1,088 887 760 652 558 487Public debt (in millions of U.S. dollars) 0 6 22 46 153 326 541 777 1,059 1,219
Sources: Timor-Leste authorities; and IMF staff estimates and projections.1/ Excludes trade in goods and services of entities located in the Joint Petroleum Development Area, which are considered non-resident.2/ Excludes petroleum exports, the income of which is recorded under the income account. 3/ Includes Petroleum Fund balance and the central bank's official reserves. 4/ Simple average of UK Brent, Dubai, and WTI crude oil prices based on April 2016 WEO assumptions.5/ Closing balance.
(In millions of U.S. dollars, unless otherwise indicated)
Proj.
(Annual percent change)
(In percent of GDP, unless otherwise indicated)
(Annual percent change, unless otherwise indicated)

DEMOCRATIC REPUBLIC OF TIMOR-LESTE
28 INTERNATIONAL MONETARY FUND
Table 2. Timor-Leste: Summary Operations of the Central Government, 2013-21 1/
2013 2014 2017 2018 2019 2020 2021
Est.2015
Rectification Budget
Estimate2016
BudgetProj.
Revenue 3,697.8 2,555.1 1,818.8 1,611.8 1,908.3 1,325.7 1,246.6 1,269.1 1,263.9 1,251.2 1,238.8Petroleum revenue 3,286.4 2,116.8 1,394.1 1,280.8 1,593.5 1,014.1 972.2 976.5 954.8 925.0 889.3
Oil/gas receipts 3,041.8 1,817.0 861.9 978.9 718.7 145.0 67.3 62.8 57.2 47.4 31.9Investment returns 2/ 244.6 299.8 532.2 301.9 874.8 869.1 904.9 913.7 897.6 877.6 857.4
Taxes 104.7 123.8 125.6 119.8 116.4 115.2 121.5 126.6 131.8 137.1 147.7Taxes on income, profits, and capital gains 40.2 53.0 45.7 53.3 52.3 52.3 56.3 60.4 64.5 68.5 73.9Taxes on goods & services 51.8 57.3 63.8 54.1 52.1 52.1 52.7 53.2 53.7 54.4 58.7Taxes on international trade & transactions 12.5 13.4 15.9 12.1 11.8 10.6 12.3 12.8 13.3 13.9 15.0
Grants 260.3 270.3 254.3 161.0 143.4 143.4 94.8 103.7 110.0 117.5 124.6Other revenue 46.4 44.2 44.8 50.3 55.0 53.0 58.1 62.4 67.3 71.6 77.3
Expenditure 1,341.7 1,629.4 1,824.3 1,501.2 1,705.6 1,543.8 1,731.0 1,789.7 1,845.7 1,907.7 1,809.9Expenditure excluding donor projects 1,081.4 1,359.1 1,570.0 1,340.2 1,562.2 1,400.4 1,636.1 1,686.0 1,735.7 1,790.2 1,685.2Current expenditure 730.8 912.7 1,147.7 1,023.2 1,106.9 1,034.3 1,084.0 1,133.7 1,183.4 1,237.9 1,264.7
Wages and salaries 141.8 162.5 177.5 170.4 181.9 163.7 179.7 186.9 194.4 208.9 207.0Current transfers 197.0 291.5 454.5 428.3 476.0 466.5 485.2 504.6 524.8 545.8 569.7Goods and services 392.0 458.7 515.7 424.5 449.0 404.1 419.1 442.3 464.2 483.2 488.0
Of which: Subsidies 98.4 96.5 0.0 81.5 - 85.2 75.0 75.0 75.0 75.0 75.0Interest payments 0.1 0.3 0.7 0.7 2.3 2.3 4.9 8.1 11.7 15.9 18.3
Contingency spending 10.6 - - - - - - -Capital expenditure 350.6 446.4 422.3 306.4 455.3 366.1 552.2 552.3 552.3 552.3 420.5Donor project 260.3 270.3 254.3 161.0 143.4 143.4 94.8 103.7 110.0 117.5 124.6
Overall balance 2,356.1 925.7 -5.5 110.6 202.7 -218.1 -484.4 -520.5 -581.8 -656.5 -571.0
Net Transfer to the Petroleum Fund (PF) 3/ 2,556.4 1,384.8 66.6 2.3 309.7 -111.1 -311.1 -305.9 -345.2 -375.0 -410.7
Non-oil overall balance -930.3 -1,191.1 -1,399.6 -1,170.1 -1,390.8 -1,232.2 -1,456.5 -1,497.0 -1,536.6 -1,581.5 -1,460.3Financing: 930.3 1,191.1 1,399.6 1,170.1 1,390.8 1,232.2 1,456.5 1,497.0 1,536.6 1,581.5 1,460.3
Petroleum Fund withdrawals 730.0 732.0 1,327.5 1,278.5 1,283.8 1,125.2 1,283.2 1,282.4 1,300.0 1,300.0 1,300.0Estimated Sustainable Income (ESI) 4/ 730.0 632.3 638.5 638.5 544.8 544.8 505.2 567.0 537.4 522.8 509.1Withdrawals above ESI 0.0 99.7 689.0 640.0 739.0 580.4 778.0 715.4 762.6 777.2 790.9
Change in cash balance (increase="-") 194.0 443.3 2.1 -132.2 0.0 0.0 0.0 0.0 0.0 0.0 0.0Borrowing 6.3 15.8 70.0 23.8 107.0 107.0 173.3 214.6 236.6 281.5 160.3
Revenue 66.1 58.6 69.4 61.5 90.9 63.1 52.6 49.0 46.0 42.6 40.0Petroleum revenue 58.7 48.5 53.2 48.9 75.9 48.3 41.0 37.7 34.7 31.5 28.7
Oil/gas receipts 54.4 41.7 32.9 37.4 34.2 6.9 2.8 2.4 2.1 1.6 1.0Investment returns 4.4 6.9 20.3 11.5 41.7 41.4 38.2 35.2 32.6 29.9 27.7
Taxes 1.9 2.8 4.8 4.6 5.5 5.5 5.1 4.9 4.8 4.7 4.8Taxes on income, profits, and capital gains 0.7 1.2 1.7 2.0 2.5 2.5 2.4 2.3 2.3 2.3 2.4Taxes on goods & services 0.9 1.3 2.4 2.1 2.5 2.5 2.2 2.1 2.0 1.9 1.9Taxes on international trade & transactions 0.2 0.3 0.6 0.5 0.6 0.5 0.5 0.5 0.5 0.5 0.5
Grants 4.7 6.2 9.7 6.1 6.8 6.8 4.0 4.0 4.0 4.0 4.0Other revenue 0.8 1.0 1.7 1.9 2.6 2.5 2.5 2.4 2.4 2.4 2.5
Expenditure 24.0 37.4 69.6 57.3 81.2 73.5 73.0 69.0 67.1 64.9 58.4Current expenditure 13.1 20.9 43.8 39.1 74.4 49.3 45.7 43.7 43.0 42.1 40.8
Wages and salaries 2.5 3.7 6.8 6.5 8.7 7.8 7.6 7.2 7.1 7.1 6.7Current transfers 3.5 6.7 17.3 16.3 8.7 22.2 20.5 19.5 19.1 18.6 18.4Goods and services 7.0 10.5 19.7 16.2 22.7 19.2 17.7 17.1 16.9 16.4 15.7 Of which: Subsidies 1.8 2.2 0.0 3.1 - 4.1 3.2 2.9 2.7 2.6 2.4
Capital expenditure 6.3 10.2 16.1 11.7 17.4 17.4 23.3 21.3 20.1 18.8 13.6Donor Project 4.7 6.2 9.7 6.1 6.8 6.8 4.0 4.0 4.0 4.0 4.0
Overall balance 42.1 21.2 -0.2 4.2 9.7 -10.4 -20.4 -20.1 -21.2 -22.3 -18.4Net Transfer to the PF 45.7 31.8 2.5 0.1 14.7 -5.3 -13.1 -11.8 -12.6 -12.8 -13.3Non-oil overall balance -16.6 -27.3 -53.4 -44.7 -66.2 -58.7 -61.4 -57.8 -55.9 -53.8 -47.1Financing: 16.6 27.3 53.4 44.7 66.2 58.7 61.4 57.8 55.9 53.8 47.1
Petroleum Fund withdrawals 13.0 16.8 50.7 48.8 61.1 53.6 54.1 49.5 47.3 44.2 41.9ESI 13.0 14.5 24.4 24.4 25.9 25.9 21.3 21.9 19.5 17.8 16.4Excess withdrawal 0.0 2.3 26.3 24.4 35.2 27.6 32.8 27.6 27.7 26.5 25.5
Borrowing 0.1 0.4 2.7 0.9 5.1 5.1 7.3 8.3 8.6 9.6 5.2
Non-oil revenue (excluding grants) 11.5 12.2 12.1 12.0 11.6 11.4 10.1 9.3 8.6 7.9 7.6Expenditure 101.7 118.8 129.2 106.3 115.3 104.3 97.0 87.7 79.3 71.9 61.3
Current expenditures (in percent of non-oil GDP) 55.4 66.5 81.3 72.4 74.8 69.9 60.7 55.6 50.9 46.7 42.8Capital expenditures (in percent of non-oil GDP) 26.6 32.5 29.9 21.7 30.8 24.7 30.9 27.1 23.7 20.8 14.2Donor funded expenditures (in percent of non-oil GDP) 19.7 19.7 18.0 11.4 9.7 9.7 5.3 5.1 4.7 4.4 4.2
Non-oil overall balance -70.5 -86.8 -99.1 -82.8 -94.0 -83.3 -81.6 -73.4 -66.0 -59.6 -49.5Non-oil primary balance -70.5 -86.8 -99.0 -82.8 -93.8 -83.1 -81.3 -72.8 -65.2 -58.4 -48.1
Memorandum items:Funding gap (in millions of U.S. dollars) 5/ -200.3 -558.8 -761.1 -531.6 -846.0 -687.4 -951.3 -930.0 -999.2 -1058.7 -951.2Petroleum Fund balance (in millions of U.S. dollars) 14,952 16,539 16,218 16,218 17,967 16,106 15,795 15,489 15,144 14,769 14,359Petroleum Fund balance (in percent of GDP) 267.2 379.2 619.1 619.1 685.9 767.1 666.2 597.6 550.7 502.7 463.3Non-oil GDP at current prices (in millions of U.S. dollar 1,319 1,372 1,412 1,412 1,480 1,480 1,784 2,040 2,327 2,652 2,952GDP at current prices (in millions of U.S. dollars) 5,596 4,362 2,620 2,620 2,100 2,100 2,371 2,592 2,750 2,938 3,099
Sources: Timor-Leste authorities and IMF staff estimates.
3/ Petroleum revenue minus Petroleum Fund withdrawal
5/ Funding gap is the deficit as per the fiscal rule, and equals ESI plus domestic revenue less expenditure.
1/ This presentation of government operations do not entirely follow the GFSM 2014 format. Deviations from GFSM 2014 are included in this presentation.2/ In accordance with GFSM 2014, investment returns in the operations statement exclude valuation gains/(losses) due to financial asset price and exchange rate changes.
(In millions of U.S. Dollars)
(In percent of GDP)
(In percent of non-oil GDP)
Projection
20162015
4/ Staff projections of the ESI are based on the findings of IMF TA mission conducted by the Fiscal Affairs Department and funded under the Managing Natural Resource Wealth Topical Trust Fund.

DEMOCRATIC REPUBLIC OF TIMOR-LESTE
INTERNATIONAL MONETARY FUND 29
Table 3. Timor-Leste: Monetary Developments, 2012-17
2012 2013 2014 2015 2016 2017Est. Prel.
Banking system 1/
Net foreign assets 2/ 1,179 1,072 757 1,016 1,007 1,012Gross reserves 884 687 311 438 446 452Other foreign assets 368 461 521 661 644 644Foreign liabilities 72 77 76 83 83 83
Net domestic assets -772 -572 -157 -363 -313 -218Net credit to central government -841 -651 -207 -339 -339 -339Net credit to state and local government 0 0 -1 0 0 0Net credit to public nonfinancial corporations 0 0 0 0 0 0Credit to private sector 160 182 192 212 240 273Other items (net) -91 -103 -141 -236 -215 -152
Broad money 407 500 600 642 693 794Narrow money 206 279 343 398 429 492
Currency in circulation 3/ 5 7 10 12 13 15Transferable deposits 201 273 333 386 416 477
Other deposits 201 221 257 245 -165 -189
Central BankNet foreign assets 2/ 872 675 300 427 435 441
Gross reserves 884 687 311 438 446 452Foreign liabilities 12 12 11 11 11 11
Net domestic assets -772 -590 -154 -208 -208 -208Net credit to central government -819 -634 -181 -238 -238 -238Net credit to other depository corporations 71 72 71 75 75 75Other items (net) -24 -28 -44 -44 -44 -44
Monetary Base 100 86 147 213 227 233Currency in circulation 5 7 10 12 13 15Other liabilities to depositary corporations 95 79 137 201 214 218Others 3/ 0 0 0 0 0 0
Broad money growth 26.2 22.9 19.9 7.1 7.9 14.6Reserve money growth 189.7 -14.4 71.4 45.5 6.5 2.5Credit to the private sector growth 20.5 13.6 5.5 10.5 13.3 13.7
Memorandum itemsCredit/non-oil GDP 12.4 13.8 14.0 15.0 16.2 15.3Broad money/non-oil GDP 31.4 37.9 43.7 45.5 46.8 44.6Credit/deposits 39.8 36.8 32.5 44.3 47.9 45.2Amounts of non-perfoming loans (in millions of U.S. dollars) 48.0 49.5 47.4 43.7 … …Non-performing loans/total loans 30.8 28.0 26.8 22.9 … …Loan rate 4/ 12.2 12.4 12.9 13.5 … …Deposit rate 5/ 1.1 1.1 1.1 1.0 … …
Sources: Central Bank of Timor-Leste; and IMF staff estimates.1/ Includes the Central Bank, 4 commercial banks (including 3 branches of foreign banks).2/ An oil fund was created in September 2005 and the deposits were moved off-shore and onto the Government balance sheet.3/ Includes only coinage issued by the Central Bank. No data is available for notes due to dollarization of the financial system.4/ Rate charged by other depository corporations on loans in U.S. dollars. The rate is weighted by loan amounts.5/ Rate offered by other depository corporations on three-month time deposits in U.S. dollars. The rate is weighted by deposit amounts.
(In percent, unless otherwise indicated)
Projections
(In millions of U.S. dollars)
(12-month percentage change)
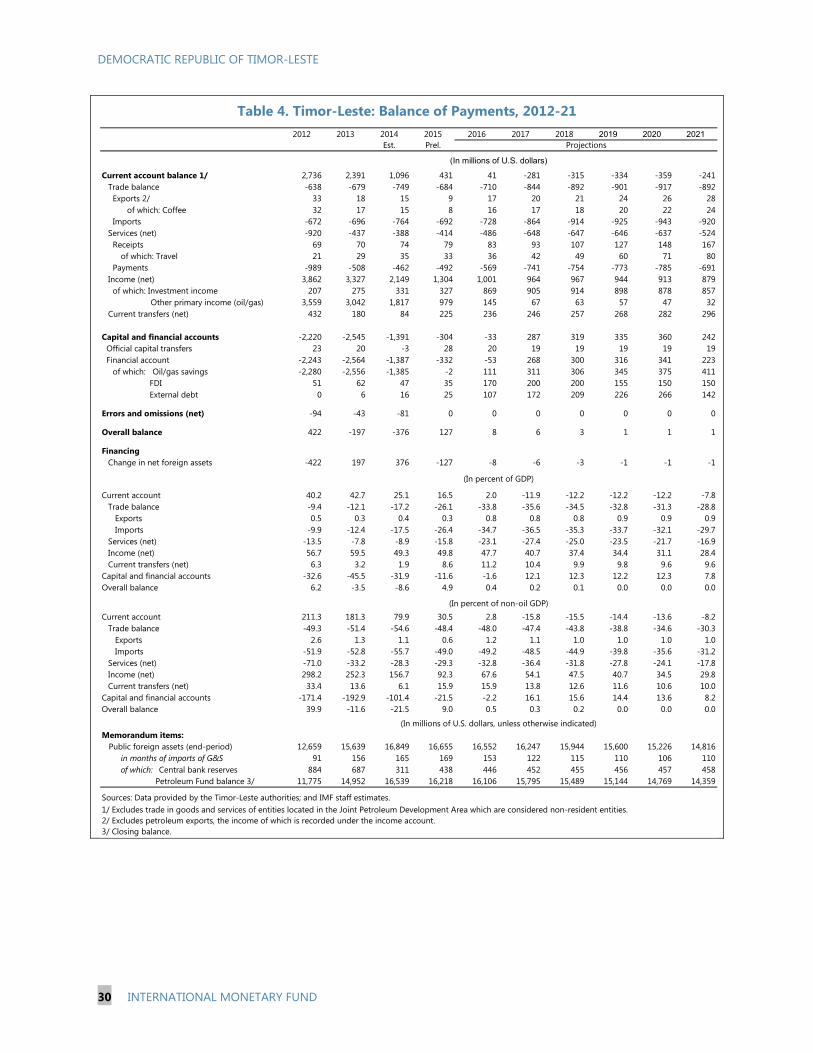
DEMOCRATIC REPUBLIC OF TIMOR-LESTE
30 INTERNATIONAL MONETARY FUND
Table 4. Timor-Leste: Balance of Payments, 2012-21
2012 2013 2014 2015 2016 2017 2018 2019 2020 2021Est. Prel.
Current account balance 1/ 2,736 2,391 1,096 431 41 -281 -315 -334 -359 -241Trade balance -638 -679 -749 -684 -710 -844 -892 -901 -917 -892 Exports 2/ 33 18 15 9 17 20 21 24 26 28
of which: Coffee 32 17 15 8 16 17 18 20 22 24 Imports -672 -696 -764 -692 -728 -864 -914 -925 -943 -920Services (net) -920 -437 -388 -414 -486 -648 -647 -646 -637 -524 Receipts 69 70 74 79 83 93 107 127 148 167
of which: Travel 21 29 35 33 36 42 49 60 71 80 Payments -989 -508 -462 -492 -569 -741 -754 -773 -785 -691Income (net) 3,862 3,327 2,149 1,304 1,001 964 967 944 913 879 of which: Investment income 207 275 331 327 869 905 914 898 878 857
Other primary income (oil/gas) 3,559 3,042 1,817 979 145 67 63 57 47 32Current transfers (net) 432 180 84 225 236 246 257 268 282 296
Capital and financial accounts -2,220 -2,545 -1,391 -304 -33 287 319 335 360 242 Official capital transfers 23 20 -3 28 20 19 19 19 19 19 Financial account -2,243 -2,564 -1,387 -332 -53 268 300 316 341 223
of which: Oil/gas savings -2,280 -2,556 -1,385 -2 111 311 306 345 375 411 FDI 51 62 47 35 170 200 200 155 150 150 External debt 0 6 16 25 107 172 209 226 266 142
Errors and omissions (net) -94 -43 -81 0 0 0 0 0 0 0
Overall balance 422 -197 -376 127 8 6 3 1 1 1
FinancingChange in net foreign assets -422 197 376 -127 -8 -6 -3 -1 -1 -1
Current account 40.2 42.7 25.1 16.5 2.0 -11.9 -12.2 -12.2 -12.2 -7.8Trade balance -9.4 -12.1 -17.2 -26.1 -33.8 -35.6 -34.5 -32.8 -31.3 -28.8 Exports 0.5 0.3 0.4 0.3 0.8 0.8 0.8 0.9 0.9 0.9 Imports -9.9 -12.4 -17.5 -26.4 -34.7 -36.5 -35.3 -33.7 -32.1 -29.7Services (net) -13.5 -7.8 -8.9 -15.8 -23.1 -27.4 -25.0 -23.5 -21.7 -16.9Income (net) 56.7 59.5 49.3 49.8 47.7 40.7 37.4 34.4 31.1 28.4Current transfers (net) 6.3 3.2 1.9 8.6 11.2 10.4 9.9 9.8 9.6 9.6
Capital and financial accounts -32.6 -45.5 -31.9 -11.6 -1.6 12.1 12.3 12.2 12.3 7.8Overall balance 6.2 -3.5 -8.6 4.9 0.4 0.2 0.1 0.0 0.0 0.0
Current account 211.3 181.3 79.9 30.5 2.8 -15.8 -15.5 -14.4 -13.6 -8.2Trade balance -49.3 -51.4 -54.6 -48.4 -48.0 -47.4 -43.8 -38.8 -34.6 -30.3 Exports 2.6 1.3 1.1 0.6 1.2 1.1 1.0 1.0 1.0 1.0 Imports -51.9 -52.8 -55.7 -49.0 -49.2 -48.5 -44.9 -39.8 -35.6 -31.2Services (net) -71.0 -33.2 -28.3 -29.3 -32.8 -36.4 -31.8 -27.8 -24.1 -17.8Income (net) 298.2 252.3 156.7 92.3 67.6 54.1 47.5 40.7 34.5 29.8Current transfers (net) 33.4 13.6 6.1 15.9 15.9 13.8 12.6 11.6 10.6 10.0
Capital and financial accounts -171.4 -192.9 -101.4 -21.5 -2.2 16.1 15.6 14.4 13.6 8.2Overall balance 39.9 -11.6 -21.5 9.0 0.5 0.3 0.2 0.0 0.0 0.0
Memorandum items: Public foreign assets (end-period) 12,659 15,639 16,849 16,655 16,552 16,247 15,944 15,600 15,226 14,816
in months of imports of G&S 91 156 165 169 153 122 115 110 106 110of which: Central bank reserves 884 687 311 438 446 452 455 456 457 458 Petroleum Fund balance 3/ 11,775 14,952 16,539 16,218 16,106 15,795 15,489 15,144 14,769 14,359
Sources: Data provided by the Timor-Leste authorities; and IMF staff estimates.1/ Excludes trade in goods and services of entities located in the Joint Petroleum Development Area which are considered non-resident entities.2/ Excludes petroleum exports, the income of which is recorded under the income account. 3/ Closing balance.
(In millions of U.S. dollars, unless otherwise indicated)
Projections
(In millions of U.S. dollars)
(In percent of GDP)
(In percent of non-oil GDP)
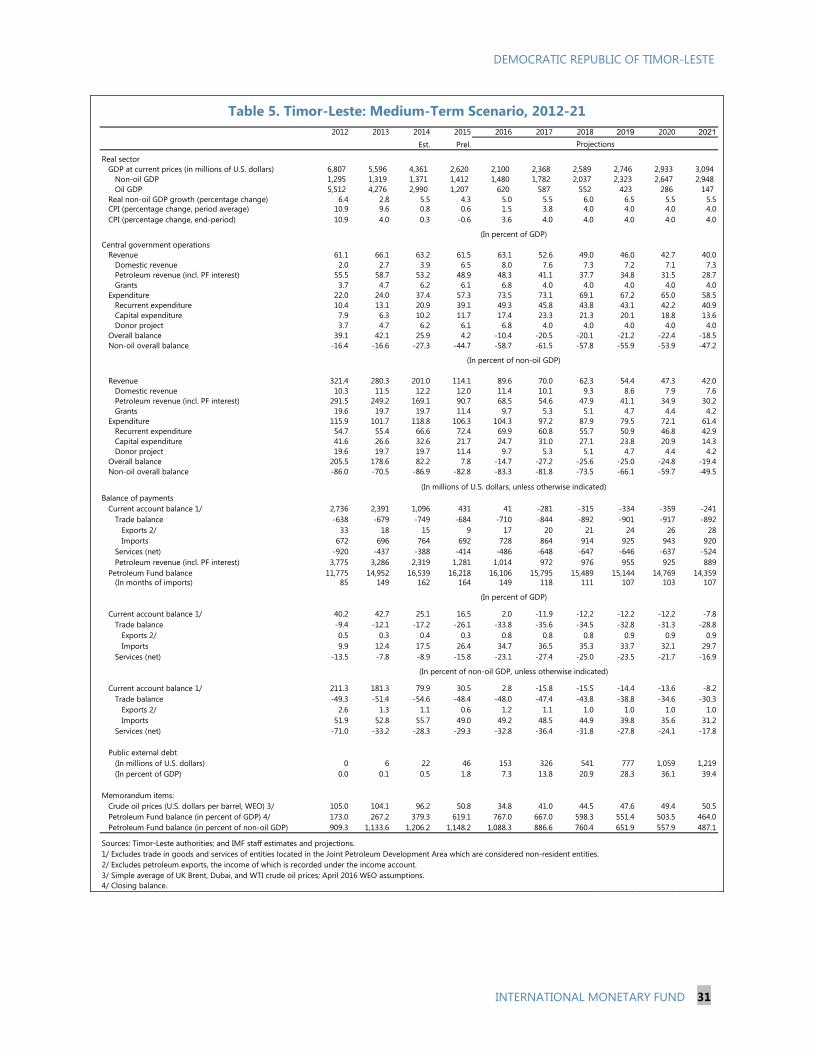
DEMOCRATIC REPUBLIC OF TIMOR-LESTE
INTERNATIONAL MONETARY FUND 31
Table 5. Timor-Leste: Medium-Term Scenario, 2012-21
2012 2013 2014 2015 2016 2017 2018 2019 2020 2021
Est. Prel.
Real sectorGDP at current prices (in millions of U.S. dollars) 6,807 5,596 4,361 2,620 2,100 2,368 2,589 2,746 2,933 3,094
Non-oil GDP 1,295 1,319 1,371 1,412 1,480 1,782 2,037 2,323 2,647 2,948 Oil GDP 5,512 4,276 2,990 1,207 620 587 552 423 286 147
Real non-oil GDP growth (percentage change) 6.4 2.8 5.5 4.3 5.0 5.5 6.0 6.5 5.5 5.5CPI (percentage change, period average) 10.9 9.6 0.8 0.6 1.5 3.8 4.0 4.0 4.0 4.0CPI (percentage change, end-period) 10.9 4.0 0.3 -0.6 3.6 4.0 4.0 4.0 4.0 4.0
Central government operationsRevenue 61.1 66.1 63.2 61.5 63.1 52.6 49.0 46.0 42.7 40.0
Domestic revenue 2.0 2.7 3.9 6.5 8.0 7.6 7.3 7.2 7.1 7.3Petroleum revenue (incl. PF interest) 55.5 58.7 53.2 48.9 48.3 41.1 37.7 34.8 31.5 28.7Grants 3.7 4.7 6.2 6.1 6.8 4.0 4.0 4.0 4.0 4.0
Expenditure 22.0 24.0 37.4 57.3 73.5 73.1 69.1 67.2 65.0 58.5Recurrent expenditure 10.4 13.1 20.9 39.1 49.3 45.8 43.8 43.1 42.2 40.9Capital expenditure 7.9 6.3 10.2 11.7 17.4 23.3 21.3 20.1 18.8 13.6Donor project 3.7 4.7 6.2 6.1 6.8 4.0 4.0 4.0 4.0 4.0
Overall balance 39.1 42.1 25.9 4.2 -10.4 -20.5 -20.1 -21.2 -22.4 -18.5Non-oil overall balance -16.4 -16.6 -27.3 -44.7 -58.7 -61.5 -57.8 -55.9 -53.9 -47.2
Revenue 321.4 280.3 201.0 114.1 89.6 70.0 62.3 54.4 47.3 42.0Domestic revenue 10.3 11.5 12.2 12.0 11.4 10.1 9.3 8.6 7.9 7.6Petroleum revenue (incl. PF interest) 291.5 249.2 169.1 90.7 68.5 54.6 47.9 41.1 34.9 30.2Grants 19.6 19.7 19.7 11.4 9.7 5.3 5.1 4.7 4.4 4.2
Expenditure 115.9 101.7 118.8 106.3 104.3 97.2 87.9 79.5 72.1 61.4Recurrent expenditure 54.7 55.4 66.6 72.4 69.9 60.8 55.7 50.9 46.8 42.9Capital expenditure 41.6 26.6 32.6 21.7 24.7 31.0 27.1 23.8 20.9 14.3Donor project 19.6 19.7 19.7 11.4 9.7 5.3 5.1 4.7 4.4 4.2
Overall balance 205.5 178.6 82.2 7.8 -14.7 -27.2 -25.6 -25.0 -24.8 -19.4Non-oil overall balance -86.0 -70.5 -86.9 -82.8 -83.3 -81.8 -73.5 -66.1 -59.7 -49.5
Balance of payments Current account balance 1/ 2,736 2,391 1,096 431 41 -281 -315 -334 -359 -241
Trade balance -638 -679 -749 -684 -710 -844 -892 -901 -917 -892Exports 2/ 33 18 15 9 17 20 21 24 26 28Imports 672 696 764 692 728 864 914 925 943 920
Services (net) -920 -437 -388 -414 -486 -648 -647 -646 -637 -524Petroleum revenue (incl. PF interest) 3,775 3,286 2,319 1,281 1,014 972 976 955 925 889
Petroleum Fund balance 11,775 14,952 16,539 16,218 16,106 15,795 15,489 15,144 14,769 14,359(In months of imports) 85 149 162 164 149 118 111 107 103 107
Current account balance 1/ 40.2 42.7 25.1 16.5 2.0 -11.9 -12.2 -12.2 -12.2 -7.8Trade balance -9.4 -12.1 -17.2 -26.1 -33.8 -35.6 -34.5 -32.8 -31.3 -28.8
Exports 2/ 0.5 0.3 0.4 0.3 0.8 0.8 0.8 0.9 0.9 0.9Imports 9.9 12.4 17.5 26.4 34.7 36.5 35.3 33.7 32.1 29.7
Services (net) -13.5 -7.8 -8.9 -15.8 -23.1 -27.4 -25.0 -23.5 -21.7 -16.9
Current account balance 1/ 211.3 181.3 79.9 30.5 2.8 -15.8 -15.5 -14.4 -13.6 -8.2Trade balance -49.3 -51.4 -54.6 -48.4 -48.0 -47.4 -43.8 -38.8 -34.6 -30.3
Exports 2/ 2.6 1.3 1.1 0.6 1.2 1.1 1.0 1.0 1.0 1.0Imports 51.9 52.8 55.7 49.0 49.2 48.5 44.9 39.8 35.6 31.2
Services (net) -71.0 -33.2 -28.3 -29.3 -32.8 -36.4 -31.8 -27.8 -24.1 -17.8
Public external debt(In millions of U.S. dollars) 0 6 22 46 153 326 541 777 1,059 1,219(In percent of GDP) 0.0 0.1 0.5 1.8 7.3 13.8 20.9 28.3 36.1 39.4
Memorandum items:Crude oil prices (U.S. dollars per barrel, WEO) 3/ 105.0 104.1 96.2 50.8 34.8 41.0 44.5 47.6 49.4 50.5Petroleum Fund balance (in percent of GDP) 4/ 173.0 267.2 379.3 619.1 767.0 667.0 598.3 551.4 503.5 464.0Petroleum Fund balance (in percent of non-oil GDP) 909.3 1,133.6 1,206.2 1,148.2 1,088.3 886.6 760.4 651.9 557.9 487.1
Sources: Timor-Leste authorities; and IMF staff estimates and projections.1/ Excludes trade in goods and services of entities located in the Joint Petroleum Development Area which are considered non-resident entities.2/ Excludes petroleum exports, the income of which is recorded under the income account. 3/ Simple average of UK Brent, Dubai, and WTI crude oil prices; April 2016 WEO assumptions.4/ Closing balance.
(In percent of GDP)
(In percent of non-oil GDP, unless otherwise indicated)
(In percent of GDP)
(In percent of non-oil GDP)
(In millions of U.S. dollars, unless otherwise indicated)
Projections
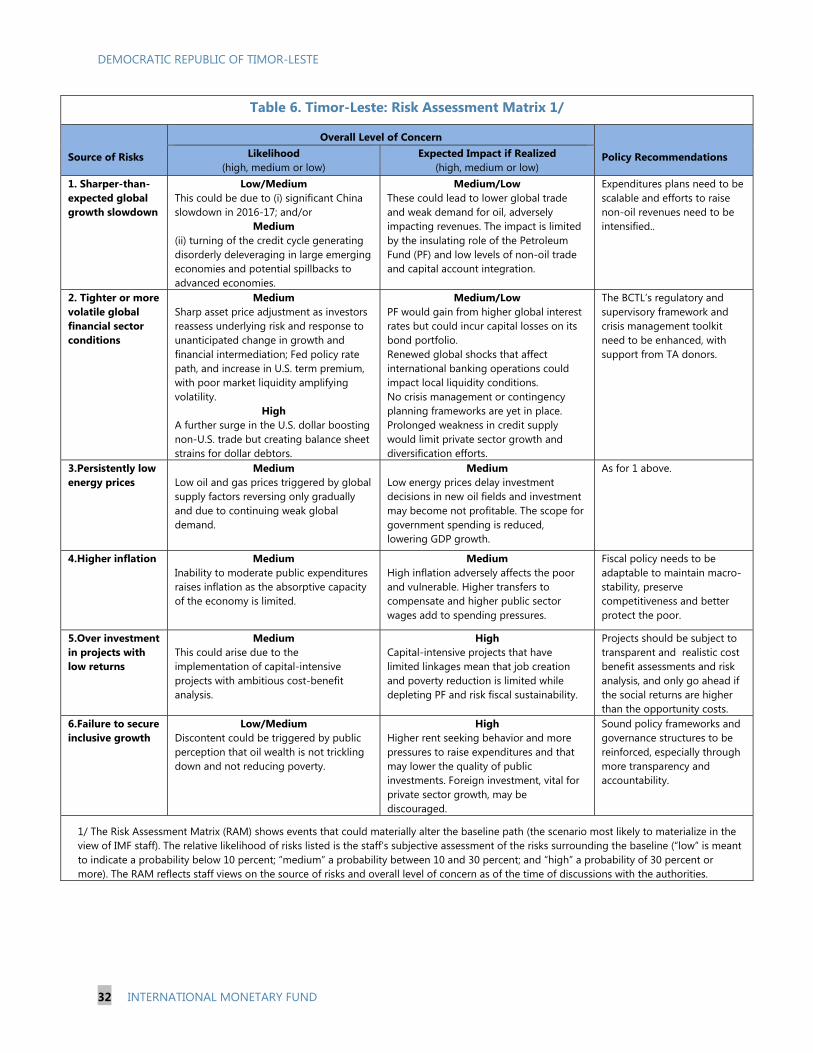
DEMOCRATIC REPUBLIC OF TIMOR-LESTE
32 INTERNATIONAL MONETARY FUND
Table 6. Timor-Leste: Risk Assessment Matrix 1/
Source of Risks
Overall Level of Concern
Policy Recommendations Likelihood (high, medium or low)
Expected Impact if Realized (high, medium or low)
1. Sharper-than- expected global growth slowdown
Low/Medium This could be due to (i) significant China slowdown in 2016-17; and/or
Medium (ii) turning of the credit cycle generating disorderly deleveraging in large emerging economies and potential spillbacks to advanced economies.
Medium/Low These could lead to lower global trade and weak demand for oil, adversely impacting revenues. The impact is limited by the insulating role of the Petroleum Fund (PF) and low levels of non-oil trade and capital account integration.
Expenditures plans need to be scalable and efforts to raise non-oil revenues need to be intensified..
2. Tighter or more volatile global financial sector conditions
Medium Sharp asset price adjustment as investors reassess underlying risk and response to unanticipated change in growth and financial intermediation; Fed policy rate path, and increase in U.S. term premium, with poor market liquidity amplifying volatility.
High A further surge in the U.S. dollar boosting non-U.S. trade but creating balance sheet strains for dollar debtors.
Medium/Low PF would gain from higher global interest rates but could incur capital losses on its bond portfolio. Renewed global shocks that affect international banking operations could impact local liquidity conditions. No crisis management or contingency planning frameworks are yet in place. Prolonged weakness in credit supply would limit private sector growth and diversification efforts.
The BCTL’s regulatory and supervisory framework and crisis management toolkit need to be enhanced, with support from TA donors.
3.Persistently low energy prices
Medium Low oil and gas prices triggered by global supply factors reversing only gradually and due to continuing weak global demand.
Medium Low energy prices delay investment decisions in new oil fields and investment may become not profitable. The scope for government spending is reduced, lowering GDP growth.
As for 1 above.
4.Higher inflation Medium Inability to moderate public expenditures raises inflation as the absorptive capacity of the economy is limited.
Medium High inflation adversely affects the poor and vulnerable. Higher transfers to compensate and higher public sector wages add to spending pressures.
Fiscal policy needs to be adaptable to maintain macro-stability, preserve competitiveness and better protect the poor.
5.Over investment in projects with low returns
Medium This could arise due to the implementation of capital-intensive projects with ambitious cost-benefit analysis.
High Capital-intensive projects that have limited linkages mean that job creation and poverty reduction is limited while depleting PF and risk fiscal sustainability.
Projects should be subject to transparent and realistic cost benefit assessments and risk analysis, and only go ahead if the social returns are higher than the opportunity costs.
6.Failure to secure inclusive growth
Low/Medium Discontent could be triggered by public perception that oil wealth is not trickling down and not reducing poverty.
High Higher rent seeking behavior and more pressures to raise expenditures and that may lower the quality of public investments. Foreign investment, vital for private sector growth, may be discouraged.
Sound policy frameworks and governance structures to be reinforced, especially through more transparency and accountability.
1/ The Risk Assessment Matrix (RAM) shows events that could materially alter the baseline path (the scenario most likely to materialize in the view of IMF staff). The relative likelihood of risks listed is the staff’s subjective assessment of the risks surrounding the baseline (“low” is meant to indicate a probability below 10 percent; “medium” a probability between 10 and 30 percent; and “high” a probability of 30 percent or more). The RAM reflects staff views on the source of risks and overall level of concern as of the time of discussions with the authorities.
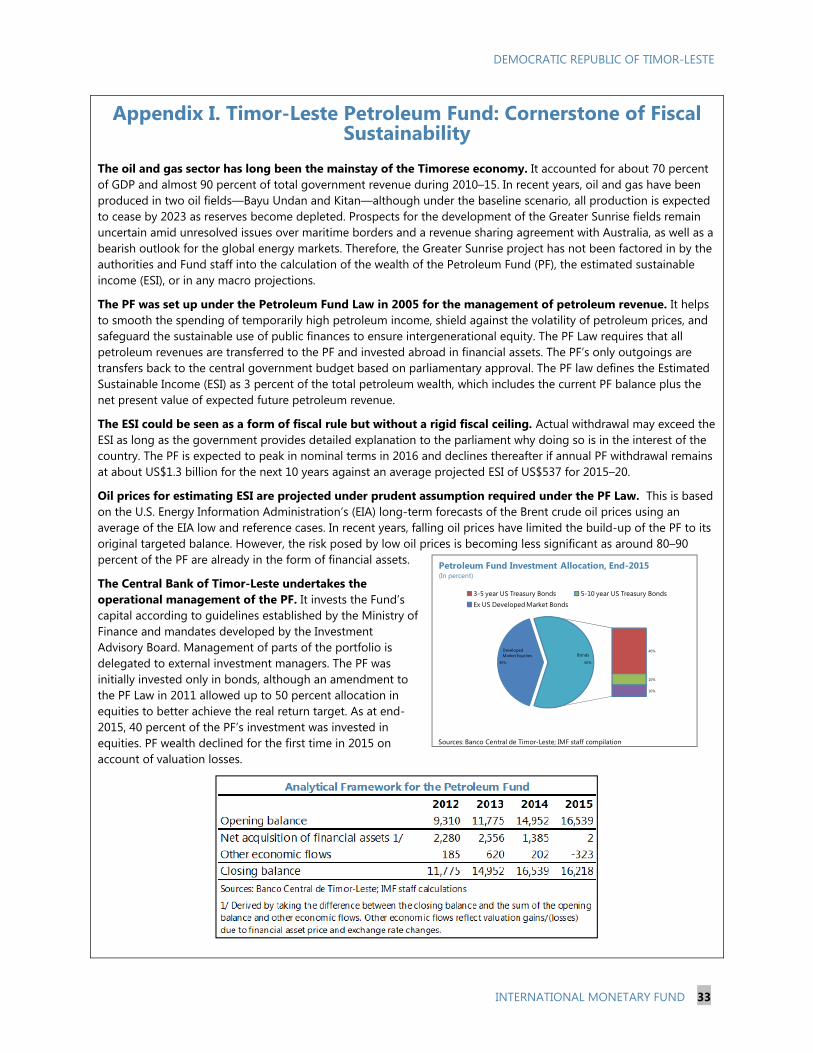
DEMOCRATIC REPUBLIC OF TIMOR-LESTE
INTERNATIONAL MONETARY FUND 33
Appendix I. Timor-Leste Petroleum Fund: Cornerstone of Fiscal Sustainability
The oil and gas sector has long been the mainstay of the Timorese economy. It accounted for about 70 percent of GDP and almost 90 percent of total government revenue during 2010–15. In recent years, oil and gas have been produced in two oil fields—Bayu Undan and Kitan—although under the baseline scenario, all production is expected to cease by 2023 as reserves become depleted. Prospects for the development of the Greater Sunrise fields remain uncertain amid unresolved issues over maritime borders and a revenue sharing agreement with Australia, as well as a bearish outlook for the global energy markets. Therefore, the Greater Sunrise project has not been factored in by the authorities and Fund staff into the calculation of the wealth of the Petroleum Fund (PF), the estimated sustainable income (ESI), or in any macro projections.
The PF was set up under the Petroleum Fund Law in 2005 for the management of petroleum revenue. It helps to smooth the spending of temporarily high petroleum income, shield against the volatility of petroleum prices, and safeguard the sustainable use of public finances to ensure intergenerational equity. The PF Law requires that all petroleum revenues are transferred to the PF and invested abroad in financial assets. The PF’s only outgoings are transfers back to the central government budget based on parliamentary approval. The PF law defines the Estimated Sustainable Income (ESI) as 3 percent of the total petroleum wealth, which includes the current PF balance plus the net present value of expected future petroleum revenue.
The ESI could be seen as a form of fiscal rule but without a rigid fiscal ceiling. Actual withdrawal may exceed the ESI as long as the government provides detailed explanation to the parliament why doing so is in the interest of the country. The PF is expected to peak in nominal terms in 2016 and declines thereafter if annual PF withdrawal remains at about US$1.3 billion for the next 10 years against an average projected ESI of US$537 for 2015–20.
Oil prices for estimating ESI are projected under prudent assumption required under the PF Law. This is based on the U.S. Energy Information Administration’s (EIA) long-term forecasts of the Brent crude oil prices using an average of the EIA low and reference cases. In recent years, falling oil prices have limited the build-up of the PF to its original targeted balance. However, the risk posed by low oil prices is becoming less significant as around 80–90 percent of the PF are already in the form of financial assets.
The Central Bank of Timor-Leste undertakes the operational management of the PF. It invests the Fund’s capital according to guidelines established by the Ministry of Finance and mandates developed by the Investment Advisory Board. Management of parts of the portfolio is delegated to external investment managers. The PF was initially invested only in bonds, although an amendment to the PF Law in 2011 allowed up to 50 percent allocation in equities to better achieve the real return target. As at end-2015, 40 percent of the PF’s investment was invested in equities. PF wealth declined for the first time in 2015 on account of valuation losses.
40%
40%
10%
10%
60%
3-5 year US Treasury Bonds 5-10 year US Treasury BondsEx US Developed Market Bonds
Sources: Banco Central de Timor-Leste; IMF staff compilation
Petroleum Fund Investment Allocation, End-2015(In percent)
DevelopedMarket Equities Bonds
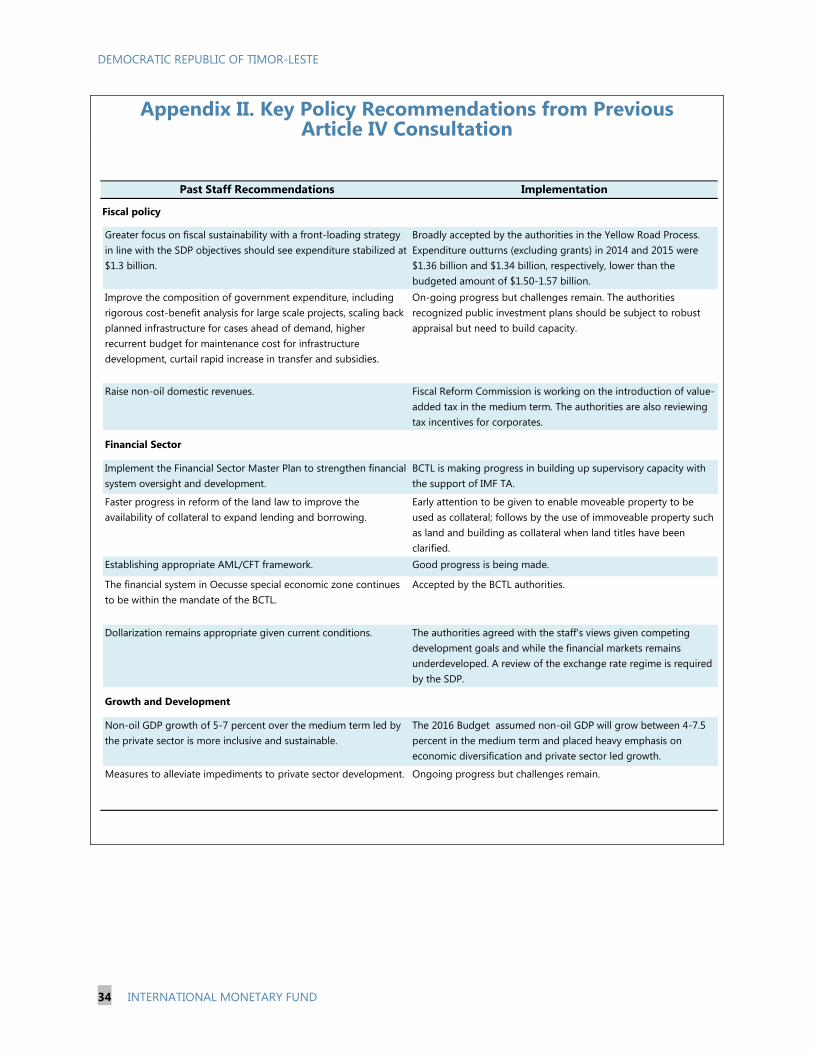
DEMOCRATIC REPUBLIC OF TIMOR-LESTE
34 INTERNATIONAL MONETARY FUND
Appendix II. Key Policy Recommendations from Previous Article IV Consultation
Past Staff Recommendations Implementation
Fiscal policy
Greater focus on fiscal sustainability with a front-loading strategy in line with the SDP objectives should see expenditure stabilized at $1.3 billion.
Broadly accepted by the authorities in the Yellow Road Process. Expenditure outturns (excluding grants) in 2014 and 2015 were $1.36 billion and $1.34 billion, respectively, lower than the budgeted amount of $1.50-1.57 billion.
Improve the composition of government expenditure, including rigorous cost-benefit analysis for large scale projects, scaling back planned infrastructure for cases ahead of demand, higher recurrent budget for maintenance cost for infrastructure development, curtail rapid increase in transfer and subsidies.
On-going progress but challenges remain. The authorities recognized public investment plans should be subject to robust appraisal but need to build capacity.
Raise non-oil domestic revenues. Fiscal Reform Commission is working on the introduction of value-added tax in the medium term. The authorities are also reviewing tax incentives for corporates.
Financial Sector
Implement the Financial Sector Master Plan to strengthen financial system oversight and development.
BCTL is making progress in building up supervisory capacity with the support of IMF TA.
Faster progress in reform of the land law to improve the availability of collateral to expand lending and borrowing.
Early attention to be given to enable moveable property to be used as collateral; follows by the use of immoveable property such as land and building as collateral when land titles have been clarified.
Establishing appropriate AML/CFT framework. Good progress is being made.
The financial system in Oecusse special economic zone continues to be within the mandate of the BCTL.
Accepted by the BCTL authorities.
Dollarization remains appropriate given current conditions. The authorities agreed with the staff's views given competing development goals and while the financial markets remains underdeveloped. A review of the exchange rate regime is required by the SDP.
Growth and Development
Non-oil GDP growth of 5-7 percent over the medium term led by the private sector is more inclusive and sustainable.
The 2016 Budget assumed non-oil GDP will grow between 4-7.5 percent in the medium term and placed heavy emphasis on economic diversification and private sector led growth.
Measures to alleviate impediments to private sector development. Ongoing progress but challenges remain.

DEMOCRATIC REPUBLIC OF TIMOR-LESTE
INTERNATIONAL MONETARY FUND 35
Appendix III. Advancing Financial Inclusion and Safeguarding Stability
Financial inclusion increases economic growth at initial stage of financial development. Defining financial inclusion as the access to and use of formal financial services by households and firms, IMF (2015) found the initial levels of various types of financial inclusion indicators have a positive impact on 10-year growth. Nevertheless, determining the direction of causation between financial inclusion and economic growth remains a challenge. The study also points to evidence that financial stability risks increase when access to credit is expanded without proper supervision.1
Timor-Leste has much scope to facilitate access to finance given its re latively shallow financial market. There are only four commercial banks with 31 branches in the country, translating to about 5.6 bank branches per 100,000 adults. Albeit significant recent increase in the number of deposit accounts, overall only two in five Timorese have a bank account and a slow-growing access to non-bank financial institutions such as credit unions and microfinance. Timor-Leste’s credit to private sector—a common indicator of financial sector depth— was 15 percent of GDP in 2015, well below the weighted average for Pacific island small states (68 percent of GDP in 2014) and East Asia and Pacific developing countries (131 percent of GDP in 2014). This indicates that continued efforts are needed to develop the financial system, broaden the provision of financial services, and increase financial literacy, as set out in the Banco Central de Timor-Leste (BCTL)’s Master Plan for Financial Sector Development. The Master Plan aims to increase the proportion of adult population with bank accounts to 90 percent by 2025, including through promoting mobile banking.
At the same time, mitigating the potential risks to financial stability from an unchecked broadening of access to credit is needed. Sustainable financial inclusion requires balancing opportunity and innovation in financial markets with the establishment of safeguards to prevent excesses in both the supply of and demand for credit. The BCTL is making progress in enhancing its supervisory capacity for both on-site and off-site examination of banks in line with recent technical assistance. The BCTL is also expected to resume oversight of the non-bank financial sector which includes credit unions and microfinance in the near future, with TA support from the Pacific Financial Technical Assistance Centre (PFTAC).
Sources: Timor-Leste Financial System Review; and WorldBank FinStats. Note: Timor-Leste as of June 2015; others latest available. 1 IMF Staff Discussion Note (2015) “Financial Inclusion: Can It Meet Multiple Macroeconomic Goals?”
0102030405060708090
Bhut
an
Lao
PDR
Papu
a N
ew G
uine
a
Tim
or-L
este
Cam
bodi
a
Viet
nam Fiji
Sam
oa
Brun
ei D
arus
sala
m
Deposits(In percent of GDP)
0
10
20
30
40
50
60
70
Tim
or-L
este
Bhut
an
Lao
PDR
Papu
a N
ew G
uine
a
Viet
nam
Cam
bodi
a
Sam
oa Fiji
Brun
ei D
arus
sala
m
Private Credit (In percent of GDP)
R² = 0.3717
0
10
20
30
40
50
60
70
80
90
0 100 200 300
Financial Sector Depth, 2014
Credit to private sector (percent of GDP)
Source: World Bank, World Development Indicators.
Timor-Leste
GD
P pe
r cap
ita(th
ousa
ndof
cur
rent
USD
)

DEMOCRATIC REPUBLIC OF TIMOR-LESTE
36 INTERNATIONAL MONETARY FUND
Appendix IV. Transition to Sustainable Development Goals
The Sustainable Development Goals (SDGs) are replacing the Millennium Development Goals (MDGs). Broader in scope than the MDGs, the SDGs aim to achieve high and sustainable growth economically, socially and environmentally. A working group led by the Prime Minister’s office is reviewing the Strategic Development Plan (SDP) for any adaptation needed to align with the SDGs. Timor-Leste played a key role in adopting SDG 16 (peace, justice, and strong institution) by its efforts and engagement at the global level through coordinating with g+7 countries.
Some progress in achieving the MDGs. Timor-Leste is on-track in promoting gender equality, reducing child mortality, and combating malaria and other diseases.1 Notably, infant and child mortality rates have declined sharply by 50 percent during 2001-09. However, Timor-Leste continues to face challenges in improving other social indicators. Raising the level and efficiency of health and education spending is essential. The government has taken initiatives to promote inclusive growth through various social programs.
IMF could help Timor-Leste achieves SDGs through policy support and technical assistance. Key priority areas include domestic revenue mobilization, financial sector supervision and data enhancement.2 Domestic revenues mobilization would create the fiscal space to increase social and pro-growth spending. Financial inclusion through expanding financial access well supported by legal, regulatory, and institutional framework would help narrow income and gender inequality. Continued data enhancements are crucial to monitor and assess progress.
______________________________ 1 Government of Timor-Leste (2014), The Millennium Development Goals Report 2014. 2 IMF (2015), From Ambition to Execution: Policies in Support of Sustainable Development Goals, Staff Discussion Note 15/18.
Corresponding SDGs
1 No poverty 2 End hunger
8 Decent work and inclusive economic growth 9 Industry, innovation & infrastructure
3 Good health and well-being4 Quality education5 Gender equality
10 Reduced inequalities
6 Clean water & sanitation7 Affordable and clean energy 12 Responsible consumption
13 Climate action
16 Peace, justice, and strong institution17 Partnerships for the goals
Source: United Nations; and IMF staff estimates.
Timor-Leste: Sustainable Development Goals Analysis
Current MDGs
1 Eradicate extreme poverty and hunger
Economic diversification and transformation
Domestic revenue mobilization
2 Achieve universal primary education Economic, gender, and financial inclusion3 Promote gender equality and empower women Financial inclusion and financial stability
Sustainable and inclusive growth
Reducing inefficient energy subsidies
Investing in human capital
Environmental sustainability
8 Develop partnership for development Stable and effective governance and public order
4 Reduce child mortalityData enhancement 5 Improve maternal health
6 Combat HIV/AIDs, malaria and other diseases
7 Ensure environmental sustainability
Key Policies Requirements
1. Health Care Service
2. Education * Key targets for next two years
- Reduction of school dropouts- Acquisition of minimum literacy and numeracy skills
Source: Timor-Leste authori ties .
- Implementation and monitoring of the new base national curriculum for the 1st and 2nd cycles of basic education.
Initiatives to promote health care and education
* Saude da Familia (Family Health): to classify all households as healthy, at risk, sick or in rehabilitation by November 2016. Data will be available on the Ministry of Health website to assist program planning and implementation.
* Servisu Integradu Saude Komunitariu (Integrated Community Health Service): to ensure all communities have access to health services within an acceptable walking distance. * The environmental/public health program: to focus on nutrition and communicable diseases through programs that deal with tuberculosis, HIV, and sexually transmitted diseases (STDs).
- Enrolment of all children in the first year of basic education at the proper age

DEMOCRATIC REPUBLIC OF TIMOR-LESTE
INTERNATIONAL MONETARY FUND 37
Appendix V. Remittances and Labor Flow Dynamics Remittance outflows from Timor-Leste have increased since 2006,1 reflecting the reliance on foreign workers for high-skill managerial jobs. The 2014 Enterprise and Skills Survey shows that the number of foreign workers is relatively high in managerial and professional positions, especially in oil and gas sector. This suggests the existence of a skill gap, with the demand for workers with specific qualifications and skills not being met by the supply from local workers. According to the 2013 Labor Force Survey, a small percentage of the labor force has either a vocational/polytechnic diploma (5.3 percent) or a university degree (8.9 percent). More generally, human resource constraints remain severe as 40 percent of the population over 15 years old has not had any education.2
Also, remittance inflows have increasingly become an important income source for households, albeit from a low base. Outward labor flows provide employment opportunity, while the private sector in Timor-Leste is developing. According to the UN statistics, migrants from Timor-Leste are currently estimated at around 33,000 (3 percent of the population).
Closing the skill gap in Timor-Leste requires more targeted training and education of the workforce. Vocational training has been underutilized given that most of the population have been self-taught or trained by relatives or friends. As of 2010, only 13.6 percent of the population had gone through a vocational training program. To enhance the educational quality and vocational training, a key priority could be to develop well designed, targeted skill improvement programs in coordination with the private sector. Timorese working abroad could also bring their experiences and business know-how (e.g., tourism, and services) when they return home. Going forward, it will be important to increase skilled job opportunities and incentives so that they can return and choose suitable jobs.
Reliable data on remittance flows is key to monitoring external balance, labor market dynamics, and their impact on households’ standard of living. Further improvement in recording compensation of employees and personal transfers from Timorese residents and national working abroad in the balance of payments statistics based on available information from financial institutions is currently being reviewed by the BCTL with the support of Fund TA.
1 Remittances in 2013 and 2014 are staff’s crude estimates using the transaction data from money transfer operators. The end of UN peacekeeping operation in 2012 contributed to some extent the decline in outflows. 2 Timor-Leste National Strategic Development Plan 2011-2013.
Formal schooling, 6.8
Vocational traning
program, 13.6
Training program
provided by NGO, 3.4
On the job training, 8.0
Learning from parent, relative,
friend, 21.6
Self-taught, 47.7
Source: Labor Force Survey, 2010.
Type of Training Received by Those Employed(In percent)
05
1015202530
Man
ager
s &
pr
ofes
sion
als
Plan
t & m
achi
ne
oper
ator
s
Asso
ciat
e pr
ofes
sion
als
Cler
ical
sup
port
w
orke
rs
Serv
ice
and
sale
w
orke
rs
Elem
enta
ry
occu
patio
ns
Craf
t & r
elat
ed tr
ade
wor
kers
Share of Foreign Workers by Occupation(In percent)
Source: Enterprise and Skills Survey, 2014.
0
20
40
60
80
100
120
140
2006
2007
2008
2009
2010
2011
2012
2013
2014
Outflows
Inflows
Remittance Inflows and Outflows(In millions of USD)
Sources: Country authorities; and staff estimates.
DEMOCRATIC REPUBLIC OF TIMOR-LESTE STAFF REPORT FOR THE 2016 ARTICLE IV CONSULTATION—INFORMATIONAL ANNEX
Prepared By Asia and Pacific Department (In consultation with other departments)
FUND RELATIONS _______________________________________________________________________ 2
WORLD BANK—IMF COLLABORATION ________________________________________________ 5
RELATIONS WITH THE ASIAN DEVELOPMENT BANK _________________________________ 8
STATISTICAL ISSUES _____________________________________________________________________ 9
CONTENTS
April 7, 2016
DEMOCRATIC REPUBLIC OF TIMOR-LESTE
2 INTERNATIONAL MONETARY FUND
FUND RELATIONS (As of February 29, 2016)
Membership Status Joined: July 23, 2002; Article VIII
General Resources Account SDR Million Percent Quota
Quota 25.60 100.00
Fund holdings of currency 21.25 83.01
Reserve position in Fund 4.35 17.00
SDR Department SDR Million Percent Allocation
Net cumulative allocation 7.73 100.00
Holdings 3.40 44.01
Outstanding Purchases and Loans: None
Latest Financial Arrangements: None
Projected Obligations to Fund: None
Exchange Rate Arrangements The exchange rate arrangement (de jure and de facto) is an exchange arrangement with no separate legal tender. On January 24, 2000, the U.S. dollar was adopted as the official currency of then East Timor by the United Nations Transitional Administration in East Timor (UNTAET). This arrangement has been maintained after Timor-Leste’s independence on May 20, 2002. At present, the monetary authority does not undertake foreign exchange transactions; they are handled by commercial banks on the basis of rates quoted in the international markets. Timor-Leste has accepted the obligations under Article VIII, Sections 2(a), 3 and 4, and maintains an exchange system that is free of restrictions on the making of payments and transfers for current international transactions.
Article IV Consultations Timor-Leste is on a 12-month consultation cycle. The last Article IV consultation was concluded on September 15 , 2014. The press release may be found at http://www.imf.org/external/np/sec/pr/2014/pr14478.htm.
Technical Assistance (TA) and Training TA has been provided by HQ based staff and experts in collaboration with the Pacific Financial Technical Assistance Centre (PFTAC), in close collaboration with development partners. Significant
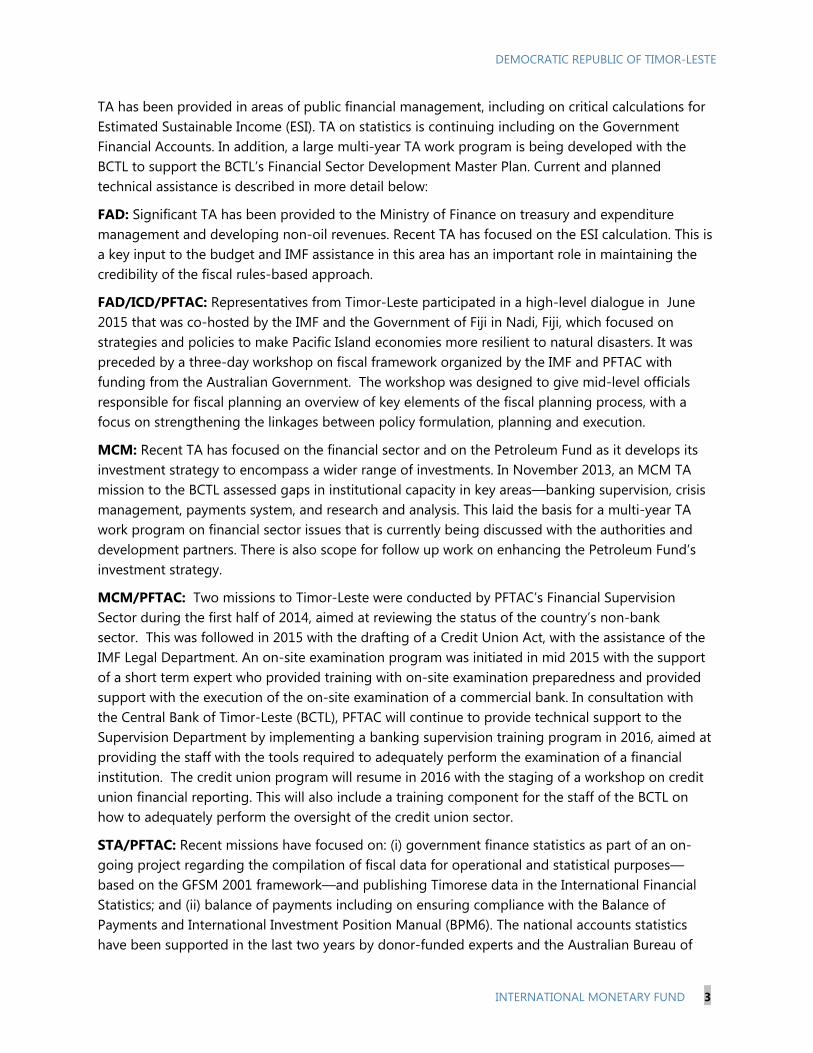
DEMOCRATIC REPUBLIC OF TIMOR-LESTE
INTERNATIONAL MONETARY FUND 3
TA has been provided in areas of public financial management, including on critical calculations for Estimated Sustainable Income (ESI). TA on statistics is continuing including on the Government Financial Accounts. In addition, a large multi-year TA work program is being developed with the BCTL to support the BCTL’s Financial Sector Development Master Plan. Current and planned technical assistance is described in more detail below:
FAD: Significant TA has been provided to the Ministry of Finance on treasury and expenditure management and developing non-oil revenues. Recent TA has focused on the ESI calculation. This is a key input to the budget and IMF assistance in this area has an important role in maintaining the credibility of the fiscal rules-based approach.
FAD/ICD/PFTAC: Representatives from Timor-Leste participated in a high-level dialogue in June 2015 that was co-hosted by the IMF and the Government of Fiji in Nadi, Fiji, which focused on strategies and policies to make Pacific Island economies more resilient to natural disasters. It was preceded by a three-day workshop on fiscal framework organized by the IMF and PFTAC with funding from the Australian Government. The workshop was designed to give mid-level officials responsible for fiscal planning an overview of key elements of the fiscal planning process, with a focus on strengthening the linkages between policy formulation, planning and execution.
MCM: Recent TA has focused on the financial sector and on the Petroleum Fund as it develops its investment strategy to encompass a wider range of investments. In November 2013, an MCM TA mission to the BCTL assessed gaps in institutional capacity in key areas—banking supervision, crisis management, payments system, and research and analysis. This laid the basis for a multi-year TA work program on financial sector issues that is currently being discussed with the authorities and development partners. There is also scope for follow up work on enhancing the Petroleum Fund’s investment strategy.
MCM/PFTAC: Two missions to Timor-Leste were conducted by PFTAC’s Financial Supervision Sector during the first half of 2014, aimed at reviewing the status of the country’s non-bank sector. This was followed in 2015 with the drafting of a Credit Union Act, with the assistance of the IMF Legal Department. An on-site examination program was initiated in mid 2015 with the support of a short term expert who provided training with on-site examination preparedness and provided support with the execution of the on-site examination of a commercial bank. In consultation with the Central Bank of Timor-Leste (BCTL), PFTAC will continue to provide technical support to the Supervision Department by implementing a banking supervision training program in 2016, aimed at providing the staff with the tools required to adequately perform the examination of a financial institution. The credit union program will resume in 2016 with the staging of a workshop on credit union financial reporting. This will also include a training component for the staff of the BCTL on how to adequately perform the oversight of the credit union sector.
STA/PFTAC: Recent missions have focused on: (i) government finance statistics as part of an on-going project regarding the compilation of fiscal data for operational and statistical purposes—based on the GFSM 2001 framework—and publishing Timorese data in the International Financial Statistics; and (ii) balance of payments including on ensuring compliance with the Balance of Payments and International Investment Position Manual (BPM6). The national accounts statistics have been supported in the last two years by donor-funded experts and the Australian Bureau of

DEMOCRATIC REPUBLIC OF TIMOR-LESTE
4 INTERNATIONAL MONETARY FUND
Statistics and PFTAC has had reduced involvement other than having staff attend training workshops.
MACROECONOMIC ANALYSIS/PFTAC :
STI: Government officials from Timor-Leste attend IMF training courses on macroeconomic and financial policies including statistics and legal issues offered by the STI, both in Singapore and in the region. In 2014–15, a total of 15 participants from Timor-Leste attended STI training courses in Singapore.
Resident Representative The resident representative office in Dili, established in August 2000, closed at end-June 2009.

DEMOCRATIC REPUBLIC OF TIMOR-LESTE
INTERNATIONAL MONETARY FUND 5
WORLD BANK—IMF COLLABORATION The Bank and Fund country teams for Timor-Leste, led by Ms. Bolormaa Amgaabazar (World Bank Country Representative) and Ms. Yu Ching Wong (IMF mission chief), are cooperating closely on macroeconomic and macro-critical structural reform issues. The Bank’s country economist, Mr. David Knight, participated in the 2016 Article IV consultation mission.
The two teams have worked closely on the following:
Macroeconomic developments and economic updates: There has been close dialoguethroughout the year on macro policies and economic developments. There is regular sharingof information and development of common policy recommendations.
Growth prospects and economic diversification: The teams exchanged views on potentialareas of diversifications and key policies to support diversification away from the oil sector.The Bank’s forthcoming East Asia Pacific Update will contain a special feature on ‘diversifieddevelopment’ on resource-rich countries in the region, including Timor-Leste.
Fiscal sustainability and investment management: Both teams highlighted longer-termfiscal sustainability as a major challenge facing Timor-Leste, particularly in light of recentadverse global market conditions in the petroleum sector. Following the Infrastructure PublicExpenditure Review published in March 2015, the World Bank is working on a medium-termexpenditure pressures note for the health sector and is preparing to start work on a publicexpenditure review of the agriculture sector. The Fund and the Bank stand ready to providefurther support on fiscal policy and public expenditure analysis.
Revenue mobilization: Both teams have discussed domestic revenue mobilization potentialand policy reforms underway. The Bank is has provided ad-hoc support to the fiscal reformincluding by advising on non-tax revenue legislation and mining legislation. Both institutionsstand ready to provide further assistance to support the implementation of key aspects ofthe government’s fiscal reform program.
Debt management: The teams have engaged very closely on discussions around thegovernments growing debt portfolio and its reforms to strengthen debt managementsystems. The Bank and the Fund stand ready to provide complementary technical assistanceupon government’s request. A full DSA was collaboratively updated in February 2016.
The World Bank Group assistance to Timor-Leste is guided by the Country Partnership Strategy (CPS) that was approved by the Executive Board in February 2013. The CPS outlines a program that supports Timor-Leste by utilizing financing available from IBRD and IDA and trust fund resources to support investments in critical infrastructure that reduces poverty and boosts shared prosperity, improve service delivery and effective macroeconomic, social and fiscal management.
DEMOCRATIC REPUBLIC OF TIMOR-LESTE
6 INTERNATIONAL MONETARY FUND
Both teams agreed that Timor-Leste’s main macroeconomic challenges lie in developing a stronger non-oil economy that reduces poverty and in safeguarding long-term fiscal sustainability. To meet these challenges, Timor-Leste needs to shift to a higher quality and poverty reducing growth path while ensuring macroeconomic stability. Achieving fiscal sustainability will require prioritization of public investments through rigorous investment appraisal and further strengthening of public financial management, mobilizing non-oil revenues, and adhering to a medium-term fiscal consolidation plan. An acceleration of reforms to promote productivity and competitiveness is also important.
The teams agreed to continue the close cooperation going forward. The Table below details the specific activities planned by the two country teams in 2016-17 period.
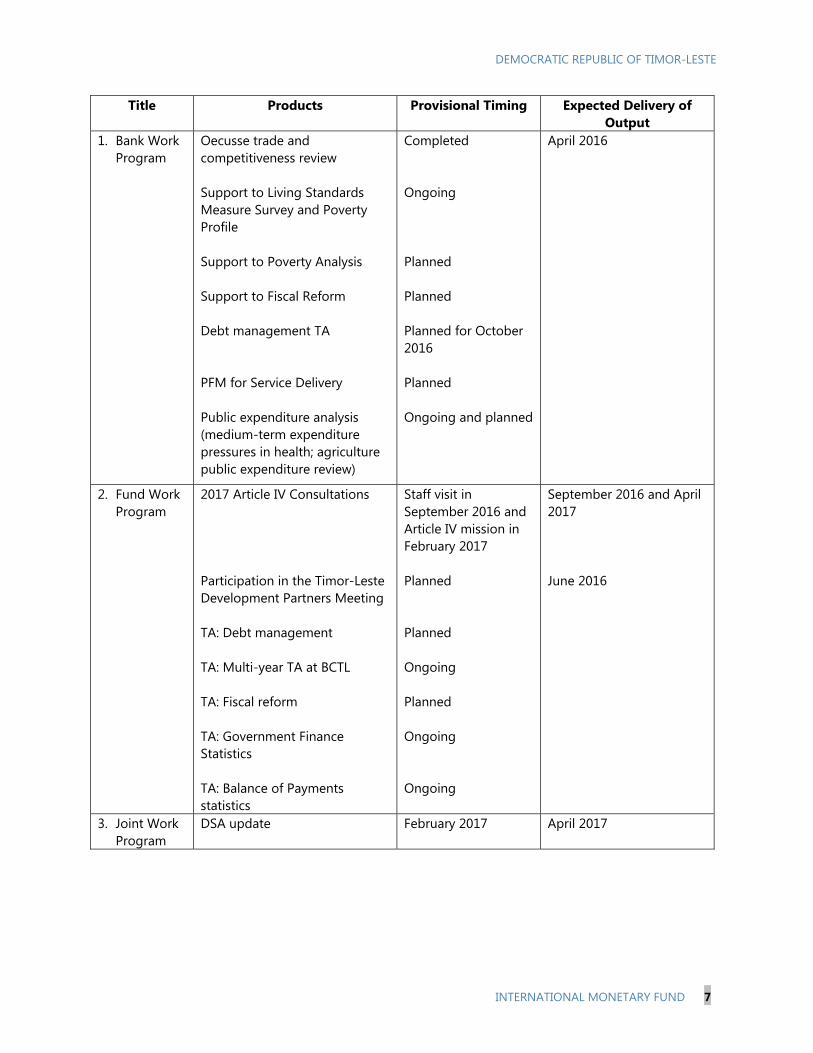
DEMOCRATIC REPUBLIC OF TIMOR-LESTE
INTERNATIONAL MONETARY FUND 7
Title Products Provisional Timing Expected Delivery of Output
1. Bank WorkProgram
Oecusse trade and competitiveness review
Support to Living Standards Measure Survey and Poverty Profile
Support to Poverty Analysis
Support to Fiscal Reform
Debt management TA
PFM for Service Delivery
Public expenditure analysis (medium-term expenditure pressures in health; agriculture public expenditure review)
Completed
Ongoing
Planned
Planned
Planned for October 2016
Planned
Ongoing and planned
April 2016
2. Fund WorkProgram
2017 Article IV Consultations
Participation in the Timor-Leste Development Partners Meeting
TA: Debt management
TA: Multi-year TA at BCTL
TA: Fiscal reform
TA: Government Finance Statistics
TA: Balance of Payments statistics
Staff visit in September 2016 and Article IV mission in February 2017
Planned
Planned
Ongoing
Planned
Ongoing
Ongoing
September 2016 and April 2017
June 2016
3. Joint WorkProgram
DSA update February 2017 April 2017
DEMOCRATIC REPUBLIC OF TIMOR-LESTE
8 INTERNATIONAL MONETARY FUND
RELATIONS WITH THE ASIAN DEVELOPMENT BANK (As of March 2016)
Timor-Leste joined the Asian Development Bank (AsDB) in 2002. The relationship has evolved from an initial focus on rehabilitation and reconstruction to development of the infrastructure and institutional capacity needed for growth and poverty reduction. AsDB is supporting the implementation of Timor-Leste’s Strategic Development Plan 2011-2030 (SDP). A five year country partnership strategy guided AsDB’s support for the first phase of the SDP and a new strategy for 2016-2020 is now being finalized in collaboration with the government. The new strategy will support economic diversification by working with the government to remove infrastructure bottlenecks and institutional constraints, and invest in skills development.
Timor-Leste first accessed the Asian Development Fund (ADF) in 2005. The ADF has provided grants for road rehabilitation, water supply and technical and vocational education and training projects. AsDB has worked closely with the government to develop capacity for infrastructure management. A $15 million six-year technical assistance package, that was co-financed with AusAID, helped plan, prepare, and execute the Government’s capital development program and train government officials. Subsequent projects have supported infrastructure management together with policy and planning for transport, urban water supplies, and the electricity sector.
AsDB is helping Timor-Leste to prepare for membership of the Association of Southeast Asian Nations and to develop a competitive financial sector. The AsDB helped establish the Institute of Microfinance in Timor-Leste, which, in July 2011, became the country’s first locally owned commercial bank, the Banco Nacional Comércio de Timor-Leste (BNCTL). AsDB continues to support the growth and commercialization of BNCTL and is also helping the government to establish a legal framework for bankruptcy and secured transactions. The AsDB provided technical support for the establishment of the Petroleum Fund and other core elements of public sector management. It is also supporting the government’s fiscal reform program and helped to design a new value added tax that could be used to increase domestic revenue collection.
The availability of AsDB resources increased in 2011 following Timor-Leste’s reclassification as a group B member country. This provides access to AsDB’s ordinary capital resources (OCR), while retaining access to loans from the Asian Development Fund (ADF). Timor-Leste has borrowed $42.21 million of ADF and $135.63 million of OCR since 2011 to finance upgrading of national roads. Further lending for investment in roads, a seaport, urban water supply and electricity services is planned for 2016–2018. AsDB continues to promote the provision of a range of infrastructure services, by the private sector and will help the government to leverage private sector expertise.
The indicative ADF allocation for 2016–2018 is $73.16 million and the indicative OCR allocation for 2016–2018 is $78.07 million. Actual allocations will depend on demand and on portfolio performance.
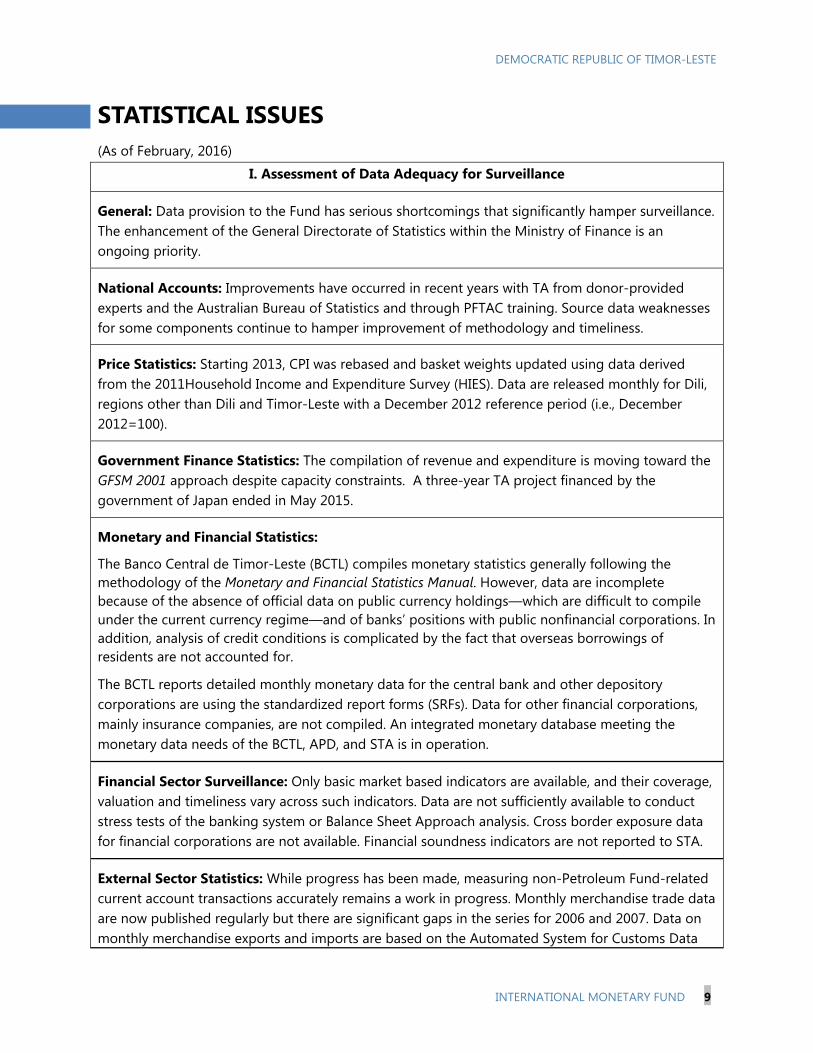
DEMOCRATIC REPUBLIC OF TIMOR-LESTE
INTERNATIONAL MONETARY FUND 9
STATISTICAL ISSUES (As of February, 2016)
I. Assessment of Data Adequacy for Surveillance
General: Data provision to the Fund has serious shortcomings that significantly hamper surveillance. The enhancement of the General Directorate of Statistics within the Ministry of Finance is an ongoing priority.
National Accounts: Improvements have occurred in recent years with TA from donor-provided experts and the Australian Bureau of Statistics and through PFTAC training. Source data weaknesses for some components continue to hamper improvement of methodology and timeliness.
Price Statistics: Starting 2013, CPI was rebased and basket weights updated using data derived from the 2011Household Income and Expenditure Survey (HIES). Data are released monthly for Dili, regions other than Dili and Timor-Leste with a December 2012 reference period (i.e., December 2012=100).
Government Finance Statistics: The compilation of revenue and expenditure is moving toward the GFSM 2001 approach despite capacity constraints. A three-year TA project financed by the government of Japan ended in May 2015.
Monetary and Financial Statistics:
The Banco Central de Timor-Leste (BCTL) compiles monetary statistics generally following the methodology of the Monetary and Financial Statistics Manual. However, data are incomplete because of the absence of official data on public currency holdings—which are difficult to compile under the current currency regime—and of banks’ positions with public nonfinancial corporations. In addition, analysis of credit conditions is complicated by the fact that overseas borrowings of residents are not accounted for.
The BCTL reports detailed monthly monetary data for the central bank and other depository corporations are using the standardized report forms (SRFs). Data for other financial corporations, mainly insurance companies, are not compiled. An integrated monetary database meeting the monetary data needs of the BCTL, APD, and STA is in operation.
Financial Sector Surveillance: Only basic market based indicators are available, and their coverage, valuation and timeliness vary across such indicators. Data are not sufficiently available to conduct stress tests of the banking system or Balance Sheet Approach analysis. Cross border exposure data for financial corporations are not available. Financial soundness indicators are not reported to STA.
External Sector Statistics: While progress has been made, measuring non-Petroleum Fund-related current account transactions accurately remains a work in progress. Monthly merchandise trade data are now published regularly but there are significant gaps in the series for 2006 and 2007. Data on monthly merchandise exports and imports are based on the Automated System for Customs Data
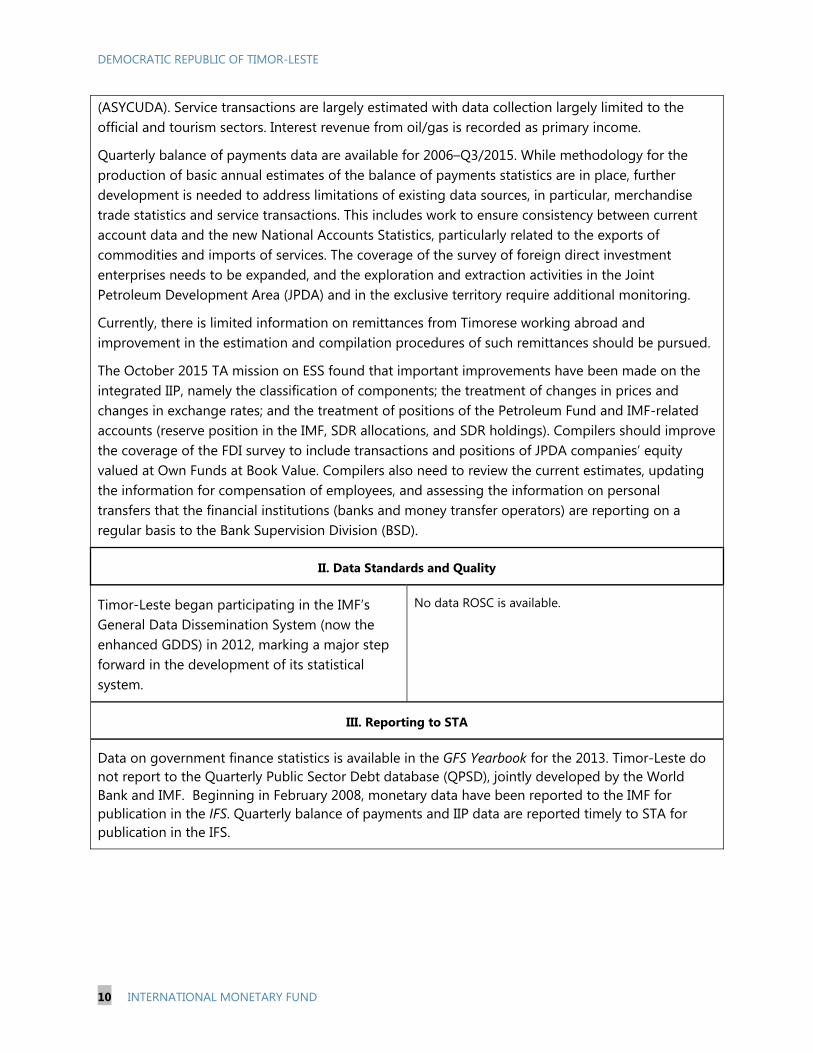
DEMOCRATIC REPUBLIC OF TIMOR-LESTE
10 INTERNATIONAL MONETARY FUND
(ASYCUDA). Service transactions are largely estimated with data collection largely limited to the official and tourism sectors. Interest revenue from oil/gas is recorded as primary income.
Quarterly balance of payments data are available for 2006–Q3/2015. While methodology for the production of basic annual estimates of the balance of payments statistics are in place, further development is needed to address limitations of existing data sources, in particular, merchandise trade statistics and service transactions. This includes work to ensure consistency between current account data and the new National Accounts Statistics, particularly related to the exports of commodities and imports of services. The coverage of the survey of foreign direct investment enterprises needs to be expanded, and the exploration and extraction activities in the Joint Petroleum Development Area (JPDA) and in the exclusive territory require additional monitoring.
Currently, there is limited information on remittances from Timorese working abroad and improvement in the estimation and compilation procedures of such remittances should be pursued.
The October 2015 TA mission on ESS found that important improvements have been made on the integrated IIP, namely the classification of components; the treatment of changes in prices and changes in exchange rates; and the treatment of positions of the Petroleum Fund and IMF-related accounts (reserve position in the IMF, SDR allocations, and SDR holdings). Compilers should improve the coverage of the FDI survey to include transactions and positions of JPDA companies’ equity valued at Own Funds at Book Value. Compilers also need to review the current estimates, updating the information for compensation of employees, and assessing the information on personal transfers that the financial institutions (banks and money transfer operators) are reporting on a regular basis to the Bank Supervision Division (BSD).
II. Data Standards and Quality
Timor-Leste began participating in the IMF’s General Data Dissemination System (now the enhanced GDDS) in 2012, marking a major step forward in the development of its statistical system.
No data ROSC is available.
III. Reporting to STA
Data on government finance statistics is available in the GFS Yearbook for the 2013. Timor-Leste do not report to the Quarterly Public Sector Debt database (QPSD), jointly developed by the World Bank and IMF. Beginning in February 2008, monetary data have been reported to the IMF for publication in the IFS. Quarterly balance of payments and IIP data are reported timely to STA for publication in the IFS.

DEMOCRATIC REPUBLIC OF TIMOR-LESTE
INTERNATIONAL MONETARY FUND 11
Table of Common Indicators Required for Surveillance (As of March 15, 2016)
Date of latest observation Date received Frequency of
Data7 Frequency of Reporting7 Frequency of
Publication7
Exchange Rates 3/2016 3/2016 D D D
International Reserve Assets and Reserve Liabilities of the Monetary Authorities1 1/2016 2/2016 M M M
Reserve/Base Money 1/2016 2/2016 M M M
Broad Money 1/2016 2/2016 M M M
Central Bank Balance Sheet 1/2016 2/2016 M M M
Consolidated Balance Sheet of the Banking System 1/2016 2/2016 M M M
Interest Rates2
1/2016 2/2016 M M M
Consumer Price Index 1/2016 3/2016 M M M
Revenue, Expenditure, Balance and Composition of Financing3 –General Government4
2015 3/2016 A A A
Revenue, Expenditure, Balance and Composition of Financing3–Central Government
2015 3/2016 A A A
Central Government and Central Government-Guaranteed Debt5 2015 3/2016 A A A
External Current Account Balance Q3/2015 1/2016 Q Q Q
Exports and Imports of Goods and Services Q3/2015 1/2016 M M M
GDP/GNP 2013 6/ 2015 A A A
Gross External Debt 12/2015 3/2016 Q Q Q
International Investment Position6
Q3/2015 1/2016 Q Q Q
1 Any reserve assets that are pledged or otherwise encumbered should be specified separately. Also, data should comprise short-term liabilities linked to a foreign currency but settled by other means as well as the notional values of financial derivatives to pay and to receive foreign currency, including those linked to a foreign currency but settled by other means. 2 Both market-based and officially-determined, including discount rates, money market rates, rates on treasury bills, notes and bonds. 3 Foreign, domestic bank, and domestic nonbank financing. 4 The general government consists of the central government (budgetary funds, extra budgetary funds, and social security funds) and statand local governments. 5 Includes only goods. There are significant gaps in the series. No information on services is available. 6 Includes external gross financial asset and liability positions vis-à-vis nonresidents. 7 Daily (D), Weekly (W), Monthly (M), Quarterly (Q), Annually (A); NA: Not Available.

DEMOCRATIC REPUBLIC OF TIMOR-LESTE STAFF REPORT FOR THE 2016 ARTICLE IV CONSULTATION—DEBT SUSTAINABILITY ANALYSIS
The Debt Sustainability Analysis (DSA) indicates that Timor-Leste is at moderate risk of debt distress.2 This represents a downgrade from a low risk of debt distress at the time of the 2014 DSA. The deterioration in the debt rating reflects a shift in the authorities’ financing strategy, namely to increase the use of concessional borrowing to finance frontloaded infrastructure spending in order to reduce financing by the drawdown of the assets of the Petroleum Fund (PF). At end-2015, net public assets (oil-related savings accumulated in the PF and currently negligible debt stock) stood at over $16 billion. The DSA suggests that current fiscal spending plans are unsustainable as the PF will be depleted in the long term given the current rate of withdrawals under existing expenditure plans. Achieving fiscal sustainability requires scaling back large front-loaded public investment plans in line with implementation capacity, rationalizing recurrent spending, and strengthening non-oil revenues. Bold fiscal consolidation measures are needed to safeguard long-term fiscal and debt sustainability. High fiscal spending and inadequate mobilization of domestic revenues are the main sources of risk. Feasibility studies to ensure that public investment is efficient and yields adequate returns would help to ensure fiscal sustainability.
1 This DSA has been prepared by the IMF staff with input from World Bank Group staff, using the debt sustainability framework for low-income countries approved by the Boards of both institutions. 2 The DSA presented in this document is based on the standard low-income countries (LIC) DSA framework. See “Debt Sustainability in Low-Income Countries: Proposal for an Operational Framework and Policy implications” (http://www.imf.org/external/np/pdr/sustain/2004/020304.htm) and “Debt Sustainability in Low-Income Countries: Further Considerations on an Operational Framework, Policy Implications” (http://www.imf.org/external/np/pdr/sustain/2004/091004.htm).
Approved By Hoe Ee Khor and Andrea Richter Hume (IMF) and Satu Kahkonen (IDA)
Prepared by Staff of the International Monetary Fund and the International Development Association1
April 7, 2016
DEMOCRATIC REPUBLIC OF TIMOR-LESTE
2 INTERNATIONAL MONETARY FUND
UNDERLYING ASSUMPTIONS
1. This DSA is based on the macroeconomic framework outlined in the IMF’s staff report for the 2016 Article IV consultation. Staff projections are for total nominal GDP to contract through 2016, as oil production declines. Staff projects real non-oil GDP growth to be in the range of 5–6½ percent in the medium term. This growth is expected to be more private-sector led than in the past in Timor-Leste, and is lower than previously projected, reflecting a weaker global outlook. Inflationary pressure is expected to remain low in the medium term due to lower global commodity prices and continued strength of the U.S. dollar against Timor-Leste’s trading partners’ currencies. However, compared to the 2014 DSA, the external current account balance is expected to deteriorate due to a greater decline in oil and gas prices and diminishing oil exports. Macroeconomic assumptions for this DSA are outlined in Box 1. To illustrate the impact of different policy options on debt sustainability, three scenarios were considered in this DSA which are outlined below.
2. The 2016 Budget scenario assumes full implementation of frontloaded capital spending in 2017–20. Total capital spending during this period will reach US$3.4 billion consisting of proposed front-loaded infrastructure investments in roads, bridges, ports, and airport deemed essential to lay the foundation for private sector-led development for achieving the Strategic Development Plan 2011-30. On average, 70 percent of the larger financing gap in 2017–20 will be met by withdrawals from the Petroleum Fund (PF), the bulk of which will consist of withdrawals above the Estimated Sustainable Income (ESI), complemented by concessional borrowing (see text table).
3. The baseline fiscal scenario reflects a reduction in capital spending to reflect implementation capacity. Given capacity constraints and past low implementation rates of large capital projects, the frontloading of capital spending under the baseline scenario is assumed to be two-third of the amount for 2017-20 outlined in the 2016 Budget. The investment plans underlying this scenario (and the adjustment scenario) are proposed mid-sized key infrastructure projects such as roads and bridges, a subset of the infrastructure plans. The baseline scenario also assumes a cap on total withdrawal of the PF of US$1.3 billion, broadly in line with the notional budget envelope proposed during the Yellow Road Workshop discussions of domestic stakeholders that will ensure fiscal sustainability. Despite lower capital spending, the expected borrowing during 2017–20 is comparable to that under the 2016 Budget scenario given lower excess PF withdrawal.
4. Under staff’s proposed adjustment scenario, bold policy actions are adopted to ensure long-term fiscal sustainability. Under this scenario, the increase in capital spending projected by the 2016 Budget over 2017–20 is reduced by one-half. Total spending is kept at under $1.4 billion (excluding donor projects) during 2022–26 and as a constant share of GDP after 2027. This scenario also assumes domestic revenue mobilization measures including the introduction of a value-added tax (VAT) in the medium term to achieve the government’s tax revenue goal of 15 percent of non-oil GDP in 2020. Over the long term, the need for concessional borrowing is lower compared to the

DEMOCRATIC REPUBLIC OF TIMOR-LESTE
INTERNATIONAL MONETARY FUND 3
baseline and budget scenarios on account of stronger revenue mobilization. Reliance on excess PF withdrawals is lower, and ceases beyond 2025. Figure 1 and the text table show the profile of the PF balance and fiscal funding gaps under the three scenarios.
Box 1. Timor-Leste: Macroeconomic Assumptions Underlying the DSA
Real GDP growth is projected to fall in the medium term on account of declining oil production. Oil production is estimated to run out by 2023. Non-oil GDP growth is projected to be in the range of 5–6½ percent over the medium term in part supported by expected foreign direct investment inflows and to stabilize at around 5.5 percent for 2021–35. Growth assumptions are lower relative to the 2014 DSA reflecting a weaker global outlook.
Inflation is expected to increase steadily over the medium term to about 4 percent on account of some spillovers from public investment activity and is maintained at that level in the long run.
The current account balance is expected to remain in surplus up to 2016, after which it moves into deficit, reflecting lower oil and gas receipts and higher imports generated by infrastructure projects. These current account balance assumptions are substantially weaker relative to the 2014 DSA on account of lower global oil prices.
The grant element of loans is assumed to decline over the medium term reflecting the financing needs of frontloaded infrastructure projects and to stabilize at about 40 percent in the long run after the infrastructure spending peak is over. The average interest rate on concessional loans for 2021–35 is projected at 1.8 percent.
External borrowing. Given the front-loading of capital expenditure projects in 2017-21 under the baseline scenario, borrowing is projected to decline rapidly from $171 million per annum in the medium term to $37 million per annum in the long term.
Medium Term Long Term Medium Term Long Term2015-2021 2022-2035 2014-2020 2021-2034
Real GDP Growth (in percent) 5.5 5.5 7.0 7.0Inflation (in percent) 3.3 4.0 3.5 4.0Overall fiscal balance (in percent of GDP) -15.5 -10.5 19.5 -9.0Current account (in percent of GDP) -5.4 -15.8 20.7 -5.7Revenue (in percent of GDP) 50.7 20.7 56.9 26.5Borrowing (in millions of USD, period average) 171 37 91 50
Source: IMF staff estimates
Current DSA Previous DSAKey Macroeconomic Assumptions Underlying the DSA

DEMOCRATIC REPUBLIC OF TIMOR-LESTE
4 INTERNATIONAL MONETARY FUND
Figure 1. Timor-Leste: Petroleum Fund Balance Dynamics Under the 2016 Budget, Baseline, and Adjustment Scenarios
-3,000
-2,000
-1,000
0
1,000
2,000
3,000
4,000
5,000
2006 2008 2010 2012 2014 2016 2018 2020 2022 2024 2026 2028 2030
Revenues Investment return ESIExcess withdrawal External financing Net inflows
PF Dynamics: 2016 Budget Scenario (flow) 1/(In millions of US dollars)
1/ Staff extrapolation from 2021.
-8,000-6,000-4,000-2,000
02,0004,0006,0008,000
10,00012,00014,00016,00018,00020,00022,000
2008
2009
2010
2011
2012
2013
2014
2015
2016
2017
2018
2019
2020
2021
2022
2023
2024
2025
2026
2027
2028
2029
2030
PF Balance Debt Net balance
PF Dynamics: 2016 Budget Scenario(stock) 1/(In millions of US dollars)
1/ Staff extrapolation from 2021.
-3,000
-2,000
-1,000
0
1,000
2,000
3,000
4,000
5,000
2006 2008 2010 2012 2014 2016 2018 2020 2022 2024 2026 2028 2030
Revenues Investment return ESIExcess withdrawal External Financing Net inflows
PF Dynamics: Baseline Scenario (flow)(In millions of US dollars)
Source: IMF staff calculations
-8,000-6,000-4,000-2,000
02,0004,0006,0008,000
10,00012,00014,00016,00018,00020,00022,000
2008
2009
2010
2011
2012
2013
2014
2015
2016
2017
2018
2019
2020
2021
2022
2023
2024
2025
2026
2027
2028
2029
2030
PF Balance Debt Net balance
PF Dynamics: Baseline Scenario (stock)(In millions of US dollars)
-3,000
-2,000
-1,000
0
1,000
2,000
3,000
4,000
5,000
2006 2008 2010 2012 2014 2016 2018 2020 2022 2024 2026 2028 2030
Revenues Investment return ESIExcess withdrawal External Financing Net inflows
PF Dynamics: Adjustment Scenario (flow)(In millions of US dollars)
Source: IMF staff calculations
-8,000-6,000-4,000-2,000
02,0004,0006,0008,000
10,00012,00014,00016,00018,00020,00022,000
2008
2009
2010
2011
2012
2013
2014
2015
2016
2017
2018
2019
2020
2021
2022
2023
2024
2025
2026
2027
2028
2029
2030
PF Balance Debt Net balance
PF Dynamics: Adjustment Scenario (stock)(In millions of US dollars)

DEMOCRATIC REPUBLIC OF TIMOR-LESTE
INTERNATIONAL MONETARY FUND 5
5. The DSA is based on the following:
Timor-Leste has a weak Country Policy and Institutional Assessment (CPIA) performance rating, corresponding to the lowest set of indicative debt thresholds.
The DSA framework uses a 5 percent discount rate.
Concessional debt is defined as debt that exceeds a minimum grant element of 35 percent. Semi-concessional debt has a positive grant element that does not meet the minimum grant element.
The DSA adopts a broad concept of exports which includes exports of goods and services, as well as primary oil-related incomes.
Total public sector revenue is defined as non-oil domestic revenue plus the estimated sustainable income (ESI) from the PF. The funding gap is met by PF withdrawals in excess of the ESI and external borrowing.
All debt is undertaken by the central government. No off-balance sheet debt is accumulated, including by state-owned enterprises such as the national oil company, the Timor GAP.
Debt financing contracted by the central government relating to the funding of infrastructure projects should be on a concessional basis.
2017 2018 2019 2020 2021Total
(2017–21)
2016 Budget Framework 2/
Funding gap 1,258 1,784 1,423 1,072 1,012 6,547
Excess PF Withdrawal 909 1,417 1,262 1,033 1,000 5,621
Borrowing 348 366 161 39 12 926
Baseline Scenario
Funding gap 951 930 999 1,059 951 4,890
Excess PF Withdrawal 778 715 763 777 791 3,824
Borrowing 173 215 237 281 160 1,066
Adjustment Scenario
Funding gap 675 583 533 491 449 2,730
Excess PF Withdrawal 426 336 409 345 349 1,865
Borrowing 248 246 124 147 100 865
1/ Funding gap is defined as financing need not met by withdrawal of the EstimatedSustainable Income (ESI)
2/ Timor-Leste 2016 State Budget Book 1 (Approved)
Projected Medium-Term Fiscal Funding Gaps Under the 2016 Budget, Baseline, and Adjustment Scenarios 1/
(In millions of US dollars)
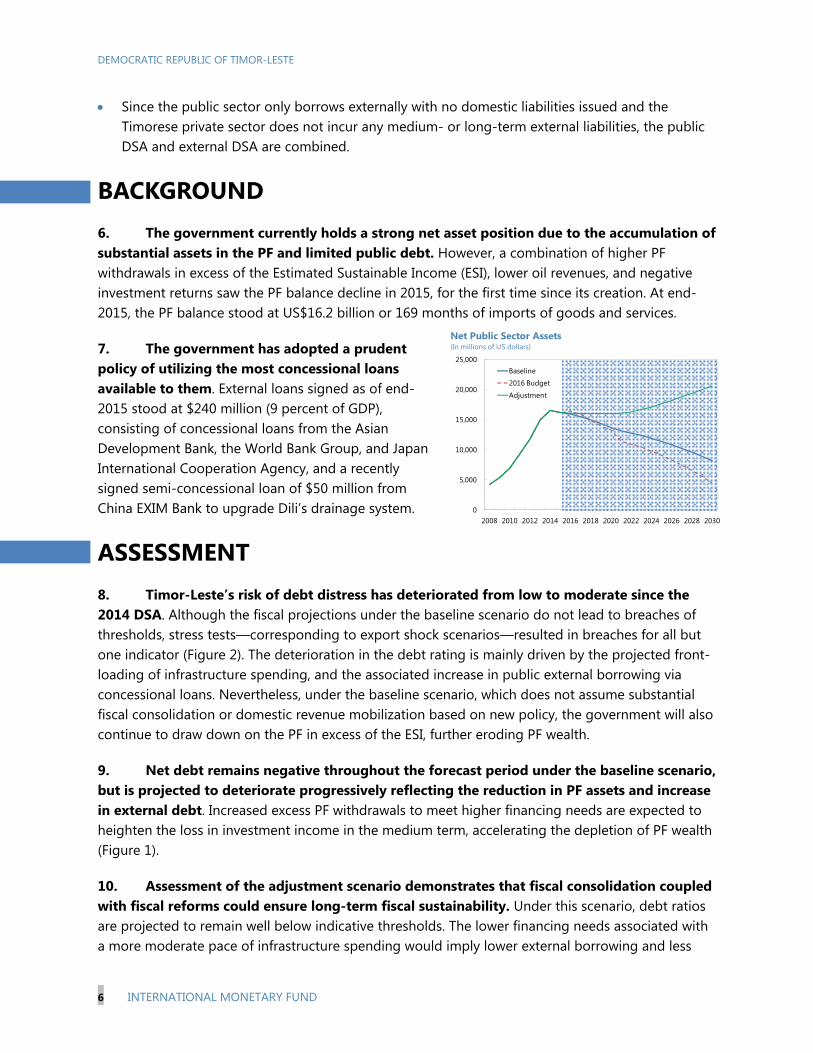
DEMOCRATIC REPUBLIC OF TIMOR-LESTE
6 INTERNATIONAL MONETARY FUND
0
5,000
10,000
15,000
20,000
25,000
2008 2010 2012 2014 2016 2018 2020 2022 2024 2026 2028 2030
Baseline
2016 Budget
Adjustment
Net Public Sector Assets(In millions of US dollars)
Since the public sector only borrows externally with no domestic liabilities issued and the Timorese private sector does not incur any medium- or long-term external liabilities, the public DSA and external DSA are combined.
BACKGROUND 6. The government currently holds a strong net asset position due to the accumulation of substantial assets in the PF and limited public debt. However, a combination of higher PF withdrawals in excess of the Estimated Sustainable Income (ESI), lower oil revenues, and negative investment returns saw the PF balance decline in 2015, for the first time since its creation. At end-2015, the PF balance stood at US$16.2 billion or 169 months of imports of goods and services.
7. The government has adopted a prudent policy of utilizing the most concessional loans available to them. External loans signed as of end-2015 stood at $240 million (9 percent of GDP), consisting of concessional loans from the Asian Development Bank, the World Bank Group, and Japan International Cooperation Agency, and a recently signed semi-concessional loan of $50 million from China EXIM Bank to upgrade Dili’s drainage system.
ASSESSMENT 8. Timor-Leste’s risk of debt distress has deteriorated from low to moderate since the 2014 DSA. Although the fiscal projections under the baseline scenario do not lead to breaches of thresholds, stress tests—corresponding to export shock scenarios—resulted in breaches for all but one indicator (Figure 2). The deterioration in the debt rating is mainly driven by the projected front-loading of infrastructure spending, and the associated increase in public external borrowing via concessional loans. Nevertheless, under the baseline scenario, which does not assume substantial fiscal consolidation or domestic revenue mobilization based on new policy, the government will also continue to draw down on the PF in excess of the ESI, further eroding PF wealth.
9. Net debt remains negative throughout the forecast period under the baseline scenario, but is projected to deteriorate progressively reflecting the reduction in PF assets and increase in external debt. Increased excess PF withdrawals to meet higher financing needs are expected to heighten the loss in investment income in the medium term, accelerating the depletion of PF wealth (Figure 1).
10. Assessment of the adjustment scenario demonstrates that fiscal consolidation coupled with fiscal reforms could ensure long-term fiscal sustainability. Under this scenario, debt ratios are projected to remain well below indicative thresholds. The lower financing needs associated with a more moderate pace of infrastructure spending would imply lower external borrowing and less

DEMOCRATIC REPUBLIC OF TIMOR-LESTE
INTERNATIONAL MONETARY FUND 7
reliance on excess PF withdrawals. With fiscal reforms—including the introduction of a value-added tax aimed at boosting domestic revenues to 15 percent of non-oil GDP—excess PF withdrawals could be gradually reduced to zero in the long term. This would allow PF assets to grow, ensuring the PF’s long-term sustainability. In addition, adopting policies to boost growth potential (through infrastructure and human capital investment) and enhance competitiveness (in wages and business conditions), would help to reduce the risks of weaker growth and help enhance fiscal and debt sustainability.
11. A strong debt management and asset-liability framework is needed to complement a prudent fiscal policy focused on long-term sustainability. The increased use of concessional financing and increased avenues for the government’s exposure to contingent liabilities—for instance, through higher use of public-private partnerships (PPPs)— are expected to increase the complexity of the consolidated government balance sheet. Key considerations include:
New debt liabilities. Non-concessional debt should be avoided.
Public-private partnerships. Need to be undertaken with realistic and transparent project assessments to reduce contingent liabilities.
Off-budget activities. Major capital-intensive projects tend to have complex financing structures and the cost-benefit of public participation in these projects can be difficult to assess. All such projects should be transparent and subject to full scrutiny.
Off-balance sheet activities should be avoided. This is particularly relevant for state-owned companies such as the oil company, Timor GAP, which should avoid undertaking equity positions in joint venture projects or issue liabilities in overseas markets.
Fiscal autonomy. The extension of a high level of fiscal autonomy to the ZEESM and the Oecusse SAR raises risks of off-budget expenditures and the accumulation of contingent liabilities.
Petroleum Fund. The strategic asset allocation away from purely high quality bonds toward equities with a 50:50 split (60:40 bond-to-equities as at end-2015) may be appropriate from a long-term intergenerational perspective, but the risk-return trade-offs in inherently volatile global financial markets need to be carefully considered. The provision to allow the PF to guarantee government debts (up to 10 percent of the PF’s assets) continues to be potentially risky and should be avoided.
AUTHORITIES' VIEWS 12. The authorities consider the risk of debt distress to be contained despite higher borrowing. Although projected external borrowing to finance government’s infrastructure spending over the next few years is considerable, the authorities view the projections under the baseline scenario as close to the upper limit of their expected financing needs. Their view is that actual

DEMOCRATIC REPUBLIC OF TIMOR-LESTE
8 INTERNATIONAL MONETARY FUND
borrowing will be determined by the pace of project implementation, which may be slower than projected in the baseline scenario of the DSA. The authorities also pointed out that the accumulated savings in the PF provide an ample buffer against debt distress. Moreover, the authorities highlighted the importance of infrastructure development as part of the Strategic Development Plan to transition Timor-Leste to upper middle income status by 2030. The resulting increase in growth potential is expected to contribute towards ensuring debt sustainability.
13. The authorities remain committed to long-term fiscal sustainability. Fiscal reform plans in the pipeline—which include the introduction of the value-added tax—will boost domestic revenue and help to ensure fiscal and debt sustainability. The authorities have also expressed interest in Fund TA to strengthen their capacity in debt management.
CONCLUSION 14. Timor-Leste’s debt is at moderate risk of debt distress driven by higher external borrowing. The plan to increase the utilization of external concessional financing reflects the government’s frontloaded infrastructure spending and strategy to preserve the wealth of the PF. The PF is a source of confidence for the economy and should be preserved as an endowment fund. The PF assets should be preserved in real terms and generate a permanent level of investment income to support government expenditures. While some drawdown of the assets of the PF is justified for infrastructure investment in order to diversify the economy and boost growth potential, the assets also need to be preserved at a level that is sufficient to provide adequate investment income for future generations. Meeting the financing gap through external loans is warranted, especially if the borrowing cost is lower than the opportunity cost of tapping into the PF as measured by the PF’s expected investment return, and guided by the DSA. The discipline of debt sustainability monitoring by creditors may also come with other benefits such as the transfer of knowledge by these multilateral or bilateral institutions.
15. Bold fiscal consolidation measures are needed to safeguard long-term fiscal and debt sustainability. Achieving fiscal sustainability requires scaling back large front-loaded public investment plans in line with implementation capacity, rationalizing recurrent spending, strengthening non-oil revenues, and adhering to a medium-term fiscal consolidation plan. In addition, better prioritization of public investment plans, focusing on high-return infrastructure projects through rigorous investment appraisal is important. Optimizing the composition and quality of spending to help close Timor-Leste’s infrastructure gap is key to long-term fiscal and debt sustainability
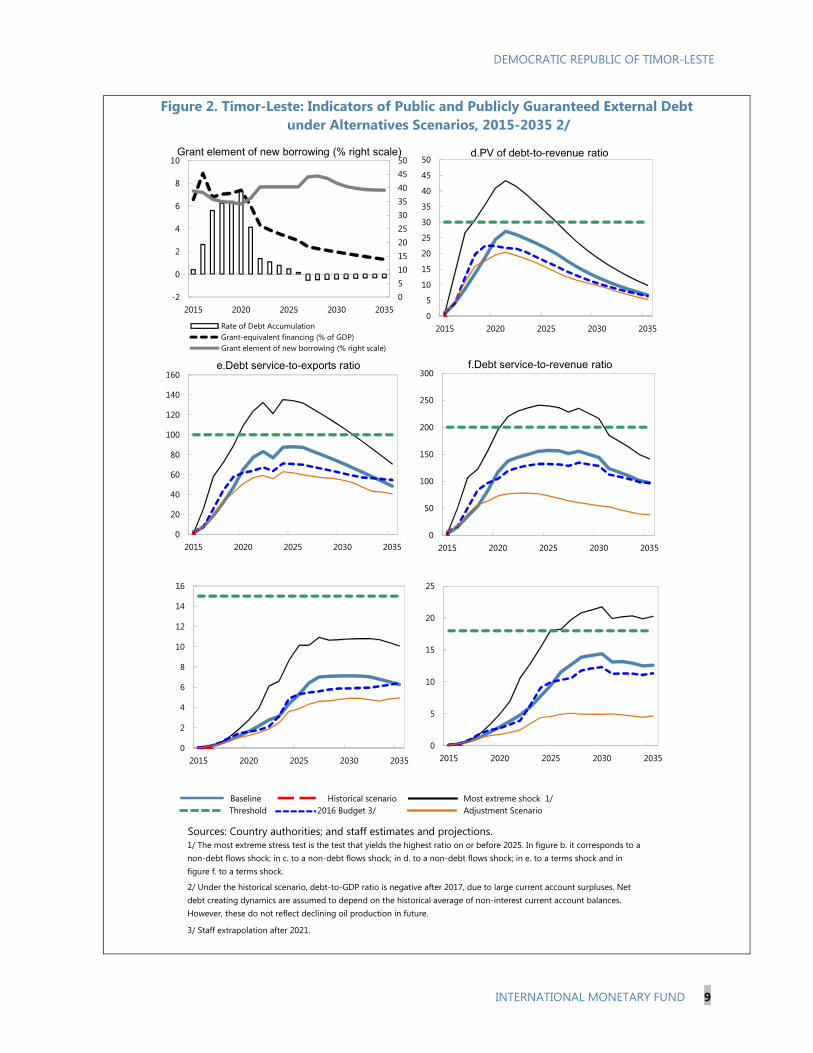
DEMOCRATIC REPUBLIC OF TIMOR-LESTE
INTERNATIONAL MONETARY FUND 9
Figure 2. Timor-Leste: Indicators of Public and Publicly Guaranteed External Debt under Alternatives Scenarios, 2015-2035 2/
Sources: Country authorities; and staff estimates and projections.
3/ Staff extrapolation after 2021.
1/ The most extreme stress test is the test that yields the highest ratio on or before 2025. In figure b. it corresponds to a non-debt flows shock; in c. to a non-debt flows shock; in d. to a non-debt flows shock; in e. to a terms shock and in figure f. to a terms shock.
Baseline Historical scenario Most extreme shock 1/ Threshold 2016 Budget 3/
2/ Under the historical scenario, debt-to-GDP ratio is negative after 2017, due to large current account surpluses. Net debt creating dynamics are assumed to depend on the historical average of non-interest current account balances. However, these do not reflect declining oil production in future.
Adjustment Scenario
0
5
10
15
20
25
2015 2020 2025 2030 2035
05101520253035404550
-2
0
2
4
6
8
10
2015 2020 2025 2030 2035
Rate of Debt AccumulationGrant-equivalent financing (% of GDP)Grant element of new borrowing (% right scale)
Grant element of new borrowing (% right scale)
0
20
40
60
80
100
120
140
160
2015 2020 2025 2030 2035
e.Debt service-to-exports ratio
0
5
10
15
20
25
30
35
40
45
50
2015 2020 2025 2030 2035
d.PV of debt-to-revenue ratio
0
50
100
150
200
250
300
2015 2020 2025 2030 2035
f.Debt service-to-revenue ratio
0
2
4
6
8
10
12
14
16
2015 2020 2025 2030 2035
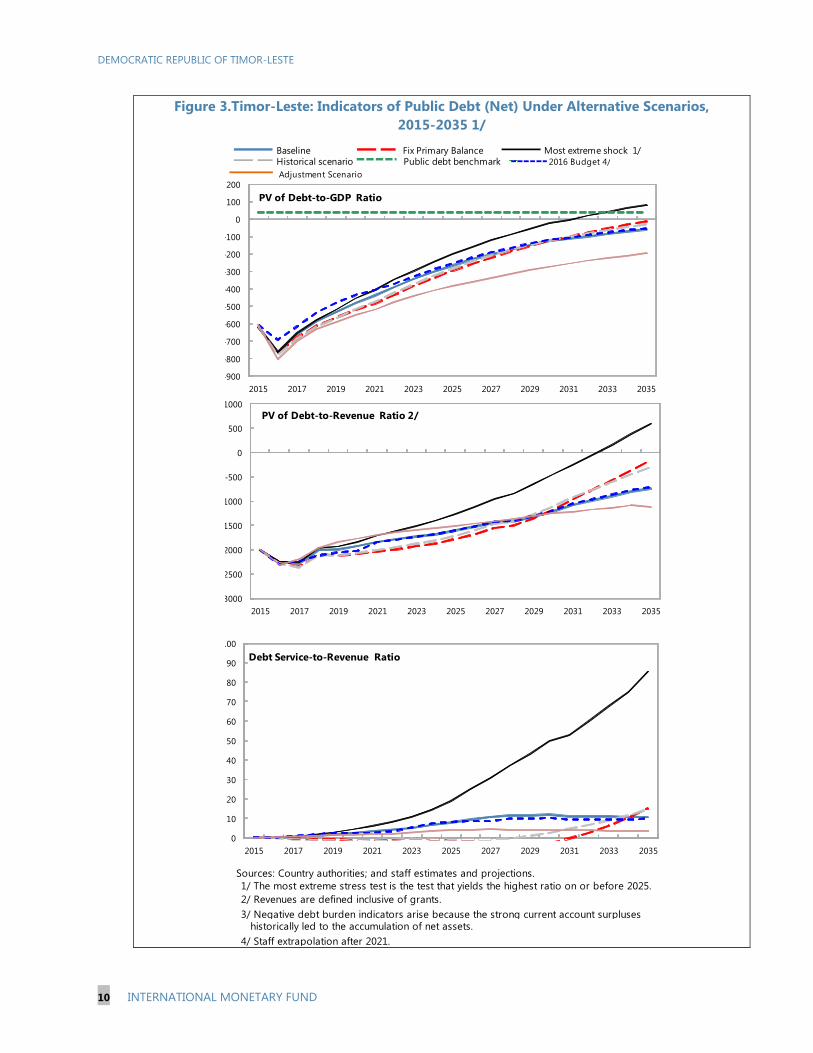
DEMOCRATIC REPUBLIC OF TIMOR-LESTE
10 INTERNATIONAL MONETARY FUND
Figure 3.Timor-Leste: Indicators of Public Debt (Net) Under Alternative Scenarios, 2015-2035 1/
Sources: Country authorities; and staff estimates and projections.1/ The most extreme stress test is the test that yields the highest ratio on or before 2025. 2/ Revenues are defined inclusive of grants.3/ Negative debt burden indicators arise because the strong current account surpluses historically led to the accumulation of net assets.4/ Staff extrapolation after 2021.
Adjustment Scenario
BaselinePublic debt benchmark
Most extreme shock 1/Historical scenario
Fix Primary Balance2016 Budget 4/
3000
2500
2000
1500
1000
-500
0
500
1000
2015 2017 2019 2021 2023 2025 2027 2029 2031 2033 2035
PV of Debt-to-Revenue Ratio 2/
-900
-800
-700
-600
-500
-400
-300
-200
-100
0
100
200
2015 2017 2019 2021 2023 2025 2027 2029 2031 2033 2035
PV of Debt-to-GDP Ratio
0
10
20
30
40
50
60
70
80
90
100
2015 2017 2019 2021 2023 2025 2027 2029 2031 2033 2035
Debt Service-to-Revenue Ratio

Table 1A.Timor-Leste: External Debt Sustainability Framework, Baseline Scenario, 2012-2035 1/ (In percent of GDP, unless otherwise indicated)
Historical 6/ Standard 6/
Average Deviation 2015-2020 2021-20352012 2013 2014 2015 2016 2017 2018 2019 2020 Average 2025 2035 Average
External debt (nominal) 1/ 0.0 0.1 0.5 1.9 7.7 14.5 21.9 29.6 37.6 31.4 9.9of which: public and publicly guaranteed (PPG) 0.0 0.1 0.5 1.9 7.7 14.5 21.9 29.6 37.6 31.4 9.9
Change in external debt 0.0 0.1 0.4 1.4 5.8 6.8 7.4 7.7 8.0 -2.6 -1.2Identified net debt-creating flows ... ... -26.2 -17.8 -9.8 4.3 5.0 8.5 9.7 5.3 13.6
Non-interest current account deficit -40.2 -42.7 -25.1 -34.9 10.9 -16.4 -2.0 11.7 11.9 11.7 11.7 12.7 20.5 14.8Deficit in balance of goods and services -32.6 -38.9 -22.5 -8.0 8.7 21.9 21.8 21.6 21.4 20.6 23.9
Exports 57.0 60.4 50.6 53.2 53.1 45.8 42.7 40.3 37.5 24.7 13.9Imports 24.4 21.5 28.1 45.2 61.8 67.8 64.4 61.8 58.9 45.3 37.8
Net current transfers (negative = inflow) -6.3 -3.2 -1.9 -8.2 3.7 -8.6 -11.2 -10.4 -9.9 -9.8 -9.6 -8.1 -5.4 -7.3of which: official -6.3 -6.2 -6.2 -6.1 -6.8 -6.1 0.0 0.0 0.0 0.0 0.0
Other current account flows (negative = net inflow) -1.3 -0.6 -0.7 0.1 0.6 0.2 0.1 -0.1 -0.2 0.2 2.0Net FDI (negative = inflow) -0.8 -1.1 -1.1 -0.8 0.5 -1.3 -8.1 -8.4 -7.7 -5.6 -5.1 -6.5 -6.6 -6.4Endogenous debt dynamics 2/ ... ... 0.0 0.0 0.2 1.0 0.8 2.4 3.1 -1.0 -0.4
Contribution from nominal interest rate ... ... 0.0 0.0 0.0 0.1 0.3 0.4 0.6 0.6 0.2Contribution from real GDP growth 0.0 0.0 0.0 0.0 0.2 0.9 0.5 1.9 2.5 -1.5 -0.6Contribution from price and exchange rate changes 0.0 0.0 0.0 … … … … … … … …
Residual (3-4) 3/ ... ... 26.6 19.2 15.6 2.5 2.4 -0.8 -1.7 -7.9 -14.8of which: exceptional financing ... ... 0.0 0.0 0.0 0.0 0.0 0.0 0.0 0.0 0.0
PV of external debt 4/ ... ... 0.0 0.7 4.1 8.6 13.6 18.9 24.5 21.7 6.7In percent of exports ... ... 0.0 1.3 7.7 18.8 31.8 46.8 65.3 88.0 48.4
PV of PPG external debt ... ... 0.0 0.7 4.1 8.6 13.6 18.9 24.5 21.7 6.7In percent of exports ... ... 0.0 1.3 7.7 18.8 31.8 46.8 65.3 88.0 48.4In percent of government revenues ... ... 0.0 2.7 15.1 34.5 53.9 82.6 116.9 157.1 97.2
Debt service-to-exports ratio (in percent) 0.0 0.0 0.0 0.0 0.1 0.4 0.7 1.2 1.6 5.3 6.3PPG debt service-to-exports ratio (in percent) 0.0 0.0 0.0 0.0 0.1 0.4 0.7 1.2 1.6 5.3 6.3PPG debt service-to-revenue ratio (in percent) 0.0 0.0 0.0 0.0 0.3 0.7 1.3 2.0 2.9 9.5 12.6Total gross financing need (Billions of U.S. dollars) -2.8 -2.5 -1.1 -0.5 -0.2 0.1 0.1 0.2 0.2 0.3 1.6Non-interest current account deficit that stabilizes debt ratio -40.2 -42.8 -25.5 -17.8 -7.7 4.9 4.5 4.0 3.6 15.3 21.7
Key macroeconomic assumptions
Real GDP growth (in percent) 5.3 -13.9 -15.8 9.8 24.8 -0.6 -8.8 -12.9 -3.9 -9.4 -9.2 -7.4 4.9 5.6 4.0GDP deflator in US dollar terms (change in percent) 11.7 -4.6 -7.5 8.0 18.1 -39.6 -12.1 29.5 13.7 17.1 17.6 4.4 4.5 3.5 5.0Effective interest rate (percent) 5/ ... ... 0.0 0.0 0.0 -3.8 0.8 2.0 2.1 2.1 2.1 0.9 1.8 1.8 1.8Growth of exports of G&S (US dollar terms, in percent) 8.7 -12.8 -34.8 37.8 53.3 -36.9 -20.0 -2.7 1.8 0.1 -0.6 -9.7 1.2 5.5 2.2Growth of imports of G&S (US dollar terms, in percent) -11.0 -27.5 1.9 18.9 41.3 -3.4 9.5 23.7 4.0 1.8 1.8 6.2 7.2 7.5 6.0Grant element of new public sector borrowing (in percent) ... ... ... ... ... 38.8 38.3 35.8 35.0 34.6 34.1 36.1 40.4 39.1 40.6Government revenues (excluding grants, in percent of GDP) 8.0 11.1 12.2 24.7 27.1 24.9 25.2 22.8 20.9 13.8 6.9 11.7Aid flows (in Billions of US dollars) 7/ 0.3 0.3 0.3 0.2 0.2 0.1 0.2 0.2 0.2 0.1 0.1
of which: Grants 0.3 0.3 0.3 0.2 0.1 0.1 0.1 0.1 0.1 0.1 0.1of which: Concessional loans 0.0 0.0 0.0 0.0 0.0 0.1 0.1 0.1 0.1 0.0 0.0
Grant-equivalent financing (in percent of GDP) 8/ ... ... ... 6.6 8.9 6.8 7.0 7.1 7.4 3.3 1.3 2.7Grant-equivalent financing (in percent of external financing) 8/ ... ... ... 90.7 72.9 57.7 55.5 54.8 53.0 82.9 84.3 85.1
Memorandum items:Nominal GDP (Billions of US dollars) 6.8 5.6 4.4 2.6 2.1 2.4 2.6 2.7 2.9 4.5 10.8Nominal dollar GDP growth 17.6 -17.8 -22.1 -39.9 -19.8 12.8 9.3 6.1 6.8 -4.1 9.6 9.3 9.1PV of PPG external debt (in Billions of US dollars) 0.0 0.0 0.1 0.2 0.4 0.5 0.7 1.0 0.7(PVt-PVt-1)/GDPt-1 (in percent) 0.4 2.6 5.6 6.2 6.4 7.3 4.8 0.5 -0.3 0.3Gross workers' remittances (Billions of US dollars) 0.0 0.0 0.0 0.0 0.0 0.0 0.0 0.0 0.0 0.0 0.0PV of PPG external debt (in percent of GDP + remittances) ... ... 0.0 0.7 4.1 8.6 13.6 18.8 24.5 21.7 6.7PV of PPG external debt (in percent of exports + remittances) ... ... 0.0 1.3 7.7 18.8 31.8 46.8 65.3 87.9 48.4Debt service of PPG external debt (in percent of exports + remittances) ... ... 0.0 0.0 0.1 0.4 0.7 1.2 1.6 5.3 6.3
Sources: Country authorities; and staff estimates and projections.
1/ Includes both public and private sector external debt.2/ Derived as [r - g - ρ(1+g)]/(1+g+ρ+gρ) times previous period debt ratio, with r = nominal interest rate; g = real GDP growth rate, and ρ = growth rate of GDP deflator in U.S. dollar terms. 3/ Includes exceptional financing (i.e., changes in arrears and debt relief); changes in gross foreign assets; and valuation adjustments. For projections also includes contribution from price and exchange rate changes.4/ Assumes that PV of private sector debt is equivalent to its face value.5/ Current-year interest payments divided by previous period debt stock. 6/ Historical averages and standard deviations are generally derived over the past 10 years, subject to data availability. 7/ Defined as grants, concessional loans, and debt relief.8/ Grant-equivalent financing includes grants provided directly to the government and through new borrowing (difference between the face value and the PV of new debt).
Actual Projections
DEM
OCRATIC
REPUBLIC
OF
TIMO
R-LESTE
INTERN
ATION
AL MO
NETARY FU
ND
11
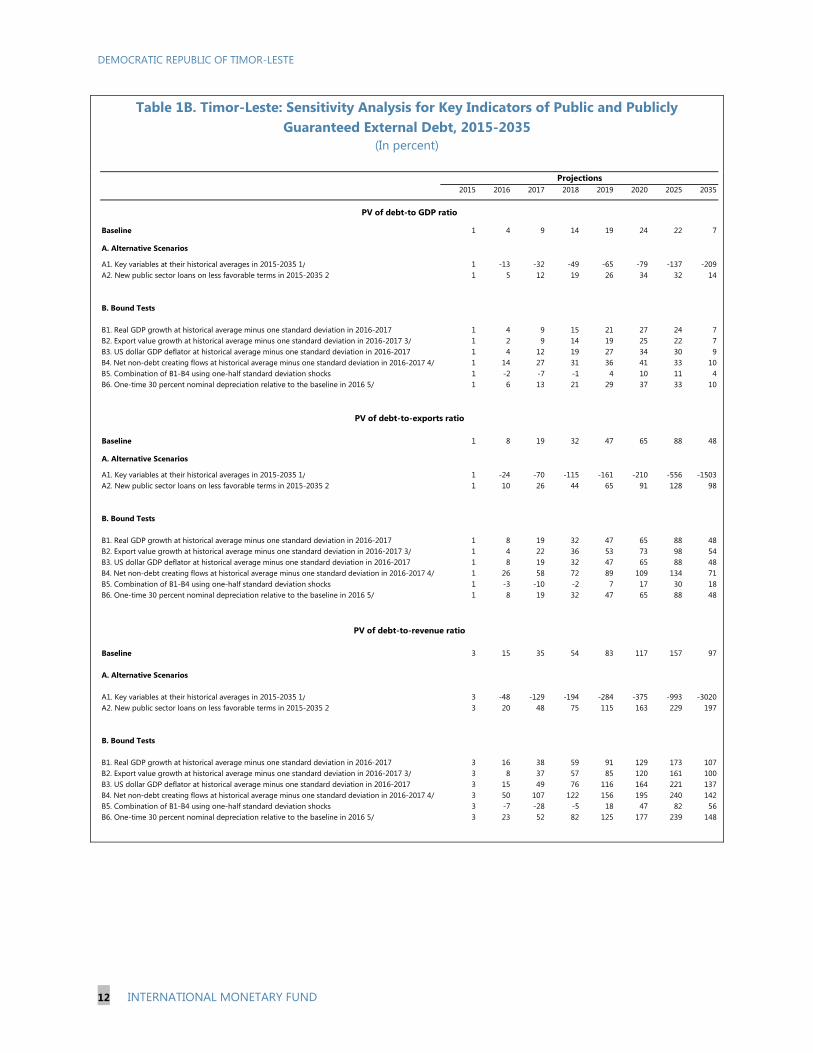
DEMOCRATIC REPUBLIC OF TIMOR-LESTE
12 INTERNATIONAL MONETARY FUND
Table 1B. Timor-Leste: Sensitivity Analysis for Key Indicators of Public and Publicly Guaranteed External Debt, 2015-2035
(In percent)
2015 2016 2017 2018 2019 2020 2025 2035
Baseline 1 4 9 14 19 24 22 7
A. Alternative Scenarios
A1. Key variables at their historical averages in 2015-2035 1/ 1 -13 -32 -49 -65 -79 -137 -209A2. New public sector loans on less favorable terms in 2015-2035 2 1 5 12 19 26 34 32 14
B. Bound Tests
B1. Real GDP growth at historical average minus one standard deviation in 2016-2017 1 4 9 15 21 27 24 7B2. Export value growth at historical average minus one standard deviation in 2016-2017 3/ 1 2 9 14 19 25 22 7B3. US dollar GDP deflator at historical average minus one standard deviation in 2016-2017 1 4 12 19 27 34 30 9B4. Net non-debt creating flows at historical average minus one standard deviation in 2016-2017 4/ 1 14 27 31 36 41 33 10B5. Combination of B1-B4 using one-half standard deviation shocks 1 -2 -7 -1 4 10 11 4B6. One-time 30 percent nominal depreciation relative to the baseline in 2016 5/ 1 6 13 21 29 37 33 10
Baseline 1 8 19 32 47 65 88 48
A. Alternative Scenarios
A1. Key variables at their historical averages in 2015-2035 1/ 1 -24 -70 -115 -161 -210 -556 -1503A2. New public sector loans on less favorable terms in 2015-2035 2 1 10 26 44 65 91 128 98
B. Bound Tests
B1. Real GDP growth at historical average minus one standard deviation in 2016-2017 1 8 19 32 47 65 88 48B2. Export value growth at historical average minus one standard deviation in 2016-2017 3/ 1 4 22 36 53 73 98 54B3. US dollar GDP deflator at historical average minus one standard deviation in 2016-2017 1 8 19 32 47 65 88 48B4. Net non-debt creating flows at historical average minus one standard deviation in 2016-2017 4/ 1 26 58 72 89 109 134 71B5. Combination of B1-B4 using one-half standard deviation shocks 1 -3 -10 -2 7 17 30 18B6. One-time 30 percent nominal depreciation relative to the baseline in 2016 5/ 1 8 19 32 47 65 88 48
Baseline 3 15 35 54 83 117 157 97
A. Alternative Scenarios
A1. Key variables at their historical averages in 2015-2035 1/ 3 -48 -129 -194 -284 -375 -993 -3020A2. New public sector loans on less favorable terms in 2015-2035 2 3 20 48 75 115 163 229 197
B. Bound Tests
B1. Real GDP growth at historical average minus one standard deviation in 2016-2017 3 16 38 59 91 129 173 107B2. Export value growth at historical average minus one standard deviation in 2016-2017 3/ 3 8 37 57 85 120 161 100B3. US dollar GDP deflator at historical average minus one standard deviation in 2016-2017 3 15 49 76 116 164 221 137B4. Net non-debt creating flows at historical average minus one standard deviation in 2016-2017 4/ 3 50 107 122 156 195 240 142B5. Combination of B1-B4 using one-half standard deviation shocks 3 -7 -28 -5 18 47 82 56B6. One-time 30 percent nominal depreciation relative to the baseline in 2016 5/ 3 23 52 82 125 177 239 148
PV of debt-to-exports ratio
PV of debt-to-revenue ratio
PV of debt-to GDP ratio
Projections
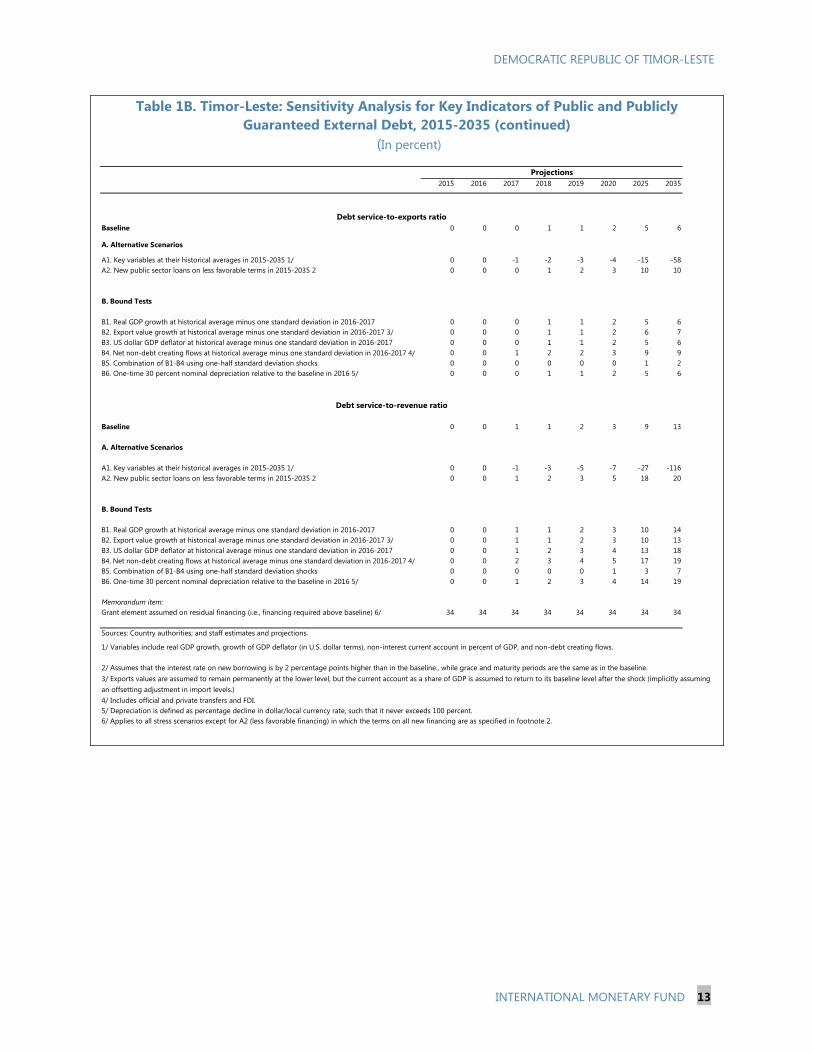
DEMOCRATIC REPUBLIC OF TIMOR-LESTE
INTERNATIONAL MONETARY FUND 13
Table 1B. Timor-Leste: Sensitivity Analysis for Key Indicators of Public and Publicly Guaranteed External Debt, 2015-2035 (continued)
(In percent)
2015 2016 2017 2018 2019 2020 2025 2035
Baseline 0 0 0 1 1 2 5 6
A. Alternative Scenarios
A1. Key variables at their historical averages in 2015-2035 1/ 0 0 -1 -2 -3 -4 -15 -58A2. New public sector loans on less favorable terms in 2015-2035 2 0 0 0 1 2 3 10 10
B. Bound Tests
B1. Real GDP growth at historical average minus one standard deviation in 2016-2017 0 0 0 1 1 2 5 6B2. Export value growth at historical average minus one standard deviation in 2016-2017 3/ 0 0 0 1 1 2 6 7B3. US dollar GDP deflator at historical average minus one standard deviation in 2016-2017 0 0 0 1 1 2 5 6B4. Net non-debt creating flows at historical average minus one standard deviation in 2016-2017 4/ 0 0 1 2 2 3 9 9B5. Combination of B1-B4 using one-half standard deviation shocks 0 0 0 0 0 0 1 2B6. One-time 30 percent nominal depreciation relative to the baseline in 2016 5/ 0 0 0 1 1 2 5 6
Baseline 0 0 1 1 2 3 9 13
A. Alternative Scenarios
A1. Key variables at their historical averages in 2015-2035 1/ 0 0 -1 -3 -5 -7 -27 -116A2. New public sector loans on less favorable terms in 2015-2035 2 0 0 1 2 3 5 18 20
B. Bound Tests
B1. Real GDP growth at historical average minus one standard deviation in 2016-2017 0 0 1 1 2 3 10 14B2. Export value growth at historical average minus one standard deviation in 2016-2017 3/ 0 0 1 1 2 3 10 13B3. US dollar GDP deflator at historical average minus one standard deviation in 2016-2017 0 0 1 2 3 4 13 18B4. Net non-debt creating flows at historical average minus one standard deviation in 2016-2017 4/ 0 0 2 3 4 5 17 19B5. Combination of B1-B4 using one-half standard deviation shocks 0 0 0 0 0 1 3 7B6. One-time 30 percent nominal depreciation relative to the baseline in 2016 5/ 0 0 1 2 3 4 14 19
Memorandum item:Grant element assumed on residual financing (i.e., financing required above baseline) 6/ 34 34 34 34 34 34 34 34
Sources: Country authorities; and staff estimates and projections.
1/ Variables include real GDP growth, growth of GDP deflator (in U.S. dollar terms), non-interest current account in percent of GDP, and non-debt creating flows.
4/ Includes official and private transfers and FDI.5/ Depreciation is defined as percentage decline in dollar/local currency rate, such that it never exceeds 100 percent.6/ Applies to all stress scenarios except for A2 (less favorable financing) in which the terms on all new financing are as specified in footnote 2.
3/ Exports values are assumed to remain permanently at the lower level, but the current account as a share of GDP is assumed to return to its baseline level after the shock (implicitly assuming an offsetting adjustment in import levels.)
2/ Assumes that the interest rate on new borrowing is by 2 percentage points higher than in the baseline., while grace and maturity periods are the same as in the baseline.
Projections
Debt service-to-revenue ratio
Debt service-to-exports ratio
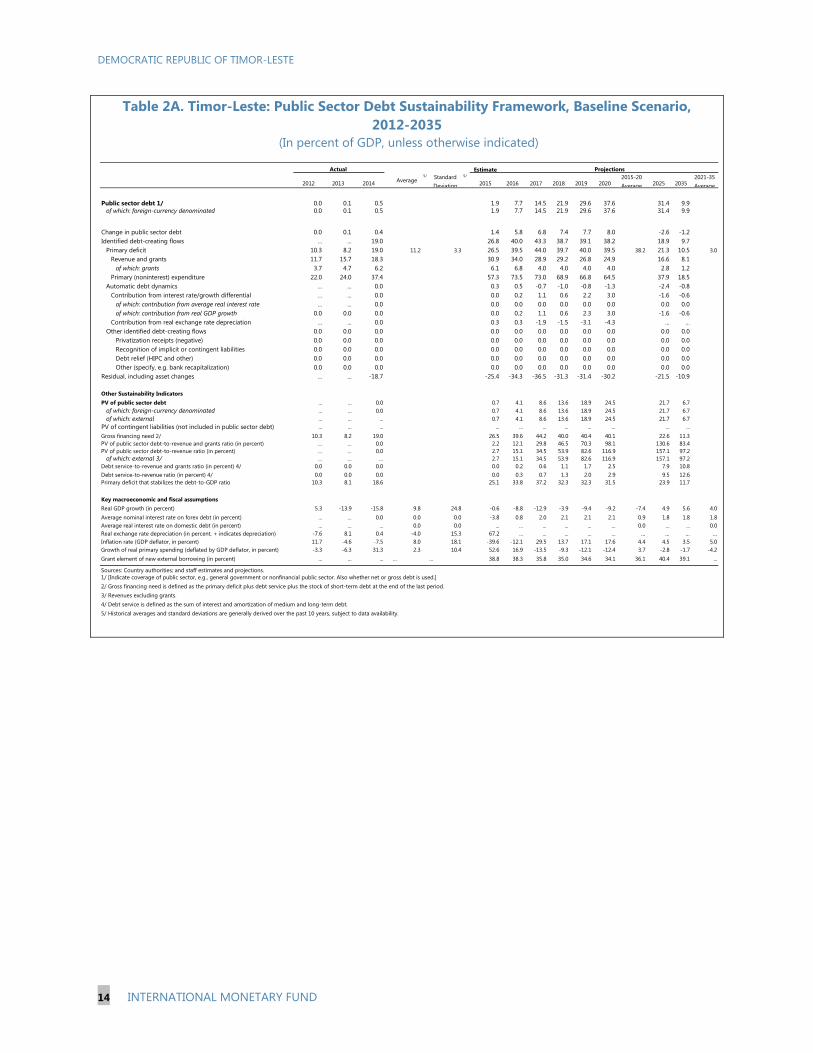
DEMOCRATIC REPUBLIC OF TIMOR-LESTE
14 INTERNATIONAL MONETARY FUND
Table 2A. Timor-Leste: Public Sector Debt Sustainability Framework, Baseline Scenario, 2012-2035
(In percent of GDP, unless otherwise indicated)
Estimate
2012 2013 2014 Average5/ Standard
Deviation
5/
2015 2016 2017 2018 2019 20202015-20 Average 2025 2035
2021-35 Average
Public sector debt 1/ 0.0 0.1 0.5 1.9 7.7 14.5 21.9 29.6 37.6 31.4 9.9of which: foreign-currency denominated 0.0 0.1 0.5 1.9 7.7 14.5 21.9 29.6 37.6 31.4 9.9
Change in public sector debt 0.0 0.1 0.4 1.4 5.8 6.8 7.4 7.7 8.0 -2.6 -1.2Identified debt-creating flows ... ... 19.0 26.8 40.0 43.3 38.7 39.1 38.2 18.9 9.7
Primary deficit 10.3 8.2 19.0 11.2 3.3 26.5 39.5 44.0 39.7 40.0 39.5 38.2 21.3 10.5 3.0Revenue and grants 11.7 15.7 18.3 30.9 34.0 28.9 29.2 26.8 24.9 16.6 8.1
of which: grants 3.7 4.7 6.2 6.1 6.8 4.0 4.0 4.0 4.0 2.8 1.2Primary (noninterest) expenditure 22.0 24.0 37.4 57.3 73.5 73.0 68.9 66.8 64.5 37.9 18.5
Automatic debt dynamics ... ... 0.0 0.3 0.5 -0.7 -1.0 -0.8 -1.3 -2.4 -0.8Contribution from interest rate/growth differential ... ... 0.0 0.0 0.2 1.1 0.6 2.2 3.0 -1.6 -0.6
of which: contribution from average real interest rate ... ... 0.0 0.0 0.0 0.0 0.0 0.0 0.0 0.0 0.0of which: contribution from real GDP growth 0.0 0.0 0.0 0.0 0.2 1.1 0.6 2.3 3.0 -1.6 -0.6
Contribution from real exchange rate depreciation ... ... 0.0 0.3 0.3 -1.9 -1.5 -3.1 -4.3 ... ...Other identified debt-creating flows 0.0 0.0 0.0 0.0 0.0 0.0 0.0 0.0 0.0 0.0 0.0
Privatization receipts (negative) 0.0 0.0 0.0 0.0 0.0 0.0 0.0 0.0 0.0 0.0 0.0Recognition of implicit or contingent liabilities 0.0 0.0 0.0 0.0 0.0 0.0 0.0 0.0 0.0 0.0 0.0Debt relief (HIPC and other) 0.0 0.0 0.0 0.0 0.0 0.0 0.0 0.0 0.0 0.0 0.0Other (specify, e.g. bank recapitalization) 0.0 0.0 0.0 0.0 0.0 0.0 0.0 0.0 0.0 0.0 0.0
Residual, including asset changes ... ... -18.7 -25.4 -34.3 -36.5 -31.3 -31.4 -30.2 -21.5 -10.9
Other Sustainability IndicatorsPV of public sector debt ... ... 0.0 0.7 4.1 8.6 13.6 18.9 24.5 21.7 6.7
of which: foreign-currency denominated ... ... 0.0 0.7 4.1 8.6 13.6 18.9 24.5 21.7 6.7of which: external ... ... ... 0.7 4.1 8.6 13.6 18.9 24.5 21.7 6.7
PV of contingent liabilities (not included in public sector debt) ... ... ... ... ... ... ... ... ... ... ...Gross financing need 2/ 10.3 8.2 19.0 26.5 39.6 44.2 40.0 40.4 40.1 22.6 11.3PV of public sector debt-to-revenue and grants ratio (in percent) … … 0.0 2.2 12.1 29.8 46.5 70.3 98.1 130.6 83.4PV of public sector debt-to-revenue ratio (in percent) … … 0.0 2.7 15.1 34.5 53.9 82.6 116.9 157.1 97.2
of which: external 3/ … … … 2.7 15.1 34.5 53.9 82.6 116.9 157.1 97.2Debt service-to-revenue and grants ratio (in percent) 4/ 0.0 0.0 0.0 0.0 0.2 0.6 1.1 1.7 2.5 7.9 10.8Debt service-to-revenue ratio (in percent) 4/ 0.0 0.0 0.0 0.0 0.3 0.7 1.3 2.0 2.9 9.5 12.6Primary deficit that stabilizes the debt-to-GDP ratio 10.3 8.1 18.6 25.1 33.8 37.2 32.3 32.3 31.5 23.9 11.7
Key macroeconomic and fiscal assumptionsReal GDP growth (in percent) 5.3 -13.9 -15.8 9.8 24.8 -0.6 -8.8 -12.9 -3.9 -9.4 -9.2 -7.4 4.9 5.6 4.0Average nominal interest rate on forex debt (in percent) ... ... 0.0 0.0 0.0 -3.8 0.8 2.0 2.1 2.1 2.1 0.9 1.8 1.8 1.8Average real interest rate on domestic debt (in percent) ... ... ... 0.0 0.0 ... ... ... ... ... ... 0.0 ... ... 0.0Real exchange rate depreciation (in percent, + indicates depreciation) -7.6 8.1 0.4 -4.0 15.3 67.2 ... ... ... ... ... ... ... ... ...Inflation rate (GDP deflator, in percent) 11.7 -4.6 -7.5 8.0 18.1 -39.6 -12.1 29.5 13.7 17.1 17.6 4.4 4.5 3.5 5.0Growth of real primary spending (deflated by GDP deflator, in percent) -3.3 -6.3 31.3 2.3 10.4 52.6 16.9 -13.5 -9.3 -12.1 -12.4 3.7 -2.8 -1.7 -4.2Grant element of new external borrowing (in percent) ... ... ... … … 38.8 38.3 35.8 35.0 34.6 34.1 36.1 40.4 39.1 ...
Sources: Country authorities; and staff estimates and projections.1/ [Indicate coverage of public sector, e.g., general government or nonfinancial public sector. Also whether net or gross debt is used.]2/ Gross financing need is defined as the primary deficit plus debt service plus the stock of short-term debt at the end of the last period. 3/ Revenues excluding grants.4/ Debt service is defined as the sum of interest and amortization of medium and long-term debt.5/ Historical averages and standard deviations are generally derived over the past 10 years, subject to data availability.
Actual Projections

DEMOCRATIC REPUBLIC OF TIMOR-LESTE
INTERNATIONAL MONETARY FUND 15
Table 2B. Timor-Leste: Sensitivity Analysis for Key Indicators of Public Debt, 2015-2035
2015 2016 2017 2018 2019 2020 2025 2035
Baseline 1 4 9 14 19 24 22 7
A. Alternative scenarios
A1. Real GDP growth and primary balance are at historical averages 1 -11 -16 -18 -17 -14 3 37A2. Primary balance is unchanged from 2015 1 -4 -10 -13 -16 -18 -9 53A3. Permanently lower GDP growth 1/ 1 5 13 23 35 49 87 147
B. Bound tests
B1. Real GDP growth is at historical average minus one standard deviations in 2016-2017 1 6 12 19 26 34 34 18B2. Primary balance is at historical average minus one standard deviations in 2016-2017 1 -12 -25 -19 -13 -6 -2 -5B3. Combination of B1-B2 using one half standard deviation shocks 1 -12 -21 -18 -16 -12 -15 -19B4. One-time 30 percent real depreciation in 2016 1 4 7 11 15 20 19 6B5. 10 percent of GDP increase in other debt-creating flows in 2016 1 11 15 19 24 30 26 9
Baseline 2 12 30 47 70 98 131 83
A. Alternative scenarios
A1. Real GDP growth and primary balance are at historical averages 2 -32 -58 -64 -68 -62 21 517A2. Primary balance is unchanged from 2015 2 -13 -36 -45 -59 -71 -52 660A3. Permanently lower GDP growth 1/ 2 16 44 76 125 187 465 1408
B. Bound tests
B1. Real GDP growth is at historical average minus one standard deviations in 2016-2017 2 16 42 65 97 133 202 214B2. Primary balance is at historical average minus one standard deviations in 2016-2017 2 -35 -87 -64 -47 -25 -14 -67B3. Combination of B1-B2 using one half standard deviation shocks 2 -35 -75 -64 -59 -50 -95 -244B4. One-time 30 percent real depreciation in 2016 2 11 24 38 57 80 114 77B5. 10 percent of GDP increase in other debt-creating flows in 2016 2 31 50 66 91 120 156 109
Baseline 0 0 1 1 2 2 8 11
A. Alternative scenarios
A1. Real GDP growth and primary balance are at historical averages 0 0 -1 -1 -1 -1 -1 15A2. Primary balance is unchanged from 2015 0 0 0 -1 -1 -1 -2 15A3. Permanently lower GDP growth 1/ 0 0 1 2 3 4 19 86
B. Bound tests
B1. Real GDP growth is at historical average minus one standard deviations in 2016-2017 0 0 1 1 2 3 11 19B2. Primary balance is at historical average minus one standard deviations in 2016-2017 0 0 -1 -2 -1 -1 -4 -2B3. Combination of B1-B2 using one half standard deviation shocks 0 0 -1 -2 -1 -1 -5 -13B4. One-time 30 percent real depreciation in 2016 0 0 1 2 3 4 11 17B5. 10 percent of GDP increase in other debt-creating flows in 2016 0 0 1 2 2 3 10 13
Sources: Country authorities; and staff estimates and projections.1/ Assumes that real GDP growth is at baseline minus one standard deviation divided by the square root of the length of the projection period.2/ Revenues are defined inclusive of grants.
PV of Debt-to-GDP Ratio
Projections
PV of Debt-to-Revenue Ratio 2/
Debt Service-to-Revenue Ratio 2/
Statement by Otaviano Canuto, Executive Director for Timor-Leste, Pedro
Fachada, Alternate Executive Director, and Alisson Souza Gasparete, Advisor to
Executive Director
May 11, 2016
1. On behalf of our Timorese authorities, we thank the mission team for the
constructive dialogue and policy advice during this year’s Article IV consultation. The
authorities highly appreciate the candid discussions with staff and all the support received
from the Fund.
2. Since independence in 2002, Timor-Leste has achieved enormous progress in
nation-building and social development. Our authorities strongly agree with staff that the
country’s medium-term outlook will depend critically on economic diversification amid
potentially declining hydrocarbon resources. In this regard, they are committed to
improving infrastructure and human capital, providing better education and health
services to the population, and developing private sector entrepreneurship. Such
commitments are underpinned by political stability, credible institutions, and good
governance in the management of public resources.
3. Our authorities broadly concur with the policy recommendations put forth in the
staff report. However, to fulfill their development objectives and the legitimate
aspirations of the Timorese people, they stress the need to accelerate capital spending.
This may require drawing down on resources from the Petroleum Fund above the pace
advised by staff.
Recent economic developments
4. The recent fall in global oil prices has weakened overall macroeconomic
prospects of oil exporters. Timor-Leste, however, has been cushioned by the prudent
saving of its oil wealth in the Petroleum Fund. The new oil price environment has not
only reduced petroleum revenues but has also affected investment in new fields. Proven
oil and gas reserves are low and may be exhausted in a few years, although upside risks
should not be disregarded. The authorities are conscious of the international oil market
scenario and fully aware about the need to diversify the economy away from
hydrocarbons.
5. After expanding on average above 10 percent annually from 2007 to 2012, non-
oil GDP growth decelerated to an estimated 4.3 percent in 2015 and is projected to be
close to 5 percent this year. Over the medium-term, both staff and the authorities expect
non-oil GDP to grow in the range of 5 to 7 percent.

6. The deceleration in non-oil economic activity has been followed by a sharp
decline in inflation, which came down from two-digit figures in mid-2013 to close to zero
in recent quarters. A strong monetary anchor (the dollarization regime), combined with
lower commodity prices and dollar appreciation vis-à-vis other trading partner currencies,
has driven the disinflationary process.
7. Despite lower than previous years, the current account surplus is estimated at 16.5
percent of GDP in 2015. The Timorese government expects a negative external balance
over the medium-term due to, among other factors, lower petroleum revenues and
increased imports of capital goods. Public foreign assets, however, will continue to
represent a strong external buffer.
Fiscal policy and debt sustainability
8. Despite the sharp fall in petroleum revenues, the fiscal balance remained positive
in 2015 (4.2 percent of GDP). Current expenditure was 11 percent lower than projected in
the rectification budget presented to parliament in April last year. Capital spending was
almost 30 percent below the budget.
9. Throughout the years, the Timorese authorities have shown a strong track-record
of responsible use of the oil wealth. Going forward, they remain committed to a prudent
fiscal stance that seeks to preserve the resources of the Petroleum Fund and ensure public
debt sustainability. There is agreement with staff on the need to mobilize domestic non-
oil revenues. The Fiscal Reform Commission, a technical body under the Ministry of
Finance, is in charge of broadening the tax base and increasing the efficiency of tax
collection. A value-added tax (VAT) is expected to be introduced once ongoing
consultations with the private sector, civil society and other stakeholders are concluded.
10. On the expenditure side, the authorities note some room to revise down the 2016
envelope to around $1.4 billion. However, they consider that Timor-Leste cannot afford
to strictly adhere to the Estimated Sustainable Income (ESI) of the Petroleum Fund.
Although they recognize that the ESI is an indispensable tool for fiscal planning, it
should not hold back much-needed investment in infrastructure projects. At the same
time, the government believes that tapping concessional borrowing to finance capital
spending may be appropriate, helping preserve the resources of the Petroleum Fund.
Borrowing would only be justified if the costs are lower than the expected investment
return of the Fund.
11. Staff has revised Timor-Leste’s debt sustainability analysis and underlines a risk
of moderate external debt distress. This seems somewhat exaggerated in light of the low
level of gross external debt under the alternative scenarios developed by staff, as well as
the very comfortable public foreign assets position of the country (equivalent to more
than fourteen years of imports of goods and services, or nearly 640 percent of 2015
GDP). We also consider the recommendation by staff that “bold (emphasis added) fiscal
consolidation measures are needed to safeguard long-term fiscal and debt sustainability”
to be overstated.
Monetary policy and financial sector
12. Timor-Leste is a dollarized economy. The government considers that the
monetary regime has served the country well, anchoring inflation and neutralizing
overvaluation pressures in times of very high current account surpluses. Since 2014,
inflation has been close to zero and is forecasted to remain low in the medium to long
term. As noted by staff, the Central Bank of Timor-Leste (BCTL) has received a
mandate, under the 2011-2030 Strategic Development Plan, to assess the merits of
adopting its own currency. The authorities concur with staff that any decision on “de-
dollarization” should be preceded by further financial and institutional development and
by strengthening the BCTL’s operational capacity.
13. The BCTL has been making efforts to strengthen its capacity in banking
regulation and supervision. The banking system, with only four institutions, is well
capitalized and highly liquid. Three of these institutions are branches of foreign banks.
The fourth bank is a stated-owned institution that plays an important role in providing
banking services to the poor and small businesses, including in rural areas. Contrary to
other small island states in the Asia-Pacific region, de-risking by global banks has not
affected Timor-Leste so far, possibly because the bulk of the banking system is foreign-
owned and the limited importance of remittance inflows to the country.
14. Timor-Leste has made significant advances in financial inclusion and all banks
are adapting their services to branchless and mobile platforms. The authorities are also
engaging in fostering financial literacy. A new payments system legislation has been
introduced, aiming at reducing the costs of doing business and the reliance on cash
transactions, and promoting economic growth outside the urban areas.
Structural reforms
15. The Timorese authorities remain committed to advance their structural reforms
agenda, well aware that it might take some years to bear fruits. Efforts are being made to
attract foreign investment and to foster private-sector job creation. The authorities believe
that the discussions with staff have helped them strike the right balance between carrying
out infrastructure projects and preserving the Petroleum Fund. This trade-off is critical
given that potential investors have repeatedly emphasized that improving basic
infrastructure is paramount to attract foreign investment.
16. Public investment in infrastructure continues to be the priority. In particular,
improving basic transport infrastructure, including roads, the Dili airport and the new port
at Tibar Bay (to be financed, built and operated under a Public Private Partnership) is
fundamental to promote economic integration across the territory and strengthen links
with the rest of the world. The government is also committed to integrate and develop the
Oecusse district (a remote enclave of Timor-Leste on the north coast of Indonesian West
Timor) through the creation of a Special Zone for Social Market Economy, among other
initiatives.
17. Given the role of the petroleum sector to the Timorese economy, the authorities
have envisaged the Tasi Mane project as a driver of progress along the south coast of the
country, facilitating not only the development of the hydrocarbons industry but also
manufacturing and tourism. Nationwide, developing the tourism sector in a sustainable
way is another priority under the Strategic Development Plan. The sector is traditionally
labor-intensive, which may contribute to increase formal employment and boost
government revenues. In addition to building infrastructure, efforts are being carried out
to promote the country in tourist centers in the Asia-Pacific.
18. As documented by staff (Appendix IV), Timor-Leste has made substantial
progress in achieving the Millennium Development Goals (MDG). This is particularly
true for the goal to “Promote Gender Equality and Empower Women”, which has been
fully achieved. The country has also made substantial progress in reducing child
mortality and malnutrition, combating malaria and tuberculosis, increasing primary
school enrolment and enhancing access of the population to clean water sources.
Conclusion
19. Our authorities’ strong commitment to sustainable and inclusive growth and to
careful management of the petroleum wealth is leading Timor-Leste to gradually improve
living standards, develop human capital and overcome lack of basic infrastructure. The
authorities agree with staff that there is still a large need for technical assistance and
training to support their bold reform and development agenda. Once again, they reiterate
their appreciation to the Fund and other development partners for their relentless role in
nation-building and capacity development.