Imaging and epilepsy - Brain
39
braini0204 Brain (1997), 120, 339–377 INVITED REVIEW Imaging and epilepsy John S. Duncan Epilepsy Research Group, University Department of Correspondence to: John S. Duncan, Epilepsy Research Clinical Neurology, Group, University Department of Clinical Neurology, National Hospital for Neurology and Neurosurgery, National Hospital for Neurology and Neurosurgery, London, UK Queen Square, London WC1N 3BG, UK Summary MRI has been applied to the investigation of epilepsy for 12 regional cerebral blood flow (rCBF), glucose metabolism years. The principle role of MRI is in the definition of and the binding of specific ligands to receptors. Correlation structural abnormalities that underly seizure disorders. of functional and structural imaging data is necessary for Hippocampal sclerosis may be reliably identified, quantitative adequate interpretation. The hallmark of an epileptic focus studies are useful for research and, in equivocal cases, for is an area of reduced glucose metabolism, identified using clinical purposes. A range of malformations of cortical [ 18 F]fluorodeoxyglucose ( 18 FDG), that is commonly more development (MCD) may be determined. In patients with extensive than the underlying anatomical abnormality. The refractory partial seizures who are candidates for surgical clinical role of 18 FDG-PET requires re-evaluation in the light treatment, a relevant abnormality is identifiable using MRI of the advances in structural imaging with MRI. Specific in 85%, it is likely that subtle MCD or gliosis accounts for ligands are used to investigate specific receptors. Benzo- the majority of the remainder. The proportion of crypto- diazepine and opioid receptors have been studied most. genic cases will decrease with improvements in MRI hard- Reduced benzodiazepine receptor binding is commonly seen ware, signal acquisition techniques and post-processing at an epileptic focus, in a more restricted distribution than methodologies. Functional MRI is used to identify the cerebral an area of hypometabolism. Focal increases and decreases areas that are responsible for specific cognitive processes, in benzodiazepine receptor binding have been demonstrated and is of importance in planning resections close to eloquent in MCD in areas that appear normal on MRI, indicating the cortical areas. Magnetic resonance spectroscopy (MRS) widespread nature of the abnormalities. It has been found provides a means of investigating cerebral metabolites and that μ-opioid receptors are increased in temporal neocortex some neurotransmitters, non-invasively. The concentrations overlying mesial temporal epileptic foci. Dynamic studies of of N-acetyl-aspartate (NAA), creatine and choline-containing ligand-receptor binding are possible using PET, for example compounds may be estimated using proton MRS. Reduction the release of cerebral endogenous opioids has been implied of the ratio of NAA/(creatine1choline) is a feature of cerebral at the time of serial absences. The main use of single regions that include epileptic foci. Cerebral concentrations photon emission computed tomography (SPECT) is to produce of GABA and glutamate, and the effects of antiepileptic drugs images reflecting rCBF. Interictal studies alone are not on these, may be estimated. Concentrations of high energy reliable. A strength of SPECT is the ability to obtain images phosphate compounds, inorganic phosphate and pH may related to rCBF at the time of seizures. Concomitant video- be assessed using 31 P-MRS. In general, epileptic foci are EEG recording is necessary. Ictal scans need to be considered associated with an increase in pH, increased inorganic in comparison with an interictal scan and an MRI. Interpreta- phosphate and decreased phosphate monoesters. Carbon-13 tion must be cautious, but may yield data that is useful in spectroscopy promises to be a useful method for investigating cerebral metabolism in vivo. PET may provide data on the investigation of patients for possible surgical treatment. Keywords: epilepsy; magnetic resonance imaging (MRI); magnetic resonance spectroscopy (MRS); positron emission tomography (PET); single photon emission computed tomography (SPECT) © Oxford University Press 1997
Transcript of Imaging and epilepsy - Brain

braini0204
Brain (1997),120,339–377
I N V I T E D R E V I E W
Imaging and epilepsyJohn S. Duncan
Epilepsy Research Group, University Department of Correspondence to: John S. Duncan, Epilepsy ResearchClinical Neurology, Group, University Department of Clinical Neurology,National Hospital for Neurology and Neurosurgery, National Hospital for Neurology and Neurosurgery,London, UK Queen Square, London WC1N 3BG, UK
SummaryMRI has been applied to the investigation of epilepsy for 12 regional cerebral blood flow (rCBF), glucose metabolismyears. The principle role of MRI is in the definition of and the binding of specific ligands to receptors. Correlationstructural abnormalities that underly seizure disorders. of functional and structural imaging data is necessary forHippocampal sclerosis may be reliably identified, quantitativeadequate interpretation. The hallmark of an epileptic focusstudies are useful for research and, in equivocal cases, foris an area of reduced glucose metabolism, identified usingclinical purposes. A range of malformations of cortical [ 18F]fluorodeoxyglucose (18FDG), that is commonly moredevelopment (MCD) may be determined. In patients withextensive than the underlying anatomical abnormality. Therefractory partial seizures who are candidates for surgical clinical role of 18FDG-PET requires re-evaluation in the lighttreatment, a relevant abnormality is identifiable using MRI of the advances in structural imaging with MRI. Specificin 85%, it is likely that subtle MCD or gliosis accounts for ligands are used to investigate specific receptors. Benzo-the majority of the remainder. The proportion of crypto- diazepine and opioid receptors have been studied most.genic cases will decrease with improvements in MRI hard-Reduced benzodiazepine receptor binding is commonly seenware, signal acquisition techniques and post-processingat an epileptic focus, in a more restricted distribution thanmethodologies. Functional MRI is used to identify the cerebralan area of hypometabolism. Focal increases and decreasesareas that are responsible for specific cognitive processes,
in benzodiazepine receptor binding have been demonstratedand is of importance in planning resections close to eloquent
in MCD in areas that appear normal on MRI, indicating thecortical areas. Magnetic resonance spectroscopy (MRS)
widespread nature of the abnormalities. It has been foundprovides a means of investigating cerebral metabolites andthat µ-opioid receptors are increased in temporal neocortexsome neurotransmitters, non-invasively. The concentrationsoverlying mesial temporal epileptic foci. Dynamic studies ofof N-acetyl-aspartate (NAA), creatine and choline-containingligand-receptor binding are possible using PET, for examplecompounds may be estimated using proton MRS. Reductionthe release of cerebral endogenous opioids has been impliedof the ratio of NAA/(creatine1choline) is a feature of cerebralat the time of serial absences. The main use of singleregions that include epileptic foci. Cerebral concentrationsphoton emission computed tomography (SPECT) is to produceof GABA and glutamate, and the effects of antiepileptic drugsimages reflecting rCBF. Interictal studies alone are noton these, may be estimated. Concentrations of high energyreliable. A strength of SPECT is the ability to obtain imagesphosphate compounds, inorganic phosphate and pH mayrelated to rCBF at the time of seizures. Concomitant video-be assessed using31P-MRS. In general, epileptic foci areEEG recording is necessary. Ictal scans need to be consideredassociated with an increase in pH, increased inorganicin comparison with an interictal scan and an MRI. Interpreta-phosphate and decreased phosphate monoesters. Carbon-13tion must be cautious, but may yield data that is useful inspectroscopy promises to be a useful method for investigating
cerebral metabolismin vivo. PET may provide data on the investigation of patients for possible surgical treatment.
Keywords: epilepsy; magnetic resonance imaging (MRI); magnetic resonance spectroscopy (MRS); positron emissiontomography (PET); single photon emission computed tomography (SPECT)
© Oxford University Press 1997

340 J. S. Duncan
Abbreviations: cBZR 5 central benzodiazepine receptors; CR5 creatine1phosphocreatine; CSI5 chemical shift imaging;ECD 5 ethyl cysteinate dimer;18FDG 5 [18F]fluorodeoxyglucose; fMRI5 functional MRI; FLAIR 5 fluid attenuatedinversion recovery; HCT2 5 hippocampal T2 relaxation time; HMPAO5 hexamethylpropylenamine oxime; HS5 hippocampalsclerosis; MCD5 malformation of cortical development; MAO5 monoamine oxidase; MRS5 magnetic resonancespectroscopy; NAA5 N-acetyl aspartate; PCr5 phosphocreatine; PDE5 phosphodiesters; Pi 5 inorganic phosphate;PME 5 phosphomonoesters; rCBF5 regional cerebral blood flow; SPECT5 single photon emission computed tomography;SPM 5 statistical parametric mapping; TE5 echo time
IntroductionThere have been great strides made in the structural and has several consequences. First, a review such as this is soon
out of date. Secondly, patients who were previously regardedfunctional imaging of the brain in epilepsy in the last decade,resulting in a wealth of scientific data and clinical applications. as being ‘MRI negative’ may have relevant abnormalities
identified with contemporary optimal imaging. Thirdly,The correlation of structure with function is essential in theunderstanding of transient disorders of brain function, which studies comparing different imaging modalities, such as MRI
and PET, need to be explicit about the details of the imagingoften has a structural basis. Accordingly, in this review, MRIis considered first. This is followed by the functional imaging methods used and their technical limitations, particularly
when conclusions are being drawn regarding the relativeapplications of MR: studies of cerebral blood flow (CBF)and spectroscopic studies of cerebral metabolites and sensitivity of the methods.neurotransmitters. Isotope studies are then considered: PETand single photon emission computed tomography (SPECT),with a consideration of areas of recent and current researchMRI epilepsy protocol
There have been many advances made in recent years andand clinical application.these continue. There is not a uniformity of opinion regardingthe optimum imaging protocols for the generality of patientswith epilepsy and for patients with refractory partial seizuresMRIin whom surgical treatment is being considered.The investigation and treatment of patients with epilepsy has
been revolutionized in the last decade with the advent ofMRI. Since its initial application in 1984 (Oldendorf, 1984;
Indications for neuroimaging of patients withSostmanet al., 1984), the superiority of MRI over X-ray CTscanning in terms of sensitivity and specificity for identifying epilepsy
The Neuroimaging Commission of the Internationalthe aetiology of epilepsy in both adults and children hasbecome firmly established (McLachlanet al., 1985; Jabbari League against Epilepsy has recently produced a consensus
statement of recommendations on this topic (Neuroimaginget al., 1986; Latacket al., 1986; Lesseret al., 1986; Ormsonet al., 1986; Sperlinget al., 1986; Theodoreet al., 1986a; Commission, 1997). The rationale of imaging the brains of
patients developing epilepsy is (i) to identify underlyingKuznieckyet al., 1987; Schorneret al., 1987; Triulziet al.,1988; Bergenet al., 1989; Franceschiet al., 1989; Froment pathologies such as tumours, vascular lesions and tumours
that require specific therapy and (ii) to assist the formulationet al., 1989; Furuneet al., 1989; Heinzet al., 1989, 1990;Perettiet al., 1989; Brookset al., 1990; Converset al., 1990; of syndrome-based and aetiological diagnoses.
In the non-acute situation, MRI is preferable to X-rayDowd et al., 1991; Crosset al., 1993; Kuznieckyet al.,1993a). The most common abnormalities identified are CT as the first imaging investigation. Imaging should
include T1- and T2-weighted sequences to cover the wholehippocampal sclerosis (HS), malformations of corticaldevelopment (MCD), vascular malformations, tumours and brain in at least two orthogonal planes, with the minimum
slice thickness possible on the scanner used. The routineacquired cortical damage.X-ray CT, however, may be preferred to MRI if a patient use of gadolinium contrast enhancement is not indicated,
but may be useful occasionally to clarify findings (Cascinois disturbed or acutely unwell, as the patient is more accessibleduring an X-ray CT scan. It is also valuable for the et al., 1989; Elster and Mirza, 1991). Ideally, sequences
should include a volume acquisition with a partition sizeinvestigation of possible acute intracranial haematomas andskull fractures, and as a supplement to MRI for clarification ofø1.5 mm to allow for the possibility of reformatting
in any orientation and three-dimensional reconstruction ofof possible intracranial calcification that is not shown easilyby MRI. the dataset. In the first 2 years of life, incomplete
myelination results in poor grey–white matter contrast,The principal clinical applications of MRI to patient carehave been the identification of patients who are suitable for making identification of cortical abnormalities difficult and
in these cases MRI may need to be repeated after 1–2 years.surgical treatment and the elucidation of the structural basisof epilepsy that was previously regarded as being cryptogenic. When used, X-ray CT scans would usually be obtained
without the use of contrast material. If such a scan is unclear,Rapid advances are being made in MRI techniques; this

Imaging and epilepsy 341
further information may be obtained using contrast material,but an MRI scan is likely to give more information. In anacute situation of seizures occurring in the context of aneurological insult, X-ray CT is an appropriate initialinvestigation if MRI is not readily available or is not possiblefor technical reasons, such as the patient having a cardiacpacemaker or needing attention during the scan.
The best practice is to obtain MRI in all patients withepilepsy, with the exception of those with a definite diagnosisof idiopathic generalized epilepsy or benign rolandic epilepsyof childhood with centro-temporal spikes. MRI is particularlyindicated in patients with one or more of the following: (i)the onset of partial seizures, at any age; (ii) the onset ofgeneralized or unclassified seizures in the first year of life,or adulthood; (iii) evidence of a fixed deficit on neurologicalor neuropsychological examination; (iv) difficulty obtainingseizure control with first line antiepileptic drugs; (v) loss of Fig. 1 Coronal T1-weighted MRI [Inversion recovery preparedseizure control, or a change in the pattern of seizures. Radiofrequency Spoiled Gradient Recalled acquisition in the
steady state (Ir SPGR)] showing an atrophic left hippocampus (onPatients who are candidates for surgical treatment ofright of image), characteristic of hippocampal sclerosis (arrow).epilepsy require detailed brain imaging (seebelow).
In situations in which access to MRI is limited, essentialindications for MRI are: (i) patients with partial or secondary The range of structural cerebral abnormalitiesgeneralized seizures, and apparently generalized seizures, thatunderlying epilepsy and identified with MRIare not controlled with anti-epileptic drugs; (ii) patients who Hippocampal sclerosis (HS)develop progressive neurological or neuro-psychological
Until 1990, it was held that MRI could not reliably identifydeficits.
HS (Heinzet al., 1990; Jacksonet al., 1990; Berkovicet al.,1991), which is the single most common pathology underlyingpartial seizure disorders that do not respond to antiepilepticdrug therapy, but which are amenable to surgical treatment.Presurgical candidatesTwo-thirds of patients with HS become seizure-free after an
These patients merit the most sophisticated MR imaging thatanterior temporal lobe resection (Babb and Brown, 1987;
is available and may also benefit from functional imagingBruton, 1988) and a similar success rate has been found in
with PET and SPECT.patients with HS identified using MRI (Berkovicet al., 1995).
A typical presurgical MRI protocol would be as follows. Several factors underly the ability of MRI to identify HS:(i) A volume acquisition T1-weighted data set that is acquired appreciation of hippocampal anatomy and use of optimallyin an oblique coronal orientation, orthogonal to the long axisorientated scanning planes, awareness of relevant imagingof the hippocampi, covering the whole brain in 0.9 mm abnormalities, and advances in MRI instrumentation,partitions. This sequence produces approximately cubicacquisition sequences and post-acquisition processing of datavoxels, allowing for reformatting in any orientation, (Duvernoy, 1988; Jacksonet al., 1990; Berkovicet al., 1991).subsequent measurement of hippocampal morphology andThe hippocampus is a curved structure with its concavevolumes, and for three-dimensional reconstruction and surfacesurface facing the brainstem and with its longitudinal axis atrendering of the brain. (ii) An oblique coronal spin echo ~35° to the orbito-meatal line, that was traditionally used assequence, with proton density (echo time, TE5 30) and the axial imaging plane for both X-ray CT and MRI. Toheavily T2-weighted (TE5 90 or 120) acquisitions that are minimize partial volume effects, the hippocampus is bestorientated perpendicular to the long axis of the hippocampus,visualized in two planes: along its long axis and orthogonalto demonstrate any increase in T2-weighted signal intensity. to this. These imaging planes may be readily determinedHippocampal T2 relaxation times (HCT2) may also be on a sagittal scout image: the axial plane being in the lineobtained using the data from a dual echo sequence or fromjoining the base of the splenium of the corpus callosum to thea separate multiecho sequence. inferior, posterior border of the frontal lobe, and the coronal
A key feature of a volumetrically acquired sequence is theplane being perpendicular to this, parallel to the anteriorability to coregister the structural information with functional border of the brainstem.imaging data. Further sequences such as fluid attenuatedThe initially identified MRI features of HS wereinversion recovery (FLAIR), and the application of surfacehippocampal atrophy, demonstrated with coronal T1-weightedphased-array coils may also be useful to obtain furtherimages (Fig. 1) and increased signal intensity within the
hippocampus on T2-weighted spin echo images (Fig. 2)information (seebelow).

342 J. S. Duncan
head (Bronenet al., 1995). In a series of 30 patients Kimet al.(1995) concluded from cross-sectional area measurements andqualitative assessment of signal on T2-weighted images thatHS was diffuse in 29 cases. This is a higher incidence ofdiffuse HS than has been commonly found and clearlypatient selection criteria have a great effect on such a study.Quantitative assessments of both hippocampal cross-sectionalarea and T2 relaxation time along the length of thehippocampus are necessary to evaluate this further.
Misalignment of the patient in the MRI scanner may causedifficulties with the visual assessment of hippocampal atrophyif thick, e.g. 5 mm, and non-contiguous slices are used. Anadvantage of volume acquisitions of T1-weighted scans usinga gradient echo technique is the facility to reformat theimages in any orientation, with minimal loss of spatialresolution.
Several studies have found that ipsilateral hippocampalatrophy is a good prognostic feature for seizure controlfollowing anterior temporal lobe resection (Berkovicet al.,
Fig. 2 The images are of the same patient as in Fig. 1.Upper 1991; Grattan-Smithet al., 1993; Murroet al., 1993; Garciapanel: coronal proton density image (spin echo, TE 30) showing
et al., 1994a). This finding has greatly reduced the need foratrophic left hippocampus, on right of image, with increasedinvasive EEG studies in patients with temporal lobe epilepsy,signal (arrow head).Lower panel: coronal T2-weighted image
(spin echo, TE 120) showing atrophic left hippocampus, on right in whom surface EEG data and other features are concordant.of image, with increased signal (arrow head). These features arecharacteristic of hippocampal sclerosis. Quantitative MRI assessment of the hippocampus.
The assessment of hippocampal atrophy can be improved bymeasurement of the volumes of hippocampi (Jacket al.,(Jacksonet al., 1990). Increased T2-weighted signal is, in
itself, a non-specific finding and may result from foreign 1990). In this initial study, measurements of hippocampalvolume ratios gave correct lateralization in 76% of cases,tissue lesions or from pixels containing partial volumes of
CSF. In order to avoid such errors it is necessary that with no false lateralizations and they were superior toqualitative inspection of hippocampal asymmetry, measure-the finding of increased signal on T2-weighted imaging is
interpreted in the light of high quality T1-weighted anatomical ments and visual assessment of anterior temporal lobe, andof mesial parenchymal T2-weighted signal intensity. Theimaging. Further MRI features of HS, in addition to atrophy,
increased T2-weighted signal and being well demonstrated same group subsequently showed hippocampal atrophy onMRI in 14 out of 15 patients with mesial temporal sclerosison heavily T1-weighted coronal inversion recovery images,
include decreased T1-weighted signal intensity and disruption and in three out of nine patients with lesser degrees ofneuronal loss or no abnormality (Cascinoet al., 1991).of the internal structure of the hippocampus (Jacksonet al.,
1993a). There may be associated atrophy of the ipsilateral Hippocampal atrophy has been correlated with reduction ofneuronal density in all hippocampal regions except CA2fornix (Baldwin et al., 1994), although this measure is
not likely to add clinically useful information. Atrophy of (Bronenet al., 1991; Lenczet al., 1992). In a complexgroup of patients, hippocampal atrophy on MRI comparedtemporal lobe white matter and cortex, dilatation of the
temporal horn and a blurring of the grey–white matter margin favourably with all other non-invasive means of localization,using ictal depth EEG as a gold standard (Spenceret al.,in the temporal neocortex (Meinerset al., 1994) are variably
accompanying features to the changes of HS but are not 1993).Asymmetrical hippocampal atrophy was associated withreliable in their own right.
Although fast spin-echo sequences have been advocated by the site of seizure onset (Ashtariet al., 1991; Cendeset al.,1993a; Baulacet al., 1994). Further, asymmetrical atrophysome (Tienet al., 1993), a careful comparison of conventional
spin-echo and fast spin-echo T2-weighted sequences for of the resected hippocampus on MRI was associated with agood prognosis for seizure control (Bronenet al., 1991).visual assessment of the hippocampus showed that, although
the latter takes less time, the data are less accurate, so the Atrophy of the contralateral nonresected hippocampus wasassociated with a worse outcome and two patients withsequence is not recommended in the evaluation of patients
with epilepsy (Jacket al., 1994a). bilateral atrophy and no side-to-side difference did poorly(Jacket al., 1992). Subsequently, however, the same authorQualitatively it has been noted that atrophy and increased
signal on T2-weighted images are often not uniform along reported that ‘A satisfactory operative outcome is possiblein patients with bilaterally symmetrical mesial temporalthe length of the hippocampus, but affect the body of the
hippocampus most commonly, followed by the tail and the sclerosis by MRI criteria’ (Jacket al., 1995), underlining the

Imaging and epilepsy 343
fact that factors other than the MRI appearance need to beet al., 1994). Using these techniques, it was concluded thatT2 relaxation-time measurements are a useful identifier oftaken into account in the presurgical decision making process.
The severity of hippocampal atrophy on the side of the hippocampal pathology, with marked elevations beingassociated with HS and intermediate values being seen inlanguage-dominant hemisphere is an important determinant
of impairment of verbal memory following hippocampal patients without qualitative MRI evidence of HS, contralateralto HS and in some patients with extratemporal seizure onset.resection. The more severe the atrophy preoperatively, the
less likely it is that there will be a significant decline of The T2 times in the contralateral hippocampus were outsidethe normal range in 32% of patients, possibly reflectingverbal memory after surgery (Trenerryet al., 1993a).
Cooket al. (1992) used contiguous 1.5 mm slices through bilateral HS. Subsequent studies on the same system, however,and correlative quantitative neuropathological investigationshippocampus and amygdala with a spoiled gradient echo
technique, thresholding and a manually driven cursor to have shown that whilst HS is usually associated with anabnormal HCT2, some patients with definite HS may have aoutline the hippocampus and amygdala in individual slices,
and then generated cross-sectional contour maps. Asymmetry normal HCT2 (Van Paesschenet al., 1995), and that there isan inverse correlation between HCT2 and the ratio of glialof hippocampi was not found in 10 normal right-handed
subjects, but focal or diffuse hippocampal atrophy was noted to neuronal density in the hippocampus (Van Paesschenet al.,1994). Similarly, there is a close correlation between HCT2in patients with well-defined temporal lobe epilepsy. With
technological and software developments, quantitative volu- and severity of hippocampal volume loss, allowingdelineationin vivo of a spectrum of the severity of HS (Vanmetric techniques have advanced considerably in recent years.
The use of contiguous thin slices enhances the accuracy Paesschenet al., 1995, 1997). Quantitative MRI may be veryuseful in the evaluation of patients for possible surgicaland reliability of measurements and permits localization of
atrophy along the length of the hippocampus. Images obtained treatment and may also be applied in a longitudinal fashionto determine whether there is any evidence of progressionwith increased T1 contrast, by including an inversion recovery
pulse prior to the gradient echo acquisition, and acquisition of the hippocampal damage.A limitation of this technique has been that only a singleof images perpendicular to the hippocampus may increase
precision further. Attempts are being made to automate measure of T2, from the body of the hippocampus, has beenhitherto possible. HS may be of varying severity along thethe assessment of hippocampal volume and morphology,
however, at present the methodology of hippocampal length of the hippocampus, and may be confined to theanterior part of the head. This is the probable explanationvolumetry is demanding and time-consuming, requiring a
post-processing computer and a skilled operator. for patients who have HS but a normal HCT2. Developmentsin the technique to allow the acquisition of a series of HCT2In clinical practice, hippocampal asymmetry ofù20% is
reliably visually apparent to skilled neuro-imaging specialists, measurements along the length of the hippocampus representa significant step forwards in the MRI assessment of thisbut lesser degrees of asymmetry require quantification (Van
Paesschenet al., 1995). Because of the time-consuming structure (Duncanet al., 1996a).Data from healthy subjects indicate that there is a narrownature of hippocampal volume measurements, measuring just
the hippocampal body on T2-weighted images has been range of normal HCT2, resulting in the parameter being apotentially useful absolute measure. Until recently, the wideadvocated (Kimet al., 1994). Whilst this may give an
indicator of hippocampal asymmetry in the gross case, it is normal range of hippocampal volume measurements, forwhich absolute values limited assessment of asymmetrynot likely to add anything to a visual assessment of coronal
T1- and T2-weighted sequences and, in a patient with by calculation of hippocampal volume ratios, precludingidentification of bilateral HS and lesser degrees of contra-borderline or focal atrophy, it may be misleading and is not
to be recommended. lateral hippocampal damage. The development of methodsof correcting the hippocampal volume for the total intracranialIn confirmation of previous pathological data, severe and
diffuse hippocampal volume loss has been associated with volume has largely obviated this limitation (Freeet al., 1995;Van Paesschenet al., 1997).complicated early childhood convulsions (Cendeset al.,
1993a; Kuks et al., 1993). It is likely that research in next decade will define the roleof measurement of tissue volumes and relaxation times inA visually evident increase in hippocampal T2-weighted
signal intensity generally has been reported in 0–60% of the assessment of the hippocampus and that improvementsin spatial resolution will reveal details of hippocampalcases of HS (McLachlanet al., 1985; Sperlinget al., 1986;
Kuzniecky et al., 1987; Triulzi et al., 1988; Brookset al., substructure,in vivo.MRI measures of amygdala volume have been made1990; Jacket al., 1990; Jacksonet al., 1990; Ashtariet al.,
1991; Bronenet al., 1991). In an analogous way to the (Cendeset al., 1993a, b), but are not sufficiently reliable tobe of great clinical utility. T2 relaxometry has been shown,quantification of hippocampal atrophy by volumetric analysis,
T2-weighted signal intensity may be quantified reproducibly however, to be a sensitive means of detecting amygdalapathology (Van Paesschenet al., 1996).by measurement of HCT2.
HCT2s have been reproducibly estimated from 16 images, The technique of T2 relaxometry has also been used toevaluate the possible neurotoxic effects of drugs and haswith TEs from 22 to 262 ms (Jacksonet al., 1993b; Grunewald

344 J. S. Duncan
Fig. 3 Coronal T1-weighted MRI (Ir SPGR) showing schizencephaly that extends to the right lateralventricle.
been shown to be sensitive to the development of intra- study did not find a relationship between hippocampalatrophy and duration of habitual epilepsy (Trenerry et al.,myelinic oedema in rats treated with the antiepileptic drug
vigabatrin (Jacksonet al., 1994a). Similar studies in patients 1993b). In a mixed group of patients with partial seizures,hippocampal atrophy was significantly correlated with longerdid not show any changes suggestive of this pathology
(Jacksonet al., 1994b). duration of epilepsy (Spenceret al., 1993). In a further seriesof 50 patients with intractable temporal lobe epilepsy, neitherAlthough MRI has made a considerable difference to the
evaluation of patients with refractory seizures who are hippocampal nor amygdala volume were correlated withduration of epilepsy, estimated seizure frequency, age orcandidates for surgical treatment, the technique does not
make other investigations redundant. Clinical and functional occurrence of generalized seizures. As expected, patientswith prolonged febrile convulsions in early childhood haddata (neurophysiological and psychological and in some cases
functional imaging) all need consideration in reaching a significantly smaller hippocampal and amygdala volumesthan those without such a history. These findings did notconsensus for individual patients (Spencer, 1995). Contrary
to initial reports (Cooket al., 1992), further experience with suggest continuing hippocampal or amygdala atrophy duringchronic temporal lobe epilepsy, that could be detected bylarger numbers of patients has shown that some patients
with seizure onset outside the temporal lobe may have MRI volumetric MRI, but did not exclude the possibility ofprogression of hippcampal damage in the early years of thefeatures of HS (Cascinoet al., 1993a; Adam et al., 1994;
Baulacet al., 1994; Fish and Spencer, 1995; Spencer 1995). habitual epilepsy (Cendeset al., 1993b).A cross-sectional study comparing control subjects,A detailed assessment using all investigatory modalities is
particularly important in the 15% of patients with HS being patients with newly diagnosed apparently cryptogenictemporal lobe epilepsy and those with chronic refractoryconsidered for surgery, in whom cortical dysgenesis and
other structural pathology is also evident on MRI (Raymond temporal lobe seizure disorders found that both patient groupstended to have smaller hippocampi than the control group,et al., 1994a).and that the hippocampi were smaller in the chronic groupthan in those with newly diagnosed epilepsy (SaukkonenProgression of hippocampal damage.A retrospective

Imaging and epilepsy 345
et al., 1994). The differences were not marked; a prospective the structures in two orthogonal planes. Interpretation needsanalysis of the cortical grey matter, the grey–white boundary,longitudinal quantitative MRI study is necessary to determine
whether progressive hippocampal damage does occur during white matter and ventricles. It is often difficult to be certainwhether subtle abnormalities of sulcal morphology are outsidethe course of a patient’s epilepsy.the normal range. Analysis of MRIs of young children (,2years old) needs to take into account the normal developmentof myelination and the indistinct grey–white matter boundaryMalformations of cortical development
Malformations of cortical development (MCDs) are on T2-weighted images.Malformations of cortical development were found incommonly identified as causes of epilepsy and neuro-
developmental deficits. The clarity with which these 4.3% of 303 patients with epileptic seizures referred forMRI, in 6.7% of patients with established epilepsy andmalformations may be demonstrated by MRI, compared with
X-ray CT is striking. These abnormalities are increasingly in 13.7% of patients with concomitant mental retardation(Brodtkorbet al., 1992). Seven percent of 222 patients withbeing recognized in patients with seizure disorders that were
previously regarded as being cryptogenic. Such data may temporal lobe epilepsy had MCDs revealed with MRI,comprising focal cortical dysplasia, nodular heterotopia,lead to a reclassification of a patient’s epilepsy syndrome
from being cryptogenic and generalized to being symptomatic abnormal gyration, limited schizencephaly and hippocampalmalformations. Clinical and EEG features did not differentiateand localization-related and may have important implications
for treatment (Kuzniecky, 1994; Palminiet al., 1994). Gross these patients from the others with temporal lobe epilepsy,indicating the key role of MRI in their investigation (Lehericyabnormalities such as lissencephaly or schizencephaly may
be identified on X-ray CT, but are seen much more clearlyet al., 1995). Interpretation of these studies and extrapolationto other populations is dependent on the selection biasusing MRI, which demonstrates significantly more detail
(Chamberlainet al., 1990) (Fig. 3). regarding criteria for referring patients for MRI scans andon the sophistication of the MRI instrument and techniquesThe range of MCDs identified with MRI include
schizencephaly, agyria, diffuse and focal macrogyria, focal used in the study.Identification of the structural cerebral abnormality inpolymicrogyria, minor gyral abnormalities, subependymal
grey matter heterotopias, bilateral subcortical laminar hemimegalencephaly using MRI is essential in theconsideration of surgical treatment, which can be dramaticallyheterotopia, tuberous sclerosis, focal cortical dysplasia and
dysembryoplastic neuroepithelial tumours. Sixty-eight out of beneficial (Kalifaet al., 1987; Palminiet al., 1994).Dysembryoplastic neuroepithelial tumours are regarded as100 patients in a recent series had normal X-ray CT and 19
out of 36 patients had normal previous (conventional) MRI. benign developmental tumours and not infrequently underlierefractory partial seizures. The features are of a focal,In general there was not a good correlation between the
epileptic syndromes and EEG abnormalities and the location circumscribed cortical mass that may indent the overlyingskull and also extend subcortically, with low signal intensityor extent of the dysgenesis as shown by MRI (Raymond
et al., 1995). The classification of these malformations is in on T1-weighted images, high signal on T2-weighted imagessimilar to those of CSF, and slightly higher signal intensitya state of evolution and is currently based largely on MRI
features. Some require histopathology to allow a definitive in the lesion than CSF on proton density images. Cystformation may occur and may be revealed with gadolinium-diagnosis to be made. The elucidation of the genetic basis
of MCDs will result in a further reclassification. One scheme, DTPA (diethylenteriamine penta-acetic acid) enhancement.Calcification is present in some cases and may be morecurrently under consideration by the Neuroimaging
Commission of the International League against Epilepsy, readily demonstrated with X-ray CT. Despite some claims tothe contrary (Kuroiwaet al., 1994), confident differentiationis to subdivide malformations of cortical development as
follows: (i) diffuse cortical malformations: agyria pachygyria, from low-grade astrocytomas and ganglioglioma is notpossible with MRI (Koeller and Dillon, 1992; Raymondpolymicrogyria, microcephaly, megalencephaly, microdys-
genesis; (ii) focal or multifocal cortical malformations: focal et al., 1994b).Tuberous sclerosis has a characteristic appearance on MRIcortical dysplasia, hemimegalencephaly, focal polymicro-
gyria, tuberous sclerosis; (iii) heterotopias. and was the diagnosis in five patients in a recent series of100 patients with MCDs and epilepsy (Raymondet al.,Other, more detailed classifications also under considera-
tion separate MCDs into four basic categories, with sub- 1995). Identified large tubers commonly show concordancewith surface EEG signs in terms of localization anddivision of each category into generalized and focal: (i)
abnormal neuronal and glial proliferation; (ii) abnormal lateralization, but this is not invariable (Curatolo and Cusmai,1988; Cusmaiet al., 1990; Tamakiet al., 1990). MRI hasneuronal migration; (iii) abnormal cortical organization; (iv)
malformations, not otherwise classified. not been able to differentiate reliably between the formefruste of tuberous sclerosis and other cortical dysgenesesThere are many technical issues concerned with MRI of
MCDs. The best results are obtained using T2-weighted and (Palminiet al., 1991a).Characteristic clinical-MRI syndromes have been describedhigh resolution T1-weighted volumetric techniques with thin
partitions, covering the whole brain and allowing viewing of such as that of bilateral central rolandic and sylvian

346 J. S. Duncan
Fig. 4 Coronal T1-weighted MRI (Ir SPGR) showing extensive band heteropia in the right cerebralhemisphere (arrow head).
macrogyria and polymicrogyria, with a pseudobulbar palsy associated with generalized seizures, cognitive impairmentand neurological deficit (Palminiet al., 1991b; Barkovichand cognitive impairment (Kuznieckyet al., 1989; Kuzniecky
et al., 1994). Hypothalamic hamartomas, sometimeset al., 1994).Females are predominantly affected by subependymalassociated with gelastic epilepsy, precocious puberty and
cognitive impairment, are clearly demonstrable using MRI heterotopia. The heterotopia is more commonly nodular thandiffuse, bilateral more often than unilateral, and most frequent(Berkovic et al., 1988; Nishioet al., 1989; Marlianiet al.,
1991). in the occipital horn of the lateral ventricle (Fig. 5). Theassociated seizures are usually partial, but some patients hadMore subtle abnormalities such as focal nodular heterotopia
and band heterotopia may only be apparent if optimal MRI been previously thought to have a generalized epilepsy(Huttenlocheret al., 1994; Raymondet al., 1994c).techniques are used. Heterotopias produce a signal that is iso-
intense to grey matter and are recognized and characterized by Focal cortical dysplasia may result in refractory partialseizures and its identification with MRI has importanttheir location and distribution in adults and children
(Schuiereret al., 1995). Heterotopias may be associated with consequences, with the possibility of surgical treatment(Kuzniecky et al., 1988; Palminiet al., 1991a; Kuznieckyother cerebral abnormalities.
Band heterotopia ‘double cortex’ is an example of aet al., 1995). Macrogyria, microgyria and other derangementsof gyrus formation may be apparent (Guerriniet al., 1992).generalized MCD that may be present in patients with mild
epilepsy and normal intellect or a minor degree of cognitive However, focal cortical dysplasia underlying temporal lobeepilepsy (Kuznieckyet al., 1991) and refractory statusimpairment (Fig. 4). On X-ray CT the white matter may
appear hypodense (Livingston and Aicardi, 1990). The epilepticus is not always identified with MRI (Desbienset al.,1993) and a major thrust of ongoing imaging research is tooverlying cortex may be normal or macrogyric. Band
heterotopia may be associated with the Lennox–Gastaut be able to identify cortical dysplasia that is currently occult.Minor anomalies of the morphology and arrangement ofsyndrome (Palminiet al., 1991b; Ricci et al., 1992). Thicker
bands and more severe associated pachygyria have been cortical gyri may only be visualized if the data is processed

Imaging and epilepsy 347
Fig. 5 Coronal T1-weighted MRI (Ir SPGR) showing nodular subependymal heterotopia in the inferior-lateral wall of the right lateral ventricle (arrow head).
after acquisition and reformatted to display the abnormalities. enhanced cystic lesion. On MRI, the lesions have low signal-A focal area of polymicrogyria, for example, may not be intensity on T1-weighted sequences and a high signal-intensityevident on sagittal, coronal or axial scans and only be evidenton T2-weighted sequences and may show enhancement afteron a reformatted tangential slice that cuts across the affectedinjection of gadolinium DPTA. There may be signalarea or on a three-dimensional reconstruction of the surfaceinhomogeneity on proton density-weighted images. Theof the brain (Barkovichet al., 1995). Quantitative analysis imaging findings are not specific, however, and have muchof the relative volumes of grey and white matter in a cerebralin common with those of a dysembryoplastic neuroepithelalhemisphere that appears macroscopically normal, in patientstumour. Identification of gangliogliomas is important aswith apparently localized neuronal migration defect, maysurgical resection carries a good chance of seizure controlreveal widespread abnormalities (Sisodiyaet al., l995) (Chamberlain and Press, 1990; Otsuboet al., 1990; Perettiimplying that the migration disorder is more extensive. Toet al., 1991; Tampieriet al., 1991; Smithet al., 1992).date, there has not been pathological confirmation of thesefindings. Hitherto unsuspected widespread abnormalities havealso been implied by recent PET studies of centralGranulomasbenzodiazepine receptors (cBZR) (see below) and these Tuberculomas and cysticercosis are the most commonfindings are compatible with the poor likelyhood of a focal identified causes of epilepsy in developing countries. Epilepsycortical resection rendering a patient with a MCD seizure-is the most common manifestation of neurocysticercosisfree and with the contention that even high resolution(Aubry et al., 1995). In a recent Indian series of 170 childrencontemporary MRI only reveals the ‘tip of the iceberg’ of with chronic epilepsy, MRI revealed 64 tuberculomas, 27abnormal cortical development.
cases of cysticercosis and three gliomas (Gulatiet al., 1991).Whilst X-ray CT will often demonstrate neurocysticercosis,MRI is more sensitive in demonstrating various stages in theGangliogliomasdevelopment of noncalcified cerebral cysticercosis lesionsGangliogliomas and gangliocytomas are uncommon benign
neuronal tumours. X-ray CT often shows a calcified contrast- (Sancheteeet al., 1991).

348 J. S. Duncan
of cortical development and cavernomas, clinical andCavernomasfunctional data (neurophysiological and psychological and inCerebral cavernomas commonly underly epilepsy and are ansome cases functional imaging) all need consideration inimportant diagnostic group as surgical removal carries up toreaching a consensus for individual patients (Cascino, 1994;a 70% chance of subsequent seizure remission. CavernomasSpencer, 1995). A small but definite group of patients haveare often not identified on X-ray CT, but have a characteristicunilateral HS evident on MRI, but partial seizures that ariseappearance on MRI (Requenaet al., 1991). Cavernomas arefrom elsewhere in the brain. Also, in ~10% of patients withcircumscribed and have the characteristic appearance of arefractory partial epilepsy who are presurgical candidates,range of blood products. The central part contains areas ofand who have hippocampal atrophy, the atrophy is bilateral.high signal on T1- and T2-weighted images, reflectingIn these patients EEG studies are essential for determiningoxidized haemoglobin, with darker areas on T1-weightedthe site of seizure onset (Fish and Spencer, 1995).images due to deoxyhaemoglobin. The ring of surrounding
The nature of the pathology, revealed by MRI, is anhaemosiderin appears dark on a T2-weighted image. Thereimportant factor in postoperative outcome. In a recent seriesmay be calcification, which usually appears dark on T1- andof 135 patients followed up for 5 years after temporalT2-weighted images. There is no evidence of arteriovenouslobectomy, 69% of patients with foreign tissue lesions, 50%shunting. Arteriovenous malformations with high blood flowwith HS, and 21% with normal MRIs had no postoperativehave a different and distinctive appearance.seizures (Berkovicet al., 1995).
The complete removal of discrete neocortical lesions,identified with MRI, that cause epilepsy has a high successOther pathologiesrate (Williamson et al., 1992; Cascinoet al., 1993b;Focal and generalized atrophy, tumours, scars, cysts,Kuzniecky et al., 1993b; Monteset al., 1995). If no lesionischaemic and traumatic lesions underlying and associatedis identifiable on a high quality MRI, or if there is incompletewith epilepsy are all well demonstrated with MRI. Ischaemicremoval of a lesion, such as multilobar gliosis, there is notlesions associated with epilepsy are particularly common ina good chance of relief of seizures (Cascinoet al., 1992;the older age group and are well demonstrated with MRILorenzoet al., 1995). Functional imaging and invasive EEG(Kilpatrick et al., 1991).recordings may still be needed if no lesion is evident on aIndolent gliomas are clearly identified using MRI. Thesehigh quality MRI, if there is dual pathology or if the clinicallesions are most commonly ill-defined, non-cystic, do notand EEG features are discordant with the MRI. If MRIenhance with contrast media, and appear to arise from deepreveals the dual pathology of a neocortical temporal lobewhite matter. Intracranial epidermoid cysts may give rise tolesion and HS, removal of just the former has a poorrefractory partial seizures and a fixed neurological deficitprognosis, whereas also resecting the sclerosed hippocampusthat is stable over many years.appears to improve the prognosis (Cascinoet al., 1993c).There are, of course, limitations to the resolution of evenThe coincidence of hippocampal atrophy and other pathologythe highest quality contemporary MRI and, as with MCDs,is ~15% overall, but varies with the nature of the otherthe extent of microscopic abnormality evident on pathologicallesion: being 25% in patients with MCD, 31% in the presenceanalysis frequently exceeds that apparentin vivo on the MRI.of porencephalic cysts, 9% with vascular lesions and 2%with low grade gliomas. MCD associated with hippocampalatrophy was located anywhere, whereas vascular lesions were
Transient MRI changes in relation to seizures most commonly close to the atrophic hippocampus (CendesGenerally, single brief complex partial seizures do not appearet al., 1995).to affect the signal on T2-weighted images (Grunewaldet al., MRI has an important role in the assessment of patients1994). Complex partial status and generalized status mayafter surgery for epilepsy, particularly if seizures have notresult in transient increased signal on T2-weighted images remitted and the possibility of a second operation is being(Fujikawa et al., 1991; Horowitzet al., 1992; Leeet al., contemplated. In patients with HS, the extent of hippocampal1992; Monte-Secadeset al., 1994) and this finding needs to resection may be determined from the MRI and a largerbe differentiated from an underlying structural lesion suchresection has generally been correlated with better outcomeas a glioma or inflammatory process (Henryet al., 1994a). (Jack et al., 1988; Awadet al., 1989; Siegelet al., 1990;
Nayel et al., 1991). More extensive left temporal resectionshave been associated with a tendency towards greater
MRI in evaluation for surgical treatment of impairment of verbal memory (Katzet al., 1989). The extentof hippocampal damage preoperatively is an important factorepilepsy
The improvement in MRI over recent years has had a marked as is the extent of resection. If there is severe HS evident onMRI preoperatively, memory, particularly verbal memory inimpact on the nature of presurgical evaluation (Cascino,
1994; Spencer, 1995; Zentneret al., 1995). As noted patients having a resection of a speech dominant temporallobe, is less likely to be worse after surgery, even if there ispreviously, whilst MRI may identify lesions that may be
giving rise to refractory epilepsy, such as HS, malformations an extensive resection. It is removal of a hippocampus that
Imaging and epilepsy 349
appears normal on MRI that carries a high risk of noticeable may increase the yield of useful information. A volumetricallyacquired dataset may be resliced in nonconventionalmemory impairment (Hermannet al., 1992; Lenczet al.,
1992; Miller et al., 1993; Trenerryet al., 1993a; Sass orientations to display an abnormality better (Barkovitchet al., 1995). Abnormalities of gyral pattern may be bestet al., 1994).
A further common use of MRI in the surgical treatment of displayed using curvilinear reconstructions (Bastoset al.,1995). Three-dimensional reconstructions may be used toepilepsy is MRI-based stereotactic placement of intracerebral
recording electrodes (Pillayet al., 1992). MRI-based give a simulation of the surface of the brain and an indicationof gyral morphology. In one study employing this technique,stereotactic procedures have also been used in selective
removal of the hippocampus and amygdala (Kellyet al., gyral abnormalities were reported in six out of 16 patientswith extratemporal seizure disorders and unremarkable two-1987). MRI-based surgical guidance systems have been
developed, that enable structural and superimposed functional dimensional MRI scans (Sisodiyaet al., 1996). A limitationof the current methodologies is that assessment is entirelyimaging data to be presented to the surgeon, with real-time
feedback of the position of a manually controlled pointer in visual and subjective, and has to take the normal variationsin gyral morphology into account.relation to the patient’s MRI scan (Meyeret al., 1996).
MRI may also verify whether a structural lesion has been The surface area of grey and white matter and measuresof the curvature of gyri may be made. These measurementsremoved, which is an important prognostic factor with regards
to outcome (Nayelet al., 1991). Volumetric analysis of pre- can show subtle abnormalities in neocortical structure intemporal lobe epilepsy, but their relationship to epileptic fociand postoperative MRI scans allow an estimation of the
volume of excized cerebral tissue and can provide an audit and the occurrence of seizures is not clear (Leeet al., 1995).of surgical technique (Kitchenet al., 1993, 1994, 1995). Inpatients having a corpus callosotomy, preoperative MRI isnecessary to determine the anatomy of the corpus callosumFunctional MRI
The first functional MRI (fMRI) study applied to epilepsyand, postoperatively, the extent of the section (Bogenet al.,1988; Chadanet al., 1992). was in 1988: abnormal perfusion was demonstrated using
MRI with a phase mapping technique in a patient withepilepsia partialis continua (Fishet al., 1988). Considerabletechnical advances have been made since that time. IncreasedRecent developments in MRI
The fluid attenuated inversion recovery (FLAIR)–MRI perfusion in temporoparietal cortex in a patient with partialstatus epilepticus was demonstrated using a susceptibility-sequence produces images in which parenchymal lesions
have a high signal and CSF gives a low signal. This may weighted sequence and dynamic contrast enhancement withgadolinium (Warachet al., 1994).help in the differential diagnosis of areas of high signal on
T2-weighted images and increase the conspicuity of lesions, fMRI that is sensitive to the oxygenation status ofhaemoglobin provides images that are sensitive to changesbut it does not improve the identification of heterotopias
(Fig. 6) (Segawaet al., 1994; Berginet al., 1995; Wieshmann in regional cerebral blood volume and flow, producing datathat is analogous to that obtained with blood flow tracerset al., 1996). The increased yield from FLAIR depends on
the quality of the ‘standard imaging’. If the latter is good and PET, but with an improved temporal resolution, to theorder of 5 s. This technique can detect ictal changes in CBFthere is little extra information obtained. Suppression of CSF
signal may be poor in the mesial temporal areas, sometimes (Jacksonet al., 1994c; Detre et al., 1995; Warachet al.,1996). Limitations of the method include the effects ofresulting in the appearance of high signal in the hippocampi
and amygdalae in normal subjects; this markedly impairs the movement artefact through a series of scans, although thismay be compensated for by image coregistration, and theutility of the sequence in the evaluation of possible HS.
Diffusion-weighted imaging has been shown to be very fact that it is impracticable for a patient, even with veryfrequent seizures, to lie for hours in an MRI scanner awaitingsensitive in the detection of early ischaemic changes, and to
show changes in animal models of status epilepticus (Prichard, the onset of a seizure. It is possible that fMRI studies willbe able to identify areas of brain involved in the generation1994; Helpern and Huang, 1995). It is not yet clear whether
this technique will be a useful clinical or research tool in the of interictal epileptiform activity. This will be dependent ontechnical advances to allow safe, reliable collection of EEGinvestigation of human epilepsies.
Improved gradient performance underpins echoplanar during echoplanar scanning, and on EEG triggering of scanacquisitions.imaging and further improvements in speed and spatial
resolution are anticipated (Riedereret al., 1995). Phased A further important use of this technique is to delineateareas of brain that are responsible for specific functions, sucharray surface coils may improve signal-to-noise ratio in
superficial cortex and hippocampal regions by 1.7 and this as the primary sensory and motor cortex, and to identifytheir anatomical relation to areas of planned neurosurgicalmay lead to improved spatial resolution (Hayeset al., 1993).
Imaging at high field strengths, such as 4.1 T may improve resection (Hammekeet al., 1994; Jacket al., 1994b; Morriset al., 1994; Puceet al., 1995). Lateralization of languagespatial resolution of gyral anatomy (Kuzniecky, 1995).
Developments in the processing of data after acquisition function may also be accomplished using fMRI (Binderet al.,

350 J. S. Duncan
Fig. 6 Coronal MRI of focal area of dysgenesis in region of left central sulcus. Four images from thesame plane:upper left, proton density (TE 30);upper right, T2-weighted (TE 120);lower left,T1-weighted (Ir SPGR);lower right, FLAIR. The abnormality is apparent on the proton density andT2-weighted images, but is more conspicuous on the FLAIR image (arrow).
1995; Desmondet al., 1995). It is not yet known whether the resonance frequency of a nucleus provides chemicalinformation which may be displayed as a spectrum of signalany suitable paradigms could be developed to lateralize and
localize memory functions satisfactorily, in a way that couldintensity against frequency and in which the area under theobviate the need for a carotid Amytal test in some patients whotrace indicates amplitude of the signal at that frequency.are candidates for a temporal lobe resection (Perrine, 1994). Not all nuclei show magnetic resonance and the most
common naturally occurring isotopes of carbon and oxygen(12C and16O) do not resonate. Nuclei which resonate includeConclusion 1H, 31P, 13C, 19F and23Na. The physical principles of MRS
Over the last decade, the development of MRI hashave been covered in more detail in a recent review (Connelly
revolutionized the investigation and treatment of epilepsy.and Duncan, 1995).
The aetiological basis of partial seizures may commonly beBoth 1H and 31P are naturally abundant (99.98% and
demonstrated, with significant consequences for possible100%, respectively) and are present in compounds that are
surgical treatment. Minor abnormalities, for example subtleof interest in sufficient concentration to be detectable in the
MCDs and areas of gliosis, may not be detected at present.brain in vivo. The MR sensitivity to31P is only 7% that of
The spatial resolution of MRI will improve over the coming 1H so it is necessary to use larger volumes of tissue for31Pyears, with improved diagnostic yield. Quantitative studies
than for 1H-MRS, with a consequent loss of the spatialprovide further sophistication, and serial quantitative scans
resolution of information. To a limited extent the signal-to-will increase the understanding of the consequences of
noise ratio can be improved upon by increasing the numberepilepsy and its treatment.
of acquisitions, but this is not efficient and the feasibleduration of MRS examinations of patients is limited to 60 min.
The volume of brain from which MR spectra are obtainedMagnetic resonance spectroscopymay be defined in two main ways. (i) Single voxel techniquesThe basic principles underlying magnetic resonance
spectroscopy (MRS) are the same as those for MRI. In MRS in which data are acquired from a single volume of interest

Imaging and epilepsy 351
(usually a cube of ~8 ml for1H, or 60–100 ml for31P). A increase of glutamate and/or glutamine has been reportedfollowing partial status epilepticus, although it was notlimitation of single voxel methods is the need to havea
priori data on the location of the epileptogenic focus, or area possible to distinguish between these latter two compounds(Fazekaset al., 1995)that is of interest for some other reason. (ii) Chemical shift
imaging (CSI, also known as MRS imaging) in which a largeregion is excited before the metabolite signals are spatiallyencoded using phase encoding gradients, as is done in MRI.1H-MRS investigation in the temporal lobe
Localized water suppressed MR spectra were obtainedUsing this technique, data from many voxels can be acquiredsimultaneously, and the increase in efficiency can be used to from 82 patients with a variety of epilepsies, on a 1.5 Tesla
system, from single 8 ml voxels that were placed in the leftobtain smaller voxels (1–2 ml for1H or 25 ml for 31P) thanis feasible with single voxel methods. and right medial temporal lobes, including part of the
hippocampus, temporal white matter and neocortical greyAccurate definition of brain anatomy and the identificationof structural abnormalities using MRI is necessary for the matter (Gadianet al., 1994). The volume of interest was
localized using a spin echo sequence, with a TE of 135 ms.interpretation of all functional imaging studies, includingPET, SPECT, fMRI and MRS. The latter techniques may be Signal intensities from 2.0 p.p.m. (NAA), 3.0 p.p.m. (CR)
and 3.2 p.p.m. (choline) were identified on spectra and thecarried out with MRI in a single session.In vivo MRSinvestigations in epilepsy have examined the nuclei31P and areas under the peaks were measured. In comparison with a
group of normal subjects, the patients with epilepsy showed1H and have principally been carried out in patients withtemporal lobe epilepsy who are candidates for surgical a reduction in the signal intensity of NAA and increases in
signal intensities of (choline) and CR, resulting in a decreasetreatment.of the NAA/(choline1CR) ratio. These results implied a lossor dysfunction of neurons in the medial temporal lobe inpatients with epilepsy. Further, as the concentrations ofProton ( 1H) spectroscopy
The metabolites which are detectable using1H-MRS depend creatine, phosphocreatine and choline-containing compoundsappear to be much higher in oligodendrocytes and astrocyteson the conditions used for the acquisition. Some molecules,
for example GABA, glutamate, glutamine and lactate give than in neurons (Urenjaket al., 1993) the increased signalfrom these compounds may reflect gliosis.rise to MR signals that exhibit spin–spin coupling, which
results in the signals changing with time. As a result, the In a subsequent study of 25 adults with well-definedintractable temporal lobe epilepsy and 13 age-matched controldetection of their resonance is dependent on the TE used.
The detection of GABAin vivo has been shown to be subjects (Connellyet al., 1994), 19 of the patients had HS,three had foreign tissue lesions, one had widespread signalfacilitated by the use of spectral editing techniques (Rothman
et al., 1993). In epilepsy studiesin vivo, the principal signals change suggestive of gliosis and two had no abnormalityevident on MRI. In comparison with the normal subjects, theof interest have been those fromN-acetyl aspartate (NAA,
2.01 p.p.m.), creatine1phosphocreatine (CR, 3.0 p.p.m.), patients with temporal lobe epilepsy showed a mean 22%reduction of NAA, 15% increase of CR and 25% increase incholine-containing compounds (choline, 3.2 p.p.m.) and
lactate (doublet signal centred at 1.35 p.p.m.). There is choline in the epileptogenic temporal lobe. The mean NAA/(choline1CR) ratios were significantly less in the patientsevidence, principally from cell culture studies (Urenjaket al.,
1992, 1993), that NAA is located primarily within neurons with epilepsy than in the control subjects, both ipsilateraland contralateral to the focus, with the ipsilateral side beingand precursor cells and a reduction of the NAA signal is
usually regarded as indicating loss or dysfunction of neurons. more affected.An analysis of individual patients showed a reduced NAA/In support of this, a reduction in NAA has been found in
situations in which neuronal loss would be anticipated, such (choline1CR) ratio in 22 of 25 patients (88%) on the sideof the focus, with 10 (40%) having bilateral abnormalities.as in infarcts, tumours, or in epileptic foci. CR and choline
are found both in neurons and in glial cells, and cell studies In six out of the 10 patients with bilateral abnormalities, onetemporal lobe was judged to be significantly more abnormalsuggest that they are present at much higher concentrations
in glia than in neurons (Urenjaket al., 1992, 1993). than the other. When lateralization was possible with MRSthis concurred with MRI findings in all but one case. However,Proton spectroscopy has a greater signal-to-noise ratio and
better spatial resolution than31P-MRS and is more easily two patients with no abnormality shown on MRI had abnormalMRS and three patients with normal MRS on both sides hadcarried out in a single examination, with MRI. In one of the
earliest studies, an increase of lactate was shown by1H-MRS HS. The number of patients was not sufficient to ascribe anyprognostic significance to the data. All 15 of these patients,in the brains of rabbits after bicuculline-induced status
epilepticus (Petroffet al., 1986). who had been followed for.1 year after temporal lobectomy,had a good seizure outcome. Seven out of eight with unilateralMatthews et al. (1990) reported reduced NAA in the
temporal lobes of two patients with Rasmussen’s encephalitis, abnormalities were seizure-free or had auras only, and onehad.90% seizure reduction. Four out of the six with bilateraland focally increased lactate in a patient who had epilepsia
partialis continua. Using MRS, a reduction of NAA and abnormalities were seizure-free or had auras only, and two

352 J. S. Duncan
had had single seizures following surgery. Similar results MRI slice, a reduced NAA/CR ratio was found in theepileptogenic hippocampus in all of 10 patients with temporalhave been reported, using the same technique, in 20 children
with temporal lobe epilepsy (Crosset al., 1996). lobe epilepsy. Four out of the 10 patients also hadabnormalities in the NAA/CR ratio in the contralateralAbnormalities of the NAA/(choline1CR) ratio were found
in 75%, with bilateral abnormalities in 45% and correct hippocampus and in two of these four, invasive EEGrecordings demonstrated seizure onset from both hippocampi.lateralization of the seizure focus in 55%. Bilateral increases
in choline and CR were noted, suggesting gliosis. Significant reductions in the NAA/choline ratio were foundin eight out of the 10 patients. In this population, MRIThe implication from these data was that there is neuronal
loss or dysfunction and astrocytosis in the temporal lobes of showed hippocampal atrophy in seven patients, and wasnormal in three. In the three patients with normal MRI, thepatients with temporal lobe epilepsy. The magnitude of the
reduction of NAA was such that the abnormality could not pathological specimen showed gliosis and minimal neuronalloss, suggesting that this technique may be useful for thebe confined to the hippocampus, as that structure occupies
only a small proportion of the 8 ml voxel used. This finding in vivo identification of subtle pathology (Fig. 7)(Hetheringtonet al., 1995). The findings differ from thoseis consistent with PET data on cerebral glucose metabolism
in which there is commonly an area of hypometabolism that of Connellyet al. (1994) in that the latter found normalproton1H-MRS data in some patients with abnormalities onis larger than the anatomically defined focus (Engelet al.,
1982a; Sackellareset al., 1990). The basis of the regional MRI. The likely explanation of this is the superior spatialresolution and reduced partial volume effects inarea of hypometabolism and, by inference NAA reduction,
is not certain. Comparative PET studies with [11C]flumazenil Hetherington’s (1995) investigation.In a postoperative study of 48 children who had hadand [18F]fluorodeoxyglucose (18FDG) in patients with
temporal lobe epilepsy have suggested that diaschisis is a temporal lobe resections, normal or abnormal proton MRSon the unoperated side was not a prognostic factor for seizuremore likely explanation than is neuronal loss (Henryet al.,
1993a; Savic et al., 1993). The cellular mechanisms that outcome. Patients who had right temporal resections and whohad abnormalities of MRS in the left temporal lobe had someunderly the reduction of NAA, and the elevation of choline
and CR need to be clarified with correlative neuropathological verbal memory deficits, suggesting that the MRS data maybe a useful indicator of the functional integrity of this partstudies. The dynamic changes in the concentrations of NAA
and other metabolites in relation to the occurrence of seizures of the brain (Incisa-della-Rocchettaet al., 1995).Using in vivo 1H/13C-MRS, cortical electroshock wasalso need further evaluation.
CSI has the advantages of giving information on the shown to cause a prolonged rise of brain lactate levelswithout significant change in intracellular pH or high-regional distribution of metabolites and identifying areas of
maximal abnormality, but is more susceptible to artefacts. In energy phosphorylated compounds. The brain lactateapproached equilibrium with blood glucose within 1 h, witha CSI study of 10 patients with temporal lobe epilepsy and
five controls, the left–right asymmetry of NAA/CR ratios nearly complete turnover of the raised brain lactate pool.These techniques may be usefully implemented in thewas found to be significantly different from controls in all
cases (Cendeset al., 1994). This ratio was low in the mid- investigation of human brain to derive further information ofthe metabolic state of cerebral lactate pools in epilepsytemporal lobe in five cases and in the posterior temporal
lobes in eight patients. The asymmetry was maximal in the (Petroffet al., 1992).A postictal rise in lactate has been shown using1H-CSImid-temporal region in three patients and in the posterior
temporal region in six. The use of an asymmetry index alone in the ipsilateral temporal lobe in patients with unilateraltemporal lobe epilepsy, and was also confined to one side inprecludes the detection of bilateral abnormalities. Comparison
of NAA/CR ratios in patients and controls, however, indicated patients who appeared to have bilateral temporal lobeepilepsy. The elevation in lactate persisted for up to 6.5 h,that two patients had a bilateral reduction in the NAA/CR
ratio in the posterior temporal region, and that the greatest hence this may be a useful technique for lateralizing seizurefoci (Comairet al., 1994).reduction was ipsilateral to the maximum EEG disturbance.
One of the 10 patients had no MRI evidence of hippocampal CSI is superior to single voxel techniques in terms ofcoverage of the brain, and is becoming the method of choiceatrophy, but had a decrease of the NAA/CR ratio in the mid-
posterior temporal lobe, and the resected specimen revealed in a number of centres for the study of epilepsy. However,it is technically more demanding than single voxel MRS,mild mesial temporal sclerosis.
A further CSI study on eight patients with unilateral with respect to problems with magnetic field homogeneity(shimming), water suppression and leakage of signal fromcomplex partial seizures and eight controls (Hugget al.,
1994) found a significant asymmetry in the intensity of the subcutaneous fat into voxels other than just those adjacentto the scalp. This is a particular problem with studies of theNAA signal in all of the patients. In each case the lower
NAA was found on the side of EEG focus. No significant temporal lobes, because of the proximity of the petroustemporal bones. Cendeset al. (1994) noted that anteriorchanges in choline or CR were observed.
Using high resolution single slice CSI obtained on a 4.1 temporal lobe structures were more accessible to single voxelmethods, and reported only posterior and mid-temporal resultsTesla instrument, and mapping MRS data onto the equivalent
Imaging and epilepsy 353
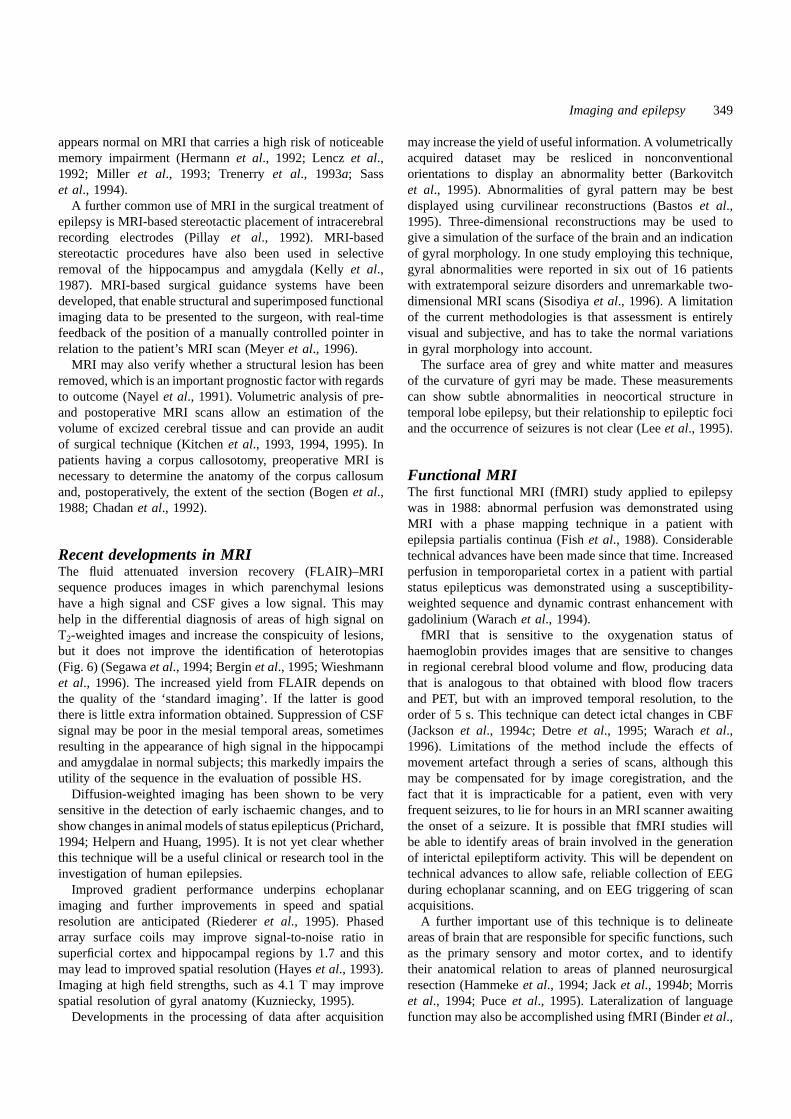
Fig. 7 (A) An oblique axial MRI scan through the posterior body of each hippocampus in a patientwith left temporal lobe epilepsy. (B) Regions in which the CR/NAA ratio is.0.9 are overlaid onto theMRI image, showing elevation of this ratio in the posterior left hippocampus and the cerebellar vermis.The former suggests neuronal loss or dysfunction, but the latter is a normal finding in groups of healthycontrol subjects. (Reprinted by permission of the publisher from ‘Application of high field spectroscopicimaging in the evaluation of temporal lobe epilepsy’ by Hetheringtonet al., Magn Reson Imaging 1995;13: 1179. © Elsevier Science Inc.)
from their CSI study. Xueet al. (1993) also reported problems will be difficult to establish this role firmly, as presurgicalevaluation depends on establishing a consensus betweenwith sub-optimal shimming when performing CSI in a large
region including both temporal lobes and, in consequence, different strands of data. Examination of a larger number ofpatients is needed to determine the strength of the associationsadopted the strategy of acquiring CSI volumes from each
temporal lobe separately. The same group have subsequently between1H-MRS and other investigatory data and the clinicalsignificance of discrepancies.reported localized reductions of NAA/choline in 53 patients
with temporal lobe epilepsy, unilateral in 34 and bilateral in19 (Xueet al., 1994). Sauteret al. (1991) have shown in acomparative study (CSI versus single voxel localization) that
1H-MRS investigations in extratemporal seizurethe CSI data must be interpreted with caution. Nevertheless,in the long run, it is likely that CSI will provide data that disorders
Single voxel1H-MRS applied to the supplementary motorcannot be obtained using other techniques.The place of1H-MRS in the clinical evaluation of patients area in patients whose seizures were believed to originate
from this region, without structural abnormalities on MRI towith temporal lobe epilepsy is not yet clear. Issues that needto be addressed include the following. (i) Definition of the guide voxel placement, was not helpful in one study (Cook
et al., 1991). A 1H-CSI study reported reduced NAA inclinical significance and reliability of1H-MRS data when itis discordant with other information and when data from other frontal lobes ipsilateral to frontal lobe epileptic foci in eight
patients (Garciaet al., 1993). This finding needs to beinvestigations are equivocal. (ii) Is a bilateral abnormality of1H-MRS an adverse prognostic factor for a good outcome replicated and it is necessary to determine the extent of the
area of NAA reduction in patients with seizures of frontal,from temporal lobectomy? (iii) Interpretation of the range of1H-MRS findings in the temporal lobes of patients with temporal and posterior hemisphere onset. It is likely that
technical advances in MR hardware and software technology,epileptic seizures of extratemporal onset.At present,1H-MRS appears to be a sensitive method for CSI and automated MRS examinations will allow further
clinical applications, such as the ability to localize focaldetecting regional neuronal integrity and may identify areasof gliosis. In future, the technique may contribute in clinical abnormalities that underly seizure disorders, in the temporal
and extratemporal neocortex, when MRI does not reveal apractice to the lateralization and localization of the epilepticfocus and the identification of bilateral abnormalities and it structural abnormality.
As yet there have not been systematic MRS studies ofmay further reduce dependence on invasive EEG studies. It
354 J. S. Duncan
MCD. In a recent report of two children with 31P-MRS has been used in several recent clinical studies toinvestigate the metabolic changes associated with partialhemimegalencephaly, the white matter of the affected
hemisphere had markedly reduced concentrations of NAA seizure foci.Laxer et al. (1992) studied the anterior temporal lobes ofand glutamate, with mild abnormalities in the contralateral
hemisphere, and with less marked changes in the grey matter. eight patients with complex partial seizures and HS andfound no significant asymmetries between ipsilateral andOne child had increased myoinositol- and choline-containing
compounds in grey matter, suggesting gliosis (Hanefield contralateral temporal lobes of ATP, PCr or PDEconcentrations. In seven out of the eight patients, the temporalet al., 1995).lobe ipsilateral to the focus had an increased pH (mean inall eight patients of 7.25 versus 7.08) and, in all eight,increased Pi (mean 1.9 versus 1.1 mM). Concentrations of1H-MRS investigations of neurotransmitters
1H-MRS can identify cerebral GABAin vivo and estimate PME were less on the side of the focus, although thiswas not statistically significant. No significant side to sidethe rise in GABA concentrations that occurs after
administration of vigabatrin to humans (Rothmanet al., asymmetries were noted in eight normal subjects. There wasno apparent relationship between the pH and Pi levels and1993) and to rats (Preeceet al., 1994). This technique has
also been used to elucidate the dose–response curve of this severity of abnormality shown by MRI. The spatial resolutionof this study was very limited and tissue heterogeneity mayeffect, and to measure glutamate and glutamine levels.
These experiments have implicated feedback inhibition of have confounded interpretation of the data. The same groupsubsequently investigated eight patients with partial seizuresthe conversion of glutamine to glutamic acid by elevated
cerebral GABA concentrations, offering an explanation as (seven temporal, one frontal) using31P-CSI, with an effectivevoxel size of 25 cm3, enabling more precise delineation ofto why the latter do not continue to rise, in human brain,
with doses of vigabatrin in excess of 3 g/day (Petroffet al., regions of interest (Hugget al., 1992). The same lateralizingabnormalities were found; that is increased Pi, decreased PME1995). Increased cerebral GABA concentrations have also
been noted following gabapentin administration, using MRS and increased pH (7.17 ipsilateral versus 7.06 contralateral,P , 0.01). The side to side asymmetry of all metabolite(Petroff et al., 1996). Decreased glutamate and increased
myoinositol have also been noted in 2 ml voxels in intensities in a control group was,10%. Using 31P-CSI,Laxer et al. (1993) found increased pH (7.13 ipsilateralepileptogenic hippocampi (Wieseret al., 1995).
A limitation at present is the inability to distinguish, versus 6.97 contralateral), higher Pi and reduced PME in theanterior hippocampus of 11 patients with seizures arisingnon-invasively, between the metabolic and neurotransmitter
pools of these compounds. Development of this area of from the anterior hippocampus. In the temporal lobe, apartfrom the hippocampus, PME and Pi showed similarresearch, however, opens the possibility of a non-invasive
characterization of regional cerebral neuro-metabolic profiles asymmetries, but pH did not. In a later study of eight patientswith frontal lobe epilepsy, increased pH in all eight andof patients developing seizure disorders. It is possible that
these data could be used to help in the initial selection of decreased PME in seven patients were found in theepileptogenic frontal lobes, but no alteration in Pi levels,drug therapy in each individual patient, to monitor the effects
of therapy and to identify focal abnormalities that may be were detected (Garciaet al., 1994b).Kuzniecky et al. (1992) obtained31P-spectra from singleof relevance in the presurgical evaluation of medically
refractory patients. voxels in seven patients with temporal lobe epilepsy andfive control subjects. There was no statistically significantdifference in the pH in either of the temporal lobes. Thesewere 7.11 (ipsilateral) and 7.05 (contralateral) with the31P spectroscopy
Cerebral metabolites detectable with31P-MRS in epilepsy ipsilateral value being closer to that measured in controls(mean control pH was 7.12). Although not statisiticallyinclude compounds related to high energy phosphate and
phospholipid metabolism such as ATP, phosphomonoesters significant, these findings (with the ipsilateral pH larger)were similar to those described by Laxeret al. (1992, 1993).(PME), phosphodiesters (PDE), phosphocreatine (PCr), and
inorganic phosphate (Pi). At neutral pH, Pi exists principally Of the frontal lobe studies, only that of Garciaet al. (1994b)quoted a control value for pH, and this was similar to theas HPO4 and H2PO4. The chemical shift of31P in these two
molecules differs by ~2.4 p.p.m., but rapid exchange between contralateral values in patients.No changes in PME levels were reported by Kuznieckythe two forms results in only a single MR spectral peak
being detected. The resonance frequency of the peak iset al. (1992). The PCr/Pi ratios were lower in the ipsilateralthan in the contralateral temporal lobe of the patients, anddetermined by the proportion of the two species present and
as the equilibrium is dependent on the pH of the tissue, this the ratios on both sides were lower than those in the controldata. This appears consistent with the studies of Laxeret al.is reflected in the effective chemical shift of Pi and is
measurablein vivo. (1992) and Hugget al. (1992) in that each of these twostudies reported an increase in Pi with no change in PCrIn animal models, epileptic seizures can produce marked
changes in energy metabolism and tissue pH (Siesjo, 1978). (giving a decrease in PCr/Pi). It should be noted, however,

Imaging and epilepsy 355
that Kuznieckyet al. (1992) interpreted this change in terms brain,in vivo (Gruetteret al., 1992; Rothmanet al., 1992;Masonet al., 1995; Van Zijl and Rothman, 1995). Studiesof a decrease in PCr, and not an increase in Pi, but did not
report intensity levels for the individual metabolites. in patients with epilepsy are only just beginning, but theypromise important data on the metabolic abnormalitiesThe pathophysiological significance of these data are not
certain at present. It has been suggested that a decrease in associated with epileptogenesis.PME may reflect altered metabolism associated with neuronalcell loss and glial proliferation (Hugget al., 1992), both ofwhich are associated with HS and cortical lesions, althoughConclusionthe data do not provide direct evidence of this. All studiesOver the last 5 years, MRS has advanced as a non-found a higher pH on the ipsilateral side compared with theinvasive tool for obtaining data on cerebral metabolism.contralateral side. In one series, this difference was notImplementation of the rapid developments now being madefound to be significant (Kuznieckyet al., 1992), while the in MR hardware and software may enable parametric imagingother three studies reported a higher ipsilateral pH that wasof the cerebral concentrations of these compounds, and thisstatistically significant. Kuznieckyet al. (1992) found that may have significant consequences for the medical andthe higher ipsilateral pH values were similar to control surgical treatment of patients with epilepsy.measurements, while Garciaet al. (1994b) reported that thecontralateral pH in the frontal lobe was similar to controlvalues. In conclusion, the evidence for an increase in pH inPositron emission tomography (PET)the region of a seizure focus is not yet definitive, and further
PET may be used to map CBF, using15O-labelled water,work is needed on larger groups of both patients andand regional cerebral glucose metabolism using18FDG.control subjects.PET may also be used to demonstrate the binding ofIf confirmed, the neurobiological significance of an increasespecific ligands, e.g. [11C]flumazenil to the central benzo-in pH associated with a seizure focus is not clear. Seizuresdiazepine–GABAA receptor complex, [11C]diprenorphine andhave been shown to produce acidosis. Hugget al. (1992)[11C]carfentanil to opiate receptors and [11C]deuteriumpostulated that an increase in pH might be the consequencedeprenyl to monoamineoxidase (MAO) B receptors. Theof an adaptation in brain buffering in response to repeatedtechnique is costly and scarce, but produces quantitative dataacidotic episodes associated with seizures, but there is nowith superior spatial resolution to single photon emissiondirect evidence for this.computerized tomography (SPECT) (see below). TheIn several of the above studies,31P-MRS appeared to beradiation exposure from an18FDG-PET scan is ~5 mSv,superior to MRI in determining the lateralization of thewhich is similar to that received from a series of H2
15O scansseizure focus. The MRI methods and analysis used were notto determine areas of brain involved in a cerebral task.described, however, and MRI methods that detect HS andSPECT blood flow scans result in an exposure of ~4 mSvother subtle cortical abnormalities reliably have only beenand 11C-ligand studies in 1–2 mSv. These exposures limitreported recently (seeprevious section). It is not clear whetherthe comparative studies that may be carried out on patients31P-MRS provides useful lateralizing and localizing data overand normal volunteers.and above that available from optimal MRI, and comparative
PET has been available for longer than MRI. Enormousstudies using suboptimal MRI should be treated with caution.strides have been made using MRI in the last 10 years andEven with this caveat,31P-MRS yields potentially very usefulthis has has had two major consequences for the applicationdata which will be enhanced by technological developmentsof PET techniques to epilepsy. First, the role of PET in thesuch as the use of improved radiofrequency coils, particularlyclinical investigation of patients needs to be re-evaluated, asdouble-tuned coils which would allow1H-imaging and31P-contemporary MRI may make PET data superfluous.spectroscopy to be carried out in the same examinationSecondly, clinical and research PET data should alwayswithout changing coils. This would simplify investigationsbe interpreted in the light of high quality anatomical MRI,and the anatomical localization of the spectra. Future studiesto provide a structural–functional correlation. Fundamentalwill need to compare31P-MRS data with optimal MRI andto making these correlations has been the development ofto address the question of whether CSI can make a usefulcomputer programs that may be used to coregister MRI andcontribution to the precise localization of epileptic foci, inPET datasets on a pixel-by-pixel basis, as demonstratedaddition to lateralization.initially by Woodset al. (1993).
Carbon (13C) spectroscopyPET studies of generalized epilepsyCarbon 13 is only present in 1% of naturally occurring
compounds. Compounds labelled with13C need to be Blood flow and glucose metabolismThere have been three studies of cerebral glucose metabolismadministered to subjects for studies to be carried out. Dynamic
investigations allow measurement of glucose transport, using18FDG and PET in patients with idiopathic generalizedepilepsy. Interictal studies have been unremarkable; studiesoxidation, glutamate turnover and glutamine synthesis in

356 J. S. Duncan
carried out when frequent absences were occurring have decreased density in the thalamus (Savicet al., 1994).Reliable identification of cerebellar nuclei is not easy onshown a diffuse increase in cerebral glucose metabolism of
30–300%, with greater increases being seen in children. [11C]flumazenil PET images and these results have notbeen replicated. Prevettet al. (1995b) found no significantAbsence status, however, was associated with a reduction
in cerebral glucose metabolism. There were no focal difference in [11C]flumazenil binding in the cerebral cortex,thalamus or cerebellum between patients with childhood andabnormalities and the rate of metabolism did not correlate
with the amount of spike-wave activity (Engelet al., 1985; juvenile absence epilepsy, not taking valproate, and controlsubjects. The volume of distribution of [11C]flumazenil,Theodoreet al., 1985; Ochset al., 1987).18FDG-PET studies
have poor temporal resolution, 70–80% of cerebral uptake however, was 9% less in patients receiving valproatesuggesting that this drug may result in reduced number ofoccurring over 15 min following intravenous injection, with
the consequence that in a patient with frequent absences, available BZR. In a further study comparing 10 patients withidiopathic generalized epilepsy, before and after introductionthere is an amalgam of pre-ictal, ictal and postictal periods
contributing to one scan. of valproate, with 20 control subjects, patients with idiopathicgeneralized epilepsy had an 11% higher binding to cBZR inIn an autoradiographic study of cerebral glucose utilization
in a rat model of spontaneous generalized absences, there neocortex, a 14% increase in the thalamus and 13% increasein cerebellar cortex; the introduction of valproate was notwas a widespread increase in cerebral glucose metabolism,
compared with controls. The relationship between spike wave associated with a significant change in cBZR (Duncanet al., 1996b). The diversity of findings reflect criteria usedactivity and cerebral glucose utilization is not straightforward,
however, as a dose of ethosuximide that suppressed all spike- to select patients for study and methodological differences,including improvements in scanner sensitivity in laterwave activity was not associated with a reduction of glucose
metabolism (Nehliget al., 1991, 1992). studies. These data provide evidence for the structural andfunctional basis of idiopathic generalized epilepsy. It is notRegional CBF (rCBF) has been assessed using PET and
bolus injections of H215O, achieving a temporal resolution certain whether this is the result of an increased numberof neurons or a functional change in available receptors.of ,30 s and a spatial resolution of 83834.3 mm3. Typical
absences were precipitated with hyperventilation and the Correlative neuropathological studies will be needed toanswer this question. Results suggest, however, that valproatedistribution of rCBF which resulted was compared with that
when there were no absences. During absences there was a does not affect the numbers of available GABAA-BZR, butdo not exclude a modulatory effect on receptor function.global 15% increase in CBF and, in addition, a focal 4–8%
increase in blood flow in the thalamus. There were no focal Acutely, the cerebral binding of [11C]flumazenil, was notaffected by flurries of absences in any area of neocortex orincreases in CBF in the cortex and no focal decreases
(Prevettet al., 1995a). Spike-wave activity in typical absences the thalamus implying that binding to this part of the GABAA-BZR is not involved in the pathophysiology of absencesoscillates in thalamo-cortical circuits and the site of primary
abnormality remains uncertain. The preferential increase in (Prevettet al., 1995c).Systemic administration of opioids tends to cause anthalamic blood flow is evidence to the key role of this
structure in the pathophysiology of absences in man, but increase in generalized spike-wave activity, in contrast to theanticonvulsant effect of opiates and endogenous opioidsdoes not clarify whether this is the result of converging
activated thalamo-cortical pathways or reflects a primary on generalized tonic-clonic seizures, suggesting that opioidtransmission may have a role in the pathogenesis of absencesthalamic process. No significant increases in thalamic blood
flow were detected in the 30 s prior to generalized spike- (Frey and Voits, 1991). Diprenorphine is a weak opiatereceptor partial agonist with similarin vivo affinities for thewave activity on the EEG. It would be most unlikely for a
focal increase in blood flow, developing 5 s before generalized µ-, κ- and δ-receptor subtypes. There was no significantdifference in [11C]diprenorphine binding between controlspike-wave activity appeared, to be detected with this
technique. fMRI has superior temporal resolution (seeabove), subjects and patients with childhood and juvenile absenceepilepsy, suggesting there is no overall abnormality of opioidbut as the blood-flow response to increased neuronal activity
lasts ~2 s, it may not be fine enough to show whether receptors in this condition (Prevettet al., 1994).In a dynamic study, however, it was found that serialabnormal activity commences in the cortex or the thalamus.
absences were associated with an acute 15–41% reduction in[11C]diprenorphine binding to association areas of neocortex,with no effect on binding to thalamaus, basal ganglia orBenzodiazepine and opioid receptors
Savic et al. (1990) reported a slight reduction in cortical cerebellum. The results implied release of endogenous opioidsin the neocortex that may have a role in the pathophysiologybinding of [11C]flumazenil to cBZR in a heterogenous group
of patients with generalized seizures, compared with the of typical absences (Bartensteinet al., 1993). Further studieswith subtype-specific ligands may provide information about‘nonfocus’ areas of patients with partial seizures. It was
subsequently reported that, compared with normal subjects, the role of different opioid receptor subtypes in typicalabsences. Ligands to investigate GABAB and excitatorypatients with primary generalized tonic-clonic seizures had
an increased BZR density in the cerebellar nuclei and a amino acid receptors will give useful information on the

Imaging and epilepsy 357
involvement of these systems in the pathogenesis of typicalet al., 1992a). The results of comparative studies dependscritically on the relative sophistication of the techniques used.absences and idiopathic generalized epilepsy.In a recent comparative study, 16 out of 18 patients withtemporal lobe epilepsy had temporal lobe hypometabolismon 18FDG-PET and 11 of these had clear concordant MRIPET studies of localization-related epilepsies abnormalities (lesions in two and features of HS in nine). It
Blood flow and glucose metabolism could be concluded that18FDG-PET data did not provideThe hallmark of an epileptogenic focus, studied interictally,clinically useful data if the MRI findings were definite, butis an area of reduced glucose metabolism and reduced bloodthat it had some additional sensitivity (Gaillardet al., 1995a).flow that is usually considerably larger than the pathological It was noted that the visual assessment of hypometabolismabnormality (Engelet al., 1982a, Francket al., 1986).18FDG- was less accurate than quantification. The asymmetry ofPET scans provide superior resolution and greater reliabilitylateral but not mesial temporal glucose metabolism wasfor identifying a focal deficit than do PET scans using H2
15O greater in patients who became seizure-free following surgery.or SPECT scans of CBF (Leidermanet al., 1992; Ryvlin Patients withù15% hypometabolism were more likely toet al., 1992a; Theodoreet al., 1994). become seizure-free (Theodoreet al., 1992a). The degree and
The most likely reason for the large region of reducedextent of temporal lobe hypometabolism has been stronglyblood flow and metabolism is inhibition or deafferentation correlated with the seizure outcome following temporalof neurons around an epileptogenic focus. Comparison oflobectomy (Radtkeet al., 1993). In a similar study, the degree18FDG-PET scans with [11C]flumazenil scans (see below) of hypometabolism in the medial temporal lobe, but not in(Henry et al., 1993a; Savic et al., 1993) indicate that the the lateral temporal lobe, correlated with the chances of beingneuronal loss is confined to a more restricted area thanrendered seizure-free by anterior temporal lobe resectionthe region of reduced metabolism. (Manno et al., 1994). Absence of unilateral temporal
Partial seizures are associated with an increase in regionalhypometabolism, however, does not preclude a good resultcerebral glucose metabolism and blood flow in the region offrom surgery (Cheeet al., 1993).the epileptogenic focus, and often a suppression elsewhere The area of hypometabolism often extends beyond the(Engel et al., 1983; Chuganiet al., 1994). In general, ictal temporal lobe. In a series of 27 patients, with no specificPET scans can only be obtained fortuitously, because of theabnormality evident on the MRI available at the time, this2 min half-life of 15O and the fact that cerebral uptake of involved the thalamus in 63%, the basal ganglia in 41%18FDG occurs over a 40 min period after injection, so thatand the frontal lobe in 30% (Henryet al., 1993b). Similarcerebral glucose utilization data will reflect an amalgamresults were found in other series (Sperlinget al., 1990). Inof the ictal and postictal conditions. Hypometabolism ispatients with medial temporal lobe foci the hypometabolismaccentuated after a seizure and may not return to the interictalhas frequently been found to be more pronounced in lateralstate for.24 h (Leidermanet al., 1994). neocortex (Sackellareset al., 1990; Sadzotet al., 1992). This
Over the last decade, some epilepsy surgery programmesfinding may reflect the limited spatial resolution of thehave relied extensively on18FDG-PET as a tool for localizing cameras used; but in consequence18FDG-PET studies havethe epileptic focus. The current place of this technique needsbeen felt to be less reliable for answering the question ofto be re-evaluated in the light of developments in MRI asprecise localization of seizure onset, e.g. inferior frontalthe finding of a definite focal abnormality with the latter versus medial or lateral temporal lobe, than for answeringtechnique, such as HS, may render an18FDG-PET scan the question of lateralization, e.g. left or right temporal lobe.superfluous (Heinzet al., 1994; Gaillardet al., 1995a). In an evaluation of18FDG-PET in patients with temporalComparative studies of two imaging techniques, such as MRIlobe epilepsy and different pathologies, those with HS hadand PET are difficult to interpret, however, because of thethe lowest glucose metabolism in the whole temporal lobe,likelyhood that the methodologies and equipment will notfollowed by patients whose seizures arose laterally. Patientsboth be developed to the same degree in any one centre. with mesiobasal tumours generally had only a slight reduction
of glucose uptake in the temporal lobe. The metabolicpattern was different between patients with mesial and lateralTemporal lobe epilepsy.Several studies of18FDG-PET
have found a 60–90% incidence of hypometabolism in the temporal seizure onset, but there was not a clear correlationbetween the location of the epileptogenic focus defined withtemporal lobe interictally in adults and children with temporal
lobe epilepsy (Kuhlet al., 1980; Engelet al., 1982a–c; EEG and the degree of hypometabolism (Hajeket al., 1993).Studies such as this are of interest in understanding theTheodoreet al., 1983; Francket al., 1986; Abou-Khalilet al.,
1987; Stefanet al., 1987a; Ryvlin et al., 1991; Sadzotet al., metabolic consequences of epilepsy of different aetiologies,but from a clinical perspective have been rendered less useful1992; Gaillardet al., 1995b). In studies carried out before
the recent developments in assessment of the hippocampus by modern MRI.In one study, hippocampal neuron loss was not correlatedusing MRI, 18FDG-PET was thought to be a highly useful
clinical tool, particularly in patients in whom scalp EEG with the degree of temporal lobe hypometabolism (Henryet al., 1994b). In contrast, a recent comparison of hippocampalrecordings were non localizing (Engelet al., 1990; Theodore
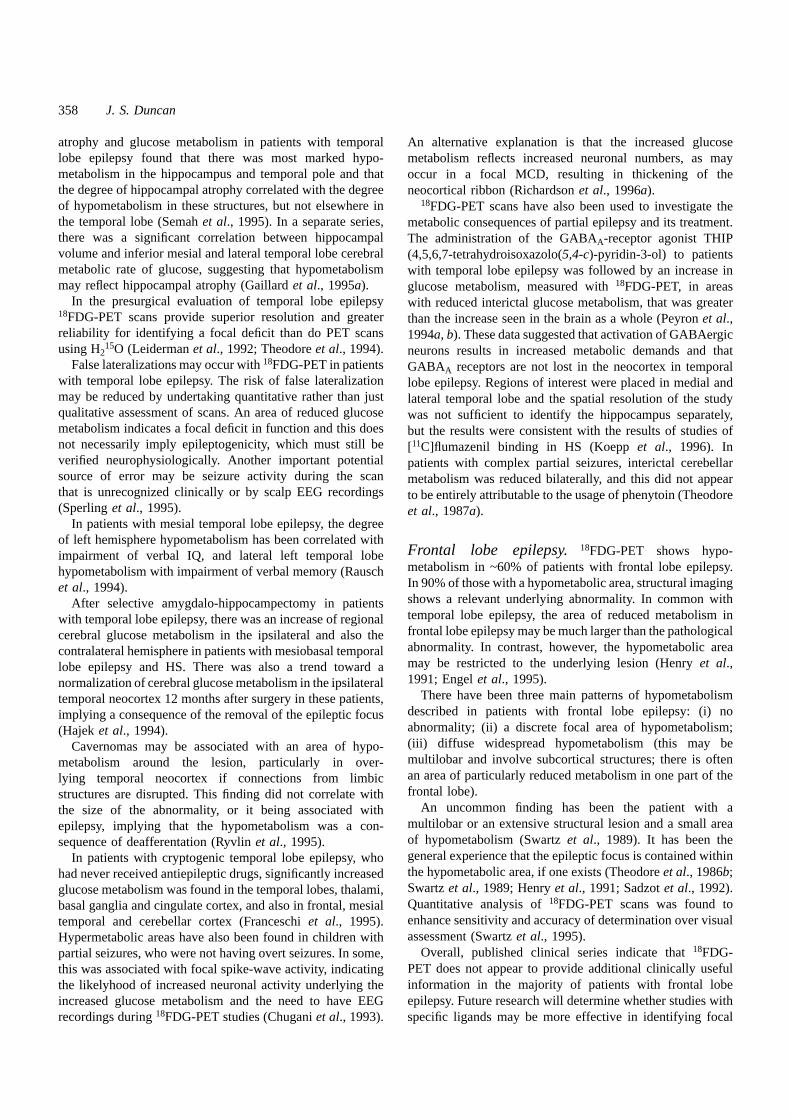
358 J. S. Duncan
atrophy and glucose metabolism in patients with temporal An alternative explanation is that the increased glucoselobe epilepsy found that there was most marked hypo-metabolism reflects increased neuronal numbers, as maymetabolism in the hippocampus and temporal pole and thatoccur in a focal MCD, resulting in thickening of thethe degree of hippocampal atrophy correlated with the degreeneocortical ribbon (Richardsonet al., 1996a).of hypometabolism in these structures, but not elsewhere in 18FDG-PET scans have also been used to investigate thethe temporal lobe (Semahet al., 1995). In a separate series, metabolic consequences of partial epilepsy and its treatment.there was a significant correlation between hippocampalThe administration of the GABAA-receptor agonist THIPvolume and inferior mesial and lateral temporal lobe cerebral(4,5,6,7-tetrahydroisoxazolo(5,4-c)-pyridin-3-ol) to patientsmetabolic rate of glucose, suggesting that hypometabolismwith temporal lobe epilepsy was followed by an increase inmay reflect hippocampal atrophy (Gaillardet al., 1995a). glucose metabolism, measured with18FDG-PET, in areas
In the presurgical evaluation of temporal lobe epilepsywith reduced interictal glucose metabolism, that was greater18FDG-PET scans provide superior resolution and greaterthan the increase seen in the brain as a whole (Peyronet al.,reliability for identifying a focal deficit than do PET scans 1994a, b). These data suggested that activation of GABAergicusing H2
15O (Leidermanet al., 1992; Theodoreet al., 1994). neurons results in increased metabolic demands and thatFalse lateralizations may occur with18FDG-PET in patients GABAA receptors are not lost in the neocortex in temporal
with temporal lobe epilepsy. The risk of false lateralizationlobe epilepsy. Regions of interest were placed in medial andmay be reduced by undertaking quantitative rather than justlateral temporal lobe and the spatial resolution of the studyqualitative assessment of scans. An area of reduced glucosewas not sufficient to identify the hippocampus separately,metabolism indicates a focal deficit in function and this doesbut the results were consistent with the results of studies ofnot necessarily imply epileptogenicity, which must still be [11C]flumazenil binding in HS (Koeppet al., 1996). Inverified neurophysiologically. Another important potential patients with complex partial seizures, interictal cerebellarsource of error may be seizure activity during the scanmetabolism was reduced bilaterally, and this did not appearthat is unrecognized clinically or by scalp EEG recordingsto be entirely attributable to the usage of phenytoin (Theodore(Sperlinget al., 1995). et al., 1987a).
In patients with mesial temporal lobe epilepsy, the degreeof left hemisphere hypometabolism has been correlated with
Frontal lobe epilepsy. 18FDG-PET shows hypo-impairment of verbal IQ, and lateral left temporal lobemetabolism in ~60% of patients with frontal lobe epilepsy.hypometabolism with impairment of verbal memory (RauschIn 90% of those with a hypometabolic area, structural imaginget al., 1994).shows a relevant underlying abnormality. In common withAfter selective amygdalo-hippocampectomy in patientstemporal lobe epilepsy, the area of reduced metabolism inwith temporal lobe epilepsy, there was an increase of regionalfrontal lobe epilepsy may be much larger than the pathologicalcerebral glucose metabolism in the ipsilateral and also theabnormality. In contrast, however, the hypometabolic areacontralateral hemisphere in patients with mesiobasal temporalmay be restricted to the underlying lesion (Henryet al.,lobe epilepsy and HS. There was also a trend toward a1991; Engelet al., 1995).normalization of cerebral glucose metabolism in the ipsilateral
There have been three main patterns of hypometabolismtemporal neocortex 12 months after surgery in these patients,described in patients with frontal lobe epilepsy: (i) noimplying a consequence of the removal of the epileptic focusabnormality; (ii) a discrete focal area of hypometabolism;(Hajek et al., 1994).(iii) diffuse widespread hypometabolism (this may beCavernomas may be associated with an area of hypo-multilobar and involve subcortical structures; there is oftenmetabolism around the lesion, particularly in over-an area of particularly reduced metabolism in one part of thelying temporal neocortex if connections from limbicfrontal lobe).structures are disrupted. This finding did not correlate with
An uncommon finding has been the patient with athe size of the abnormality, or it being associated withmultilobar or an extensive structural lesion and a small areaepilepsy, implying that the hypometabolism was a con-of hypometabolism (Swartzet al., 1989). It has been thesequence of deafferentation (Ryvlinet al., 1995).general experience that the epileptic focus is contained withinIn patients with cryptogenic temporal lobe epilepsy, whothe hypometabolic area, if one exists (Theodoreet al., 1986b;had never received antiepileptic drugs, significantly increasedSwartzet al., 1989; Henryet al., 1991; Sadzotet al., 1992).glucose metabolism was found in the temporal lobes, thalami,Quantitative analysis of18FDG-PET scans was found tobasal ganglia and cingulate cortex, and also in frontal, mesialenhance sensitivity and accuracy of determination over visualtemporal and cerebellar cortex (Franceschiet al., 1995).assessment (Swartzet al., 1995).Hypermetabolic areas have also been found in children with
Overall, published clinical series indicate that18FDG-partial seizures, who were not having overt seizures. In some,PET does not appear to provide additional clinically usefulthis was associated with focal spike-wave activity, indicatinginformation in the majority of patients with frontal lobethe likelyhood of increased neuronal activity underlying theepilepsy. Future research will determine whether studies withincreased glucose metabolism and the need to have EEG
recordings during18FDG-PET studies (Chuganiet al., 1993). specific ligands may be more effective in identifying focal

Imaging and epilepsy 359
abnormalities in patients in whom structural imaging has not In another, widespread bilateral hypometabolism or a mildincrease in glucose metabolism were noted in the left inferiorrevealed an aetiology for the seizure disorder.
Status epilepticus arising from the motor cortex has been temporal cortex in the awake state. In scans performed duringslow-wave sleep there was a marked bilateral increase inassociated with both hypermetabolism and hypometabolism
(Engelet al., 1983; Francket al., 1986; Hajeket al., 1991). glucose metabolism in temporal cortex, supporting thehypothesis that the increase in glucose metabolism reflectedScans performed with H215O have shown increased blood
flow and oxygen consumption and reduced oxygen extraction areas of epileptic activity (Rintahakaet al., 1995).fraction in the frontal lobe in patients with epilepsia partialiscontinua (Francket al., 1986). A rare finding, in patients Studies of the effect of antiepileptic drugs.The
effects of antiepileptic drugs on cerebral glucose metabolismwith frontal epilepsy of early childhood onset, has been aninterictal focal increase in metabolism (Chuganiet al., 1993) has also been studied with18FDG-PET; carbamazepine was
associated with a diffuse 12% reduction, valproate a 22%(seeabove).reduction, phenytoin a non-uniform reduction (mean 13%)and phenobarbitone a 37% reduction (Theodore 1988;Malformations of cortical development.Focal cortical
hypometabolism is commonly seen in patients with tuberous Theodoreet al., 1989; Leidermanet al., 1991)sclerosis (Szelieset al., 1983; Pawliket al., 1990). Glucosemetabolism has been detected using18FDG-PET in the layers Activation studies.Activation studies using18FDG-PET
in attempts to highlight the hypometabolic area have beenof ectopic neurons in band heterotopia (Miuraet al., 1993;De Volder et al., 1994) and in heterotopic nodules and reported; they may improve the delineation of dysfunctional
areas of brain (Pawliket al., 1990; Bromfieldet al., 1991;displaced grey matter (Bairamianet al., 1985; Falconeret al.,1990), implying synaptic activity. Pawliket al., 1994). However, these studies have the
severe limitation of cerebral uptake of18FDG continuing forIn 15 out of 17 patients with MCD, both MRI and18FDG-PET identified ectopic grey matter, and hypometabolismù15 min. Activation studies performed with H2
15O havebeen used for some years to delineate the functional anatomyconcurred with MRI findings of abnormal cortex. Analysis
was by visual inspection and18FDG-PET did not identify of a variety of cognitive and other cerebral tasks. These maybe used in surgical planning in patients with epileptogenicabnormalities that were not evident on MRI, although in
some cases the area of hypometabolism was more extensive areas close to eloquent areas (Hojoet al., 1995). Ongoingstudies are applying these tests to patients with partial seizuresthan the MRI lesion (Leeet al., 1994). This finding contrasts
with the quantitative analysis of [11C]flumazenil PET data in on the basis of MCD in order to determine the perturbationand rearrangement of cerebral functions associated with thispatients with MCD (Richardsonet al.,1996a) (seebelow).
Abnormalities of glucose metabolism, identified with condition (Richardsonet al., 1996b). In the future, however,it is likely that fMRI studies will fulfil this important18FDG-PET, in the contralateral hemisphere in patients
with hemimegalencephaly have been associated with a less role.good prognosis following surgery (Rintahakaet al., 1993).
Other syndromes.Some patients with severe secondarily LigandsCentral benzodiazepine receptors.The binding ofgeneralized epilepsies and syndromes such as West’s
syndrome, Lennox–Gastaut syndrome, Landau–Kleffner [11C]flumazenil to cBZR in epileptogenic foci was initiallyfound to be reduced by an average of 30%, with no changesyndrome and other paediatric epilepsy syndromes, appear
to be of cryptogenic aetiology on MRI. There may, however, in the affinity of the ligand for the receptor (Savicet al.,1988). Other groups have also found this and comparativebe single or multiple cortical areas of hypometabolism
on 18FDG-PET scans which indicate areas that may be studies with18FDG-PET scans have shown the area ofreduced [11C]flumazenil binding to be more restricted thanepileptogenic, the pathological correlate of which is MCD
(Chugani, 1994). Patients with the Lennox–Gastaut syndrome is the area of reduced glucose metabolism in temporal lobeepilepsy (Henryet al., 1993a; Savicet al., 1993). Using thehave shown a variety of cerebral metabolic patterns: normal,
focal and diffuse (unilateral and bilateral) hypometabolism novel, objective analytical approach of statistical parametricmapping (SPM) (Fristonet al., 1995) applied to parametric(Chugani et al., 1987; Theodoreet al., 1987b). This
heterogeneity is not surprising, and reflects the diverse images of cerebral [11C]flumazenil binding, coregistered withMRI, it was found, in patients with unilateral HS, thataetiologies of the syndrome. Operative electrocorticography
studies have found epileptic activity in areas shown to be reduction of cBZR was confined to the sclerotic hippocampuswith no significant abnormalities elsewhere (Koeppet al.,hypometabolic on18FDG-PET scans (Olsonet al., 1990).
Continuous spike-wave discharges may be associated with 1996).The underlying pathological basis of reduceda focal increase in glucose metabolism (Parket al., 1994).
In one study of patients with the Landau–Kleffner syndrome, [11C]flumazenil binding in HS is still under study.Autoradiographic and histopathological studies of surgicallythe metabolic pattern was variable, but abnormalities were
most evident over the temporal lobes (Maquetet al., 1990). removed sclerotic hippocampi have shown reduced neuron

360 J. S. Duncan
counts and cBZR densities, with a further reduction of density binding have been reported in patients with frequent seizures,in comparison with those with less frequent seizures (Savicof cBZR per remaining neuron (Johnsonet al., 1992).
Burdetteet al. (1995) found a highly statistically significant et al., 1996). It is not yet clear whether this finding representsthe cause or consequence of epileptic activity.correlation between neuron loss and reduced cBZR binding
on autoradiographic analysis of hippocampi from patients Malformations of cortical development are of heterogenousappearance and may not be detectable with MRI (seeabove).treated surgically for HS, and concluded that neuron loss
was the basis of reduced [11C]flumazenil bindingin vivo. Epilepsy surgery in patients with MCD is less successfulthan in those with discrete lesions, most likely because theThis analysis did not exclude an additional reduction of
cBZR per neuron. Further correlational studies with anatomical and functional abnormality is more widespreadthan a feasible resection. An SPM analysis of cBZR visualizedquantitative in vivo hippocampal [11C]flumazenil binding
have indicated that, in HS, there is additional loss of cBZR with [11C]flumazenil PET and coregistered with high qualityMRI in 12 patients with partial seizures and MCD revealedin the CA1 subregion of the hippocampus, over and above
the loss of neurons (Handet al., 1996). areas of abnormal cerebral cBZR binding in 10. Theseabnormal regions were frequently more extensive than theIt seems most likely that, in addition to any functional
change, cBZR changes reflect localized neuronal and synaptic abnormalities seen with MRI, and they were also noted atdistant sites where the cortex had appeared unremarkable onloss in the epileptogenic zone and that the more extensive
hypometabolism is a result of diaschisis. In clinical terms it MRI (Fig. 8) (Richardsonet al., 1996a). Similar observationshave been made in patients with refractory partial seizuresappears that [11C]flumazenil PET may be superior to18FDG
for the localization of the source of the seizure. It is but unremarkable MRI scans, suggesting the possibility ofoccult MCD (Richardsonet al., 1996c). In contrast to studiesnot certain, however, whether this data confers additional
clinically useful information in patients with clearcut MRI with18FDG, in which reduced metabolism may be theresult of diaschisis, reduced [11C]flumazenil binding impliesfindings of HS.
The use of [11C]flumazenil PET in the clinical investigation neuronal deficits. A further, novel finding of this investigationwas of areas of increased binding to cBZR in many patientsof patients with refractory partial seizures, but who have
unremarkable high quality MRI, is currently under with MCD, which has not been found in patients withepilepsy caused by other pathologies. Possible explanationsinvestigation. In six patients with frontal lobe epilepsy,
reduction in cBZR binding was demonstrated with include increased neuron density, the presence of ectopicneurons bearing cBZR and of an increased number of[11C]flumazenil PET, that was consistent with clinical and
EEG data (Savicet al., 1995). In two out of four patients available receptors, that may reflect abnormal neurons or aresponse to the abnormal circuitry implicit in MCD.who also had18FDG scans, the focus was characterized by
a region of reduced metabolism that was more extensive than Elucidation of the neurobiological basis of these findingsawaits correlative pathological andin vitro receptor studies.the reduction in cBZR. The MRI was unremarkable in five,
implying superior sensitivity of the PET technique over the These findings may also be of clinical importance in theevaluation of patients with MCD for possible surgicalMRI. Comparisons of this nature, however, clearly depend
on the relative sophistication of the instruments and treatment. Further studies need to be done to determinewhether the finding of widespread abnormalities of cBZR ismethodologies used. Greater reductions of [11C]flumazenil
Fig. 8 Statistical parametric map (SPM) of [11C]flumazenil PET scan of a patient with bilateralsubependymal heterotopia whose cortex appeared normal on high resolution MRI. The individualpatient’s PET scan has been compared with a bank of 24 normal subjects on a pixel-by-pixel basis, andthe results mapped onto the patient’s MRI scan. Areas of significantly increased binding tobenzodiazepine receptors are shown in red and areas of significantly reduced binding in blue (figuresupplied by Dr Mark Richardson).

Imaging and epilepsy 361
an adverse prognostic factor for surgical outcome in patients receptors are not affected similarly in unilateral temporallobe epilepsy. The precise explanation of these findings isin whom MRI and other investigatory data implicate a single
restricted focus; such studies will not, however, be easy to not clear. Hypotheses include an upregulation ofµ-receptorsand a reduction in the number or affinity ofκ-receptors, orundertake.
Studies of drug actionin vivo in patients with epilepsy upregulation ofµ-receptors and occupation ofκ-receptors byan endogenous opioid ligand. Further investigations with amay also be carried out using [11C]flumazenil PET. It was
shown that 1.5 mg intravenous flumazenil occupied 55% ofκ-specific opioid PET tracer may clarify this issue.These studies have all been carried out in patients withBZR, whereas 15 mg occupied nearly all receptors (Savic
et al., 1991). temporal lobe epilepsy. No PET investigations of opioidreceptors in vivo have been reported in patients withIn conclusion, [11C]flumazenil PET scan data are good
markers for neuronal integrity in hippocampus and neocortex extratemporal seizure disorders or MCD.and may also identify ectopic neurons in MCD. There aresuggestions that there may also be abnormalities of cBZRMAO-B receptors.Deprenyl binds with high specificity
and affinity to MAO-B receptors, which are mainly locatedavailability on neurons, but definitive correlativein vitrostudies have not yet been completed. The future clinical role on astrocytes. In nine patients with temporal lobe epilepsy,
uptake of [11C]deuterium deprenyl was increased in theof [11C]flumazenil PET is likely to be in the presurgicalevaluation of those patients in whom MRI is not definitive epileptogenic temporal lobe, possibly reflecting gliosis
(Kumlien et al., 1995). This technique does not appear likelyand in those in whom there is evidence of MCD.to contribute to precise localization of an epileptic focuswithin the temporal lobe, but the anatomical discriminationof medial temporal lobe structures was rather limited in thatOpioid receptors.Endogenous opioids are released
following partial and generalized tonic–clonic seizures study. It is possible that higher resolution images may producemore refined findings. The technique has not yet beenand contribute to the postictal rise in seizure threshold
(Bajorek et al., 1986). Investigations of opioid receptors in evaluated in extra-temporal seizure disorders.patients with temporal lobe epilepsy have shown an increasein the binding of the specificµ-agonist [11C]carfentanil to Histamine receptors.An increase of histamine H1
receptors, visualized with PET and [11C]doxepin in epilepticµ-receptors in lateral temporal neocortex, reflecting anincrease in the number of available receptors, or increased foci that also show reduced interictal glucose metabolism,
has been reported (Iinumaet al., 1993; Itohet al., 1995).affinity, in areas which also showed reduced glucosemetabolism (Frostet al., 1988). It has been speculated that It has been suggested that this finding is compatible with an
increase ofµ-opioid receptors. It is not certain, however,an increase inµ-opioid receptors in the temporal neocortexmay be a manifestation of a tonic antiepileptic system that how specific this tracer is for H1 receptors and the results
have not been replicated by other groups.serves to limit the spread of electrical activity from othertemporal lobe structures. In a second study the increase in[11C]carfentanil binding to lateral temporal neocortex wasconfirmed and reduced binding to the amygdala was notedConclusion
Studies with18FDG-PET have defined the major cerebral(Mayberget al., 1991). The finding of reduced signal from astructure may be due, at least in part, to partial volume effects. metabolic associations and consequences of epilepsy but
the data are nonspecific with regard to aetiology, andMethods to correct for this are now being developed andimplemented (Muller-Gartneret al., 1992; Frostet al., 1995). abnormalities are more widespread than the pathological
lesions. The role of18FDG-PET in the clinical evaluation ofThe same patients were also studied with [11C]diprenorphine,which binds with similar affinitiesin vivo to the µ-, κ- patients has been reduced by the advances made in MRI
over the last 5 years. Activation studies with H215O are usefuland δ-subtypes of opioid receptors. There were no overall
asymmetries of binding of [11C]diprenorphine in the temporal for determining the functional anatomy of cerebral processesin both healthy and pathological brains; however, over thelobe or elsewhere (Mayberget al., 1991); this observation
has been confirmed by others (Bartensteinet al., 1994). In next 5 years such studies are likely to become dominated byfMRI techniques.concordance with this, there was no overall asymmetry of
binding of the PET tracer18F-cyclofoxy, which binds toµ- and Investigations with specific ligands can identify theneurochemical abnormalities associated with the epilepsies,κ-opioid receptors, in patients with temporal lobe epilepsy,
although some patients had higher binding of the ligand in both static interictal derangements and dynamic changes inligand–receptor interaction that may occur at the time ofthe temporal lobe ipsilateral to the EEG focus (Theodore
et al., 1992b). seizures. The development of further ligands in the comingyears, particularly tracers that are specific for excitatoryThese data suggest a differential alteration ofµ- and non-
µ-opioid receptors in patients with temporal lobe epilepsy. amino acid receptors, subtypes of the opioid receptors andthe GABAB receptor, are necessary to understand theThe different patterns of [11C]carfentanil, [18F]cyclofoxy and
[11C]diprenorphine binding indicate thatµ- and κ-opioid processes that give rise to, and respond to, the various forms

362 J. S. Duncan
of the epilepsies further. All functional data needs to be limited utility, however, if slices are 8 mm thick and it ismuch more satisfactory to acquire data in the optimum plane.interpreted in the light of the corresponding brain structure.
Coregistration with high quality MRI is now readily As with PET data, coregistration with MRI allows fora structure–function correlation which enhances theachievable and essential. It will also be important to carry out
parallel studies within vitro autoradiography and quantitative interpretation of both individual data sets and the consensusdiagnosis (Woodset al., 1993; Zubalet al., 1995).neuropathological studies on surgical specimens and post-
mortem material.
Interictal SPECT studiesIt has been established for a decade that the marker of an
Single photon emission computerized epileptic focus studied interictally in adults and children withtomography SPECT, is a region of reduced CBF. However, it was soonSingle photon emission computerized tomography (SPECT)noted that the results were not always reliable (Podrekaet al.,may be used to image the distribution of CBF and of specific1987; Stefanet al., 1987b; Denayset al., 1988; Chironet al.,receptors in the brain. 1989; Andersenet al., 1990; Cordeset al., 1990; Duncan
et al., 1990; Iivanainenet al., 1990; Vles et al., 1990;Dietrich et al., 1991; Ryvlinet al., 1992b; Andersenet al.,1994). Focal abnormalities of rCBF have been visualizedCerebral blood flow tracerswith SPECT in patients with infantile spasms (Chironet al.,The currently most commonly used SPECT tracer for imaging1993), Landau–Kleffner syndrome (O’Tuamaet al., 1992),CBF is 99mTc-hexamethylpropylenamine oxime (99mTc-continuous spike waves during slow-wave sleep (GaggeroHMPAO; Ceretec, Amersham, UK). The superiority of thiset al., 1995), tuberous sclerosis (Tamakiet al., 1991) andtracer over radioxenon and iodoamphetamine was noted overLennox–Gastaut syndrome (Heiskalaet al., 1993). It was10 years ago (Longostrevi, 1986). Other CBF tracers innoted in several of the above studies that the sensitivity ofcurrent use include123I-N-isopropyl-p-iodoamphetamine andSPECT imaging appeared to be superior to the MRI available99mTc-ethyl cysteinate dimer (ECD; Neurolite, Du Pont,at the time. Interictal99mTc-HMPAO SPECT imaging hasFrance).recently revealed identical or increased cerebral perfusion99mTc-HMPAO is convenient to use, being givenof laminar heterotopia in comparison with the overlyingintravenously and having 70% brain uptake in 1 min. Theneocortical grey matter (Matsudaet al., 1995).subsequent image is stable for 6 h, as after crossing the
In 99mTc-HMPAO SPECT studies of patients with temporalblood–brain barrier99mTc-HMPAO reacts with intracellularlobe epilepsy a significant asymmetry of CBF has been notedglutathione, becoming hydrophilic, and it is then much lessin ~50% of cases, the range across different studies is 11–able to move back across the blood–brain barrier. A limitation80%. Concordance with interictal EEG lateralization hasof the tracer is that it is chemically unstable 30 min afterbeen noted in 65%. In one large representative series,preparation. This is less of a problem for interictal than ictallocalization (e.g. frontal versus temporal) has been shown tostudies. Derivatives, stabilized with cobalt chloride, with abe more difficult, with correct localization in 38% of caseslonger shelf-life have recently been developed. Radiolabelledin interictal studies of patients with a unilateral temporalECD is stable for 6 h, and so is convenient for the study oflobe EEG focus (Roweet al., 1991a, b). Localizationbrief ictal events (Grunwaldet al., 1994).with interictal SPECT is more difficult in patients withextratemporal epilepsy, widespread hypoperfusion being seenin two out of 12 cases in a recent investigation (Markset al.,1992). Similar results have come from other series (Dasheiff,Hardware
The spatial resolution depends on the imaging equipment 1992). In consequence to this poor sensitivity and specificity,interictal SPECT studies have little place in the routineused, being 14–17 mm (full-width half-maximum) for single-
head rotating γ-cameras, 8–10 mm for three-headed investigation of patients with epilepsy. In a blindedcomparative study, interictal SPECT was less effective ininstruments and 7–8 mm for ring-type cameras. Unlike PET,
the data remains, at best, semiquantitative, with the use of a lateralizing the focus of temporal lobe epilepsy than MRI,with correct lateralization in 45% of cases compared withreference region as an internal standard. The correct
orientation of imaging planes is important, in order to 86% with MRI. Furthermore, agreement of MRI and EEGdata was a good predictor of a satisfactory result fromvisualize the structures optimally. The commonly used orbito-
meatal line is ~40° off the long axis of the temporal lobe. It surgical treatment, whereas SPECT was not and tended togive an incorrect result in patients whose MRI was notfollows that there are inevitable partial volume effects causing
difficulty discriminating between inferior frontal and superior lateralizing (Jacket al., 1994c).Interictal HMPAO SPECT has been shown to have inferiortemporal lobe, with loss of potentially useful localizing
information. If thin slices are acquired, this deficit can, to resolution and reliability for identifying a focal deficitcompared with18FDG-PET in the evaluation of patients withsome extent, be corrected for by reformatting. This is of

Imaging and epilepsy 363
partial seizures (Leidermanet al., 1992; Ryvlin et al., areas of focal cortical dysplasia (Otsuboet al., 1993). A1992a; Coubeset al., 1993; Theodoreet al., 1994; Nagata focal ictal CBF rise has been demonstrated in patients withet al., 1995). MCD and non-localizing ictal scalp EEG, and can be used
to identify surgically resectable epileptic tissue (Kuznieckyet al., 1993c).
Ictal SPECT studies A focal increase in CBF may be seen in epilepsia partialisIt was established over a decade ago that the increase incontinua, even when the EEG does not show focal epilepticCBF associated with a seizure may be detected using SPECTactivity (Katz et al., 1990).(Bonteet al., 1983; Leeet al., 1986). This may provide useful The coregistration of interictal and ictal SPECT images,localizing information in patients with partial seizures. An to result in an ‘ictal difference image’ that may be coregisteredinjection of 99mTc-HMPAO at the time of a seizure results with an inidividual’s MRI enhances the accuracy of datain an image of the distribution of CBF 1–2 min after tracer interpretation (Zubalet al., 1995). Ictal99mTc-HMPAO scans,administration, which is then stable for several hours so thathowever, must be interpreted with caution. Simultaneousthe patient may be imaged when the seizure is over. Thevideo-EEG is essential to determine the relationship betweengeneral pattern is of localized ictal hyperperfusion, withthe onset of a seizure and tracer delivery; without thissurrounding hypoperfusion, that is followed by accentuatedprecaution there is risk of confusing ictal and postictal data.hypoperfusion in the region of the focus, which graduallyA further problem is that spread to other areas of the brain,returns to the interictal state. Combined data from interictalsuch as the contralateral temporal lobe, may occur withinand ictal SPECT scans give a lot more data than interictalseconds of seizure onset and so an image of CBF distributionscans alone and may be useful in the evaluation of both1–2 min after the onset of a seizure may indicate sites othertemporal and extratemporal epilepsy. In complex partialthan that of onset.seizure disorders, the epileptic focus has been identified in Until recently, 99mTc-HMPAO had to be constituted69–93% of ictal SPECT studies (Leeet al., 1988; Shenet al., immediately prior to injection, resulting in a delay of up to1990; Stefanet al., 1990; Roweet al., 1991a; Marks et al., 1 min. A preparation has now been developed which is1992; Duncanet al., 1993a; Harveyet al., 1993a; Markand stabilized with cobalt chloride for at least 6 h. This allowset al., 1994; Crosset al., 1995). In a recent overview of the the labelled tracer to be prepared in advance, and may beextensive experience from the Austin Hospital, ictal SPECTinjected into a patient at any time over the subsequent 6 h,achieved 97% correct localization in unilateral temporal lobewithout the need for further preparatory work. The advantageepilepsy, compared with 71% for postictal SPECT and 48%
of this development is that the interval between seizure onsetfor interictal scans. In extratemporal seizures ictal SPECT
and tracer delivery to the brain can be significantly reduced.studies localized the focus in 92%, compared with 46% for
An alternative is to use ready constituted99mTc-ECD, whichpostictal studies and interictal SPECT was of little value
may be injected within 2–20 s of seizure onset and(Newtonet al., 1995).
demonstrates a focal increase in CBF (Grunwaldet al., 1994)In temporal lobe seizures, the occurrence of contralateralAlthough the technique has been reported as being of usedystonic posturing was associated with an ictal increase in
(Biersacket al., 1988), ictal99mTc-HMPAO studies do notCBF in the basal ganglia ipsilateral to the focus (Newtonreliably differentiate between epileptic and non-epilepticet al., 1992a). A characteristic feature of temporal lobeattacks. Cases of non-epileptic attacks which were notseizures is an initial hyperperfusion of the temporal lobe,associated with a focal increase in CBF have been reported,followed by medial temporal hyperperfusion and lateralbut a focal increase in CBF may occur, particularly if theretemporal hypoperfusion (Fig. 9) (Newtonet al., 1992b).is prominent motor activity.Ictal 99mTc-HMPAO scans may be useful in the evaluation
In patients with temporal lobe epilepsy ictal SPECT dataof patients with extra-temporal seizures who do not have anwas of superior lateralizing ability than was interictal18FDG-identifiable abnormality on MRI. This technique localizedPET, particularly when MRI did not show a structural lesion;the seizure focus in 10 out of 12 such patients in one recenthowever, the investigations had complementary roles whenseries (Markset al., 1992), and in 20 out of 22 in anotherlocalization was difficult (Hoet al., 1995). When compared(Harveyet al., 1993b). In the latter study, asymmetrical tonicagainst EEG data, ictal SPECT and interictal PET had lowerposturing, contralateral head and eye deviation and unilateralsensitivity and higher specificity for extratemporal thanclonic jerking were associated with an ictal increase in CBFtemporal seizures (Spencer, 1994).in the frontocentral, medial frontal or dorsolateral areas.
In conclusion, although interictal SPECT imaging of CBFFocal ictal increases in CBF have also been found inis only moderately sensitive, ictal SPECT markedly improvespatients with parietal lobe epilepsy, both with and withoutthe yield. PET imaging of interictal cerebral glucosedemonstrable parietal lesions, and they correspond with themetabolism is more sensitive than measurement of interictallesions when present (Hoet al., 1994). Extratemporal seizuresCBF in temporal lobe epilepsy. Furthermore, PET has greatermay be very brief, increasing the need for injection of bloodspatial resolution and versatility in that multiple tracers canflow tracer as soon as possible after the start of a seizure.
Postictal SPECT has shown a focal increase in CBF in image various aspects of cerebral function.

364 J. S. Duncan
Fig. 9 Transverse interictal, ictal and postictal HMPAO SPECT scans of a patient with left temporal lobe seizures. The colour scale fromwhite to red to blue indicates a spectrum of high to low counts. Interictally, there is a small region of hypoperfusion in the left mesialtemporal lobe (arrow). The ictal study shows marked left temporal hyperperfusion (large arrow). The 1.5 min postictal scan shows lateraltemporal hypoperfusion (horizontal arrow) with residual mesial hyperperfusion (vertical arrow) on the left. (Reprinted with permission ofthe publisher from Newtonet al., J Neurol Neurosurg Psychiat 1992; 55: 893. © BMJ Publishing Group).
(Bartensteinet al., 1991). Similar results have been reportedCarotid amytal testing and SPECTelsewhere (Cordeset al., 1992; Haldemannet al., 1992;Intravenous HMPAO and SPECT have been used toDuncanet al., 1993b). Studies with higher resolution camerasdemonstrate a unilateral hemispheric reduction of CBF ofand optimal scan orientation, however, have suggested that50–90% following intracarotid injection of sodium amytal tothe area of reduced specific binding of [123I]iomazenil isassess language lateralization and memory function (Biersackmore restricted than the defect of CBF, and is of greateret al., 1987). The distribution of hypoperfusion was variablesensitivity for the localization of an epileptogenic focusbetween patients and did not always involve the medial(Johnsonet al., 1992; Venzet al., 1994; Sjoholmet al.,temporal lobe, and the degree of hypoperfusion correlated1995). Reduced binding of [123I]iomezanil has been found inwith the duration of hemiplegia and of drug-inducedδ-a focal area of MCD, in which reduced CBF was notactivity in the EEG (Coubeset al., 1995). A differentdetectable, implying that the former may have greater sensitiv-approach has been to inject the tracer and the sodium amytality for detecting areas of cortical abnormality (Bartensteintogether into the carotid artery. This has also shown thatet al., 1992). In this case an abnormality was very evidentdistribution of the tracer varied from patient to patient andon MRI, and it appeared to be as extensive as the abnormaldid not always include the medial temporal lobe (JefferyBZR binding.et al., 1991; Hartet al., 1993). Although of interest and
potential importance, it is not yet clear whether suchinvestigations are of clinical benefit.
IododexetimideAnother tracer that may prove to be of clinical utilityis [123I]iododexetimide that labels muscarinic acetylcholineIomazenilreceptors. Reduced binding of this tracer has been found at[123I]Iomazenil is a derivative of the central benzodiaze-epileptic foci; at present it is not certain whether thispine receptor antagonist flumazenil. Early studies withrepresents more than loss of neurons (Muller-Gartneret al.,[123I]iomazenil showed a reduction in binding in the region1993).of the epileptic focus (Van Huffelenet al., 1990; Bartenstein
et al., 1991). In the former, in 16 out of 17 patients,[123I]iomazenil SPECT gave concordant results with ictalEEG recordings.18FDG-PET concurred with ictal EEG in Conclusion
A principle advantage of SPECT over PET is that theall cases. Analysis of the former was by visual assess-ment, whereas the18FDG data were quantified, resulting in former is much less expensive and the equipment is more
widespread. A further advantage is the ability to obtaingreater precision (van-Huffelenet al., 1990). In the latterinvestigation, 10 out of the 12 patients had reduced CBF images representative of CBF at the time of seizures. These
data need careful and cautious interpretation and are non-demonstrable with99mTc-HMPAO and it was suggested that[123I]iomazenil did not confer additional benefits quantitative. If further SPECT tracers that probe the integrity

Imaging and epilepsy 365
comments]. AJR Am J Roentgenol 1994; 162: 1185–9. Commentof specific receptors and neurotransmitters are developed, thein: AJR Am J Roentgenol 1995; 164: 1304.technique may have further applications in the future in the
investigation and management of epilepsy. Barkovich AJ, Guerrini R, Battaglia G, Kalifa G, N9Guyen T,Parmeggiani A, et al. Band heterotopia: correlation of outcome withmagnetic resonance imaging parameters. Ann Neurol 1994; 36:609–17.Acknowledgements
I wish to thank the many colleagues who have contributedBarkovich AJ, Rowley HA, Andermann F. MR in partial epilepsy:to this work and Anastacia Kirk for invaluable assistancevalue of high-resolution volumetric techniques. AJNR Am J Neuro-with the preparation of this manuscript, also the Medicalradiol 1995; 16: 339–43.Research Council, Action Research, the Wellcome Trust
Bartenstein P, Ludolph A, Schober O, Lottes G, Scheidhauer K,and the National Society for Epilepsy for supporting my
Sciuk J, et al. Benzodiazepine receptors and cerebral blood flow inresearches in this area. partial epilepsy. Eur J Nucl Med 1991; 18: 111–8.
Bartenstein P, Lehmenkuhler C, Sciuk J, Schuierer G. Corticaldysplasia as an epileptogenic focus: reduced binding of 123I-Referencesiomezanil with barely perceptible 99mTc-HMPAO SPECT.
Abou-Khalil BW, Siegel GJ, Sackellares JC, Gilman S, Hichwa R,[German]. Nuklearmedizin 1992; 31: 142–4.
Marshall R. Positron emission tomography studies of cerebralglucose metabolism in chronic partial epilepsy. Ann Neurol 1987;Bartenstein PA, Duncan JS, Prevett MC, Cunningham VJ, Fish DR,22: 480–6. Jones AK, et al. Investigation of the opioid system in absence
seizures with positron emission tomography. J Neurol NeurosurgAdam C, Baulac M, Saint-Hilaire JM, Landau J, Granat O, LaplanePsychiatry 1993; 56: 1295–302.D. Value of magnetic resonance imaging-based measurements of
hippocampal formations in patients with partial epilepsy. Arch Bartenstein PA, Prevett MC, Duncan JS, Hajek M, Wieser HG.Neurol 1994; 51: 130–8. Quantification of opiate receptors in two patients with mesiobasal
temporal lobe epilepsy, before and after selective amygdalohippo-Andersen AR, Waldemar G, Dam M, Fuglsang-Frederiksen A,campectomy, using positron emission tomography. Epilepsy ResHerning M, Kruse-Larsen C. SPECT in the presurgical evaluation1994; 18: 119–25.of patients with temporal lobe epilepsy—a preliminary report. Acta
Neurochir Suppl (Wien) 1990; 50: 80–3. Bastos AC, Korah IP, Cendes F, Melanson D, Tampieri D, PetersT, et al. Curvilinear reconstruction of 3D magnetic resonanceAndersen AR, a Rogvi-Hansen B, Dam M. Utility of interictalimaging in patients with partial epilepsy: a pilot study. Magn ResonSPECT of rCBF for focal diagnosis of the epileptogenic zone(s).Imaging 1995; 13: 1107–12.Acta Neurol Scand Suppl 1994; suppl 152: 129–34.Baulac M, Saint-Hilaire JM, Adam C, Martinez M, Fontaine S,Ashtari M, Barr WB, Schaul N, Bogerts B. Three-dimensional fastLaplane D. Correlations between magnetic resonance imaging-basedlow-angle shot imaging and computerized volume measurement ofhippocampal sclerosis and depth electrode investigation in epilepsythe hippocampus in patients with chronic epilepsy of the temporalof the mesiotemporal lobe. Epilepsia 1994; 35: 1045–53.lobe [see comments]. AJNR Am J Neuroradiol 1991; 12: 941–7.
Comment in: AJNR Am J Neuroradiol 1991; 12: 948. Bergen D, Bleck T, Ramsey R, Clasen R, Ristanovic R, Smith M,et al. Magnetic resonance imaging as a sensitive and specificAubry P, Bequet D, Queguiner P. La cysticercose: une maladiepredictor of neoplasms removed for intractable epilepsy. Epilepsiaparasitaire frequente et redoutable. Med Trop (Mars) 1995; 55:1989; 30: 318–21.79–87.Bergin PS, Fish DR, Shorvon SD, Oatridge A, de Souza NM,Awad IA, Katz A, Hahn JF, Kong AK, Ahl J, Luders H. Extent ofBydder GM. Magnetic resonance imaging in partial epilepsy:resection in temporal lobectomy for epilepsy. I. Interobserveradditional abnormalities shown with the fluid attenuated inversionanalysis and correlation with seizure outcome. Epilepsia 1989; 30:recovery (FLAIR) pulse sequence. J Neurol Neurosurg Psychiatry756–62.1995; 58: 439–43.
Babb TL, Brown WJ. Pathological findings in epilepsy. In: Engel JBerkovic SF, Andermann F, Melanson D, Ethier RE, Feindel W,Jr, editor. Surgical treatment of the epilepsies. New York: RavenGloor P. Hypothalamic hamartomas and ictal laughter: evolution ofPress, 1987: 511–40.a characteristic epileptic syndrome and diagnostic value of magneticresonance imaging. Ann Neurol 1988; 23: 429–39.Bairamian D, Di Chiro G, Theodore WH, Holmes MD, Dorwart
RH, Larson SM. MR imaging and positron emission tomographyBerkovic SF, Andermann F, Olivier A, Ethier R, Melanson D,of cortical heterotopia. J Comput Assist Tomogr 1985; 9: 1137–9.Robitaille Y, et al. Hippocampal sclerosis in temporal lobe epilepsydemonstrated by magnetic resonance imaging. Ann Neurol 1991;Bajorek JG, Lee RJ, Lomax P. Neuropeptides: anticonvulsant and
convulsant mechanisms in epileptic model systems and in humans. 29: 175–82.[Review]. Adv Neurol 1986; 44: 489–500.
Berkovic SF, McIntosh AM, Kalnins RM, Jackson GD, FabinyiGC, Brazenor GA, et al. Preoperative MRI predicts outcome ofBaldwin GN, Tsuruda JS, Maravilla KR, Hamill GS, Hayes CE.
The fornix in patients with seizures caused by unilateral hippocampal temporal lobectomy: an actuarial analysis [see comments]. Neuro-logy 1995; 45: 1358–63. Comment in: Neurology 1995; 45: 1248–50.sclerosis: detection of unilateral volume loss on MR images [see
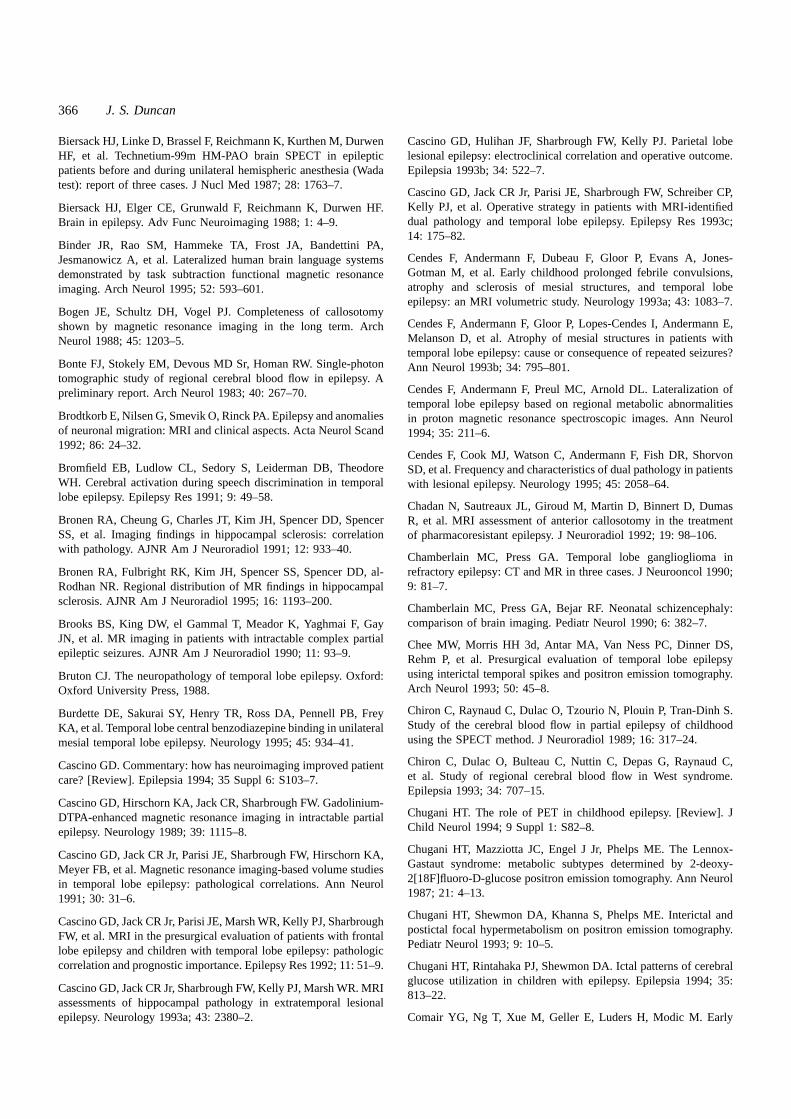
366 J. S. Duncan
Biersack HJ, Linke D, Brassel F, Reichmann K, Kurthen M, Durwen Cascino GD, Hulihan JF, Sharbrough FW, Kelly PJ. Parietal lobelesional epilepsy: electroclinical correlation and operative outcome.HF, et al. Technetium-99m HM-PAO brain SPECT in epileptic
patients before and during unilateral hemispheric anesthesia (Wada Epilepsia 1993b; 34: 522–7.test): report of three cases. J Nucl Med 1987; 28: 1763–7.
Cascino GD, Jack CR Jr, Parisi JE, Sharbrough FW, Schreiber CP,Kelly PJ, et al. Operative strategy in patients with MRI-identifiedBiersack HJ, Elger CE, Grunwald F, Reichmann K, Durwen HF.dual pathology and temporal lobe epilepsy. Epilepsy Res 1993c;Brain in epilepsy. Adv Func Neuroimaging 1988; 1: 4–9.14: 175–82.
Binder JR, Rao SM, Hammeke TA, Frost JA, Bandettini PA,Cendes F, Andermann F, Dubeau F, Gloor P, Evans A, Jones-Jesmanowicz A, et al. Lateralized human brain language systemsGotman M, et al. Early childhood prolonged febrile convulsions,demonstrated by task subtraction functional magnetic resonanceatrophy and sclerosis of mesial structures, and temporal lobeimaging. Arch Neurol 1995; 52: 593–601.epilepsy: an MRI volumetric study. Neurology 1993a; 43: 1083–7.
Bogen JE, Schultz DH, Vogel PJ. Completeness of callosotomyCendes F, Andermann F, Gloor P, Lopes-Cendes I, Andermann E,shown by magnetic resonance imaging in the long term. ArchMelanson D, et al. Atrophy of mesial structures in patients withNeurol 1988; 45: 1203–5.temporal lobe epilepsy: cause or consequence of repeated seizures?
Bonte FJ, Stokely EM, Devous MD Sr, Homan RW. Single-photonAnn Neurol 1993b; 34: 795–801.tomographic study of regional cerebral blood flow in epilepsy. A
Cendes F, Andermann F, Preul MC, Arnold DL. Lateralization ofpreliminary report. Arch Neurol 1983; 40: 267–70.temporal lobe epilepsy based on regional metabolic abnormalities
Brodtkorb E, Nilsen G, Smevik O, Rinck PA. Epilepsy and anomaliesin proton magnetic resonance spectroscopic images. Ann Neurolof neuronal migration: MRI and clinical aspects. Acta Neurol Scand1994; 35: 211–6.1992; 86: 24–32.
Cendes F, Cook MJ, Watson C, Andermann F, Fish DR, ShorvonBromfield EB, Ludlow CL, Sedory S, Leiderman DB, Theodore SD, et al. Frequency and characteristics of dual pathology in patientsWH. Cerebral activation during speech discrimination in temporalwith lesional epilepsy. Neurology 1995; 45: 2058–64.lobe epilepsy. Epilepsy Res 1991; 9: 49–58.
Chadan N, Sautreaux JL, Giroud M, Martin D, Binnert D, DumasBronen RA, Cheung G, Charles JT, Kim JH, Spencer DD, SpencerR, et al. MRI assessment of anterior callosotomy in the treatmentSS, et al. Imaging findings in hippocampal sclerosis: correlationof pharmacoresistant epilepsy. J Neuroradiol 1992; 19: 98–106.with pathology. AJNR Am J Neuroradiol 1991; 12: 933–40.
Chamberlain MC, Press GA. Temporal lobe ganglioglioma inrefractory epilepsy: CT and MR in three cases. J Neurooncol 1990;Bronen RA, Fulbright RK, Kim JH, Spencer SS, Spencer DD, al-9: 81–7.Rodhan NR. Regional distribution of MR findings in hippocampal
sclerosis. AJNR Am J Neuroradiol 1995; 16: 1193–200.Chamberlain MC, Press GA, Bejar RF. Neonatal schizencephaly:comparison of brain imaging. Pediatr Neurol 1990; 6: 382–7.Brooks BS, King DW, el Gammal T, Meador K, Yaghmai F, Gay
JN, et al. MR imaging in patients with intractable complex partial Chee MW, Morris HH 3d, Antar MA, Van Ness PC, Dinner DS,epileptic seizures. AJNR Am J Neuroradiol 1990; 11: 93–9. Rehm P, et al. Presurgical evaluation of temporal lobe epilepsy
using interictal temporal spikes and positron emission tomography.Bruton CJ. The neuropathology of temporal lobe epilepsy. Oxford:Arch Neurol 1993; 50: 45–8.Oxford University Press, 1988.
Chiron C, Raynaud C, Dulac O, Tzourio N, Plouin P, Tran-Dinh S.Burdette DE, Sakurai SY, Henry TR, Ross DA, Pennell PB, FreyStudy of the cerebral blood flow in partial epilepsy of childhoodKA, et al. Temporal lobe central benzodiazepine binding in unilateralusing the SPECT method. J Neuroradiol 1989; 16: 317–24.mesial temporal lobe epilepsy. Neurology 1995; 45: 934–41.
Chiron C, Dulac O, Bulteau C, Nuttin C, Depas G, Raynaud C,Cascino GD. Commentary: how has neuroimaging improved patientet al. Study of regional cerebral blood flow in West syndrome.care? [Review]. Epilepsia 1994; 35 Suppl 6: S103–7.Epilepsia 1993; 34: 707–15.
Cascino GD, Hirschorn KA, Jack CR, Sharbrough FW. Gadolinium-Chugani HT. The role of PET in childhood epilepsy. [Review]. JDTPA-enhanced magnetic resonance imaging in intractable partialChild Neurol 1994; 9 Suppl 1: S82–8.epilepsy. Neurology 1989; 39: 1115–8.
Chugani HT, Mazziotta JC, Engel J Jr, Phelps ME. The Lennox-Cascino GD, Jack CR Jr, Parisi JE, Sharbrough FW, Hirschorn KA,Gastaut syndrome: metabolic subtypes determined by 2-deoxy-Meyer FB, et al. Magnetic resonance imaging-based volume studies2[18F]fluoro-D-glucose positron emission tomography. Ann Neurolin temporal lobe epilepsy: pathological correlations. Ann Neurol1987; 21: 4–13.1991; 30: 31–6.Chugani HT, Shewmon DA, Khanna S, Phelps ME. Interictal andCascino GD, Jack CR Jr, Parisi JE, Marsh WR, Kelly PJ, Sharbroughpostictal focal hypermetabolism on positron emission tomography.FW, et al. MRI in the presurgical evaluation of patients with frontalPediatr Neurol 1993; 9: 10–5.lobe epilepsy and children with temporal lobe epilepsy: pathologic
correlation and prognostic importance. Epilepsy Res 1992; 11: 51–9.Chugani HT, Rintahaka PJ, Shewmon DA. Ictal patterns of cerebralglucose utilization in children with epilepsy. Epilepsia 1994; 35:
Cascino GD, Jack CR Jr, Sharbrough FW, Kelly PJ, Marsh WR. MRI813–22.
assessments of hippocampal pathology in extratemporal lesionalepilepsy. Neurology 1993a; 43: 2380–2. Comair YG, Ng T, Xue M, Geller E, Luders H, Modic M. Early

Imaging and epilepsy 367
post-ictal lactate detection in temporal lobe epilepsy for localization evaluation of patients for epilepsy surgery. [Review]. Seizure 1992;1: 117–25.of seizure focus: a chemical shift imaging study. Society of magnetic
resonance in medicine, 13th Annual Scientific Meeting, Book ofDenays R, Rubinstein M, Ham H, Piepsz A, Noel P. Single photon
Abstracts. 1994: 401.emission computed tomography in seizure disorders. Arch Dis Child1988; 63: 1184–8.Connelly A, Duncan JS. Magnetic resonance spectroscopy in
epilepsy. In: Pedley TA, Meldrum BS, editors. Recent advances inDesbiens R, Berkovic SF, Dubeau F, Andermann F, Laxer KD,
epilepsy, Vol. 6. Edinburgh: Churchill Livingstone, 1995: 23–40.Harvey S, et al. Life-threatening focal status epilepticus due tooccult cortical dysplasia. Arch Neurol 1993; 50: 695–700.Connelly A, Jackson GD, Duncan JS, King MD, Gadian DG.
Magnetic resonance spectroscopy in temporal lobe epilepsy. Neuro-Desmond JE, Sum JM, Wagner AD, Demb JB, Shear PK, Gloverlogy 1994; 44: 1411–7. GH, et al. Functional MRI measurement of language lateralization
in Wada-tested patients. Brain 1995; 118: 1411–9.Convers P, Bierme T, Ryvlin P, Revol M, Fischer C, Froment JC,et al. Contribution of magnetic resonance imaging in 100 cases ofDetre JA, Sirven JI, Alsop DC, O’Connor MJ, French JA. Localiz-refractory partial epilepsy with normal CT scans. [Review] [French].ation of subclinical ictal activity by functional magnetic resonanceRev Neurol (Paris) 1990; 146: 330–7. imaging: correlation with invasive monitoring. Ann Neurol 1995;
38: 618–24.Cook MJ, Manford M, Gadian DG, Connelly A, Shorvon SD, FishD. Proton magnetic resonance spectroscopy in supplementary motorDe Volder AG, Gadisseux JF, Michel CJ, Maloteaux JM, Bol AC,area seizures [abstract]. Epilepsia 1991; 32 Suppl 3: 78. Grandin CB, et al. Brain glucose utilization in band heterotopia:
synaptic activity of ‘double cortex’. Pediatr Neurol 1994; 11: 290–4.Cook MJ, Fish DR, Shorvon SD, Straughan K, Stevens JM.Hippocampal volumetric and morphometric studies in frontal andDietrich ME, Bergen D, Smith MC, Fariello R, Ali A. Correlationtemporal lobe epilepsy. Brain 1992; 115: 1001–15. of abnormalities of interictal n-isopropyl-p-iodoamphetamine single-
photon emission tomography with focus of seizure onset in complexCordes M, Christe W, Henkes H, Delavier U, Eichstadt H, Schornerpartial seizure disorders. Epilepsia 1991; 32: 187–94.W, et al. Focal epilepsies: HMPAO SPECT compared with CT, MR,
and EEG. J Comput Assist Tomogr 1990; 14: 402–9. Dowd CF, Dillon WP, Barbaro NM, Laxer KD. Magnetic resonanceimaging of intractable complex partial seizures: pathologic and
Cordes M, Henkes H, Ferstl F, Schmitz B, Hierholzer J, Schmidtelectroencephalographic correlation. Epilepsia 1991; 32: 454–9.
D, et al. Evaluation of focal epilepsy: a SPECT scanning comparisonof 123-I-iomazenil versus HMPAO. AJNR Am J Neuroradiol 1992; Duncan R, Patterson J, Hadley DM, Macpherson P, Brodie MJ,13: 249–53. Bone I, et al. CT, MR and SPECT imaging in temporal lobe epilepsy
[see comments]. J Neurol Neurosurg Psychiatry 1990; 53: 11–5.Coubes P, Awad IA, Antar M, Magdinec M, Sufka B. Comparison Comment in: J Neurol Neurosurg Psychiatry 1991; 54: 1030.and spacial correlation of interictal HMPAO-SPECT and FDG-PET
Duncan R, Patterson J, Roberts R, Hadley DM, Bone I. Ictal/postictalin intractable temporal lobe epilepsy. Neurol Res 1993; 15: 160–8.SPECT in the pre-surgical localisation of complex partial seizures.
Coubes P, Baldy-Moulinier M, Zanca M, Boire JY, Child R, J Neurol Neurosurg Psychiatry 1993a; 56: 141–8.Bourbotte G, et al. Monitoring sodium methohexital distribution with
Duncan S, Gillen GJ, Brodie MJ. Lack of effect of concomitant[99mTc]HMPAO with single photon emission computed tomographyclobazam on interictal 123I-iomazenil SPECT. Epilepsy Res 1993b;during Wada test. Epilepsia 1995; 36: 1041–9.15: 61–6.
Cross JH, Jackson GD, Neville BG, Connelly A, Kirkham FJ, BoydDuncan JS, Bartlett P, Barker GJ. Measurement of hippocampal T2SG, et al. Early detection of abnormalities in partial epilepsy usingrelaxation time – development and implementation of new tech-magnetic resonance. Arch Dis Child 1993; 69: 104–9.niques. AJNR Am J Neuroradiol 1996a; 17: 1805–10.
Cross JH, Gordon I, Jackson GD, Boyd SG, Todd-Pokropek A,Duncan JS, Koepp MJ, Richardson MP, Cunningham VJ, Brooks DJ.Anderson PJ, et al. Children with intractable focal epilepsy: ictalIncreased central benzodiazepine-GABAA receptors in idiopathicand interictal 99TcM HMPAO single photon emission computedgeneralized epilepsy [abstract]. Epilepsia 1996b; 37 Suppl 5: 43.tomography. Dev Med Child Neurol 1995; 37: 673–81.
Duvernoy HM.The human hippocampus. Munchen: Bergmann,Cross JH, Connelly A, Jackson GD, Johnson CL, Neville BGR,1988.Gadian DG. Proton magnetic resonance spectroscopy in children
with temporal lobe epilepsy. Ann Neurol 1996; 39: 107–13. Elster AD, Mirza W. MR imaging in chronic partial epilepsy: roleof contrast enhancement. AJNR Am J Neuroradiol 1991; 12: 165–70.Curatolo P, Cusmai R. Magnetic resonance imaging in Bourneville’s
disease: relation to the EEG. [French]. Neurophysiol Clin 1988; 18:Engel J Jr, Kuhl DE, Phelps ME, Crandall PH. Comparative459–67. localization of epileptic foci in partial epilepsy by PCT and EEG.
Ann Neurol 1982a; 12: 529–37.Cusmai R, Chiron C, Curatolo P, Dulac O, Tran-Dinh S. Topographiccomparative study of magnetic resonance imaging and electroen-Engel J Jr, Brown WJ, Kuhl DE, Phelps ME, Mazziotta JC,cephalography in 34 children with tuberous sclerosis. EpilepsiaCrandall PH. Pathological findings underlying focal temporal lobe1990; 31: 747–55. hypometabolism in partial epilepsy. Ann Neurol 1982b; 12: 518–28.
Engel J Jr, Kuhl DE, Phelps ME, Mazziotta JC. Interictal cerebralDasheiff RM. A review of interictal cerebral blood flow in the

368 J. S. Duncan
glucose metabolism in partial epilepsy and its relation to EEG tomography are increased in temporal lobe epilepsy. Ann Neurol1988; 23: 231–7.changes. Ann Neurol 1982c; 12: 510–7.
Frost JJ, Meltzer CC, Zubieta JK, Links JM, Brakeman P, StumpfEngel J Jr, Kuhl DE, Phelps ME, Rausch R, Nuwer M. LocalMJ. MR-based correction of brain PET measurements for heterogen-cerebral metabolism during partial seizures. Neurology 1983; 33:eous gray matter radioactivity distribution [abstract]. Neuroimage400–13.1995; 2: S32.
Engel J Jr, Lubens P, Kuhl DE, Phelps ME. Local cerebral metabolicFujikawa Y, Kubota H, Matsuda K, Fujiwara T, Yagi K, Seino M.rate for glucose during petit mal absences. Ann Neurol 1985; 17:Reversal of MRI lesion with relapse and remission of partial motor121–8.seizures in epilepsia partialis continua. Jpn J Psychiatry Neurol
Engel J Jr, Henry TR, Risinger MW, Mazziotta JC, Sutherling WW, 1991; 45: 410–2.Levesque MF, et al. Presurgical evaluation for partial epilepsy:
Furune S, Negoro T, Maehara M, Nomura K, Miura K, Takahashirelative contributions of chronic depth-electrode recordings versusI, et al. Magnetic resonance imaging in complex partial seizures.FDG-PET and scalp-sphenoidal ictal EEG. Neurology 1990; 40:Jpn J Psychiatry Neurol 1989; 43: 361–7.1670–7.
Gadian DG, Connelly A, Duncan JS, Cross JH, Kirkham FJ, JohnsonEngel J Jr, Henry TR, Swartz BE. Positron emission tomographyCL, et al. 1 Magnetic resonance spectroscopy in the investigationin frontal lobe epilepsy. Adv Neurol 1995; 66: 223–238.of intractable epilepsy. Acta Neurol Scand 1994; 89 Suppl. 152:
Falconer J, Wada JA, Martin W, Li D. PET, CT, and MRI imaging 116–21.of neuronal migration anomalies in epileptic patients. Can J Neurol
Gaggero R, Caputo M, Fiorio P, Pessagno A, Baglietto MG, MuttiniSci 1990; 17: 35–9.P, et al. SPECT and epilepsy with continuous spike waves during
Fazekas F, Kapeller P, Schmidt R, Stollberger R, Varosanec S,slow-wave sleep. Childs Nerv Syst 1995; 11: 154–60.Offenbacher H, et al. Magnetic resonance imaging and spectroscopy
Gaillard WD, Bhatia S, Bookheimer SY, Fazilat S, Sato S, Theodorefindings after focal status epilepticus. Epilepsia 1995; 36: 946–9.WH. FDG-PET and volumetric MRI in the evaluation of patients
Fish DR, Spencer SS. Clinical correlations: MRI and EEG. Magnwith partial epilepsy. Neurology 1995a; 45: 123–6.Reson Imaging 1995; 13: 1113–7.
Gaillard WD, White S, Malow B, Flamini R, Weinstein S, Sato S,Fish DR, Brooks DJ, Young IR, Bydder GM. Use of magnetic et al. FDG-PET in children and adolescents with partial seizures:resonance imaging to identify changes in cerebral blood flow inrole in epilepsy surgery evaluation. Epilepsy Res 1995b; 20: 77–84.epilepsia partialis continua. Magn Reson Med 1988; 8: 238–40.
Garcia PA, Laxer KD, van der Grond J, Hugg JW, Matson GB,Franceschi M, Triulzi F, Ferini-Strambi L, Giusti MC, Minicucci F, Weiner MW. 1 magnetic resonance spectroscopic imaging in patientsFazio F, et al. Focal cerebral lesions found by magnetic resonancewith frontal lobe epilepsy [abstract]. Epilepsia 1993; 34 Suppl 6: 122.imaging in cryptogenic nonrefractory temporal lobe epilepsy
Garcia PA, Laxer KD, Barbaro NM, Dillon WP. Prognostic valuepatients. Epilepsia 1989; 30: 540–6.of qualitative magnetic resonance imaging hippocampal abnormalit-
Franceschi M, Lucignani G, Del Sole A, Grana C, Bressi S,ies in patients undergoing temporal lobectomy for medically refract-Minicucci F, et al. Increased interictal cerebral glucose metabolism inory seizures. Epilepsia 1994a; 35: 520–4.a cortical-subcortical network in drug naive patients with cryptogenic
Garcia PA, Laxer KD, van der Grond J, Hugg JW, Matson GB,temporal lobe epilepsy. J Neurol Neurosurg Psychiatry 1995; 59:Weiner MW. Phosphorus magnetic resonance spectroscopic imaging427–31.in patients with frontal lobe epilepsy. Ann Neurol 1994b; 35: 217–21.
Franck G, Sadzot B, Salmon E, Depresseux JC, Grisar T, PetersGrattan-Smith JD, Harvey AS, Desmond PM, Chow CW. Hippocam-JM, et al. Regional cerebral blood flow and metabolic rates inpal sclerosis in children with intractable temporal lobe epilepsy:human focal epilepsy and status epilepticus. Adv Neurol 1986; 44:detection with MR imaging. AJR Am J Roentgenol 1993; 161:935–948.1045–8.
Free SL, Bergin PS, Fish DR, Cook MJ, Shorvon SD, Stevens JM.Gruetter R, Novotny EJ, Boulware SD, Rothman DL, MasonMethods for normalization of hippocampal volumes measured withGF, Shulman GI, et al. Direct measurements of brain glucoseMR. AJNR Am J Neuroradiol 1995; 16: 637–43.concentrations in humans by13C NMR spectroscopy [published
Frey HH, Voits M. Effect of psychotropic agents on a model of erratum appears in Proc Natl Acad Sci USA 1992; 89: 12208]. Procabsence epilepsy in rats. Neuropharmacology 1991; 30: 651–6. Natl Acad Sci USA 1992; 89: 1109–12.
Friston KJ, Holmes AP, Worsley KJ, Poline JP, Frith CD, FrackowiakGrunewald RA, Jackson GD, Connelly A, Duncan JS. MRI detectionRSJ. Statistical parametric maps in functional imaging: a generalof hippocampal disease in epilepsy: factors influencing T2 relaxationlinear approach. Hum Brain Map 1995; 2: 189–210. time. AJNR Am J Neuroradiol 1994; 15: 1149–56.
Froment JC, Mauguiere F, Fischer C, Revol M, Bierme T, ConversGrunwald F, Menzel C, Pavics L, Bauer J, Hufnagel A, ReichmannP. Magnetic resonance imaging in refractory focal epilepsy withK, et al. Ictal and interictal brain SPECT imaging in epilepsy usingnormal CT scans. J Neuroradiol 1989; 16: 285–91. technetium-99m-ECD. J Nucl Med 1994; 35: 1896–901.
Guerrini R, Dravet C, Raybaud C, Roger J, Bureau M, BattagliaFrost JJ, Mayberg HS, Fisher RS, Douglass KH, Dannals RF, LinksJM, et al. Mu-opiate receptors measured by positron emission A, et al. Epilepsy and focal gyral anomalies detected by MRI:

Imaging and epilepsy 369
electroclinico-morphological correlations and follow-up. Dev Med correctable temporal lobe epilepsy. AJNR Am J Neuroradiol 1994;15: 1341–8.Child Neurol 1992; 34: 706–18.
Heiskala H, Launes J, Pihko H, Nikkinen P, Santavuori P. BrainGulati P, Jena A, Tripathi RP, Gupta AK. Magnetic resonanceperfusion SPECT in children with frequent fits. Brain Dev 1993;imaging in childhood epilepsy. Indian Pediatr 1991; 28: 761–5.15: 214–8.
Hajek M, Antonini A, Leenders KL, Wieser HG. Epilepsia partialisHelpern JA, Huang N. Diffusion-weighted imaging in epilepsy.continua studied by PET. Epilepsy Res 1991; 9: 44–8.Magn Reson Imaging 1995; 13: 1227–31.
Hajek M, Antonini A, Leenders KL, Wieser HG. Mesiobasal versusHenry TR, Sutherling WW, Engel J Jr, Risinger MW, Levesquelateral temporal lobe epilepsy: metabolic differences in the temporalMF, Mazziotta JC, et al. Interictal cerebral metabolism in partiallobe shown by interictal 18F-FDG positron emission tomographyepilepsies of neocortical origin. Epilepsy Res 1991; 10: 174–82.[see comments]. Neurology 1993; 43: 79–86. Comment in: Neuro-
logy 1993; 43: 2156. Henry TR, Frey KA, Sackellares JC, Gilman S, Koeppe RA,Brunberg JA, et al. In vivo cerebral metabolism and centralHajek M, Wieser HG, Khan N, Antonini A, Schrott PR, Maguirebenzodiazepine-receptor binding in temporal lobe epilepsy. Neuro-P, et al. Preoperative and postoperative glucose consumption inlogy 1993a; 43: 1998–2006.mesiobasal and lateral temporal lobe epilepsy. Neurology 1994; 44:
2125–32. Henry TR, Mazziotta JC, Engel J Jr. Interictal metabolic anatomyof mesial temporal lobe epilepsy. Arch Neurol 1993b; 50: 582–9.Haldemann RC, Bicik I, Pfeiffer A, Wieser HG, Hasler PH,
Schubiger P, et al. 123I-iomazenil: a quantitative study of the centralHenry TR, Drury I, Brunberg JA, Pennell PB, McKeever PE,benzodiazepine receptor distribution. Nuklearmedizin 1992; 31:Beydoun A. Focal cerebral magnetic resonance changes associated91–7. with partial status epilepticus. Epilepsia 1994a; 35: 35–41.
Hammeke TA, Yetkin FZ, Mueller WM, Morris GL, Haughton Henry TR, Babb TL, Engel J Jr, Mazziotta JC, Phelps ME, CrandallVM, Rao SM, et al. Functional magnetic resonance imaging ofPH. Hippocampal neuronal loss and regional hypometabolism insomatosensory stimulation. Neurosurgery 1994; 35: 677–81. temporal lobe epilepsy. Ann Neurol 1994b; 36: 925–7.
Hand K, Bowery NG, Baird V, Van Paesschen W, Revesz T, HarknessHermann BP, Wyler AR, Somes G, Berry AD 3d, Dohan FC Jr.W, Duncan JS. Central benzodiazepine receptor autoradiography inPathological status of the mesial temporal lobe predicts memoryresected human epileptic temporal lobe [abstract]. Epilepsia 1996;outcome from left anterior temporal lobectomy. Neurosurgery 1992;37 Suppl 5: 43. 31: 652-6.
Hanefeld F, Kruse B, Holzbach U, Christen HJ, Merboldt KD, Hetherington H, Kuzniecky R, Pan J, Mason G, Morawetz R, HarrisHanicke W, et al. Hemimegalencephaly: localized proton magneticC, et al. Proton nuclear magnetic resonance spectroscopic imagingresonance spectroscopy in vivo. Epilepsia 1995; 36: 1215–24. of human temporal lobe epilepsy at 4.1 T. Ann Neurol 1995; 38:
396–404.Hart J Jr, Lewis PJ, Lesser RP, Fisher RS, Monsein LH, SchwerdtP, et al. Anatomic correlates of memory from intracarotid amobarbitalHo SS, Berkovic SF, Newton MR, Austin MC, McKay WJ, Bladininjections with technetium Tc 99m hexamethylpropyleneaminePF. Parietal lobe epilepsy: clinical features and seizure localizationoxime SPECT [see comments]. Arch Neurol 1993; 50: 745–50.by ictal SPECT. Neurology 1994; 44: 2277–84.Comment in: Arch Neurol 1994; 51: 749.
Ho SS, Berkovic SF, Berlangieri SU, Newton MR, Egan GF,Harvey AS, Bowe JM, Hopkins IJ, Shield LK, Cook DJ, Berkovic Tochon-Danguy HJ, et al. Comparison of ictal SPECT and interictalSF. Ictal 99mTc-HMPAO single photon emission computed tomo-PET in the presurgical evaluation of temporal lobe epilepsy. Anngraphy in children with temporal lobe epilepsy. Epilepsia 1993a;Neurol 1995; 37: 738–45.34: 869–77.
Hojo M, Miyamoto S, Nakahara I, Kikuchi H, Ishikawa M, TakiHarvey AS, Hopkins IJ, Bowe JM, Cook DJ, Shield LK, Berkovic SF. W, et al. A case of arteriovenous malformation successfully treatedFrontal lobe epilepsy: clinical seizure characteristics and localizationwith functional mapping of the language area by PET activationwith ictal 99mTc-HMPAO SPECT. Neurology 1993b; 43: 1966–80. study. [Japanese]. No Shinkei Geka 1995; 23: 537–41.
Hayes CE, Tsuruda JS, Mathis CM. Temporal lobes: surface MRHorowitz SW, Merchut M, Fine M, Azar-Kia B. Complex partialcoil phased-array imaging. Radiology 1993; 189: 918–20. seizure-induced transient MR enhancement. J Comput Assist Tomogr
1992; 16: 814–6.Heinz ER, Heinz TR, Radtke R, Darwin R, Drayer BP, Fram E,et al. Efficacy of MR vs CT in epilepsy [see comments]. AJR Am J Hugg JW, Laxer KD, Matson GB, Maudsley AA, Husted CA,Roentgenol 1989; 152: 347–52. Comment in: AJR Am J RoentgenolWeiner MW. Lateralization of human focal epilepsy by 31P magnetic1989; 153: 653. resonance spectroscopic imaging. Neurology 1992; 42: 2011–8.
Heinz ER, Crain BJ, Radtke RA, Burger PC, Friedman AH, DjangHugg JW, Laxer KD, Matson GB, Maudsley AA, Weiner MW.WT, et al. MR imaging in patients with temporal lobe seizures: Neuron loss localizes human temporal lobe epilepsy by in-vivocorrelation of results with pathologic findings. AJNR Am J Neurora- proton magnetic resonance spectroscopic imaging. Ann Neuroldiol 1990; 11: 827–32. 1993; 34: 788–94.
Huttenlocher PR, Taravath S, Mojtahedi S. Periventricular heteroto-Heinz R, Ferris N, Lee EK, Radtke R, Crain B, Hoffman JM, et al.MR and positron emission tomography in the diagnosis of surgically pia and epilepsy. Neurology 1994; 44: 51–5.

370 J. S. Duncan
Iinuma K, Yokoyama H, Otsuki T, Yanai K, Watanabe T, Ido T, increased sensitivity with quantitative magnetic resonance T2 relax-ometry. Neurology 1993b; 43: 1793–9.et al. Histamine H1 receptors in complex partial seizures [letter].
Lancet 1993; 341: 238.Jackson GD, Williams SR, Weller RO, van Bruggen N, Preece NE,
Iivanainen M, Launes J, Pihko H, Nikkinen P, Lindroth L. Single- et al. Vigabatrin-induced lesions in the rat brain demonstrated byphoton emission computed tomography of brain perfusion: analysisquantitative magnetic resonance imaging. Epilepsy Res 1994a; 18:of 60 paediatric cases. Dev Med Child Neurol 1990; 32: 63–8. 57–66.
Incisa della Rocchetta A, Gadian DG, Connelly A, Polkey CE, Jackson GD, Grunewald RA, Connelly A, Duncan JS. QuantitativeJackson GD, Watkins KE, et al. Verbal memory impairment afterMR relaxometry study of effects of vigabatrin on the brains ofright temporal lobe surgery: role of contralateral damage as revealedpatients with epilepsy. Epilepsy Res 1994b; 18: 127–37.by 1H magnetic resonance spectroscopy and T2 relaxometry. Neuro-
Jackson GD, Connelly A, Cross JH, Gordon I, Gadian DG. Func-logy 1995; 45: 797–802.tional magnetic resonance imaging of focal seizures. Neurology
Itoh M, Yanai K, Yamaguchi S, Fujiwara T, Nagasawa H, Yokoyama1994c; 44: 850–6.H, et al. In vivo visualization of neurotransmitter function in the
Jeffery PJ, Monsein LH, Szabo Z, Hart J, Fisher RS, Lesser RP,human brain by PET. [Review][Japanese]. No To Hattatsu 1995;et al. Mapping the distribution of amobarbital sodium in the27: 146–52.intracarotid Wada test by use of Tc-99m HMPAO with SPECT [see
Jabbari B, Gunderson CH, Wippold F, Citrin C, Sherman J, Bartoszekcomments]. Radiology 1991; 178: 847–50. Comment in: RadiologyD, et al. Magnetic resonance imaging in partial complex epilepsy.1991; 181: 605–6.Arch Neurol 1986; 43: 869–72.
Johnson EW, de Lanerolle NC, Kim JH, Sundaresan S, SpencerJack CR Jr, Sharbrough FW, Marsh WR. Use of MR imaging forDD, Mattson RH, et al. ‘Central’ and ‘peripheral’ benzodiazepinequantitative evaluation of resection for temporal lobe epilepsy.receptors: opposite changes in human epileptogenic tissue. Neuro-Radiology 1988; 169: 463–8. logy 1992; 42: 811–5.
Jack CR Jr, Sharbrough FW, Twomey CK, Cascino GD, HirschornKalifa GL, Chiron C, Sellier N, Demange P, Ponsot G, Lalande G,KA, Marsh WR, et al. Temporal lobe seizures: lateralization with et al. Hemimegalencephaly: MR imaging in five children. RadiologyMR volume measurements of the hippocampal formation [see1987; 165: 29–33.comments]. Radiology 1990; 175: 423–9. Comment in: Radiology
Katz A, Awad IA, Kong AK, Chelune GJ, Naugle RI, Wyllie E,1990; 175: 321.et al. Extent of resection in temporal lobectomy for epilepsy. II.
Jack CR Jr, Sharbrough FW, Cascino GD, Hirschorn KA, O’BrienMemory changes and neurologic complications. Epilepsia 1989; 30:PC, Marsh WR. Magnetic resonance image-based hippocampal763–71.volumetry: correlation with outcome after temporal lobectomy. Ann
Katz A, Bose A, Lind SJ, Spencer SS. SPECT in patients withNeurol 1992; 31: 138–46.epilepsia partialis continua [see comments]. Neurology 1990; 40:
Jack CR Jr, Krecke KN, Luetmer PH, Cascino GD, Sharbrough1848–50. Comment in: Neurology 1992; 42: 1127–8.FW, O’Brien PC, et al. Diagnosis of mesial temporal sclerosis with
Kelly PJ, Sharbrough FW, Kall BA, Goerss SJ. Magnetic resonanceconventional versus fast spin-echo MR imaging. Radiology 1994a;imaging-based computer-assisted stereotactic resection of the hippo-192: 123–7.campus and amygdala in patients with temporal lobe epilepsy. Mayo
Jack CR Jr, Thompson RM, Butts RK, Sharbrough FW, Kelly PJ,Clin Proc 1987; 62: 103–8.Hanson DP, et al. Sensory motor cortex: correlation of presurgical
Kilpatrick CJ, Tress BM, O’Donnell C, Rossiter SC, Hopper JL.mapping with functional MR imaging and invasive cortical mapping.Magnetic resonance imaging and late-onset epilepsy. Epilepsia 1991;Radiology 1994b; 190: 85–92.32: 358–64.
Jack CR Jr, Mullan BP, Sharbrough FW, Cascino GD, Hauser MF,Kim JH, Tien RD, Felsberg GJ, Osumi AK, Lee N. MR measure-Krecke KN, et al. Intractable nonlesional epilepsy of temporal lobements of the hippocampus for lateralization of temporal lobeorigin: lateralization by interictal SPECT versus MRI. Neurologyepilepsy: value of measurements of the body vs the whole structure.1994c; 44: 829–36.AJR Am J Roentgenol 1994; 163: 1453–7.
Jack CR Jr, Trenerry MR, Cascino GD, Sharbrough FW, So EL,Kim JH, Tien RD, Felsberg GJ, Osumi AK, Lee N, Friedman AH.O’Brien PC. Bilaterally symmetric hippocampi and surgical outcomeFast spin-echo MR in hippocampal sclerosis: correlation with[see comments]. Neurology 1995; 45: 1353–8. Comment in: Neuro-pathology and surgery. AJNR Am J Neuroradiol 1995; 16: 627–36.logy 1995; 45: 1248–50.
Kitchen ND, Thomas DG, Shorvon SD, Fish DR, Stevens JM.Jackson GD, Berkovic SF, Tress BM, Kalnins RM, Fabinyi GC,Volumetric analysis of epilepsy surgery resections using highBladin PF. Hippocampal sclerosis can be reliably detected byresolution magnetic imaging: technical report. Br J Neurosurg 1993;magnetic resonance imaging. Neurology 1990; 40: 1869–75.7: 651–6.
Jackson GD, Berkovic SF, Duncan JS, Connelly A. Optimizing theKitchen ND, Cook MJ, Shorvon SD, Fish DR, Thomas DG. Imagediagnosis of hippocampal sclerosis using MR imaging. AJNR Amguided audit of surgery for temporal lobe epilepsy. J NeurolJ Neuroradiol 1993a; 14: 753–62.Neurosurg Psychiatry 1994; 57: 1221–7.
Jackson GD, Connelly A, Duncan JS, Grunewald RA, Gadian DG.Detection of hippocampal pathology in intractable partial epilepsy: Kitchen ND, Cook MJ, Shorvon SD, Fish DR, Stevens JM, Thomas

Imaging and epilepsy 371
DG. Estimation of resection volumes in lesional epilepsy surgery. photon emission computed tomography demonstrates localized epi-leptogenesis in cortical dysplasia. Ann Neurol 1993c; 34: 627–31.AJNR Am J Neuroradiol 1995; 16: 208–10.
Koeller KK, Dillon WP. Dysembryoplastic neuroepithelial tumors: Kuzniecky R, Andermann F, Guerrini R. The epileptic spectrum inMR appearance. AJNR Am J Neuroradiol 1992; 13: 1319–25. the congenital bilateral perisylvian syndrome. CBPS Multicenter
Collaborative Study. Neurology 1994; 44: 379–85.Koepp MJ, Richardson MP, Brooks DJ, Poline JB, Friston KJ,Cunningham VJ, et al. Central benzodiazepine receptors inKuzniecky R, Morawetz R, Faught E, Black L. Frontal and centralhippocampal sclerosis: an objective in vivo analysis. Brain 1996;lobe focal dysplasia: clinical, EEG and imaging features. Dev Med119: 1677–87. Child Neurol 1995; 37: 159–66.
Kuhl DE, Engel J Jr, Phelps ME, Selin C. Epileptic patterns of Latack JT, Abou-Khalil BW, Siegel GJ, Sackellares JC, Gabrielsenlocal cerebral metabolism and perfusion in humans determined byTO, Aisen AM. Patients with partial seizures: evaluation by MR,emission computed tomography of 18FDG and 13NH3. Ann NeurolCT, and PET imaging. Radiology 1986; 159: 159–63.1980; 8: 348–60.
Laxer KD, Hubesch B, Sappey-Marinier D, Weiner MW. IncreasedKuks JB, Cook MJ, Fish DR, Stevens JM, Shorvon SD. HippocampalpH and inorganic phosphate in temporal seizure foci demonstratedsclerosis in epilepsy and childhood febrile seizures [see comments].by [31P]MRS. Epilepsia 1992; 33: 618–23.Lancet 1993; 342: 1391–4. Comment in: Lancet 1994; 343: 488–9.
Laxer KD, van der Grond J, Gerson JR, Hugg JW, Matson GB,Kumlien E, Bergstrom M, Lilja A, Andersson J, Szekeres V, Weiner MW. Temporal lobe epilepsy localization by31P magneticWesterberg CE, et al. Positron emission tomography with [11C]deut-resonance spectroscopic imaging [abstract]. Epilepsia 1993; 34erium deprenyl in temporal lobe epilepsy. Epilepsia 1995; 36:Suppl 6: 122.712–21.
Lee BI, Markand ON, Siddiqui AR, Park HM, Mock B, WellmanKuroiwa T, Kishikawa T, Kato A, Ueno M, Kudo S, Tabuchi K. HH, et al. Single photon emission computed tomography (SPECT)Dysembryoplastic neuroepithelial tumors: MR findings. J Computbrain imaging using N,N,N9-trimethyl-N9-(2 hydroxy-3-methyl-5–Assist Tomogr 1994; 18: 352–6. 123I-iodobenzyl)-1,3-propanediamine 2 HCl (HIPDM): intractable
complex partial seizures. Neurology 1986; 36: 1471–7.Kuzniecky RI. Magnetic resonance imaging in developmental dis-orders of the cerebral cortex [Review]. Epilepsia 1994; 35 Suppl 6:Lee BI, Markand ON, Wellman HN, Siddiqui AR, Park HM, MockS44–56. B, et al. HIPDM-SPECT in patients with medically intractable
complex partial seizures. Ictal study. Arch Neurol 1988; 45: 397–402.Kuzniecky RI. MRI in cerebral developmental malformations andepilepsy. Magn Reson Imaging 1995; 13: 1137–45. Lee BI, Lee BC, Hwang YM, Sohn YH, Jung JW, Park SC, et al.
Prolonged ictal amnesia with transient focal abnormalities onKuzniecky R, de la Sayette V, Ethier R, Melanson D, Andermannmagnetic resonance imaging. Epilepsia 1992; 33: 1042–6.F, Berkovic S, et al. Magnetic resonance imaging in temporal lobe
epilepsy: pathological correlations. Ann Neurol 1987; 22: 341–7. Lee N, Radtke RA, Gray L, Burger PC, Montine TJ, DeLong GR,et al. Neuronal migration disorders: positron emission tomographyKuzniecky R, Berkovic S, Andermann F, Melanson D, Olivier A,correlations. Ann Neurol 1994; 35: 290–7.Robitaille Y. Focal cortical myoclonus and rolandic cortical dyspla-
sia: clarification by magnetic resonance imaging. Ann Neurol 1988;Lee JW, Reutens DC, Dubeau F, Evans A, Andermann F. Morphome-23: 317–25. try in temporal lobe epilepsy. Magn Reson Imaging 1995; 13:
1073–80.Kuzniecky R, Andermann F, Tampieri D, Melanson D, Olivier A,Leppik I. Bilateral central macrogyria: epilepsy, pseudobulbar palsy,Lehericy S, Dormont D, Semah F, Clemenceau S, Granat O,and mental retardation—a recognizable neuronal migration disorderMarsault C, et al. Developmental abnormalities of the medial[see comments]. Ann Neurol 1989; 25: 547–54. Comment in: Anntemporal lobe in patients with temporal lobe epilepsy. AJNR Am JNeurol 1990; 27: 693–4, comment in: Ann Neurol 1990; 28: 840–2.Neuroradiol 1995; 16: 617–26.
Kuzniecky R, Garcia JH, Faught E, Morawetz RB. Cortical dysplasiaLeiderman DB, Balish M, Bromfield EB, Theodore WH. Effect ofin temporal lobe epilepsy: magnetic resonance imaging correlations.valproate on human cerebral glucose metabolism. Epilepsia 1991;Ann Neurol 1991; 29: 293–8. 32: 417–22.Kuzniecky R, Elgavish GA, Hetherington HP, Evanochko WT,
Leiderman DB, Balish M, Sato S, Kufta C, Reeves P, Gaillard WD,Pohost GM. In vivo 31P nuclear magnetic resonance spectroscopy
et al. Comparison of PET measurements of cerebral blood flow andof human temporal lobe epilepsy. Neurology 1992; 42: 1586–90.
glucose metabolism for the localization of human epileptic foci.Epilepsy Res 1992; 13: 153–7.Kuzniecky R, Murro A, King D, Morawetz R, Smith J, Powers R,
et al. Magnetic resonance imaging in childhood intractable partialLeiderman DB, Albert P, Balish M, Bromfield E, Theodore WH.
epilepsies: pathologic correlations. Neurology 1993a; 43: 681–7.The dynamics of metabolic change following seizures as measuredby positron emission tomography with fluorodeoxyglucose F 18.Kuzniecky R, Burgard S, Faught E, Morawetz R, Bartolucci A.Arch Neurol 1994; 51: 932–6.Predictive value of magnetic resonance imaging in temporal lobe
epilepsy surgery. Arch Neurol 1993b; 50: 65–9.Lencz T, McCarthy G, Bronen RA, Scott TM, Inserni JA, Sass KJ,et al. Quantitative magnetic resonance imaging in temporal lobeKuzniecky R, Mountz JM, Wheatley G, Morawetz R. Ictal single-

372 J. S. Duncan
epilepsy: relationship to neuropathology and neuropsychological A. Correlation of PET activation studies with intraoperative corticalstimulation [abstract]. Neurology 1996; 46 (2 Suppl): A399.function. Ann Neurol 1992; 31: 629–37.
Miller LA, Munoz DG, Finmore M. Hippocampal sclerosis andLesser RP, Modic MT, Weinstein MA, Duchesneau PM, Luders H,human memory. Arch Neurol 1993; 50: 391–4.Dinner DS, et al. Magnetic resonance imaging (1.5 tesla) in patients
with intractable focal seizures. Arch Neurol 1986; 43: 367–71. Miura K, Watanabe K, Maeda N, Matsumoto A, Kumagai T, Ito K,et al. Magnetic resonance imaging and positron emission tomographyLivingston JH, Aicardi J. Unusual MRI appearance of diffuseof band heterotopia. Brain Dev 1993; 15: 288–90.subcortical heterotopia or ‘double cortex’ in two children. J Neurol
Neurosurg Psychiatry 1990; 53: 617–20. Monte Secades R, Branas Fernandez F, Cortes Laino J, PulpeiroRios J, Martinez Vazquez F. Alteraciones reversibles en la resonanciaLongostrevi GP. Diagnostic usefulness of SPECT with Tc99m HM-magnetica en 2 casos de status de crisis parciales complejas.PAO in cerebral pathology in outpatient practice. [Italian]. MinervaNeurologia 1994; 9: 427–30.Med 1986; 77: 1777–88.
Montes JL, Rosenblatt B, Farmer JP, O’Gorman AM, AndermannLorenzo NY, Parisi JE, Cascino GD, Jack CR Jr, Marsh WR,F, Watters GV, et al. Lesionectomy of MRI detected lesions inHirschorn KA. Intractable frontal lobe epilepsy: pathological andchildren with epilepsy. Pediatr Neurosurg 1995; 22: 167–73.MRI features. Epilepsy Res 1995; 20: 171–8.
Morris GL 3d, Mueller WM, Yetkin FZ, Haughton VM, HammekeManno EM, Sperling MR, Ding X, Jaggi J, Alavi A, O’Connor MJ,TA, Swanson S, et al. Functional magnetic resonance imaging inetal. Predictors of outcome after anterior temporal lobectomy:partial epilepsy. Epilepsia 1994; 35: 1194–8.positron emission tomography. Neurology 1994; 44: 2331–6.
Muller-Gartner HW, Links JM, Prince JL, Bryan RN, McVeigh E,Maquet P, Hirsch E, Dive D, Salmon E, Marescaux C, FranckLeal JP, et al. Measurement of radiotracer concentration in brainG. Cerebral glucose utilization during sleep in Landau-Kleffnergray matter using positron emission tomography: MRI-based correc-syndrome: a PET study. Epilepsia 1990; 31: 778–83.tion for partial volume effects. J Cereb Blood Flow Metab 1992;
Markand ON, Salanova V, Worth RM, Park HM, Wellman HH. 12: 571–83.Ictal brain imaging in presurgical evaluation of patients with
Muller-Gartner HW, Mayberg HS, Fisher RS, Lesser RP, Wilsonmedically intractable complex partial seizures. Acta Neurol ScandAA, Ravert HT, et al. Decreased hippocampal muscarinic cholinergic1994; 89 Suppl 152: 137–44.receptor binding measured by123I-iododexetimide and single-photonemission computed tomography in epilepsy. Ann Neurol 1993; 34:Marks DA, Katz A, Hoffer P, Spencer SS. Localization of extratem-235–8.poral epileptic foci during ictal single photon emission computed
tomography. Ann Neurol 1992; 31: 250–5.Murro AM, Park YD, King DW, Gallagher BB Smith JR, YaghmaiF, et al. Seizure localization in temporal lobe epilepsy: a comparisonMarliani AF, Tampieri D, Melancon D, Ethier R, Berkovic SF,of scalp-sphenoidal EEG and volumetric MRI. Neurology 1993;Andermann F. Magnetic resonance imaging of hypothalamic hamar-43: 2531–3.tomas causing gelastic epilepsy. Can Assoc Radiol J 1991; 42: 335–9.
Nagata T, Tanaka F, Yonekura Y, Ikeda A, Nishizawa S, Ishizu K,Mason GF, Gruetter R, Rothman DL, Behar KL, Shulman RG,et al. Limited value of interictal brain perfusion SPECT for detectionNovotny EJ. Simultaneous determination of the rates of the TCAof epileptic foci: high resolution SPECT studies in comparison withcycle, glucose utilization, alpha-ketoglutarate/glutamate exchange,FDG-PET. Ann Nucl Med 1995; 9: 59–63.and glutamine synthesis in human brain by NMR. J Cereb Blood
Flow Metab 1995; 15: 12–25. Nayel MH, Awad IA, Luders H. Extent of mesiobasal resectiondetermines outcome after temporal lobectomy for intractable com-Matsuda H, Onuma T, Yagishita A. Brain SPECT imaging forplex partial seizures. Neurosurgery 1991; 29: 55–60.laminar heterotopia. J Nucl Med 1995; 36: 238–40.
Nehlig A, Vergnes M, Marescaux C, Boyet S, Lannes B. LocalMatthews PM, Andermann F, Arnold DL. A proton magneticcerebral glucose utilization in rats with petit mal-like seizures. Annresonance spectroscopy study of focal epilepsy in humans. Neuro-Neurol 1991; 29: 72–7.logy 1990; 40: 985–9.
Nehlig A, Vergnes M, Marescaux C, Boyet S. Mapping of cerebralMayberg HS, Sadzot B, Meltzer CC, Fisher RS, Lesser RP, Dannalsenergy metabolism in rats with genetic generalized nonconvulsiveRF, et al. Quantification ofµ and non-µ opiate receptors in temporalepilepsy. J Neural Transm Suppl 1992; 35: 141–53.lobe epilepsy using positron emission tomography. Ann Neurol
1991; 30: 3–11. Neuroimaging Commission. Recommendations for neuro-imagingof patients with epilepsy. Epilepsia 1997. In press.McLachlan RS, Nicholson RL, Black S, Carr T, Blume WT. Nuclear
magnetic resonance imaging, a new approach to the investigationNewton MR, Berkovic SF, Austin MC, Reutens DC, McKay WJ,of refractory temporal lobe epilepsy. Epilepsia 1985; 26: 555–62. Bladin PF. Dystonia, clinical lateralization, and regional blood flow
changes in temporal lobe seizures. Neurology 1992a; 42: 371–7.Meiners LC, van Gils A, Jansen GH, de Kort G, Witkamp TD, RamosLM, et al. Temporal lobe epilepsy: the various MR appearancesNewton MR, Berkovic SF, Austin MC, Rowe CC, McKay WJ,of histologically proven mesial temporal sclerosis. AJNR Am J Bladin PF. Postictal switch in blood flow distribution and temporalNeuroradiol 1994; 15: 1547–55. lobe seizures. J Neurol Neurosurg Psychiatry 1992b; 55: 891–4.
Newton MR, Berkovic SF, Austin MC, Rowe CC, McKay WJ,Meyer E, Reutens D, Sadikot AF, Comeau RM, Peters TM, Olivier

Imaging and epilepsy 373
Bladin PF. SPECT in the localisation of extratemporal and temporal resonance imaging in partial epilepsy of childhood. Seventy-ninecases. J Neuroradiol 1989; 16: 308–16.seizure foci. J Neurol Neurosurg Psychiatry 1995; 59: 26–30.
Peretti-Viton P, Perez-Castillo AM, Raybaud C, Grisoli F, BernardNishio S, Fujiwara S, Aiko Y, Takeshita I, Fukui M. HypothalamicF, Poncet M, et al. Magnetic resonance imaging in gangliogliomashamartoma. Report of two cases. J Neurosurg 1989; 70: 640–5.and gangliocytomas of the nervous system. J Neuroradiol 1991; 18:
Ochs RF, Gloor P, Tyler JL, Wolfson T, Worsley K, Andermann F, 189–99.et al. Effect of generalized spike-and-wave discharge on glucose
Perrine K. Future directions for functional mapping. Epilepsia 1994;metabolism measured by positron emission tomography. Ann Neurol35 Suppl 6: S90–102.1987; 21: 458–64.
Petroff OAC, Prichard JW, Ogino T, Avison MJ, Alger JR, ShulmanOldendorf WH. The use and promise of nuclear magnetic resonanceRG. Combined 1H and 31P nuclear magnetic resonance spectro-imaging in epilepsy. Epilepsia 1984; 25 Suppl 2: S105–17.scopic studies of bicuculline-induced seizures in vivo. Ann Neurol
Olson DM, Chugani HT, Shewmon DA, Phelps ME, Peacock1986; 20: 185–93.WJ. Electrocorticographic confirmation of focal positron emission
Petroff OAC, Novotny EJ, Avison M, Rothman DL, Alger JR,tomographic abnormalities in children with intractable epilepsy.Ogino T, et al. Cerebral lactate turnover after electroshock: in vivoEpilepsia 1990; 31: 731–9.measurements by 1H/13C magnetic resonance spectroscopy. J CerebBlood Flow Metab 1992; 12: 1022–9.Ormson MJ, Kispert DB, Sharbrough FW, Houser OW, Earnest F
4th, Scheithauer BW, et al. Cryptic structural lesions in refractoryPetroff OAC, Rothman DL, Behar KL, Mattson RH. Initial observa-
partial epilepsy: MR imaging and CT studies. Radiology 1986; 160:tions on the effect of vigabatrin on in vivo 1H spectroscopic
215–9.measurements of gamma-aminobutyric acid, glutamate, and glutam-ine in human brain. Epilepsia 1995; 36: 457–64.Otsubo H, Hoffman HJ, Humphreys RP, Hendrick EB, Drake JM,
Hwang PA, et al. Evaluation, surgical approach and outcome ofPetroff OAC, Rothman DL, Behar KL, Lamoureux D, Mattson RH.seizure patients with gangliogliomas. Pediatr Neurosurg 1990–91;Initial observations on the effect of gabapentin on brain gamma-16: 208–12. aminobutyric acid in patients with epilepsy. Ann Neurol 1996; 39:
95–9.Otsubo H, Hwang PA, Jay V, Becker LE, Hoffman HJ, Gilday D,et al. Focal cortical dysplasia in children with localization-relatedPeyron R, Le Bars D, Cinotti L, Garcia-Larrea L, Galy G, Landaisepilepsy: EEG, MRI, and SPECT findings. Pediatr Neurol 1993; 9:P, et al. Effects of GABAA receptors activation on brain glucose101–7. metabolism in normal subjects and temporal lobe epilepsy (TLE)
patients. A positron emission tomography (PET) study. Part I: BrainO’Tuama LA, Urion DK, Janicek MJ, Treves ST, Bjornson B,glucose metabolism is increased after GABAA receptors activation.Moriarty JM. Regional cerebral perfusion in Landau-Kleffner syn-Epilepsy Res 1994a; 19: 45–54.drome and related childhood aphasias. J Nucl Med 1992; 33:
1758–65. Peyron R, Cinotti L, Le Bars D, Garcia-Larrea L, Galy G, LandaisP, et al. Effects of GABAA receptors activation on brain glucosePalmini A, Andermann F, Olivier A, Tampieri D, Robitaille Y,metabolism in normal subjects and temporal lobe epilepsy (TLE)Andermann E, et al. Focal neuronal migration disorders and intract-patients. A positron emission tomography (PET) study. Part II: Theable partial epilepsy: a study of 30 patients. [Review]. Ann Neurolfocal hypometabolism is reactive to GABAA agonist administration1991a; 30: 741–9.in TLE. Epilepsy Res 1994b; 19: 55–62.
Palmini A, Andermann F, Aicardi J, Dulac O, Chaves F, Ponsot G,Pillay PK, Barnett G, Awad I. MRI-guided stereotactic placement
et al. Diffuse cortical dysplasia, or the ‘double cortex’ syndrome:of depth electrodes in temporal lobe epilepsy. Br J Neurosurg 1992;
the clinical and epileptic spectrum in 10 patients. Neurology 1991b;6: 47–53.
41: 1656–62.Podreka I, Suess E, Goldenberg G, Steiner M, Brucke T, Muller C,
Palmini A, Gambardella A, Andermann F, Dubeau F, da Costa JC,et al. Initial experience with technetium-99m HM-PAO brain SPECT.Olivier A, et al. Operative strategies for patients with cortical J Nucl Med 1987; 28: 1657–66.dysplastic lesions and intractable epilepsy. [Review]. Epilepsia
Preece NE, Jackson GD, Houseman JA, Duncan JS, Williams SR.1994; 35 Suppl 6: S57–71.Nuclear magnetic resonance detection of increased cortical GABA
Park YD, Hoffman JM, Radtke RA, DeLong GR. Focal cerebral in the Vigabatrin-treated rat in vivo. Epilepsia 1994; 35: 431–6.metabolic abnormality in a patient with continuous spike waves
Prevett MC, Cunningham VJ, Brooks DJ, Fish DR, Duncan JS.during slow-wave sleep. J Child Neurol 1994; 9: 139–43.Opiate receptors in idiopathic generalised epilepsy measured with
Pawlik G, Holthoff VA, Kessler J, Rudolf J, Hebold IR, Lottgen J, [11C]diprenorphine and positron emission tomography. Epilepsyet al. Positron emission tomography findings relevant to neurosurgeryRes 1994; 19: 71–7.for epilepsy. Acta Neurochir Suppl (Wien) 1990; 50: 84–7.
Prevett MC, Duncan JS, Jones T, Fish DR, Brooks DJ. DemonstrationPawlik G, Fink GR, Kessler J, Heiss WD. PET and functional of thalamic activation during typical absence seizures using H2
15Otesting in temporal lobe epilepsy. Acta Neurol Scand Suppl 1994;and PET. Neurology 1995a; 45: 1396–402.152: 150–6.
Prevett MC, Lammertsma AA, Brooks DJ, Bartenstein PA, PatsalosPN, Fish DR, et al. Benzodiazepine-GABAA receptors in idiopathicPeretti P, Raybaud C, Dravet C, Mancini J, Pinsard N. Magnetic

374 J. S. Duncan
generalized epilepsy measured with [11C]flumazenil and positron Riederer SJ, Jack CR, Grimm RC, Rydberg JN, Slavin GS. Newtechnical developments in magnetic resonance imaging of epilepsy.emission tomography. Epilepsia 1995b; 36: 113–21.Magn Reson Imaging 1995; 13: 1095–8.
Prevett MC, Lammertsma AA, Brooks DJ, Cunningham VJ, FishRintahaka PJ, Chugani HT, Messa C, Phelps ME. Hemi-DR, Duncan JS. Benzodiazepine-GABAA receptor binding duringmegalencephaly: evaluation with positron emission tomography.absence seizures. Epilepsia 1995c; 36: 592–9.Pediatr Neurol 1993; 9: 21–8.
Prichard JW. Nuclear magnetic resonance spectroscopy of seizureRintahaka PJ, Chugani HT, Sankar R. Landau-Kleffner syndromestates. Epilepsia 1994; 35 Suppl 6: S14–20.with continuous spikes and waves during slow-wave sleep. J Child
Puce A, Constable RT, Luby ML, McCarthy G, Nobre AC, SpencerNeurol 1995; 10: 127–33.DD, et al. Functional magnetic resonance imaging of sensory and
Rothman DL, Novotny EJ, Shulman GI, Howseman AM, Petroffmotor cortex: comparison with electrophysiological localization. JOAC, Mason G, et al.1H-[13C] NMR measurements of [4–13C]-Neurosurg 1995; 83: 262–70.glutamate turnover in human brain. Proc Natl Acad Sci USA 1992;
Radtke RA, Hanson MW, Hoffman JM, Crain BJ, Walczak TS, 89: 9603–6.Lewis DV, Beam C, Coleman RE, Friedman AH. Temporal lobe
Rothman DL, Petroff OAC, Behar KL, Mattson RH. Localizedhypometabolism on PET: predictor of seizure control after temporal1H-NMR measurements ofγ-aminobutyric acid in human brainlobectomy [see comments]. Neurology 1993; 43: 1088–92. Commentin vivo. Proc Natl Acad Sci USA 1993; 90: 5662–6.in: Neurology 1994; 44: 583–5.
Rowe CC, Berkovic SF, Austin MC, McKay WJ, Bladin PF. PatternsRausch R, Henry TR, Ary CM, Engel J Jr, Mazziotta J. Asymmetricof postictal cerebral blood flow in temporal lobe epilepsy: qualitativeinterictal glucose hypometabolism and cognitive performance inand quantitative analysis. Neurology 1991a; 41: 1096–103.epileptic patients. Arch Neurol 1994; 51: 139–44.Rowe CC, Berkovic SF, Austin MC, Saling M, Kalnins RM, McKayRaymond AA, Fish DR, Stevens JM, Cook MJ, Sisodiya SM,WJ, et al. Visual and quantitative analysis of interictal SPECT withShorvon SD. Association of hippocampal sclerosis with corticaltechnetium-99m-HMPAO in temporal lobe epilepsy. J Nucl Meddysgenesis in patients with epilepsy [see comments]. Neurology1991b; 32: 1688–94.1994a; 44: 1841–5. Comment in: Neurology 1995; 45: 1947–8.Ryvlin P, Cinotti L, Froment JC, Le Bars D, Landais P, Chaze M,
Raymond AA, Halpin SF, Alsanjari N, Cook MJ, Kitchen ND, Fishet al. Metabolic patterns associated with non-specific magnetic
DR, et al. Dysembryoplastic neuroepithelial tumor. Features in 16resonance imaging abnormalities in temporal lobe epilepsy. Brain
patients. Brain 1994b; 117: 461–75.1991; 114: 2363–83.
Raymond AA, Fish DR, Stevens JM, Sisodiya SM, Alsanjari Ryvlin P, Philippon B, Cinotti L, Froment JC, Le Bars D, MauguiereN, Shorvon SD. Subependymal heterotopia: a distinct neuronalF. Functional neuroimaging strategy in temporal lobe epilepsy: amigration disorder associated with epilepsy. [Review]. J Neurolcomparative study of18DG-PET and99mTc-HMPAO-SPECT. AnnNeurosurg Psychiatry 1994c; 57: 1195–202. Neurol 1992a; 31: 650–6.
Raymond AA, Fish DR, Sisodiya SM, Alsanjari N, Stevens JM, Ryvlin P, Garcia-Larrea L, Philippon B, Froment JC, Fischer C,Shorvon SD. Abnormalities of gyration, heterotopias, tuberousRevol M, et al. High signal intensity on T2-weighted MRI correlatessclerosis, focal cortical dysplasia, microdysgenesis, dysembryoplas-with hypoperfusion in temporal lobe epilepsy. Epilepsia 1992b; 33:tic neuroepithelial tumour and dysgenesis of the archicortex in28–35.epilepsy. Clinical, EEG and neuroimaging features in 100 adult
Ryvlin P, Mauguiere F, Sindou M, Froment JC, Cinotti L. Interictalpatients. [Review]. Brain 1995; 118: 629–60.cerebral metabolism and epilepsy in cavernous angiomas. Brain
Requena I, Arias M, Lopez-Ibor L, Pereiro I, Barba A, Alonso A, 1995; 118: 677–87.et al. Cavernomas of the central nervous system: clinical and
Sackellares JC, Siegel JC, Abou-Khalil BW, Hood TW, Gilman S,neuroimaging manifestations in 47 patients. J Neurol NeurosurgMcKeever PE, et al. Differences between lateral and mesial temporalPsychiatry 1991; 54: 590–4.metabolism interictally in epilepsy of mesial temporal origin.
Ricci S, Cusmai R, Fariello G, Fusco L, Vigevano F. Double cortex.Neurology 1990; 40: 1420–6.A neuronal migration anomaly as a possible cause of Lennox-
Sadzot B, Debets RM, Maquet P, van Veelen CW, Salmon E, vanGastaut syndrome. Arch Neurol 1992; 49: 61–4.Emde Boas W, et al. Regional brain glucose metabolism in patients
Richardson MP, Koepp MJ, Brooks DJ, Fish DR, Duncan JSwith complex partial seizures investigated by intracranial EEG.Benzodiazepine receptors in focal epilepsy with cortical dysgenesis:Epilepsy Res 1992; 12: 121–9.an 11C-flumazenil PET study. Ann Neurol 1996a; 40: 188–98.
Sanchetee PC, Venkataraman CS, Dhamija RM, Roy AK. EpilepsyRichardson MP, Koepp MJ, Coull JT, Brooks DJ, Fish DR, Duncanas a manifestation of neurocysticercosis [see comments]. J AssocJS. Cerebral activation in malformations of cortical developmentPhysicians India 1991; 39: 325–8. comment in: J Assoc Physicians[abstract]. Epilepsia 1996b; 37 Suppl 5: 205. India 1992; 40: 138.
Sass KJ, Westerveld M, Buchanan CP, Spencer SS, Kim JH, SpencerRichardson MP, Koepp MJ, Brooks DJ, Duncan JS. [11C]-flumazenilPET reveals central benzodiazepine receptor binding abnormali- DD. Degree of hippocampal neuron loss determines severity of
verbal memory decrease after left anteromesiotemporal lobectomy.ties in partial epilepsy with normal MRI [abstract]. Neurology1996c; 46 (2 Suppl): A122–3. Epilepsia 1994; 35: 1179–86.

Imaging and epilepsy 375
Saukkonen A, Kalviainen R, Partanen K, Vainio P, Riekkinen P, Sisodiya SM, Stevens JM, Fish DR, Free SL, Shorvon SD. Thedemonstration of gyral abnormalities in patients with cryptogenicPitkanen A. Do seizures cause neuronal damage? A MRI study in
newly diagnosed and chronic epilepsy. Neuroreport 1994; 6: 219–23. partial epilepsy using three-dimensional MRI. Arch Neurol 1996;53: 28–34.
Sauter R, Schneider M, Wiclow K, Kolem H. Localized 1H MRSof the human brain: single-voxel versus CSI techniques. J Magn Sjoholm H, Rosen I, Elmqvist D. Role of I-123-iomazenil SPECT
imaging in drug resistant epilepsy with complex partial seizures.Reson Imaging 1991; 1: 241.Acta Neurol Scand 1995; 92: 41–8.
Savic I, Persson A, Roland P, Pauli S, Sedvall G, Widen L. In-vivodemonstration of reduced benzodiazepine receptor binding in human Smith NM, Carli MM, Hanieh A, Clark B, Bourne AJ, Byard RW.
Gangliogliomas in childhood. Childs Nerv Syst 1992; 8: 258–62.epileptic foci. Lancet 1988; 2: 863–6.
Savic I, Widen L, Thorell JO, Blomqvist G, Ericson K, Roland P. Sostman HD, Spencer DD, Gore JC, Spencer SS, Holcomb WG,Williamson PD, et al. Preliminary observations on magneticCortical benzodiazepine receptor binding in patients with generalized
and partial epilepsy. Epilepsia 1990; 31: 724–30. resonance imaging in refractory epilepsy. Magn Reson Imaging1984; 2: 301–6.
Savic I, Widen L, Stone-Elander S. Feasibility of reversingbenzodiazepine tolerance with flumazenil [see comments]. Lancet Spencer SS. The relative contributions of MRI, SPECT, and PET
imaging in epilepsy. Epilepsia 1994; 35 Suppl 6: S72–89.1991; 337: 133–7. Comment in: Lancet 1991; 337: 563, commentin: Lancet 1991; 337: 744.
Spencer SS. MRI and epilepsy surgery [editorial; comment].Neurology 1995; 45: 1248–50. Comment in: Neurology 1995; 45:Savic I, Ingvar M, Stone-Elander S. Comparison of [11C]flumazenil
and [18]FDG as PET markers of epileptic foci. J Neurol Neurosurg 1353–9, comment in: Neurology 1995; 45: 1358–63.Psychiatry 1993; 56: 615–21.
Spencer SS, McCarthy G, Spencer DD. Diagnosis of medial temporallobe seizure onset: relative specificity and sensitivity of quantitativeSavic I, Pauli S, Thorell JO, Blomqvist G. In vivo demonstration of
altered benzodiazepine receptor density in patients with generalised MRI. Neurology 1993; 43: 2117–24.epilepsy. J Neurol Neurosurg Psychiatry 1994; 57: 797–804.
Sperling MR, Wilson G, Engel J Jr, Babb TL, Phelps M, BradleyW. Magnetic resonance imaging in intractable partial epilepsy:Savic I, Thorell JO, Roland P. [11C]flumazenil positron emission
tomography visualizes frontal epileptogenic regions. Epilepsia 1995; correlative studies. Ann Neurol 1986; 20: 57–62.36: 1225–32.
Sperling MR, Gur RC, Alavi A, Gur RE, Resnick S, O’Connor MJ,et al. Subcortical metabolic alterations in partial epilepsy. EpilepsiaSavic I, Svanborg E, Thorell JO. Cortical benzodiazepine receptor
changes are related to frequency of partial seizures: a positron 1990; 31: 145–55.emission tomography study. Epilepsia 1996; 37: 236–44.
Sperling MR, Alavi A, Reivich M, French JA, O’Connor MJ. Falselateralization of temporal lobe epilepsy with FDG positron emissionSchorner W, Meencke HJ, Felix R. Temporal-lobe epilepsy:
comparison of CT and MR imaging. AJR Am J Roentgenol 1987; tomography. Epilepsia 1995; 36: 722–7.149: 1231–9.
Stefan H, Pawlik G, Bocher-Schwarz HG, Biersack HJ, Burr W,Penin H, et al. Functional and morphological abnormalities inSchuierer G, Stefan H, Wenzel D, Kurlemann G. Heterotope graue
Substanz: MR-Befunde und Klinik. Klin Padiatr 1995; 207: 117–21. temporal lobe epilepsy: a comparison of interictal and ictal EEG,CT, MRI, SPECT and PET. J Neurol 1987a; 234: 377–84.
Segawa F, Kishibayashi J, Kamada K, Sunohara N, Kinoshita M.FLAIR images of brain diseases. [Japanese]. No To Shinkei 1994; Stefan H, Kuhnen C, Biersack HJ, Reichmann K. Initial experience
with 99m Tc-hexamethyl-propylene amine oxime (HM-PAO) single46: 531–8.photon emission computed tomography (SPECT) in patients with
Semah F, Baulac M, Hasboun D, Frouin V, Mangin JF, Papageorgioufocal epilepsy. Epilepsy Res 1987b; 1: 134–8.
S, et al. Is interictal temporal hypometabolism related to mesialtemporal sclerosis? A positron emission tomography/magnetic Stefan H, Bauer J, Feistel H, Schulemann H, Neubauer U, Wenzel
B, et al. Regional cerebral blood flow during focal seizures ofresonance imaging confrontation. Epilepsia 1995; 36: 447–56.temporal and frontocentral onset. Ann Neurol 1990; 27: 162–6.
Shen W, Lee BI, Park HM, Siddiqui AR, Wellman HH, Worth RM,et al. HIPDM-SPECT brain imaging in the presurgical evaluation Swartz BE, Halgren E, Delgado-Escueta AV, Mandelkern M, Gee
M, Quinones N, et al. Neuroimaging in patients with seizures ofof patients with intractable seizures. J Nucl Med 1990; 31: 1280–4.probable frontal lobe origin. Epilepsia 1989; 30: 547–58.
Siegel AM, Wieser HG, Wichmann W, Yasargil GM. Relationshipsbetween MR-imaged total amount of tissue removed, resection Swartz BW, Khonsari A, Vrown C, Mandelkern M, Simpkins F,
Krisdakumtorn T. Improved sensitivity of 18FDG-positron emissionscores of specific mediobasal limbic subcompartments and clinicaloutcome following selective amygdalohippocampectomy. Epilepsy tomography scans in frontal and ‘frontal plus’ epilepsy. Epilepsia
1995; 36: 388–95.Res 1990; 6: 56–65.
Siesjo BK. Epileptic seizures. In: Siesjo¨ BK. Brain energy Szelies B, Herholz K, Heiss WD, Rackl A, Pawlik G, Wagner R,et al. Hypometabolic cortical lesions in tuberous sclerosis withmetabolism. Chichester: John Wiley, 1978: 345–79.epilepsy: demonstration by positron emission tomography. J Comput
Sisodiya SM, Free SL, Stevens JM, Fish DR, Shorvon SD.Assist Tomogr 1983; 7: 946–53.
Widespread cerebral structural changes in patients with corticaldysgenesis and epilepsy. Brain 1995; 118: 1039–50. Tamaki K, Okuno T, Ito M, Asato R, Konishi J, Mikawa H.

376 J. S. Duncan
Magnetic resonance imaging in relation to EEG epileptic foci in association with onset and duration of epilepsy, and febrileconvulsions in temporal lobectomy patients. Epilepsy Res 1993b;tuberous sclerosis. Brain Dev 1990; 12: 316–20.15: 247–52.
Tamaki K, Okuno T, Iwasaki Y, Yonekura Y, Konishi J, MikawaH. Regional cerebral blood flow in relation to MRI and EEG Triulzi F, Franceschi M, Fazio F, Del Maschio A. Nonrefractoryfindings in tuberous sclerosis. Brain Dev 1991; 13: 420–4. temporal lobe epilepsy: 1.5-T MR imaging. Radiology 1988; 166:
181–5.Tampieri D, Moumdjian R, Melanson D, Ethier R. Intracerebralgangliogliomas in patients with partial complex seizures: CT andUrenjak J, Williams SR, Gadian DG, Noble M. Specific expressionMR imaging findings. AJNR Am J Neuroradiol 1991; 12: 749–55. of N-acetylaspartate in neurons, oligodendrocyte-type-2 astrocyte
progenitors, and immature oligodendrocytes in vitro. J NeurochemTheodore WH. Antiepileptic drugs and cerebral glucose metabolism.1992; 59: 55–61.Epilepsia 1988; 29 Suppl 2: S48–55.
Urenjak J, Williams SR, Gadian DG, Noble M. Proton nuclearTheodore WH, Newmark ME, Sato S, Brooks R, Patronas N,magnetic resonance spectroscopy unambiguously identifies differentDe La Paz R, et al. [18F]fluorodeoxyglucose positron emissionneural cell types. J Neurosci 1993; 13: 981–9.tomography in refractory complex partial seizures. Ann Neurol
1983; 14: 429–37. Van Huffelen AC, Van Isselt JW, Van Veelen CW, Van Rijk PP,Van Bentum AM, Dive D, et al. Identification of the side of epilepticTheodore WH, Brooks R, Margolin R, Patronas N, Sato S, Porterfocus with 123I-Iomazenil SPECT. A comparison with 18FDG-PETRJ, et al. Positron emission tomography in generalized seizures.and ictal EEG findings in patients with medically intractable complexNeurology 1985; 35: 684–90.partial seizures. Acta Neurochir Suppl (Wien) 1990; 50: 95–9.
Theodore WH, Dorwart R, Holmes M, Porter RJ, DiChiro G.Van Paesschen W, Revesz T, Duncan JS, Connelly A, HarknessNeuroimaging in refractory partial seizures: comparison of PET,WFJ, Sisodiya S, et al. Quantitative neuropathology and quantitativeCT, and MRI. Neurology 1986a; 36: 750–9.MRI of hippocampal sclerosis [abstract]. Epilepsia 1994; 35 Suppl
Theodore WH, Holmes MD, Dorwart RH, Porter RJ, Di Chiro G,8: 19.
Sato S, et al. Complex partial seizures: cerebral structure andcerebral function. Epilepsia 1986b; 27: 576–82. Van Paesschen W, Sisodiya S, Connelly A, Duncan JS, Free SF,
et al. Quantitative hippocampal MRI and intractable temporal lobeTheodore WH, Fishbein D, Dietz M, Baldwin P, Dietz M. Complexepilepsy. Neurology 1995; 45: 2233–40.partial seizures: cerebellar metabolism [published erratum appears
in Epilepsia 1988; 29: 828]. Epilepsia 1987a; 28: 319–23. Van Paesschen W, Connelly A, Duncan JS. The amygdala andintractable temporal lobe epilepsy: a quantitative magnetic resonanceTheodore WH, Rose D, Patronas N, Sato S, Holmes M, Bairamianimaging study. Neurology 1996; 47: 1021–31.D,et al. Cerebral glucose metabolism in the Lennox-Gastaut
syndrome. Ann Neurol 1987b; 21: 14–21. Van Paesschen W, Connelly A, Jackson GD, King M, Duncan JS.The spectrum of hippocampal sclerosis. A quantitative MRI study.Theodore WH, Bromfield E, Onorati L. The effect of carbamazepineAnn Neurol 1997. In press.on cerebral glucose metabolism. Ann Neurol 1989; 25: 516–20.
Van Zijl PCM, Rothman D. NMR studies of brain13C-glucoseTheodore WH, Sato S, Kufta C, Balish MB, Bromfield EB,uptake and metabolism: present status. Magn Reson Imaging 1995;Leiderman DB. Temporal lobectomy for uncontrolled seizures: the13: 1213–21.role of positron emission tomography. Ann Neurol 1992a; 32:
789–94.Venz S, Cordes M, Straub HB, Hierholzer J, Schroder R, RichterW, et al. Preoperative evaluation of drug resistant focal epilepsiesTheodore WH, Carson RE, Andreasen P, Zametkin A, Blasberg R,with 123I-iomazenil SPECT. Comparison with video/EEGLeiderman DB, et al. PET imaging of opiate receptor binding inmonitoring and postoperative results. [German]. Nuklearmedizinhuman epilepsy using [18F]cyclofoxy. Epilepsy Res 1992b; 13:1994; 33: 189–93.129–39.
Theodore WH, Gaillard WD, Sato S, Kufta C, Leiderman D. Vles JS, Demandt E, Ceulemans B, de Roo M, Casaer PJ. SinglePositron emission tomographic measurement of cerebral blood flowphoton emission computed tomography (SPECT) in seizure disordersand temporal lobectomy. Ann Neurol 1994; 36: 241–4. in childhood. Brain Dev 1990; 12: 385–9.
Tien RD, Felsberg GJ, Campi de Castro C, Osumi AK, Lewis DV,Warach S, Levin JM, Schomer DL, Holman BL, Edelman RR.Friedman AH, et al. Complex partial seizures and mesial temporalHyperperfusion of ictal seizure focus demonstrated by MR perfusionsclerosis: evaluation with fast spin-echo MR imaging. Radiologyimaging. AJNR Am J Neuroradiol 1994; 15: 965–8.1993; 189: 835–42.
Warach S, Ives JR, Schlaug G, Patel MR, Darby DG, ThangarajTrenerry MR, Jack CR Jr, Ivnik RJ, Sharbrough FW, Cascino GD,V, et al. EEG-triggered echo-planar functional MRI in epilepsy.Hirschorn KA, et al. MRI hippocampal volumes and memory Neurology 1996; 47: 89–93.function before and after temporal lobectomy [see comments].
Wieser HG, Duc C, Meier D, Boesiger P. [1H]MR spectroscopy inNeurology 1993a; 43: 1800–5. comment in: Neurology 1995;the human hippocampus: its role in the surgical treatment of45: 396.temporal lobe epilepsy [abstract]. Epilepsia 1995; 36 Suppl 3: S144.
Trenerry MR, Jack CR Jr, Sharbrough FW, Cascino GD, HirschornKA, Marsh WR, et al. Quantitative MRI hippocampal volumes: Wieshmann UC, Free S, Everitt A, Barker G, Rieder SJ, Fish DR,

Imaging and epilepsy 377
et al. MR imaging with a fast FLAIR sequence. J Neurol Neurosurg chemical shift spectroscopic imaging. Society of magnetic resonancein medicine, 13th Annual Scientific Meeting, Book of AbstractsPsychiatry 1996; 61: 357–61.1994: 572.
Williamson PD, Thadani VM, Darcey TM, Spencer DD, SpencerSS, Mattson RH. Occipital lobe epilepsy: clinical characteristics, Zentner J, Hufnagel A, Wolf HK, Ostertun B, Behrens E, Campos
MG, et al. Surgical treatment of temporal lobe epilepsy: clinical,seizure spread patterns, and results of surgery. [Review]. Ann Neurol1992; 31: 3–13. radiological, and histopathological findings in 178 patients. J Neurol
Neurosurg Psychiatry 1995; 58: 666–73.Woods RP, Mazziotta JC, Cherry SR. MRI-PET registration withautomated algorithm. J Comput Assist Tomogr 1993; 17: 536–46. Zubal IG, Spencer SS, Imam K, Seibyl J, Smith EO, Wisniewski
G, et al. Difference images calculated from ictal and interictalXue M, Ng TC, Modic M, Comair Y, Kolem H. Oblique angle
technetium-99m-HMPAO SPECT scans of epilepsy. J Nucl Medproton chemical shift imaging for the localization of hippocampal
1995; 36: 684–9.epilepsy. Society of magnetic resonance in medicine, 12th AnnualScientific Meeting, Book of Abstracts 1993: 435.
Xue M, Ng TC, Comair YG, Modic M, Luders H. Presurgical Received May 14, 1996. Revised September 16, 1996.Accepted October 1, 1996localization of temporal lobe epilepsy using noninvasive proton