Image-Processing Methods for Automated Distress...
7
TRANSPORTATION RESEARCH RECORD 1435 45 Image-Processing Methods for Automated Distress Evaluation VINOD K. l<ALIKIRI, NORMAN W. GARRICK, AND LUKE E. K. ACHENIE The collection and analysis of pavement distress data are the primary components of any pavement management system. There is an emerg- ing trend over the last decade to automate this process of data col- lection and analysis. Current research work at the University of Con- necticut aims at developing such an image data analysis system, compatible with the photolog system used by the Connecticut De- partment of Transportation for pavement distress surveys. The image data retrieved from the Connecticut photolog system cannot be used directly as input to the analysis system because of undesirable details such as shadows and random noise in the images. Therefore extensive image processing must be carried out before the image data are suit- able for use as input for analysis. An image-processing strategy that can be used with the images obtained from the Connecticut photolog system is presented. Topics discussed include image data digitization, format conversion, feature extraction techniques, and binary image manipulation. The binary images resulting from the process were found to be a very good representation of the actual distress conditions of the pavement and can readily serve as input to a pattern recognition system for analysis. An efficient pavement management system relies on the availa- bility of comprehensive and accurate distress data for the road network (1). The conventional method for collecting these data is a manual survey whereby the rater goes out in the field to inspect the condition of the roadway. Many users believe that there is a need to replace this manual data collection system with an auto- mated system that takes advantage of recent advances in computer technology. An automated system will eliminate problems such as safety hazards to field personnel, subjectivity of observations, and time constraints associated with the manual methods (2; K. R. Maser, unpublished data). Vehicles capable of photographing the pavement surface and storing the photographed images in a convenient form already have been developed, and a number of such systems have been tested and evaluated over the years (3; K. R. Maser, unpublished data). Many of these are used successfully by various highway agencies. Automation of the process of data analysis is the next step toward the development of a totally automated system (4,5). The emergence of computers with high-speed processing capabilities has laid the foundation for the application of image-processing and pattern-recognition techniques to achieve this objective. The current research work at the University of Connecticut (UCONN) aims at tackling this problem by developing an auto- mated pavement distress analysis system that is compatible with the photolog system already in use by the Connecticut Department of Transportation (ConnDOT). Principles of digital image pro- cessing, pattern recognition, and quantification through artificial Department of Civil Engineering, University of Connecticut, Storrs, Conn. 06269-3037. neural networks are J:>eing adopted to realize this objective. The image data being used for processing and analysis in the research work are taken from the photolog laser videodisc (PLV) collection at ConnDOT. The quality of the image data obtained by the Connecticut pho- tolog system is not ideal for processing because of factors such as variable illumination and shadows in the images. An image- processing strategy capable of compensating for these factors must be developed before the image can be used as input to the auto- mated system for analysis. In this paper one such strategy that was developed at UCONN to process the color images retrieved from the Connecticut PLV system' will be described. The strategy is designed to generate the type of quality data that can serve as input for a distress data analysis system. CONNECTICUT PHOTOLOG SYSTEM ConnDOT uses a 35-mm movie camera to photograph the pave- ment surface. It is mounted in a photologging van that travels at average speeds of 40 to 50 mph. The camera is angled down the road for a full perspective view through the windshield. The film is exposed at regular intervals of 0.01 mi to record pavement distresses, shoulder conditions, and roadside inventory data. In- formation about route, mileage, and other details required to iden- tify the roads being surveyed are also recorded through a keyboard. The exposed film is processed and transferred onto double- sided laser video discs. Each side of the video disc stores all the information pertaining to 265 mi of the roadway. This information includes a windshield view (Figure 1) and a close-up view (Figure 2). The close-up view is the view that is used in the manual rating system. At present the rating of the road images is carried out manually in the laboratory by personnel who record their observations di- rectly into a personal computer. ConnDOT surveys show that the raters complete between 115 and 150 frames each hour (2). In an average year, the 7,700 mi (3,850 mi in each direction) of highway network in Connecticut requires approximately 2.5 months (1,000 person-hr) to be rated. In view of the time required to rate the sections manually, ConnDOT has determined that not all the frames recorded by the photolog system for rating can be used. Therefore a sampling procedure has been adopted in which only 10 percent of the frames are rated (6). The overall cost involved with this setup is approximately $4.40/lane-mi surveyed (2). An automated system· would signifi- cantly reduce the cost and time needed to survey the roads and at the same time result in an objective evaluation of the pavement condition. It would also enable ConnDOT to use all the frames for rating rather than just the small fraction that is used now.
Transcript of Image-Processing Methods for Automated Distress...
TRANSPORTATION RESEARCH RECORD 1435 45
Image-Processing Methods for Automated Distress Evaluation
VINOD K. l<ALIKIRI, NORMAN W. GARRICK, AND LUKE E. K. ACHENIE
The collection and analysis of pavement distress data are the primary components of any pavement management system. There is an emerging trend over the last decade to automate this process of data collection and analysis. Current research work at the University of Connecticut aims at developing such an image data analysis system, compatible with the photolog system used by the Connecticut Department of Transportation for pavement distress surveys. The image data retrieved from the Connecticut photolog system cannot be used directly as input to the analysis system because of undesirable details such as shadows and random noise in the images. Therefore extensive image processing must be carried out before the image data are suitable for use as input for analysis. An image-processing strategy that can be used with the images obtained from the Connecticut photolog system is presented. Topics discussed include image data digitization, format conversion, feature extraction techniques, and binary image manipulation. The binary images resulting from the process were found to be a very good representation of the actual distress conditions of the pavement and can readily serve as input to a pattern recognition system for analysis.
An efficient pavement management system relies on the availability of comprehensive and accurate distress data for the road network (1). The conventional method for collecting these data is a manual survey whereby the rater goes out in the field to inspect the condition of the roadway. Many users believe that there is a need to replace this manual data collection system with an automated system that takes advantage of recent advances in computer technology. An automated system will eliminate problems such as safety hazards to field personnel, subjectivity of observations, and time constraints associated with the manual methods (2; K. R. Maser, unpublished data).
Vehicles capable of photographing the pavement surface and storing the photographed images in a convenient form already have been developed, and a number of such systems have been tested and evaluated over the years (3; K. R. Maser, unpublished data). Many of these are used successfully by various highway agencies.
Automation of the process of data analysis is the next step toward the development of a totally automated system (4,5). The emergence of computers with high-speed processing capabilities has laid the foundation for the application of image-processing and pattern-recognition techniques to achieve this objective.
The current research work at the University of Connecticut (UCONN) aims at tackling this problem by developing an automated pavement distress analysis system that is compatible with the photolog system already in use by the Connecticut Department of Transportation (ConnDOT). Principles of digital image processing, pattern recognition, and quantification through artificial
Department of Civil Engineering, University of Connecticut, Storrs, Conn. 06269-3037.
neural networks are J:>eing adopted to realize this objective. The image data being used for processing and analysis in the research work are taken from the photolog laser videodisc (PLV) collection at ConnDOT.
The quality of the image data obtained by the Connecticut photolog system is not ideal for processing because of factors such as variable illumination and shadows in the images. An imageprocessing strategy capable of compensating for these factors must be developed before the image can be used as input to the automated system for analysis. In this paper one such strategy that was developed at UCONN to process the color images retrieved from the Connecticut PLV system' will be described. The strategy is designed to generate the type of quality data that can serve as input for a distress data analysis system.
CONNECTICUT PHOTOLOG SYSTEM
ConnDOT uses a 35-mm movie camera to photograph the pavement surface. It is mounted in a photologging van that travels at average speeds of 40 to 50 mph. The camera is angled down the road for a full perspective view through the windshield. The film is exposed at regular intervals of 0.01 mi to record pavement distresses, shoulder conditions, and roadside inventory data. Information about route, mileage, and other details required to identify the roads being surveyed are also recorded through a keyboard.
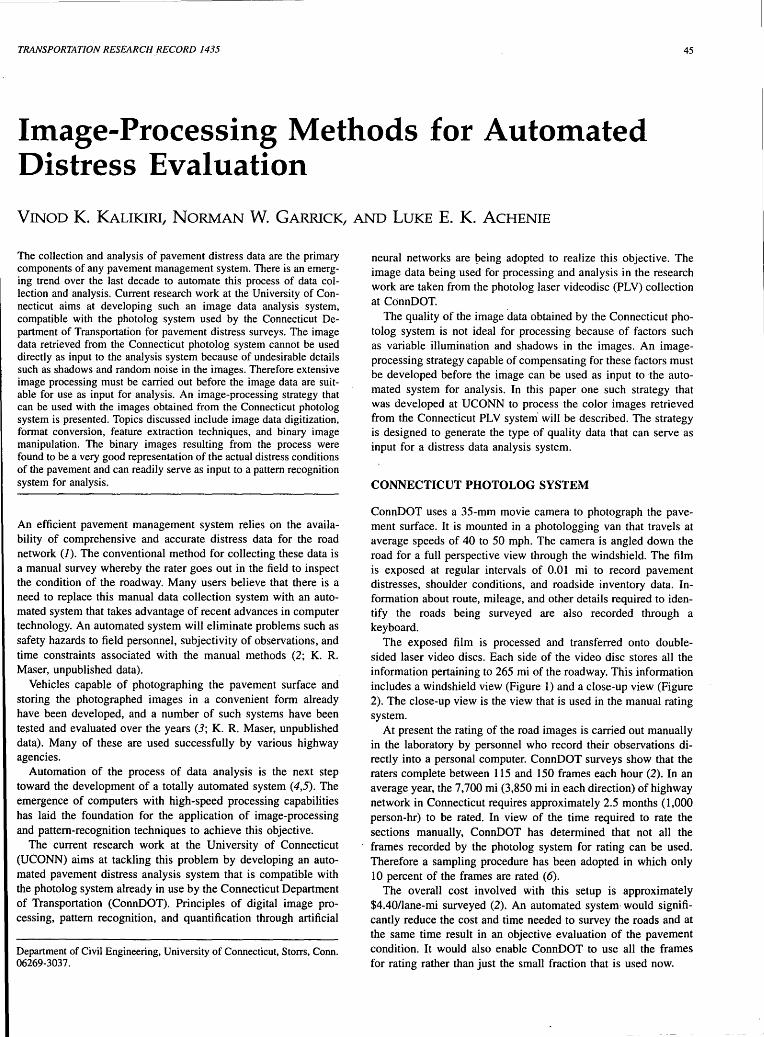
The exposed film is processed and transferred onto doublesided laser video discs. Each side of the video disc stores all the information pertaining to 265 mi of the roadway. This information includes a windshield view (Figure 1) and a close-up view (Figure 2). The close-up view is the view that is used in the manual rating system.
At present the rating of the road images is carried out manually in the laboratory by personnel who record their observations directly into a personal computer. ConnDOT surveys show that the raters complete between 115 and 150 frames each hour (2). In an average year, the 7,700 mi (3,850 mi in each direction) of highway network in Connecticut requires approximately 2.5 months (1,000 person-hr) to be rated. In view of the time required to rate the sections manually, ConnDOT has determined that not all the frames recorded by the photolog system for rating can be used. Therefore a sampling procedure has been adopted in which only 10 percent of the frames are rated (6).
The overall cost involved with this setup is approximately $4.40/lane-mi surveyed (2). An automated system· would significantly reduce the cost and time needed to survey the roads and at the same time result in an objective evaluation of the pavement condition. It would also enable ConnDOT to use all the frames for rating rather than just the small fraction that is used now.
46
FIGURE 1 Windshield view captured by the photolog vehicle.
The image data available as input for the automated system needs to be processed before they can be used for analysis. The extent of processing depends on the configuration of the data acquisition system being used. Images from the ConnDOT PLV system are particularly difficult to process efficiently because of the following characteristic features of the system:
1. The windshield view, which facilitates the collection of roadside inventory data along with the pavement surface data, invariably imparts a perspective effect in the image. This effect reduces the accuracy of the information recorded in the upper portions of the image.
2. Nonuniform illumination and highly variable image brightness and contrast values are encountered because of the natural lighting conditions during the survey. These defects result in noisy images that must be corrected by adopting suitable imageprocessing techniques.
3. Redundant features recorded in the image (such as turfed shoulders, trees, and roadside inventory) must be eliminated to isolate distressed portions of the roadway.
4. Shadows cast on the pavement by overhead power lines and trees mimic the presence of distresses, thereby complicating the task of implementing a totally automated machine vision system.
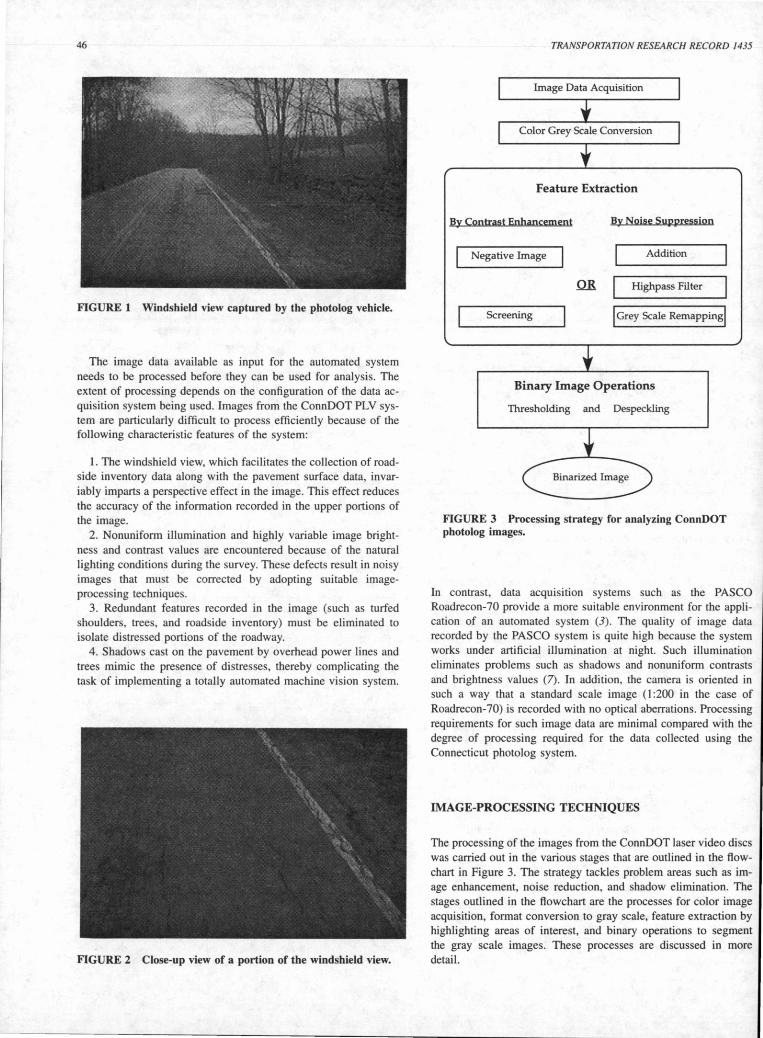
FIGURE 2 Close-up view of a portion of the windshield view.
TRANSPORTATION RESEARCH RECORD 1435
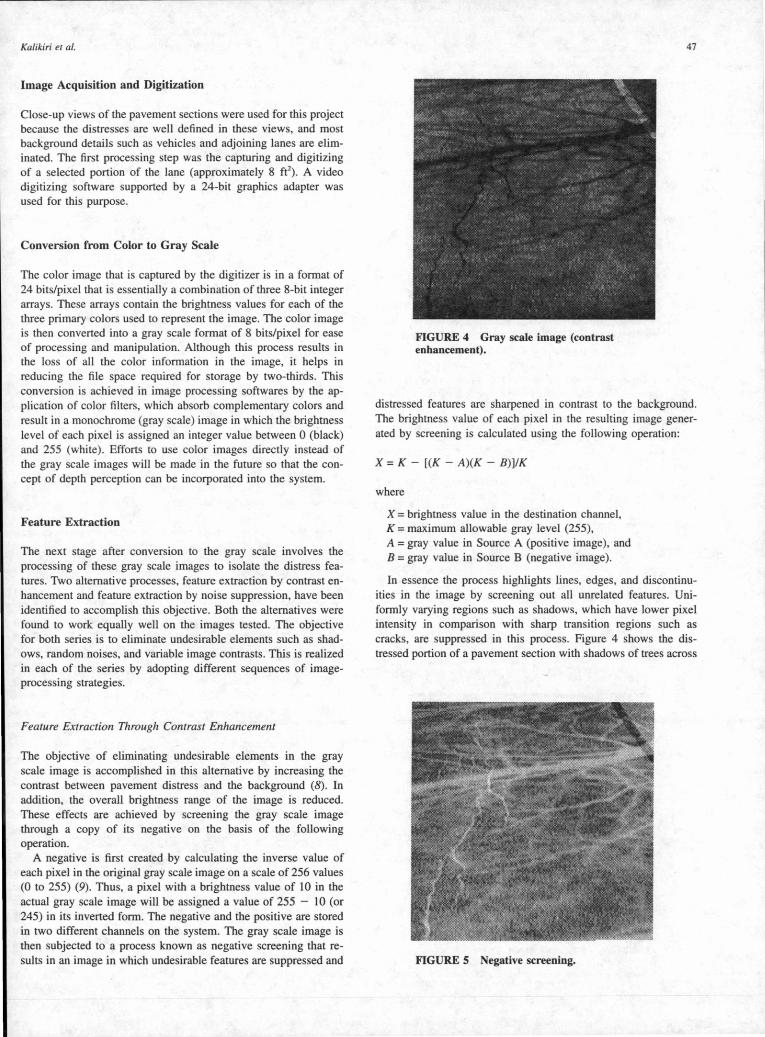
Image Data Acquisition
Color Grey Scale Conversion
Feature Extraction
By Contrast Enhancement By Noise Suppression
Negative Image Addition
OR Highpass Filter
Screening I Grey Scale Remapping!
Binary Image Operations
Thresholding and Despeckling
FIGURE 3 Processing strategy for analyzing ConnDOT photolog images.
In contrast, data acqms1tion systems such as the PASCO Roadrecon-70 provide a more suitable environment for the application of an automated system (3). The quality of image data recorded by the PASCO system is quite high because the system works under artificial illumination at night. Such illumination eliminates problems such as shadows and nonuniform contrasts and brightness values (7). In addition, the camera is oriented in such a way that a standard scale image (1 :200 in the case of Roadrecon-70) is recorded with no optical aberrations. Processing requirements for such image data are minimal compared with the degree of processing required for the data collected using the Connecticut photolog system.
IMAGE-PROCESSING TECHNIQUES
The processing of the images from the ConnDOT laser video discs was carried out in the various stages that are outlined in the flowchart in Figure 3. The strategy tackles problem areas such as image enhancement, noise reduction, and shadow elimination. The stages outlined in the flowchart are the processes for color image acquisition, format conversion to gray scale, feature extraction by highlighting areas of interest, and binary operations to segment the gray scale images. These processes are discussed in more detail.
Kalikiri et al.
Image Acquisition and Digitization
Close-up views of the pavement sections were used for this project because the distresses are well defined in these views, and most background details such as vehicles and adjoining lanes are eliminated. The first processing step was the capturing and digitizing of a selected portion of the lane (approximately 8 ft2). A video digitizing software supported by a 24-bit graphics adapter was used for this purpose.
Conversion from Color to Gray Scale
The color image that is captured by the digitizer is in a format of 24 bits/pixel that is essentially a combination of three 8-bit integer arrays. These arrays contain the brightness values for each of the three primary colors used to represent the image. The color image is then converted into a gray scale format of 8 bits/pixel for ease of processing and manipulation. Although this process results in the loss of all the color information in the image, it helps in reducing the file space required for storage by two-thirds. This conversion is achieved in image processing softwares by the application of color filters, which absorb complementary colors and result in a monochrome (gray scale) image in which the brightness level of each pixel is assigned an integer value between 0 (black) and 255 (white). Efforts to use color images directly instead of the gray scale images will be made in the future so that the concept of depth perception can be incorporated into the system.
Feature Extraction
The next stage after conversion to the gray scale involves the processing of these gray scale images to isolate the distress features. Two alternative processes, feature extraction by contrast enhancement and feature extraction by noise suppression, have been identified to accomplish this objective. Both the alternatives were found to work equally well on the images tested. The objective for both series is to eliminate undesirable elements such as shadows, random noises, and variable image contrasts. This is realized in each of the series by adopting different sequences of imageprocessing strategies.
Feature Extraction Through Contrast Enhancement
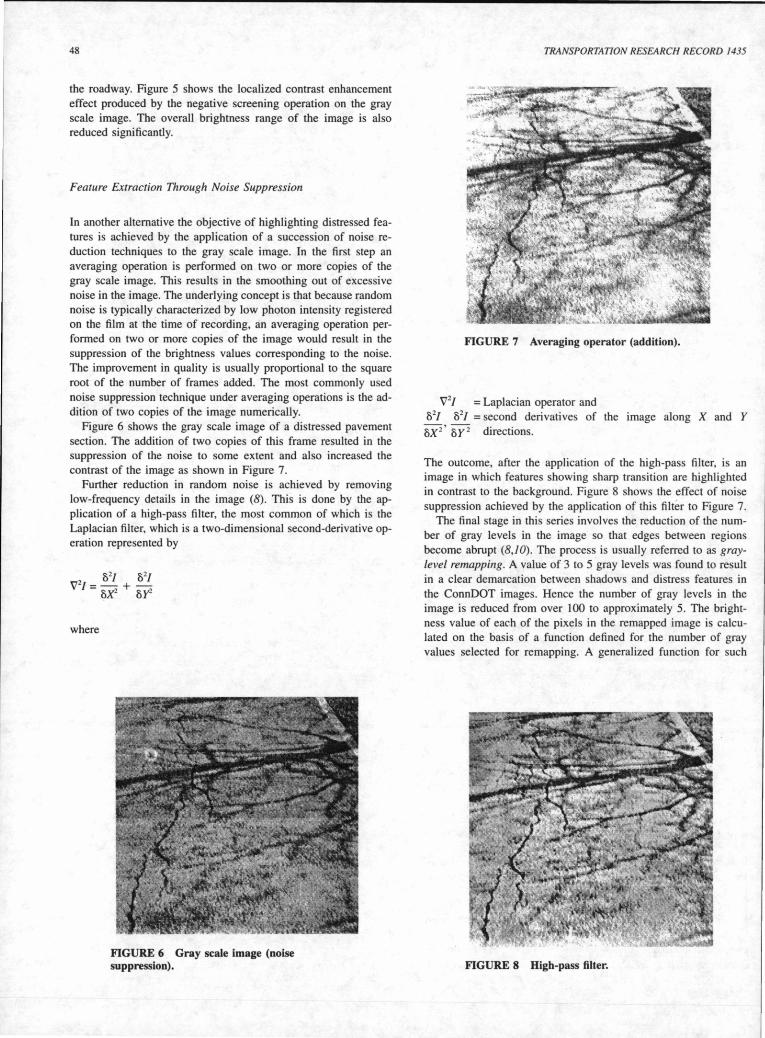
The objective of eliminating undesirable elements in the gray scale image is accomplished in this alternative by increasing the contrast between pavement distress and the background (8). In addition, the overall brightness range of the image is reduced. These effects are achieved by screening the gray scale image through a copy of its negative on the basis of the following operation.
A negative is first created by calculating the inverse value of each pixel in the original gray scale image on a scale of 256 values (0 to 255) (9). Thus, a pixel with a brightness value of 10 in the actual gray scale image will be assigned a value of 255 - 10 (or 245) in its inverted form. The negative and the positive are stored in two different channels on the system. The gray scale image is then subjected to a process known as negative screening that results in an image in which undesirable features are suppressed and
FIGURE 4 Gray scale image (contrast enhancement).
47
distressed features are sharpened in contrast to the background. The brightness value of each pixel in the resulting image generated by screening is calculated using the following operation:
X = K - [(K - A)(K - B)]IK
where
X = brightness value in the destination channel, K = maximum allowable gray level (255), A= gray value in Source A (positive image), and B =gray value in Source B (negative image).
In essence the process highlights lines, edges, and discontinuities in the image by screening out all unrelated features. Uniformly varying regions such as shadows, which have lower pixel intensity in comparison with sharp transition regions such as cracks, are suppressed in this process. Figure 4 shows the distressed portion of a pavement section with shadows of trees across
FIGURE S Negative screening.
48
the roadway. Figure 5 shows the localized contrast enhancement effect produced by the negative screening operation on the gray scale image. The overall brightness range of the image is also reduced significantly.
Feature Extraction Through Noise Suppression
In another alternative the objective of highlighting distressed features is achieved by the application of a succession of noise reduction techniques to the gray scale image. In the first step an averaging operation is performed on two or more copies of the gray scale image. This results in the smoothing out of excessive noise in the image. The underlying concept is that because random noise is typically characterized by low photon intensity registered on the film at the time of recording, an averaging operation performed on two or more copies of the image would result in the suppression of the brightness values corresponding to the noise. The improvement in quality is usually proportional to the square root of the number of frames added. The most commonly used noise suppression technique under averaging operations is the addition of two copies of the image numerically.
Figure 6 shows the gray scale image of a distressed pavement section. The addition of two copies of this frame resulted in the suppression of the noise to some extent and also increased the contrast of the image as shown in Figure 7.
Further reduction in random noise is achieved by removing low-frequency details in the image (8). This is done by the application of a high-pass filter, the most common of which is the Laplacian filter, which is a two-dimensional second-derivative operation represented by
where
FIGURE 6 Gray scale image (noise suppression).
TRANSPORTATION RESEARCH RECORD 1435
FIGURE 7 Averaging operator (addition).
\/2
/ = Laplacian operator and 'f// 'fl! =second derivatives of the image along X and Y 8X2 ' 8Y 2 directions.
The outcome, after the application of the high-pass filter, is an image in which features showing sharp transition are highlighted in contrast to the background. Figure 8 shows the effect of noise suppression achieved by the application of this filter to Figure 7.
The final stage in this series involves the reduction of the number of gray levels in the image so that edges between regions become abrupt (8,10). The process is usually referred to as graylevel remapping. A value of 3 to 5 gray levels was found to result in a clear demarcation between shadows and distress features in the ConnDOT images. Hence the number of gray levels in the image is reduced from over 100 to approximately 5. The brightness value of each of the pixels in the remapped image is calculated on the basis of a function defined for the number of gray values selected for remapping. A generalized function for such
FIGURE 8 High-pass filter.
Kalikiri et al.
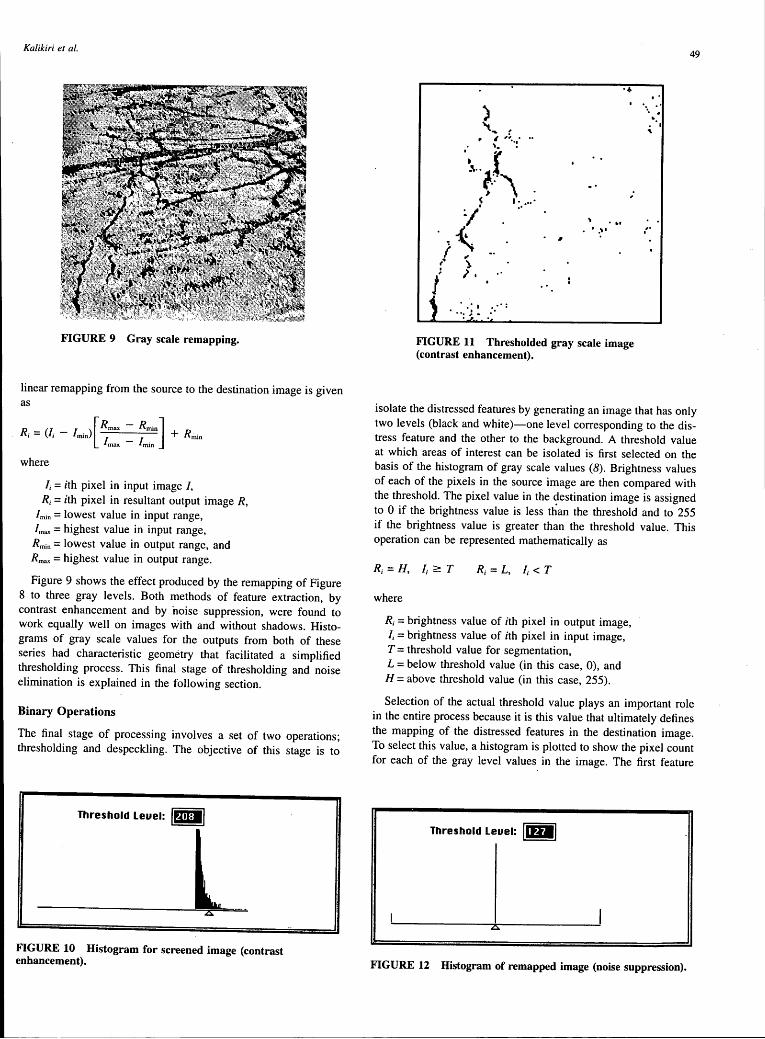
FIGURE 9 Gray scale remapping.
linear remapping from the source to the destination image is given as
R; = (I; - /"'">[ ~= = ::."] + R"'"
where
I; = ith pixel in input image /, R; = ith pixel in resultant output image R,
/min= lowest value in input range, /max= highest value in input range,
Rmin = lowest value in output range, and Rmax = highest value in output range.
Figure 9 shows the effect produced by the remapping of Figure 8 to three gray levels. Both methods of feature extraction, by contrast enhancement and by noise suppression, were found to work equally well on images with and without shadows. Histograms of gray scale values for the outputs from both of these series had characteristic geometry that facilitated a simplified thresholding process. This final stage of thresholding and noise elimination is explained in the following section.
Binary Operations
The final stage of processing involves a set of two operations; thresholding and despeckling. The objective of this stage is to
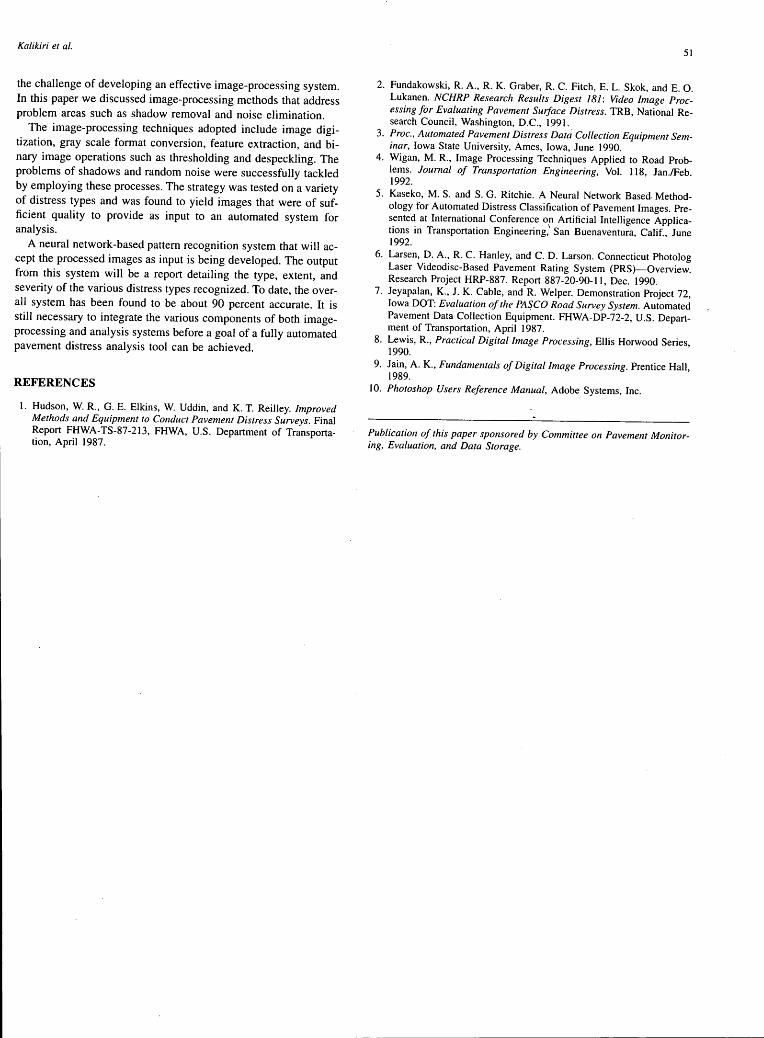
Threshold Leuel: lt·M=•I
FIGURE 10 Histogram for screened image (contrast enhancement).
) 'l... , ' ,;···· ..
\ .. J &; .... ,
< I .•••. :;' ..
~~ I "' ,. ).
: ) I J I
{ •• • 1 ·:·= 1 . ··: ~.
. .. I •'I
·+ I•
I • ••• •. .
:
,. I
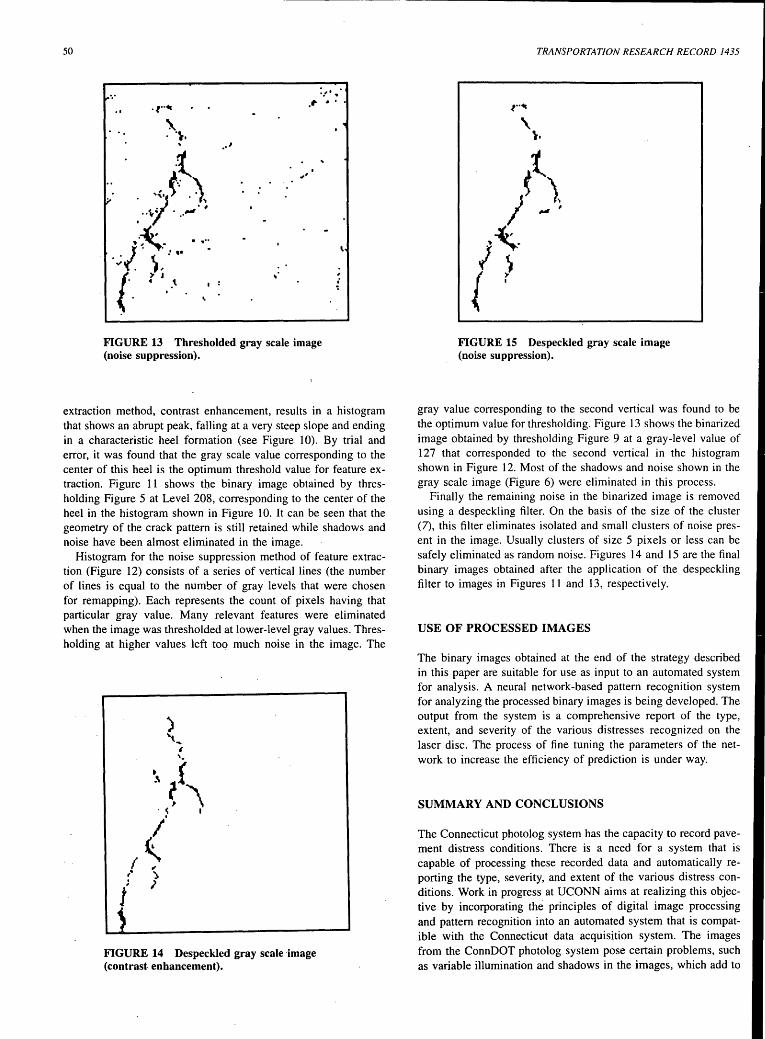
FIGURE 11 Thresholded gray scale image (contrast enhancement).
49
isolate the distressed features by generating an image that has only two levels (black and white)-one level corresponding to the distress feature and the other to the background. A threshold value at which areas of interest can be isolated is first selected on the basis of the histogram of gray scale values (8). Brightness values of each of the pixels in the source image are then compared with the threshold. The pixel value in the destination image is assigned to O if the brightness value is less than the threshold and to 255 if the brightness value is greater than the threshold value. This operation can be represented mathematically as
R; = H, I;~ T R; = L, I;< T
where
R; = brightness value of ith pixel in output image, I; = brightness value of ith pixel in input image, T = threshold value for segmentation, L = below threshold value (in this case, 0), and H = above threshold value (in this case, 255).
Selection of the actual threshold value plays an important role in the entire process because it is this value that ultimately defines the mapping of the distressed features in the destination image. To select this value, a histogram is plotted to show the pixel count for each of the gray level values in the image. The first feature
Threshold Leuel: jitpj
FIGURE 12 Histogram of remapped image (noise suppression).
50
,.·.· ·l"~
' '\, ·t
. ;;·.{· f .\ ··\· ... ~
I
~·~- .... ·./. .• .. ·~ . ),
{
)' J
. . . . . ·' I :
•.'I•
·"
··'
...
FIGURE 13 Thresholded gray scale image (noise suppression).
extraction method, contrast enhancement, results in a histogram that shows an abrupt peak, falling at a very steep slope and ending in a characteristic heel formation (see Figure 10). By trial and error, it was found that the gray scale value corresponding to the center of this heel is the optimum threshold value for feature extraction. Figure 11 shows tbe binary image obtained by thresholding Figure 5 at Level 208, corresponding to the center of the heel in the histogram shown in Figure 10. It can be seen that the geometry of the crack pattern is still retained while shadows and noise have been almost eliminated in the image.
Histogram for the noise suppression method of feature extraction (Figure 12) consists of a series of vertical lines (the number of lines is equal to the number of gray levels that were chosen for remapping). Each represents the count of pixels having that particular gray value. Many relevant features were eliminated when the image was thresholded at lower-level gray values. Thresholding at higher values left too much noise in the image. The
) .........
' ,_
FIGURE 14 Despeckled gray scale image (contrast enhancement).
TRANSPORTATION RESEARCH RECORD 1435
\ \,
FIGURE 15 Despeckled gray scale image (noise suppression).
gray value corresponding to the second vertical was found to be the optimum value for thresholding. Figure 13 shows the binarized image obtained by thresholding Figure 9 at a gray-level value of 127 that corresponded to the second vertical in the histogram shown in Figure 12. Most of the shadows and noise shown in the gray scale image (Figure 6) were eliminated in this process.
Finally the remaining noise in the binarized image is removed using a despeckling filter. On the basis of the size of the cluster (7), this filter eliminates isolated and small clusters of noise present in the image. Usually clusters of size 5 pixels or less can be safely eliminated as random noise. Figures 14 and 15 are the final binary images obtained after the application of the despeckling filter to images in Figures 11 and 13, respectively.
USE OF PROCESSED IMAGES
The binary images obtained at the end of the strategy described in this paper are suitable for use as input to an automated system for analysis. A neural network-based pattern recognition system for analyzing the processed binary images is being developed. The output from the system is a comprehensive report of the type, extent, and severity of the various distresses recognized on the laser disc. The process of fine tuning the parameters of the network to increase the efficiency of prediction is under way.
SUMMARY AND CONCLUSIONS
The Connecticut photolog system has the capacity to record pavement distress conditions. There is a need for a system that is capable of processing these recorded data and automatically reporting the type, severity, and extent of the various distress conditions. Work in progress at UCONN aims at realizing this objective by incorporating the principles of digital image processing and pattern recognition into an automated system that is compatible with the Connecticut data acquisition system. The images from the ConnDOT photolog system pose certain problems, such as variable illumination and shadows in the images, which add to
Kalikiri et al.
the challenge of developing an effective image-processing system. In this paper we discussed image-processing methods that address problem areas such as shadow removal and noise elimination.
The image-processing techniques adopted include image digitization, gray scale format conversion, feature extraction, and binary image operations such as thresholding and despeckling. The problems of shadows and random noise were successfully tackled by employing these processes. The strategy was tested on a variety of distress types and was found to yield images that were of sufficient quality to provide as input to an automated system for analysis.
A neural network-based pattern recognition system that will accept the processed images as input is being developed. The output from this system will be a report detailing the type, extent, and severity of the various distress types recognized. To date, the overall system has been found to be about 90 percent accurate. It is still necessary to integrate the various components of both imageprocessing and analysis systems before a goal of a fully automated pavement distress analysis tool can be achieved.
REFERENCES
1. Hudson, W.R., G. E. Elkins, W. Uddin, and K. T. Reilley. Improved Methods and Equipment to Conduct Pavement Distress Surveys. Final Report FHWA-TS-87-213, FHWA, U.S. Department of Transportation, April 1987.
51
2. Fundakowski, R. A., R. K. Graber, R. C. Fitch, E. L. Skok, and E. O. Lukanen. NCHRP Research Results Digest 181: Video Image Processing for Evaluating Pavement Surface Distress. TRB, National Research Council, Washington, D.C., 1991.
3. Proc., Automated Pavement Distress Data Collection Equipment Seminar, Iowa State University, Ames, Iowa, June 1990.
4. Wigan, M. R., Image Processing Techniques Applied to Road Problems. Journal of Transportation Engineering, Vol. 118, Jan./Feb. 1992.
5. Kaseko, M. S. and S. G. Ritchie. A Neural Network Based Methodology for Automated Distress Classification of Pavement Images. Presented at International Conference on Artificial Intelligence Applications in Transportation Engineering,' San Buenaventura, Calif., June 1992.
6. Larsen, D. A., R. C. Hanley, and C. D. Larson. Connecticut Photolog Laser Videodisc-Based Pavement Rating System (PRS)-Overview. Research Project HRP-887. Report 887-20-90-11, Dec. 1990.
7. Jeyapalan, K., J. K. Cable, and R. Welper. Demonstration Project 72, Iowa DOT: Evaluation of the PASCO Road Survey System. Automated Pavement Data Collection Equipment. FHWA-DP-72-2, U.S. Department of Transportation, April 1987.
8. Lewis, R., Practical Digital Image Processing, Ellis Horwood Series, 1990.
9. Jain, A. K., Fundamentals of Digital Image Processing. Prentice Hall, 1989.
10. Photoshop Users Reference Manual, Adobe Systems, Inc.
Publication of this paper sponsored by Committee on Pavement Monitoring, Evaluation, and Data Storage.