IMAGE ANALYSIS QUANTIFICATION OF ANGIOGENESIS
12
Image Anal Stereol 2005;24:169-180 Original Research Paper 169 QUANTIFICATION OF ANGIOGENESIS IN THE CHICKEN CHORIOALLANTOIC MEMBRANE (CAM) SILVIA BLACHER 1 , LAETITIA DEVY 1 , RUSLAN HLUSHCHUK 2 , ETIENNE LARGER 3 , NOEL LAMAND 3 , PETER BURRI 2 , PIERRE CORVOL 3 , VALENTIN DJONOV 2 , JEAN-MICHEL FOIDART 1 AND AGNES NO¸L 1 1 Laboratory of Tumor and Development Biology, University of LiLge, Tour de Pathologie (B23), Sart-Tilman; B-4000 LiLge; 2 Institute of Anatomy, University of Berne, Buehlstrasse 26, 3012 Berne, Switzerland; 3 INSERM U-36-College de France, 11, Place Marcelin Berthelot, 75231 Paris Cedex 05, France e-mail: [email protected] (Accepted June 29, 2005) ABSTRACT The chick chorioallantoic membrane (CAM) provides a suitable in vivo model to study angiogenesis and evaluate several pro- and anti-angiogenic factors and compounds. In the present work, new developments in image analysis are used to quantify CAM angiogenic response from optical microscopic observations, covering all vascular components, from the large supplying and feeding vessels down to the capillary plexus. To validate our methodology angiogenesis is quantified during two phases of CAM development (day 7 and 13) and after treatment with an antiangiogenic modulator of the angiogenesis. Our morphometric analysis emphasizes that an accurate quantification of the CAM vasculature needs to be performed at various scales. Keywords: angiogenesis, CAM model, image analysis, mathematical morphology. INTRODUCTION The chick chorioallantoic membrane (CAM) is formed by the fusion of the chorion with the allantoic membrane. In this double mesodermic layer, an extremely rich vascular network develops and serves as the respiratory organ of the embryo until the time of hatching. CAM vascularization is characterized by a dense network of arteries and veins from which a delicate and intricate capillary plexus is formed. Initially, the CAM was used as an in vivo assay to study angiogenesis, the budding and sprouting of blood vessels from pre-existing ones. The later process has been shown to take place in numerous physiological and pathological processes (Pepper et al., 1996; Auerbach et al., 1997; Ausprunk and Folkman, 1997; Carmeliet and Collen, 2000; Auerbach et al., 2003; Carmeliet, 2003). More recently, several reports indicate that the process of intussuception, initially described during the postnatal lung development (Caduff et al., 1986; Burri and Tarek, 1990), plays a crucial role in capillary network formation of the CAM (Patan et al., 1993; 1996; Djonov et al., 2000a, b; 2002). Intussuception occurs by internal division of the pre-existing capillary plexus without sprouting. It involves enlargement of capillaries and small supplying vessels which sub-sequently become divided by transluminal tissue pillars. Intu- ssusception leads to vascular beds expansion, increasing capillary network complexity, vascular surface and volume. The CAM assay provides a suitable model to assess the effects of angiogenic or anti-angiogenic agents. However, the quantification of those effects is not easy. Actually, large vessel-counting methods based on visual examination, manual vessel counts or global measurements of the spatial pattern and distribution of vascular network, is usually used. The following methods have been used to quantify image obtained from light microscope observations: (a) blood vessels enclosed in a silicone ring laid randomly in a treated zone are manually counted (DeFouw et al., 1989; CØlØrier et al., 2002); (b) binary images of vessels are manually drawn or automatically thres- holded and then global parameters like vessel areal density (Rieder et al., 1995), vessel length density (Strick et al., 1991), fractal dimension (Kirshner et al., 1996; Parsons-Wingerter et al., 1998; Vico et al., 1988; Parsons-Wingerter et al., 2000) or complexity measurements (Sandau and Kurz, 1997; Kurz et al., 1998) are determined; (c) individual parameters like the end-points (Strick et al., 1991), number of drawn vessels (Strick et al., 1991) and the length density of radially arranged capillaries during vasculogenesis
Transcript of IMAGE ANALYSIS QUANTIFICATION OF ANGIOGENESIS

Image Anal Stereol 2005;24:169-180Original Research Paper
169
QUANTIFICATION OF ANGIOGENESIS IN THE CHICKENCHORIOALLANTOIC MEMBRANE (CAM)
SILVIA BLACHER1, LAETITIA DEVY1, RUSLAN HLUSHCHUK2, ETIENNE LARGER3, NOELLAMANDÉ3, PETER BURRI2, PIERRE CORVOL3, VALENTIN DJONOV2, JEAN-MICHEL FOIDART1
AND AGNES NOËL1
1Laboratory of Tumor and Development Biology, University of Liège, Tour de Pathologie (B23), Sart-Tilman;B-4000 Liège; 2Institute of Anatomy, University of Berne, Buehlstrasse 26, 3012 Berne, Switzerland;3INSERM U-36-College de France, 11, Place Marcelin Berthelot, 75231 Paris Cedex 05, Francee-mail: [email protected](Accepted June 29, 2005)
ABSTRACT
The chick chorioallantoic membrane (CAM) provides a suitable in vivo model to study angiogenesis andevaluate several pro- and anti-angiogenic factors and compounds. In the present work, new developments inimage analysis are used to quantify CAM angiogenic response from optical microscopic observations,covering all vascular components, from the large supplying and feeding vessels down to the capillary plexus.To validate our methodology angiogenesis is quantified during two phases of CAM development (day 7 and13) and after treatment with an antiangiogenic modulator of the angiogenesis. Our morphometric analysisemphasizes that an accurate quantification of the CAM vasculature needs to be performed at various scales.
Keywords: angiogenesis, CAM model, image analysis, mathematical morphology.
INTRODUCTION
The chick chorioallantoic membrane (CAM) isformed by the fusion of the chorion with the allantoicmembrane. In this double mesodermic layer, anextremely rich vascular network develops and servesas the respiratory organ of the embryo until the timeof hatching. CAM vascularization is characterized bya dense network of arteries and veins from which adelicate and intricate capillary plexus is formed.Initially, the CAM was used as an in vivo assay tostudy angiogenesis, the budding and sprouting ofblood vessels from pre-existing ones. The laterprocess has been shown to take place in numerousphysiological and pathological processes (Pepper etal., 1996; Auerbach et al., 1997; Ausprunk andFolkman, 1997; Carmeliet and Collen, 2000; Auerbachet al., 2003; Carmeliet, 2003). More recently, severalreports indicate that the process of intussuception,initially described during the postnatal lungdevelopment (Caduff et al., 1986; Burri and Tarek,1990), plays a crucial role in capillary networkformation of the CAM (Patan et al., 1993; 1996;Djonov et al., 2000a, b; 2002). Intussuception occurs byinternal division of the pre-existing capillary plexuswithout sprouting. It involves enlargement of capillariesand small supplying vessels which sub-sequently
become divided by transluminal tissue pillars. Intu-ssusception leads to vascular beds expansion, increasingcapillary network complexity, vascular surface andvolume.
The CAM assay provides a suitable model toassess the effects of angiogenic or anti-angiogenicagents. However, the quantification of those effects isnot easy. Actually, large vessel-counting methodsbased on visual examination, manual vessel counts orglobal measurements of the spatial pattern anddistribution of vascular network, is usually used. Thefollowing methods have been used to quantify imageobtained from light microscope observations: (a)blood vessels enclosed in a silicone ring laid randomlyin a treated zone are manually counted (DeFouw etal., 1989; Célérier et al., 2002); (b) binary images ofvessels are manually drawn or automatically thres-holded and then global parameters like vessel arealdensity (Rieder et al., 1995), vessel length density(Strick et al., 1991), fractal dimension (Kirshner et al.,1996; Parsons-Wingerter et al., 1998; Vico et al.,1988; Parsons-Wingerter et al., 2000) or complexitymeasurements (Sandau and Kurz, 1997; Kurz et al.,1998) are determined; (c) individual parameters likethe end-points (Strick et al., 1991), number of drawnvessels (Strick et al., 1991) and the length density ofradially arranged capillaries during vasculogenesis
BLACHER S ET AL: Quantification of angiogenesis in the CAM model
170
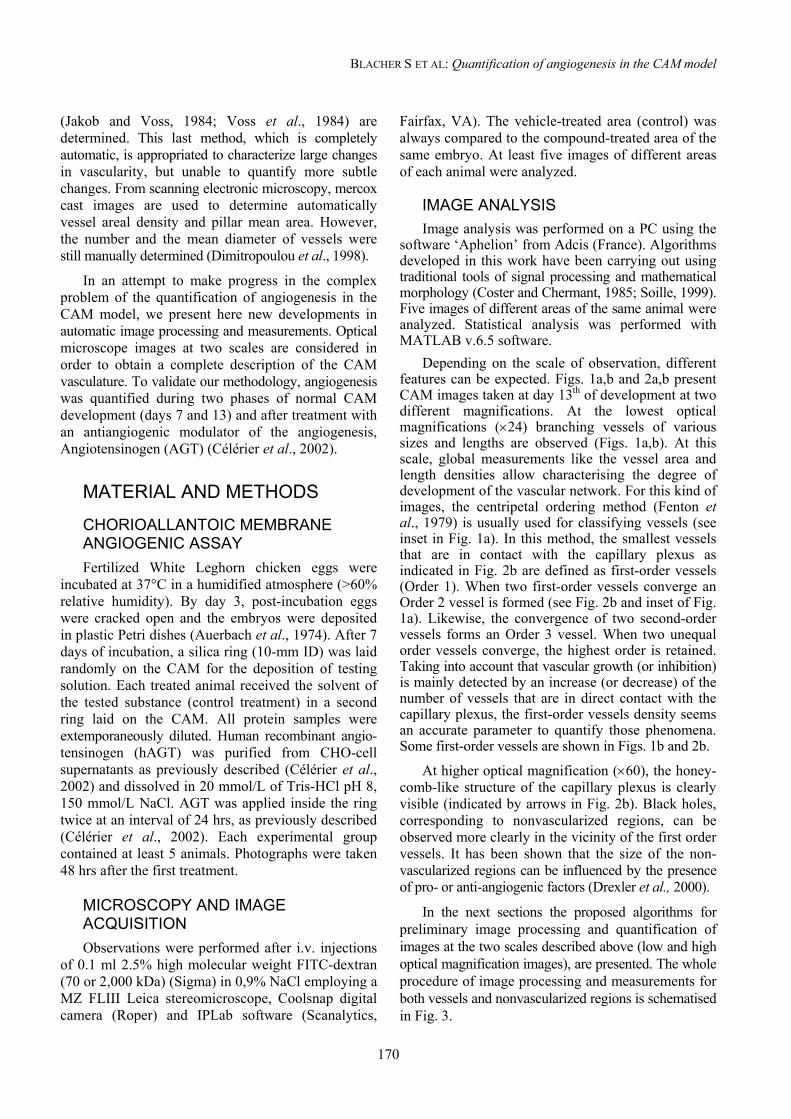
(Jakob and Voss, 1984; Voss et al., 1984) aredetermined. This last method, which is completelyautomatic, is appropriated to characterize large changesin vascularity, but unable to quantify more subtlechanges. From scanning electronic microscopy, mercoxcast images are used to determine automaticallyvessel areal density and pillar mean area. However,the number and the mean diameter of vessels werestill manually determined (Dimitropoulou et al., 1998).
In an attempt to make progress in the complexproblem of the quantification of angiogenesis in theCAM model, we present here new developments inautomatic image processing and measurements. Opticalmicroscope images at two scales are considered inorder to obtain a complete description of the CAMvasculature. To validate our methodology, angiogenesiswas quantified during two phases of normal CAMdevelopment (days 7 and 13) and after treatment withan antiangiogenic modulator of the angiogenesis,Angiotensinogen (AGT) (Célérier et al., 2002).
MATERIAL AND METHODS
CHORIOALLANTOIC MEMBRANEANGIOGENIC ASSAYFertilized White Leghorn chicken eggs were
incubated at 37°C in a humidified atmosphere (>60%relative humidity). By day 3, post-incubation eggswere cracked open and the embryos were depositedin plastic Petri dishes (Auerbach et al., 1974). After 7days of incubation, a silica ring (10-mm ID) was laidrandomly on the CAM for the deposition of testingsolution. Each treated animal received the solvent ofthe tested substance (control treatment) in a secondring laid on the CAM. All protein samples wereextemporaneously diluted. Human recombinant angio-tensinogen (hAGT) was purified from CHO-cellsupernatants as previously described (Célérier et al.,2002) and dissolved in 20 mmol/L of Tris-HCl pH 8,150 mmol/L NaCl. AGT was applied inside the ringtwice at an interval of 24 hrs, as previously described(Célérier et al., 2002). Each experimental groupcontained at least 5 animals. Photographs were taken48 hrs after the first treatment.
MICROSCOPY AND IMAGEACQUISITIONObservations were performed after i.v. injections
of 0.1 ml 2.5% high molecular weight FITC-dextran(70 or 2,000 kDa) (Sigma) in 0,9% NaCl employing aMZ FLIII Leica stereomicroscope, Coolsnap digitalcamera (Roper) and IPLab software (Scanalytics,
Fairfax, VA). The vehicle-treated area (control) wasalways compared to the compound-treated area of thesame embryo. At least five images of different areasof each animal were analyzed.
IMAGE ANALYSISImage analysis was performed on a PC using the
software �Aphelion� from Adcis (France). Algorithmsdeveloped in this work have been carrying out usingtraditional tools of signal processing and mathematicalmorphology (Coster and Chermant, 1985; Soille, 1999).Five images of different areas of the same animal wereanalyzed. Statistical analysis was performed withMATLAB v.6.5 software.
Depending on the scale of observation, differentfeatures can be expected. Figs. 1a,b and 2a,b presentCAM images taken at day 13th of development at twodifferent magnifications. At the lowest opticalmagnifications (×24) branching vessels of varioussizes and lengths are observed (Figs. 1a,b). At thisscale, global measurements like the vessel area andlength densities allow characterising the degree ofdevelopment of the vascular network. For this kind ofimages, the centripetal ordering method (Fenton etal., 1979) is usually used for classifying vessels (seeinset in Fig. 1a). In this method, the smallest vesselsthat are in contact with the capillary plexus asindicated in Fig. 2b are defined as first-order vessels(Order 1). When two first-order vessels converge anOrder 2 vessel is formed (see Fig. 2b and inset of Fig.1a). Likewise, the convergence of two second-ordervessels forms an Order 3 vessel. When two unequalorder vessels converge, the highest order is retained.Taking into account that vascular growth (or inhibition)is mainly detected by an increase (or decrease) of thenumber of vessels that are in direct contact with thecapillary plexus, the first-order vessels density seemsan accurate parameter to quantify those phenomena.Some first-order vessels are shown in Figs. 1b and 2b.
At higher optical magnification (×60), the honey-comb-like structure of the capillary plexus is clearlyvisible (indicated by arrows in Fig. 2b). Black holes,corresponding to nonvascularized regions, can beobserved more clearly in the vicinity of the first ordervessels. It has been shown that the size of the non-vascularized regions can be influenced by the presenceof pro- or anti-angiogenic factors (Drexler et al., 2000).
In the next sections the proposed algorithms forpreliminary image processing and quantification ofimages at the two scales described above (low and highoptical magnification images), are presented. The wholeprocedure of image processing and measurements forboth vessels and nonvascularized regions is schematisedin Fig. 3.

Image Anal Stereol 2005;24:169-180
171
a2 mm
21
3
1
1
11
e f
g
b
c d
Fig. 1. Binary processing of vessel images at low magnification (×24). (a): Original RGB colour image, andprinciple of centripetal ordering of the vessels, (b): histogram equalization of the green channel image. Arrowsindicate the end of some first-order vessels, (c): extraction of large vessels, (d) extraction of small vessels(venules and arterioles), (e): noisy binary image in which some vessels are disconnected, (f): final binaryimage, (g): skeletonized binary image in which dots represent the end-point vessels (g).

BLACHER S ET AL: Quantification of angiogenesis in the CAM model
172
500 µm a
c
b
11 2
Fig. 2. Binary processing of capillary plexus images: (a) original RGB colour images at ×60 optical magnification,(b): histogram equalization of the green channel image, arrows indicate the capillary plexus, two order 1 andone order 2 vessels are also indicated, (c) binary processed image.
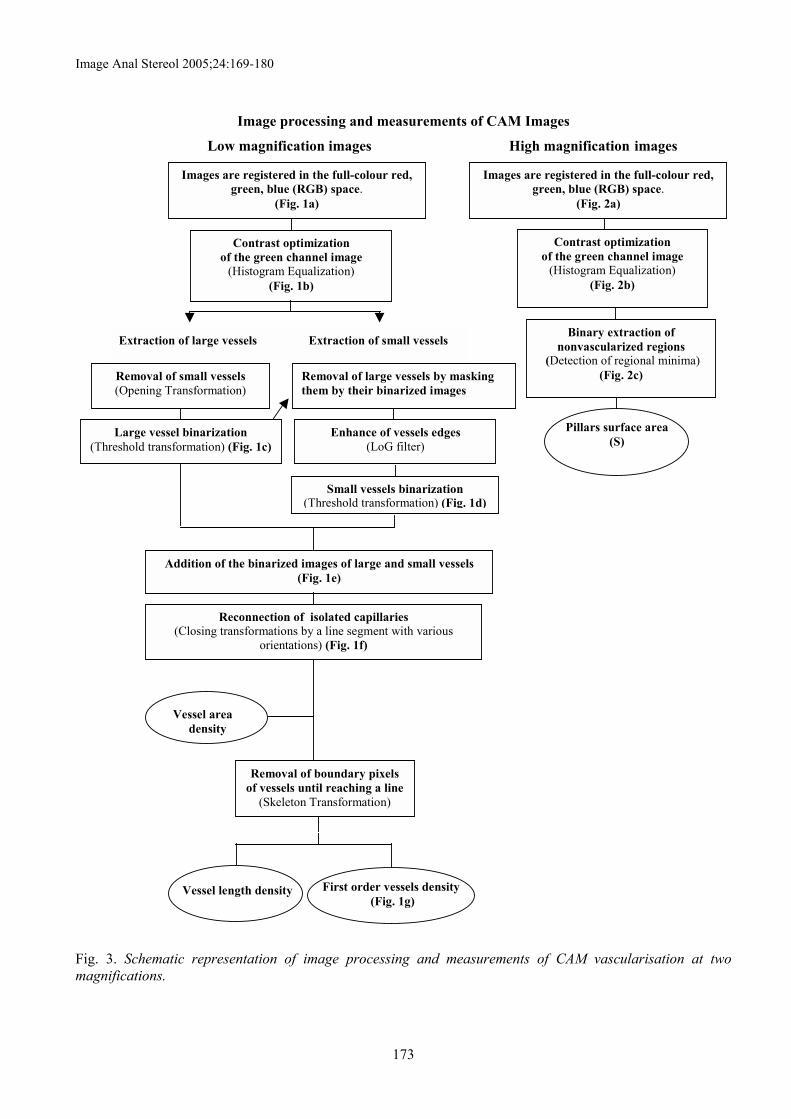
Image Anal Stereol 2005;24:169-180
173
Image processing and measurements of CAM Images
Low magnification images High magnification images
Extraction of small vesselsExtraction of large vessels
Removal of boundary pixelsof vessels until reaching a line
(Skeleton Transformation)
Reconnection of isolated capillaries(Closing transformations by a line segment with various
orientations) (Fig. 1f)
Addition of the binarized images of large and small vessels(Fig. 1e)
Images are registered in the full-colour red,green, blue (RGB) space.
(Fig. 1a)
Contrast optimizationof the green channel image
(Histogram Equalization)(Fig. 1b)
Removal of small vessels(Opening Transformation)
Large vessel binarization(Threshold transformation) (Fig. 1c)
Removal of large vessels by maskingthem by their binarized images
Enhance of vessels edges(LoG filter)
Small vessels binarization(Threshold transformation) (Fig. 1d)
Vessel areadensity
Vessel length density First order vessels density (Fig. 1g)
Binary extraction ofnonvascularized regions
(Detection of regional minima)(Fig. 2c)
Images are registered in the full-colour red,green, blue (RGB) space.
(Fig. 2a)
Contrast optimizationof the green channel image
(Histogram Equalization)(Fig. 2b)
Pillars surface area(S)
Fig. 3. Schematic representation of image processing and measurements of CAM vascularisation at twomagnifications.

BLACHER S ET AL: Quantification of angiogenesis in the CAM model
174
PROCESSING AND MEASUREMENTSOF VESSELS OBSERVED AT LOWOPTICAL MAGNIFICATIONImages are registered in the full-colour red, green
and blue (RGB) space (Fig. 1a). In this space, thevessels are the most contrasted and continuous in thegreen channel. However, non-linear effects introducedduring digitalisation prevent to distinguish smallvessels. In order to enhance the image contrast, thehistogram equalisation of the grey level intensities isperformed (Fig. 1b). At this low magnification (×24),a large set of vessels can be observed, and statisticallyrelevant results can be obtained. The first step consistsin applying a binary mask on the original grey levelimage in order to eliminate the capillary plexusbackground, which appears darker than vessels. Thebinary mask is obtained by performing a low-levelthreshold transformation of the original image. Binaryimage processing is performed by a two-step procedureconsisting in the successive extraction of large andsmall vessels (venules and arterioles) according to theintensity of the fluoresceinated Dextran injected intoCAM vessels. To extract large vessels, the small vesselsare first filtered out using an opening transformation.Then an automatic threshold technique, which consistsin selecting the threshold that maximises the globalaverage contrast of edges (Kohler, 1981) is applied(Fig. 1c).
To extract small vessels, large vessels are maskedusing as mask the inverse of the previously obtainedbinary image. Then, to detect small vessel edges, theconvolution of the image with a Laplacian of aGaussian blurring filter (LoG filter) (Marr and Hildreth,1980), is applied. This process is equivalent to takingthe difference between two Gaussian filters imageswith different standard deviation (DoG filter; Burtand Adelson, 1983). As vessels present a variety ofsizes, 5×5/3×3 and 3×3/1×1 kernels were considered.Finally, the image was thresholded assigning a valueof 1 to all pixels with positive grey level, and a value of0 to the others (Fig. 1d). After superposition of large andsmall vessel binary images (Fig. 1e), some isolatedcapillaries are reconnected to the vascular network, bycomputing the maximum of closing transformations bya line segment of 5 pixel (0.05 mm) long oriented inseveral directions from 0° to 180°. Finally everyisolated object smaller than an arbitrary size fixed at5 pixels (0.05 mm) is removed. Fig. 1f shows theresulting binary image after complete image processing.To characterize the obtained binary image, thefollowing global parameters are determined: (a) thevessels area density defined as the number of pixels
that belong to the vascular network on the imagedivided by the total area of the image, (b) the vessellength density per area defined as the number ofpixels that belong to the skeleton of the vascularnetwork on the image divided by the total area of theimage and (c) the first-order vessels density per area,defined as the number of vessel extremities dividedby the total area of the image.
End-points are determined from the skeleton ofthe binary image using the appropriate hit-or-misstransform (Coster and Chermant, 1985). Previously,artifacts (i.e., �prunes�) resulting from small distortionson the edges were eliminated from the skeleton. End-points corresponding to Fig. 1f are represented in Fig. 1g.
PROCESSING AND MEASUREMENTSOF THE NONVASCULARIZEDREGIONS OBSERVED AT HIGHEROPTICAL MAGNIFICATIONAt a higher magnification (×60), the structure of
the capillary plexus can be observed (Fig. 2b). In thisimage, nonvascularized regions correspond to regionalminima. As the grey levels of �holes� are not homo-geneous, minima are taken in a prefixed grey levelrange. After thresholding, nonvascularized regionsappear as white �grains� (Fig. 2c) and their surfacesize distribution is determined.
RESULTS
EVALUATION OF VASCULARCHANGES DURING NORMALGROWTH OF THE CAMThe CAM vasculature at 7 and 13 days of incu-
bation was first quantified from images obtained at×24 magnification. Representative resulting processedimages for those days are illustrated in Fig. 4. At day7, CAM vasculature is mainly characterized by largevessels with only few branching (Fig. 4a). Thehistogram equalization shows (Fig. 4b) that first ordervessels are thin, tortuous and merge in the capillaryplexus. At this point, the identification of the end-points is complex because the transition from a vesselto the capillary plexus is progressive. Such a problemof end-point determination has been already reportedby Strick et al. (1991) who called �blind-ended� thevessels that are connected to the capillary plexus. Onthe contrary, at day 13, a low magnification imagereveals the typical vessel hierarchy of CAM vasculature(Figs. 4d,e). At this stage, end-points are clearly definedand can be more easily determined. Fig. 4c and f show

Image Anal Stereol 2005;24:169-180
175
the resulting binary images from which the end-pointsdensity was determined.
Quantification at low magnification, i.e., at thevessel level, reveals that all the measured parametersincrease significantly from day 7 to day 13 (see Table 1).
Images taken at ×60 magnification (Figs. 5a andc) show clearly an evolution of capillary mesh duringthe CAM development. As the measured surfaces of
nonvascularized regions spread on a very large intervalfor both days 7 and 13, distribution are represented ina logarithm scale (Fig. 5e). Statistical parameters forthese distributions are presented in Table 2. AKolmogorov-Smirnov test (KS-test) indicates that thesurface distributions of the two populations differsignificantly. As the distributions are both grosslynon-normally-distributed, percentiles are used to givean idea of the centrality and spread. For the sake ofcompleteness the mean is also included in Table 2.
c
e f
ba
2 mm
d
2 mm
Fig. 4. Original color images taken at day 7 (a) and day 13 (d) of CAM development, at x24 magnification. (b,e): Histogram equalization of green channel images (a) and (d), respectively. (c, f): Binary processed imagesobtained from the original images (a) and (d), respectively.
Table 1. Vascular changes observed at low magnification (x24) between days 7 and 13 of the normaldevelopment of CAM and between control animals and after AGT inhibitor treatment.
Sample Vascular Areadensity
Vascular LengthDensity
(10-3 1/mm)
Vessel End-PointsDensity(1/mm2)
Normal growth (Day 7) 0.17 ± 0.03 0.14 ± 0.02 1.92 ± 0.16Normal growth (Day 13) 0.32 ± 0.07 0.30 ± 0.03 5.07 ± 0.80Control 0.29 ± 0.01 0.31 ± 0.04 5.84 ± 2.02AGT 0.24 ± 0.04 0.25 ± 0.03 3.09 ± 1.08
Table 2. Statistical parameters of capillary mesh surface distributions obtained at high magnification (x60) fordays 7 and 13 of the normal development of CAM and for control animals and after AGT inhibitor treatment.
Sample x25*(102µm2)
x50**(median)(102µm2)
x75***(102µm2)
Mean(102µm2) KS-test
Normal growth (Day 7) 2.786 4.830 10.077 10.457Normal growth (Day 13) 1.300 2.229 4.644 7.452 P < 0.05
Control 5.0155 9.102 16.718 14.336AGT 8.731 18.576 43.282 60.889 P < 0.05
*: 25th percentile; **: 50th percentile; ***: 75th percentile; KS-test: Kolmogorov-Smirnov test.

BLACHER S ET AL: Quantification of angiogenesis in the CAM model
176
0
0.05
0.1
0.15
0.2
0.25
1 102 103 104 105
Day 7Day 13
Log(Nonvascularized Surfaces ( µ m2))
e
a
500 µm
b
c
500 µm
d
Fig. 5. Capillary plexus images at ×60 magnification at day 7 (a), and day 13 (c) of CAM development.Corresponding binary images of the nonvascularized regions for day 7 (b) and day 13 (d). (e) Surface distributionof nonvascularized regions for days 7 and 13.

Image Anal Stereol 2005;24:169-180
177
0
0.05
0.1
0.15
0.2
102 103 104 105
AGTControl
Log(Nonvascularized Surfaces ( µ m2))
e
c d
a
500 µm
b
500 µm
Fig. 6. Capillary plexus images at ×60 magnification for control (a) and AGT-treated (b) animals. Correspondingbinary images of the nonvascularized regions for control (c), and AGT treated (d) animals. (e) Surface distributionof nonvascularized regions for control and AGT treated animals.

BLACHER S ET AL: Quantification of angiogenesis in the CAM model
178
A comparison of the three quartiles of the distributions,x0.25, x0.50 and x0.75, shows that the area of thenonvascularized regions at day 7 is approximatelytwo times larger that at day 13. Moreover, the inter-quartile range, x0.75 � x0.25, evolves from 7.29 102 µm2
at day 7 to 3.34 102 µm2 at day 13 indicating adecrease of the area dispersion. These observationsindicate that at day 7, the capillary plexus is aheterogeneous honeycomb-like structure composedof meshes with a broad size distribution. From day 7to 13, nonvascularized regions shrink in a way thatthe capillary network organization becomes morehomogeneous. This latter arrangement is characteristicof a mature CAM structure.
EVALUATION OF VASCULARCHANGES UPON AGT INHIBITORTREATMENTVascular changes were evaluated at low (x24)
and high (x60) magnifications on control animals andafter modulation by human angiotensinogen AGT.Measurements of the vessel surface area, length andend-points densities show a significantly decreaseafter treatment with AGT (see Table 1). These resultsare in agreement with previous manual measurements(Célérier et al., 2002). Representative high magni-fication images of the control and the treated animalsand the surface distributions of the non-vascularizedregions are shown in Figs. 6a,b. Statistical parametersare presented in Table 2. A KS-test indicates that thearea distributions of the two populations differsignificantly. The interquartile range increases from11.70 102 µm2 for the control to 34.55 102 µm2 for thetreated animal, for which the distribution spreadstowards the largest values (Table 2 and Fig. 6e). Thisindicates clearly that AGT treatment gives rise to amore heterogeneous capillary plexus than that observedin the control sample. The presence of the largestructures contributes strongly to the mean value that isfive times greater than the control counterpart. Themeasurements performed at low and high magni-fications show that the inhibitor affects the structureof the CAM both at vessel and capillary plexus levels.
DISCUSSION
The CAM assay is classically used in order tostudy in vivo the vasculature development and theeffects of pro- or anti-angiogenic agents. Objectiveassessment of useful angiogenic parameters is difficultto achieve. Quantifications on this model are usuallyperformed manually at low magnification by countingall or some order vessels. Since such a manual quanti-
fication means extremely tedious work, digital imageanalysis has been used to determine global parameters(surface and length vessel densities or the fractaldimension). In the present work, we propose anobjective method of quantification adapted to thevarious magnifications at which CAM vascular networkdevelopment can be observed. At low magnifications,global parameters such as vessel surface, vessel lengthand vessel end-points densities can be determined. End-points represent the connection between large vessels(first order vessel visualized at low magnification) andcapillary plexus (evidenced at high magnification).Consequently, they can be determined only if theused magnification is low enough not to detect thesmall capillary extensions that connect the first ordervessels to the capillary plexus.
The accuracy in the determination of the vesselsurface area, vessel length and end-points densitiesdepends not only on the magnification but also on thestage of CAM development. Indeed, at the early stageof growth (up to day 7), large vessels contribute mainlyto the surface and length densities. In this case, theused magnification must be low enough to consider ahomogeneous image, i.e., an image containing almostthe entirety of the CAM. If not, the results will dependon the particular region of the membrane arbitrarilychosen in which large vessels could be or not present.Similarly, end-points are not easily detected andquantified at the early stage of development. At thisstage, the first order vessels are hardly formed, i.e.,they are small and thin and merge in the plexus. At alater stage of CAM development (day 13) globalparameters mentioned above can be determined moreaccurately. However, the vessels are so well developedthat end-points evaluation is certainly distorted by three-dimensional effects.
On the contrary, the image processing of non-vascularized regions observed at high magnification ismore straightforward than the processing at vessel level.Indeed, its quantification accounts merely to detecton the images the black spots. In this work, the sizedistribution of nonvascularized regions was measured. Itshould be noted that since size distribution of thenonvascularized regions depends on experimentalcondition (state of CAM development, application of anangiogenic modulator), the used magnification allowingto observe the more potent structural modificationsmust be chosen according to the specific phenomenastudied.
The methodology proposed in this paper wasfirstly tested at two stages of the normal CAM growth(days 7 and 13). According to previous studies (Stricket al., 1991), these days are an important develop-

Image Anal Stereol 2005;24:169-180
179
mental window during which the ultimate vascularstructure is established. Both low and high opticalmagnification measurements indicated a transitionbetween immature and mature vasculature. Indeed,low magnification measurements show a growth ofvessel area, vessel length and end-points densitiesbetween days 7 and 13. This observation is consistentwith Strick et al. (1991) results. On the other hand,analysis at high magnification reveals that betweendays 7 and 13, the capillary plexus evolves from aheterogeneous structure towards homogeneous structureformed by small nonvascularized regions with thenarrowest size distribution.
From our studies on the effect of the AGTinhibitor on the CAM development, it appears that thevascular network observed at low and high resolution issignificantly modified. Indeed, global parameter valuesmeasured on treated animals are smaller than thosemeasured on animals non treated. This result is inagreement with previous works (Célérier et al., 2002).This behavior is accompanied by a modification ofthe structure of the capillary plexus that becomesmore heterogeneous. A comparison with the resultsobtained from measurements on the normal growth ofthe CAM, shows that angiogenic inhibitor AGT wouldhave a regressive effect on the natural growth.
ACKNOWLEDGMENTSThis work was supported by grants from the
Communauté française de Belgique (Actions deRecherches Concertées), the Commission of EuropeanCommunities (FP5 n° QLK3-CT02-02136, FP6N°LSHC-CT-2003-503297), the Fonds National de laRecherche Scientifique (FNRS, Belgium), theFédération Belge Contre le Cancer, the C.G.R.I.-F.N.R.S.-INSERM Coopération, the Fonds spéciauxde la Recherche (University of Liège), the FortisBanque Assurances, the D.G.T.R.E. from the �RégionWallonne�, the Interuniversity Attraction PolesProgramme - Belgian Science Policy (Brussels,Belgium). Dr. Yannick Anguy and Mr. Cédric Gommesare kindly acknowledged for their critical reading ofthe manuscript.
REFERENCESAuerbach R, Gilligan B, Lu LS, Wang SJ (1997). Cell
interactions in the mouse yolk sac: vasculogenesis andhematopoiesis. J Cell Physiol 173(2):202-5.
Auerbach R, Lewis R, Shinners B, Kubal L, Akhtar N(2003). Angiogenesis assays: a critical overview. ClinChem 49(1):32-40.
Auerbach R, Kubai L, Knighton D, Folkman J (1974). Asimple procedure for the long term cultivation ofchicken embryos. J Dev Biol 41(2):391-4.
Ausprunk DH, Folkman J (1997). Migration and proliferationof endothelial cells in preformed and newly formedblood vessels during tumor angiogenesis. MicrovascRes 14(1):53-65.
Burri PH, Tarek MR (1990). A novel mechanism of capillarygrowth in the rat pulmonary microcirculation. AnatRec 228(1):35-45.
Burt PJ, Adelson EH (1983). The Laplacian pyramid as acompact code. IEEE Trans Commun COMM 31:337-45.
Caduff JH, Fischer LC, Burri PH (1986). Scanning electronmicroscope study of the developing microvasculaturein the postnatal rat lung. Anat Rec 216(2):154-64.
Carmeliet P (2003). Angiogenesis in health and disease.Nat Med 6:653-60.
Carmeliet P, Collen D (2000). Molecular basis ofangiogenesis. Role of VEGF and VE-cadherin. Ann NY Acad Sci 902:249-62.
Célérier J, Cruz A, Lamandé N, Gasc JM, Corvol P (2002).Angiotensinogen and its cleaved derivatives inhibitangiogenesis. Hypertension 39(2):224-8.
Coster M, Chermant JL (1985). Précis d'analyse d'images.Paris: CNRS.
DeFouw DO, Rizzo VJ, Steinfeld R, Feinberg RN (1989).Mapping of the microcirculation in the chick chorio-allantoic membrane during normal angiogenesis.Microvasc Res 38(2): 36-47.
Dimitropoulou C, Malkusch W, Fait E, Maragoudakis ME,Konerding MA (1998). The vascular architecture of thechick chorioallantoic membrane: sequential quantitativeevaluation using corrosion casting. Angiogenesis 2:255-63.
Djonov V, Schmidt M, Tschanz SA, Burri PH (2000a).Intussusceptive angiogenesis: its role in embryonicvascular network formation. Circ Res 86(3):286-92.
Djonov VG, Galli A B, Burri PH (2000b). Intussusceptivearborization contributes to vascular tree formation inthe chick chorio-allantoic membrane. Anat Embryol202(5): 347-57.
Djonov V, Cresto N, Aebersold DM, Burri PH, AltermattHJ, Hristic M, et al. (2002). Tumor cell specificexpression of MMP-2 correlates with tumor vascu-larisation in breast cancer. Int J Oncol 21(1):25-30.
Drexler HCA, Risau W, Konerding M (2000) Inhibition ofproteasome function induces programmed cell death inproliferating endothelial cells. FASEB 66(14):65-77.
Fenton BM, Zweifach BW, Worthen DM (1979) Quantitativemorphometry of conjunctival microcirculation in diabetesmellitus. Microvasc Res 18(2):153-66.
Jakob W, Voss K (1984). Utilisation of images analysis forthe quantification of vascular reponses in the chickchorioallatoic membrane. Exp Path 26:23-99.
Kohler R (1981). A segmentation system based onthresholding. Computer Graphics and Image Processing.15:319-38.

BLACHER S ET AL: Quantification of angiogenesis in the CAM model
180
Kurz H, Wilting J, Sandau K, Christ B (1998). Automatedevaluation of angiogenic effects mediated by VEGFand PIGF homo- and heteropolimes. Microvasc Res55:92-102.
Marr D, Hildreth E (1980). Theory of edge detection.Proceeding of the Royal Society of London. B207:187-217.
Parsons-Wingerter P, Lwai B, Yang MC, Elliot KE, MilaniniaA, Redlitz A, et al. (1998). A novel assay of angiogenesisin the quail chorioallantoic membrane: Stimulation ofbFGF and inhibition by angiostatin according to fractaldimension and grid intersection. Microvasc Res 55:201-14.
Parsons-Wingerter P, Elliot KE, Farr AG, Radhakrihnan K,Clark JI, Sage EH (2000). General analysis reveals thatTGF-�1 inhibits the rate of angiogenesis in vivo byselective decrease in the number of vessels. MicrovascRes 59:221-32.
Patan S, Haenni B, Burri PH (1993). Evidence for intus-susceptive capillary growth in the chicken chorio-allantoic membrane (CAM). Anat Embryol 187(2):121-30.
Patan S, Haenni B, Burri PH (1996). Implementation ofintussusceptive microvascular growth in the chickenchorioallantoic membrane (CAM): 1. pillar formation
by folding of the capillary wall. Microvasc Res 51(1):80-98.
Pepper MS, Montesano R, Mandriota SJ, Orci L, VassalliJD (1996). Angiogenesis: a paradigm for balancedextracellular proteolysis during cell migration andmorphogenesis. Enzyme Protein 49(1-3):138-62.
Rieder MJ, O�Drobinak DM, Greene AS (1995). Acomputerized method for determination of microvasculardensity. Microvasc Res 49:180-9.
Sandau K, Kurtz H (1997). Measuring fractal dimension andcomplexity- an alternative approach with an application. Jof Micr 186:164-76.
Soille P (1999). Morphological image analysis. Berlin,Heidelberg, New-York: Springer-Verlag.
Strick DM, Waycaster RL, Montani JP, Gay WJ, Adair TH(1991). Morphometric measurements of chorioallantoicmembrane vascularity: effects of hypoxia and hyperoxia.Am J Physiol 260(4):1385-9.
Vico PG, Kyriacos S, Heymans O, Louryans S, Cartilier L(1988). Dynamic Study of the �Extraembrionic vascularnetwork of the chick embryo by fractal analysis�. J TheorBiol 195:525-32.
Voss K, Jakob W, Roth K (1984). A new image analysismethod for the quantification of neovascularisation.Exp Path 26:155-61.