IMAGE ANALYSIS BASED CONTROL OF COPPER … · Kaartinen Jani*, Hätönen Jari**, Larinkari Martti*,...
6
IMAGE ANALYSIS BASED CONTROL OF COPPER FLOTATION Kaartinen Jani*, Hätönen Jari**, Larinkari Martti*, Hyötyniemi Heikki*, Jorma Miettunen*** *Helsinki University of Technology, Control Engineering Laboratory P.O.Box 5500, 02015 HUT, Finland E-mail: [email protected], [email protected], [email protected] **The Sheffield University, Department of Automatic Control and Systems Engineering Mappin Street S1 3ID, United Kingdom E-mail: [email protected] *** Pyhäsalmi Mine Oy, Pyhäsalmi, Finland E-mail: [email protected] Abstract: This paper presents recent results and experiences of using real-time image analysis in the control of copper flotation at the Pyhäsalmi Mine Oy (Finland). First we introduce our measurement set-up and the image variables it produces. After that the image variables are correlated against process variables using Partial Least Squares and clustering. The results show that some of the process disturbances are seen 30-40 minutes earlier in specific image variables when compared to the on-stream X-ray analyses. Furthermore, the image variables help in deducing what has caused the process disturbance and what should be the corrective action. Hence the most important image variables were added into the rule-based controller of the cleaner bank. Comparison results then show that this addition of information helps us to run the process near its optimum in a reliable fashion. Copyright © 2005 IFAC Keywords: process control, product quality, image analysis, classification, closed loop control, statistical analysis. 1. INTRODUCTION The possibility of using image analysis in the control of mineral flotation has aroused a lot of interest in the mineral engineering community (see (Cipriano et al. 1998), (Moolman et al. 1995) and (Symonds et al. 1995) to name a few). Most of the research so far has merely concentrated to either derive new image processing algorithms to calculate certain features from the froth images or to analyse the correlations between some image variables and process variables. However, the ultimate goal should be to use the additional information from the image variables to improve the control of the flotation process. In order to reach this goal a European Union funded research project ChaCo (The Characterisation of Flotation Froth Structure and Colour by Machine Vision) was launched in 1997. The project ended in April 2000, and as a result of the project a real-time image analyser was implemented at the Pyhäsalmi mine (Finland) in the rougher bank of the zinc flotation circuit. The data analysis performed during the project showed that some of the image variables could be used to detect process anomalies earlier than with the X-ray on-stream analysis (some of the results are reported in (Hätönen 1999) and (Hasu 1999)). Hence the most important image variables were added to the control logic of the rougher bank. Experimental validation showed that the new image based controller increases recovery of the zinc circuit, resulting in approximately 300 k€/year profit for the mine (Miettunen et al. 2001). The purpose of this paper is to investigate if a similar approach can be adopted to the copper flotation circuit of the Pyhäsalmi mine. The structure of the paper is the following: In the next section a general description of the measurement set-up is given. After that a new image analysis algorithm for calculating
Transcript of IMAGE ANALYSIS BASED CONTROL OF COPPER … · Kaartinen Jani*, Hätönen Jari**, Larinkari Martti*,...
IMAGE ANALYSIS BASED CONTROL OF COPPER FLOTATION
Kaartinen Jani*, Hätönen Jari**, Larinkari Martti*, Hyötyniemi Heikki*, Jorma Miettunen***
*Helsinki University of Technology, Control Engineering Laboratory P.O.Box 5500, 02015 HUT, Finland
E-mail: [email protected], [email protected], [email protected]
**The Sheffield University, Department of Automatic Control and Systems Engineering Mappin Street S1 3ID, United Kingdom
E-mail: [email protected]
*** Pyhäsalmi Mine Oy, Pyhäsalmi, Finland E-mail: [email protected]
Abstract: This paper presents recent results and experiences of using real-time image analysis in the control of copper flotation at the Pyhäsalmi Mine Oy (Finland). First we introduce our measurement set-up and the image variables it produces. After that the image variables are correlated against process variables using Partial Least Squares and clustering. The results show that some of the process disturbances are seen 30-40 minutes earlier in specific image variables when compared to the on-stream X-ray analyses. Furthermore, the image variables help in deducing what has caused the process disturbance and what should be the corrective action. Hence the most important image variables were added into the rule-based controller of the cleaner bank. Comparison results then show that this addition of information helps us to run the process near its optimum in a reliable fashion. Copyright © 2005 IFAC Keywords: process control, product quality, image analysis, classification, closed loop control, statistical analysis.
1. INTRODUCTION
The possibility of using image analysis in the control of mineral flotation has aroused a lot of interest in the mineral engineering community (see (Cipriano et al. 1998), (Moolman et al. 1995) and (Symonds et al. 1995) to name a few). Most of the research so far has merely concentrated to either derive new image processing algorithms to calculate certain features from the froth images or to analyse the correlations between some image variables and process variables. However, the ultimate goal should be to use the additional information from the image variables to improve the control of the flotation process. In order to reach this goal a European Union funded research project ChaCo (The Characterisation of Flotation Froth Structure and Colour by Machine Vision) was launched in 1997. The project ended in April 2000, and as a result of the project a real-time
image analyser was implemented at the Pyhäsalmi mine (Finland) in the rougher bank of the zinc flotation circuit. The data analysis performed during the project showed that some of the image variables could be used to detect process anomalies earlier than with the X-ray on-stream analysis (some of the results are reported in (Hätönen 1999) and (Hasu 1999)). Hence the most important image variables were added to the control logic of the rougher bank. Experimental validation showed that the new image based controller increases recovery of the zinc circuit, resulting in approximately 300 k€/year profit for the mine (Miettunen et al. 2001). The purpose of this paper is to investigate if a similar approach can be adopted to the copper flotation circuit of the Pyhäsalmi mine. The structure of the paper is the following: In the next section a general description of the measurement set-up is given. After that a new image analysis algorithm for calculating

the mineral load of the copper froth is given. The next step is to analyse the correlations found between the image and process variables using Partial Least Squares (PLS) and clustering. In the following section the new control logic that also uses the image variables is presented followed by a section on experimental control performance evaluation. The final section includes conclusions and suggestions for future research work.
2. IMAGE ANALYSIS SETUP The basic structure of the measurement set-up implemented at the Pyhäsalmi concentrator is shown in Fig. 1. It consists of a measuring hood attached on top of the zinc-flotation cell and a computer located next to the hood (Kaartinen 2000). In the hood there are a RGB-colour camera and a spectrophotometer. The spectrophotometer is connected to the computer next to the flotation cell whereas the RGB-camera is connected to a control room computer, which performs the image processing. The two measuring compartments are separated with a wall inside the hood and they also have their own (continuously adjustable) light sources.
Fig. 1. The set-up of the on-line flotation froth
analyser The camera inside the hood is adjusted so that imaging geometry is perpendicular and the illuminating 500W incandescent halogen lamp is as close to the camera as possible making the illumination geometry almost perpendicular (see Figs. 2 and 3). This guarantees that each bubble has only one bright spot (i.e. a total reflectance point), which is a very useful property for segmentation algorithms because they can use this bright spot as a starting point for the segmentation.
Fig. 2. The actual system running in Pyhäsalmi
concentrator
Fig. 3. Top view of the image analyzer The measurement setup is connected to the concentrator’s automation system and can also be accessed remotely by using a secured TCP/IP connection. The measurements are currently done by using the RGB-colour camera. The spectro-photometer was only used to give additional insight to colour measurements. Each grabbed froth image is saved into an image database, which contains a 24-hour froth image history. The operators and plant engineers can access the database from the automation system. Thus they can, for example, check how the froth appearance changes after they have made a corrective action in the levels of flotation reagents. The database also helps the operators to learn how the actual numbers given by the image processing algorithms are related to the current appearance of the froth. 3. INTRODUCTION OF THE LOAD VARIABLE
During the course of the project each of the authors saw thousands of froth images from the copper rougher cell. A striking feature of these images seemed to be that by visual inspection it was very

easy to detect bubbles that had a thick mineral cover from bubbles having a very thin mineral cover (usually referred as a wet bubble at the concentrator). Furthermore the main indicator of a bubble having a very thin mineral load was the fact that it seemed much more transparent than a bubble having a high load of minerals (see Figs. 4 and 5 for an example of an extremely stiff (or dry) and a wet froth). It was also fair to expect that the information of the amount of transparent bubbles should characterise somehow the efficiency of the current flotation control policy. However, there seemed to be no evident way of transforming this visual sensation to a numerical algorithm.
Fig.4. Stiff froth
Fig.5. Wet froth Fortunately, by doing experiments with the illumination intensity, it was noticed that if a suitable level of illumination is used, the transparent bubbles have a very distinctive total reflectance point. In this case the intensity level of each channel R (red), G (green) and B (blue) goes up to the maximum level (255) whereas the bubbles having a good load of minerals produce “total reflectance points” having much smaller intensity values. Thus the numerical algorithm for detecting the transparent bubbles was implemented by utilising the following three steps:
1. Go through each pixel of the froth image. If the value of the pixel is equal to (255,255,255) then mark this pixel as wet pixel.
2. By using the labelled image from the segmentation algorithm check which
bubbles have wet pixels. Mark these bubbles as wet bubbles.
3. Calculate the total number of pixels that are classified as belonging to wet bubbles. Divide this number with the total number of pixels in the image and multiply it with 100%. This number (which takes values between 0% and 100%) is the outcome of the algorithm, which we call as the load variable.
In other words the outcome of the algorithm is the area of the froth image covered with wet bubbles in percentages (i.e. the higher is the value of the load variable, there is an increased number of bubbles having a low mineral load on them).
3. PLS AND CLUSTER ANALYSIS OF THE DATA
. After installing the camera-setup into the copper circuit, a data collection campaign lasting several months was carried out. The following image variables were recorded: speed of the froth, bubble collapse rate, bubble size distribution, froth load, colour of the froth (RGB). The data analysis on this data was concentrated on finding a connection between image variables and X-ray analysis of the zinc concentration in the final copper product. This was due to the fact that plant had experienced problems in minimising the zinc concentration in the final copper product. Note that after the copper flotation the next phase is zinc flotation, and therefore any zinc in the copper product will decrease the overall zinc recovery. The initial data analysis was carried out by using PLS. This analysis consisted of the following steps:
1. Divide the data into one week teaching data and one week validation data sets.
2. Remove any outliers in the image or concentration data by using median filtering.
3. Scale both image data and concentration data to zero mean and unity variance.
4. Fit the image data into the concentration data for a range of time lags using a PLS model. The best model in terms of squared errors is selected to be the final model. This model is validated with the validation data.
The PLS model structure was chosen because it is known to cope well with collinearity. Quite surprisingly, the analysis pointed out that image variables indicate changes in the zinc concentration in the copper product 30-40 minutes earlier than the X-ray analysis. Fig. 6 shows the fit for the teaching data, which is reasonable. Fig. 7, on the other hand, shows the fit for the validation data, which shows noticeable uncertainty in the prediction. Therefore the predicted concentration from the PLS analysis cannot be used directly in the controller that

minimises the zinc (Zn) concentration in the final copper product. To overcome the uncertainty in the PLS prediction, the next step was to use cluster analysis. As a starting point the “loadings” of the PLS model were analysed, and they pointed that froth load and bubble collapse rate are the most important variables in the PLS model. After that the zinc concentration was divided into three classes, namely “bad”, “neutral” and “good”, where “good” is zinc concentration less than 1.75%, “neutral” contains the range 1.75% - 2.5% and “bad” concentrations over 2.5%. These concentrations were defined by the plant engineers. After that, taking into account the 30-40 minute delay, the image variables were classified into the same classes as the corresponding lagged zinc concentration. The final step was to plot the image data on the bubble collapse rate – froth load plane, and use different colours to represent if a particular point belongs to the “bad” or “good” class. Fig. 8 shows graphically the end result of the clustering. From this figure it is clear the “bad” and the “good” froth classes are separated reasonably well in the bubble collapse rate – froth load plane. This property is used in the following section to design a new controller that uses real-information from the image variables to minimise zinc concentration in the copper product.
Fig. 6. The predicted and measured Zn concentration
with the teaching data
Fig. 7. The predicted and measured Zn concentration
with the validation data
Fig. 8. Cluster analysis of data
4. IMPLEMENTATION OF THE CONTROLLER
As is shown in Fig. 8, the “bad” and the “good” froth classes are separated reasonably well in the bubble collapse rate – froth load plane. This motivates a control philosophy where the process is prevented from entering the square shown in the bottom left-hand corner. Consequently the rule “IF load > 62 AND bubble collapse rate < 4.5 THEN make a corrective action to reduce Zn%“ should minimise the amount of zinc that is wasted into the final copper product. Utilising both step change experiments and operator experience it was found out that most effective corrective action was to increase the cyanide set-point for the cleaner bank. This new rule was added into the current controller that tries to minimise zinc concentration in the final copper product. The controller is implemented by using rule-based controller software that was available in the automation system of the plant. As was pointed out in the previous section, the image variables seem to be able to predict changes in the X-ray analysis 30-40 minutes in advance. Hence by the virtue of the new rule, the new controller should be able to react 30-40 minutes earlier to disturbances in the cleaner bank. The next section shows that preliminary experimental comparisons support this conjecture.
5. CONTROLLER PERFORMANCE EVALUATION
In order to compare the results between the previous and the new controller, Fig. 9 and Fig. 10 show the histograms of zinc concentration in the copper product for two one-week data sets. During the first data set the old controller was used whereas during the second data set the new controller was employed. The graphs show clearly how the new rule decreases
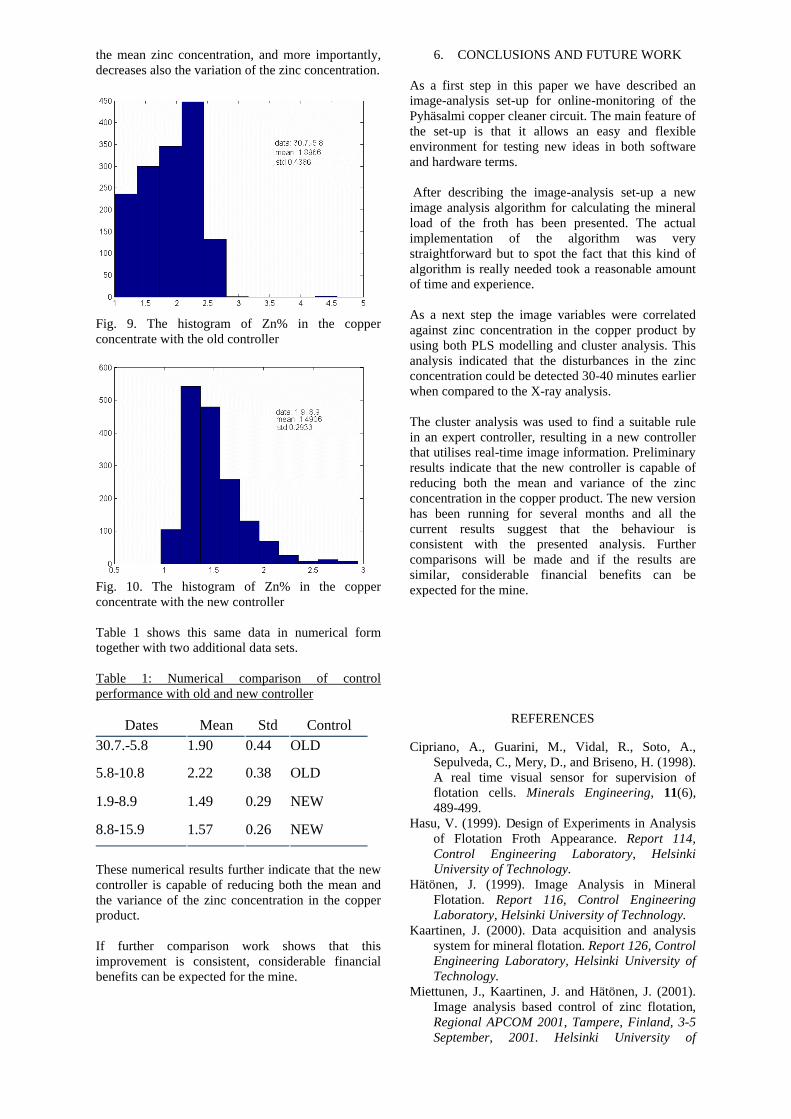
the mean zinc concentration, and more importantly, decreases also the variation of the zinc concentration.
Fig. 9. The histogram of Zn% in the copper concentrate with the old controller
Fig. 10. The histogram of Zn% in the copper concentrate with the new controller Table 1 shows this same data in numerical form together with two additional data sets. Table 1: Numerical comparison of control performance with old and new controller
Dates Mean Std Control 30.7.-5.8 1.90 0.44 OLD
5.8-10.8 2.22 0.38 OLD
1.9-8.9 1.49 0.29 NEW
8.8-15.9 1.57 0.26 NEW
These numerical results further indicate that the new controller is capable of reducing both the mean and the variance of the zinc concentration in the copper product. If further comparison work shows that this improvement is consistent, considerable financial benefits can be expected for the mine.
6. CONCLUSIONS AND FUTURE WORK As a first step in this paper we have described an image-analysis set-up for online-monitoring of the Pyhäsalmi copper cleaner circuit. The main feature of the set-up is that it allows an easy and flexible environment for testing new ideas in both software and hardware terms. After describing the image-analysis set-up a new image analysis algorithm for calculating the mineral load of the froth has been presented. The actual implementation of the algorithm was very straightforward but to spot the fact that this kind of algorithm is really needed took a reasonable amount of time and experience. As a next step the image variables were correlated against zinc concentration in the copper product by using both PLS modelling and cluster analysis. This analysis indicated that the disturbances in the zinc concentration could be detected 30-40 minutes earlier when compared to the X-ray analysis. The cluster analysis was used to find a suitable rule in an expert controller, resulting in a new controller that utilises real-time image information. Preliminary results indicate that the new controller is capable of reducing both the mean and variance of the zinc concentration in the copper product. The new version has been running for several months and all the current results suggest that the behaviour is consistent with the presented analysis. Further comparisons will be made and if the results are similar, considerable financial benefits can be expected for the mine.
REFERENCES
Cipriano, A., Guarini, M., Vidal, R., Soto, A.,
Sepulveda, C., Mery, D., and Briseno, H. (1998). A real time visual sensor for supervision of flotation cells. Minerals Engineering, 11(6), 489-499.
Hasu, V. (1999). Design of Experiments in Analysis of Flotation Froth Appearance. Report 114, Control Engineering Laboratory, Helsinki University of Technology.
Hätönen, J. (1999). Image Analysis in Mineral Flotation. Report 116, Control Engineering Laboratory, Helsinki University of Technology.
Kaartinen, J. (2000). Data acquisition and analysis system for mineral flotation. Report 126, Control Engineering Laboratory, Helsinki University of Technology.
Miettunen, J., Kaartinen, J. and Hätönen, J. (2001). Image analysis based control of zinc flotation, Regional APCOM 2001, Tampere, Finland, 3-5 September, 2001. Helsinki University of

Technology, Rock Engineering, Finland 2001, Helsinki University of Technology, pp. 267-275.
Moolman, D. W., Aldrich, C., van Deventer, J. S. J., and Bradshaw, D. B. (1995). The interpretation of flotation froth surfaces by using digital image analysis and neural networks. Chem. Eng. Sci. , 50(22), 3501-3513.
Symonds, P.J. and De Jaeger, G. (1992). A technique for automatically segmenting images of the surface froth structures that are prevalent in industrial flotation cells. In Proceedings of the 1992 South African Symposium on Communications and Signal Processing, Rondebosch,111-115.